
Back to Journals » International Journal of General Medicine » Volume 18
Predicting Preoperative Deep Vein Thrombosis in Elderly Hip Fracture Patients Using an Interpretable Machine Learning Model
Authors Cheng Q, Liu Y, Zhu P, Cai W, Shi L
Received 3 July 2025
Accepted for publication 26 November 2025
Published 4 December 2025 Volume 2025:18 Pages 7271—7283
DOI https://doi.org/10.2147/IJGM.S551225
Checked for plagiarism Yes
Review by Single anonymous peer review
Peer reviewer comments 2
Editor who approved publication: Dr Redoy Ranjan
Qi Cheng,1,2,* Yuan Liu,1,* Pengfei Zhu,1 Weiming Cai,1 Lijie Shi3
1Department of Orthopedics, Jingjiang People’s Hospital Affiliated to Yangzhou University, Taizhou, People’s Republic of China; 2Department of Orthopaedics, the First Affiliated Hospital of Wannan Medical College, Yijishan Hospital, Wuhu, People’s Republic of China; 3Department of Geriatrics, Jingjiang People’s Hospital Affiliated to Yangzhou University, Taizhou, People’s Republic of China
*These authors contributed equally to this work and share first authorship
Correspondence: Lijie Shi, Email [email protected]
Objective: Deep vein thrombosis (DVT) frequently occurs in the lower extremities of elderly hip - fracture patients. This study aims to develop an interpretable machine - learning model for predicting preoperative DVT risk in these patients and use the SHapley Additive exPlanations (SHAP) method to explain the model and identify significant factors.
Methods: A total of 976 patients (38 variables) were included. The dataset was randomly split into a training set (N = 683) and a validation set (N = 293). The Synthetic Minority Over - sampling Technique (SMOTE) was used to balance the training set. Logistic Regression (LR), Random Forest (RF), and Adaptive Boosting (AdaBoost) were applied to select influential factors, and Venn analysis was used to identify key variables. Five machine - learning techniques, including Extreme Gradient Boosting (XGBoost), were used to develop a predictive model. The performance of various models was evaluated to find the optimal algorithm, and the SHAP method was used for interpretation.
Results: A total of eight variables were selected as inputs for the predictive model. The XGBoost model achieved the highest performance on the training set data, with an Area Under the Curve (AUC), accuracy, sensitivity, specificity, positive predictive value, negative predictive value, and F1 score of 0.975, 0.923, 0.936, 0.910, 0.909, 0.939, and 0.922, respectively. Furthermore, the calibration curve demonstrated a high level of agreement between the predicted probabilities and the observed risks, while the decision curve revealed that the XGBoost model had a higher net benefit compared to other machine learning models. Additionally, the use of the SHAP tool facilitated the interpretation of both the features and individual predictions.
Conclusion: Interpretable predictive models can help implement timely interventions and assist physicians in accurately predicting preoperative DVT risk in elderly hip - fracture patients.
Keywords: deep vein thrombosis, machine learning, hip fracture, SHapley Additive exPlanation
Introduction
Hip fractures comprise one of the most prevalent fractures among the elderly population. As the global population ages at an accelerating pace, the prevalence of hip fractures among the elderly has been gradually increasing, resulting in a substantial global public health concern.1 Consequently, the annual incidence of hip fractures worldwide is projected to increase from 1.6 million in 2000 to a minimum of 4.5 million by 2050. Hip fractures represent a potentially catastrophic event for patients.2,3 Following injury, approximately 30% of patients die within the first year, while those that survive face a considerable disease burden affecting their future quality of life. Accordingly, socioeconomic costs related to hip fractures are estimated to represent 0.1% of the global disease burden and 1.4% in developed market economies.4
Deep vein thrombosis (DVT), a primary manifestation of venous thromboembolism (VTE), is a prevalent preoperative complication of hip fractures that results in a blood clot in a deep vein, usually in the leg of affected patients.5–7 Lower limb DVT is typically characterized by pain, swelling, and increased soft tissue tension in the affected limb. After detachment, lower limb DVT may migrate to the pulmonary artery and induce pulmonary embolism (PE), which poses a life-threatening risk to patients.8,9 Song et al found in a previous study that two - thirds of the patients diagnosed with postoperative DVT already had thrombi before surgery.6 Research has shown that the incidence of pulmonary embolism is approximately 1.5% among patients with lower - limb DVT formation.10 In elderly patients with hip fractures, preoperative DVT may result in surgical delays, significantly elevated postoperative mortality and complication rates, and adverse effects on patient prognosis.9,11 Thus, establishing a predictive model that can identify high-risk patients and predict DVT is likely to aid clinicians in implementing preventive measures to reduce the incidence of DVT.
Machine learning is a subfield of artificial intelligence that employs mathematical algorithms to identify and categorize structures in heterogeneous data for the purpose of decision-making.12 In recent years, machine learning (ML) algorithms have been increasingly used to predict the risk of diseases and disease-related complications. Accordingly, machine learning has been employed in the development of accurate DVT risk prediction models for specific populations in numerous studies, which have demonstrated exceptional performance. Nevertheless, studies that have utilized machine learning to develop preoperative DVT prediction models for hip fracture patients have been largely limited.13–17 Although machine learning models exhibit exceptional performance, their black-box nature (ie, the absence of transparency in the process between input data and decision output) restricts their applicability in specific areas.18,19 Thus, understanding the process by which these models make decisions, as well as the rationale behind them, is crucial to ensure their effective implementation in clinical practice. Accordingly, algorithms that elucidate machine learning models have emerged in recent years, thereby enhancing the trust and understanding of clinicians in these models.20
In the present study, an interpretable machine learning model was developed in order to predict preoperative deep vein thrombosis in elderly hip fracture patients. Additionally, the SHapley Additive exPlanations (SHAP) method was employed to explain the machine learning model utilized.
Methods
Study Population
Due to the retrospective nature of the study, the Institutional Review Board of Yijishan Hospital waived the need of obtaining informed consent. Hip fracture patients admitted at the First Affiliated Hospital of Wannan Medical College were retrospectively analyzed from January 2019 to April 2023 in the current study. The inclusion criteria comprised the following: (1) patients who were 60 years of age or older; (2) patients diagnosed with a hip fracture; (3) patients having complete clinical data. The exclusion criteria comprised the following: (1) patients with multiple fractures, open fractures, or pathological fractures; (2) patients with a history of hip joint surgery; (3) patients with a history of thrombosis; (4) patients with the presence of hematologic disorders or current use of anticoagulants; (5) patients that had an admission period lasting more than fourteen days following injury. Figure 1 illustrates the flowchart of the study cohort selection process.
 |
Figure 1 Flowchart illustrating the patient selection process. |
Independent Variables
A total of 42 clinical features were collected, excluding those with missing values exceeding 20%. Overall, a total of 38 variables were classified into the following categories: (1) Demographic data: These included age, gender, smoking habits, alcohol consumption, presence of hypertension, diabetes, cardiovascular disease, cerebrovascular disease, and history of tumors; (2) Fracture-related data: These included information about the type of fracture, the mechanism of injury, the injured side, the time elapsed from the injury to admission, the patient’s activities of daily living, and the Caprini thrombosis risk assessment; (3) Preoperative biochemical parameters: These included albumin, alanine aminotransferase, blood urea nitrogen, creatinine, total cholesterol, triglycerides, C-reactive protein, and erythrocyte sedimentation rate; (4) Preoperative standard blood parameters: These included the quantification of red blood cells, hemoglobin, white blood cells, platelets, as well as absolute neutrophil count and absolute lymphocyte count; (5) Preoperative coagulation parameters: These included the assessment of prothrombin time, international normalized ratio, prothrombin time activity, activated partial thromboplastin time, thrombin time, fibrinogen, fibrinogen degradation products, D-dimer, and antithrombin.
Data Preprocessing
For variables that have less than 20% missing values, analysis of the corresponding data without accounting for missing values may result in biased results. As a result, multiple imputation was used to address missing data in the current study.21 In this study, we employed an imputation model based on predictive mean matching. PMM is a commonly used imputation method that can preserve the distribution characteristics of the original data and avoid biases arising from assumptions in parametric models. It selects the closest sample value from the observed data based on the predicted value as the imputation value, ensuring that the statistical properties of the imputed data are similar to those of the original data. After multiple simulations, we found that the standard errors of parameter estimates were basically stable when the imputation was performed 20 times. Therefore, we determined the number of imputations to be 20. Correspondingly, the outliers that persisted after verifying the data source were considered to be the missing values. Subsequently, the StandardScaler was used for standardization. Herein, the average of the data features that were processed by StandardScaler was observed to be 0, while the standard deviation from the mean was observed to be 1. Subsequently, the samples were randomly allocated into training and validation sets using a 7:3 ratio. The workflow of the proposed approach in this study is illustrated in Figure 2.
 |
Figure 2 Flowchart illustrating the methodology used in the current study. |
Data Balance
The ratio between the thrombosis group and the non-thrombosis group was roughly 1:7, suggesting an uneven distribution of data. Earlier studies indicate that the use of unevenly distributed data can cause the classification boundary to favor the minority class, leading to reduced sensitivity and increased specificity during model fitting.22 In order to address this issue, the Synthetic Minority Over-sampling Technique (SMOTE) algorithm was used in the current study to equalize the distribution of data in the training set. Accordingly, 527 new data points were generated for the thrombosis group to achieve a rough equilibrium between the non-thrombosis and thrombosis groups.
Weighting and Selection of Analytical Variables
Variable selection, which involves analyzing the dataset and selecting the most important variables, is a critical aspect in predictive problems, as it determines the significance (weight) of variables by ranking them. The most common methods for ranking importance can be primarily divided into two categories: (1) Those that rely on model coefficients, and (2) those that rely on model performance (such as using univariate feature ranking for importance analysis).23 Herein, the first category method (based on model coefficients) was employed to analyze the importance of variables. Accordingly, machine learning algorithms were utilized to prioritize variables, and significant features were subsequently extracted following an initial screening. Accordingly, three machine learning methods —LR, RF, and Adaboost—were utilized to rank the importance of features.
Comparison of Different Machine Learning Algorithms
In the training set, a total of five machine learning models, including XGBoost, SVM, MLP, AdaBoost, and LR, were used to develop the prediction model. Herein, the model’s performance was optimized by adjusting each classifier and optimizing the hyperparameters during the model construction process. The predictive performance of each model was assessed by calculating the area under the receiver operating characteristic curve. Moreover, the accuracy, sensitivity, specificity, positive predictive value, negative predictive value, and F1 score of the models were also calculated. Since calibration curves closer to the ideal line indicate better calibration capability of predictive models, the correlation between the predicted probabilities of the model and the actual observed results was evaluated using calibration curves in the present study.24 Furthermore, the practicality of the model’s decision-making utility was assessed through decision curve analysis (DCA), which quantified the net benefit at various threshold probabilities.25 Subsequently, the machine learning algorithm with the highest performance was selected on the basis of these results.
Model Evaluation
Based on the optimal machine learning algorithm, the predictive model for preoperative DVT occurrence in elderly hip fracture patients was constructed in the current study. Subsequently, the model was evaluated using the validation set data, and calibration curves were generated to assess the consistency of the predicted results with the actual results. In addition, the model’s utility was evaluated through DCA.
Model Interpretability
SHAP values can demonstrate the positive or negative contribution of each predictive variable to the target variable.26 As a result, the SHAP method was employed to interpret the predictive model in the current study, thus, accurately reflecting the contribution of each feature to the final prediction. Additionally, each observation in the dataset was be accounted for by a specific set of values.
Statistical Analysis
Herein, qualitative variables were represented as ratios or constituent ratios. On the other hand, the Kolmogorov–Smirnov test was used to assess the normality of the quantitative variables. Variables that adhered to the normal distribution were presented as the mean (±SD), while variables that did not fit the normal distribution were presented as the median (25th percentile [P25] to 75th percentile [P75]). In addition, the machine learning models were constructed using Python (version 3.8.0; Python Software Foundation) while R (version 4.2.0; R Foundation) was used to carry out the statistical analyses.
Results
Patient Characteristics
The present study comprised 976 elderly hip fracture patients, who were divided into a thrombus group (N = 117) and a non-thrombus group (N = 859) based on preoperative Doppler ultrasound examination data. The incidence rates were consistent with those of previous studies conducted in Asia. Table 1 illustrates a comparison of predictive variables between the thrombus and non-thrombus groups.
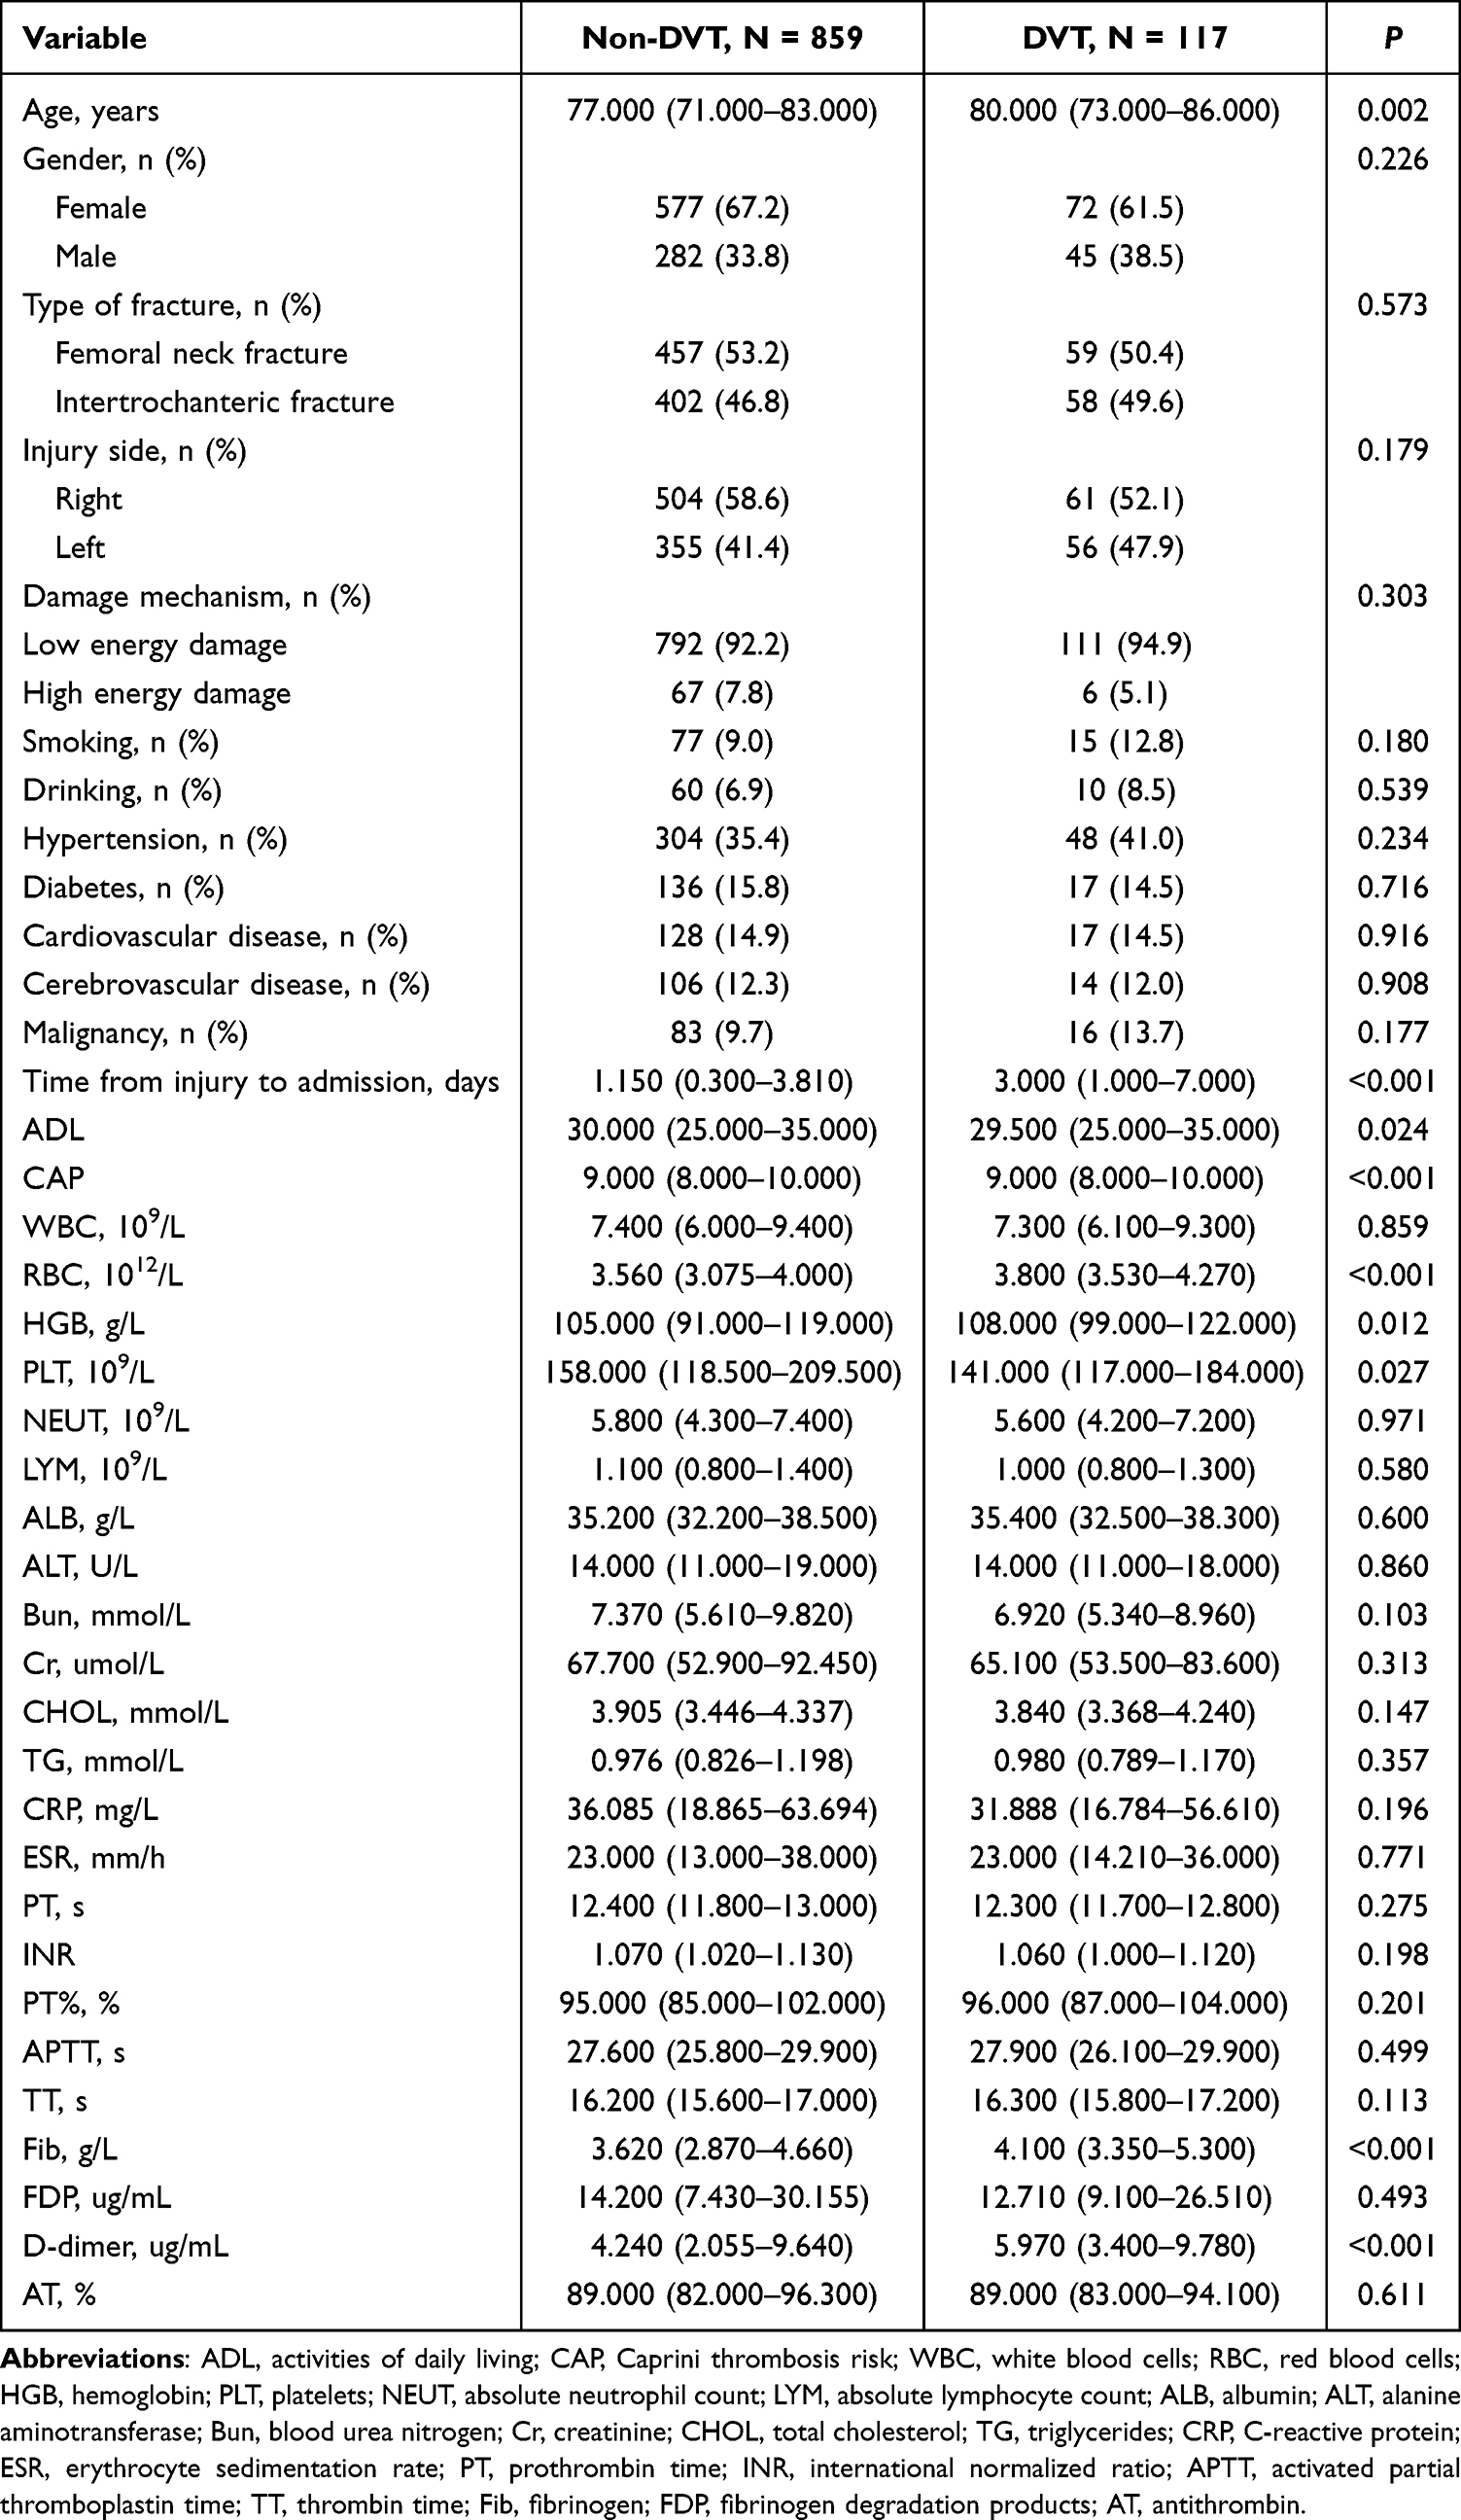 |
Table 1 Patient Demographics and Baseline Characteristics |
Feature Variable Selection
Following optimization using the machine learning algorithms LR (Figure 3A), Adaboost (Figure 3B), and RF (Figure 3C), the feature variables were processed in the current study. Each algorithm was employed to determine the ten most significant feature variables in its model. Subsequently, a comprehensive analysis using a Venn diagram resulted in the identification of eight variables (D-dimer, fibrinogen, platelet count, red blood cell count, activities of daily living, Caprini thrombosis risk assessment, time from injury to admission, and age) that were necessary for constructing the model (Figure 3D).
 |
Figure 3 Results of the LR (A), Adaboost (B) and RF (C) machine learning algorithms filter the top 10 important variables. The results are expressed by the coefficient values. (D) Venn analysis of the results of the above three machine algorithms. |
Modeling and Parameter Tuning
After the optimal predictive variables were determined in the current study, the XGBoost, SVM, MLP, AdaBoost, and LR models were constructed using the training set. The corresponding AUC values were 0.975, 0.582, 0.713, 0.947, and 0.780, respectively (Figure 4A). The hyperparameters that were adjusted in the five classifiers are listed in Table 2. Among these five models, XGBoost demonstrated the most significant predictive performance in terms of relative value (AUC = 0.975, 95% CI 0.957–0.992). Conversely, the performance of the SVM model was observed to be relatively poor (AUC = 0.582, 95% CI 0.512–0.651). In this study, the poor performance of the SVM model may be due to the insufficient optimization of its parameters, which in turn affected the predictive performance of the model. Table 3 provides the quantitative metrics of the performance of the five machine learning models. As observed, XGBoost outperformed all other ML models, exhibiting an accuracy, sensitivity, specificity, positive predictive value, negative predictive value, and F1 score of 0.923, 0.936, 0.910, 0.909, 0.939, and 0.922, respectively. Furthermore, the calibration curve (Figure 4B) and decision curve of the XGBoost model was found to be superior to all other ML models (Figure 4C). As a result, XGBoost was deemed the optimal classifier in the current study.
 |
Table 2 Hyperparameter Configuration of the Algorithms Used in the Current Study |
 |
Table 3 Performance of Each Model Used for Prediction |
 |
Figure 4 Performance evaluation of different models (A) Receiver operating characteristics curves. (B) Calibration curves. (C) Decision curves. |
Model Construction and Evaluation
The final model was subsequently constructed using the XGBoost algorithm and evaluated using the validation set data. As shown in Figure 5A, the AUC for the validation set was observed to be 0.740 (0.657–0.823). Furthermore, the Brier score was estimated to be 0.105, and the calibration curve of the predictive model on the validation set was found to be well-aligned with the diagonal line (Figure 5B). In addition, the decision curve demonstrated that the model provided a greater net benefit when the threshold probability was between 0.1 and 0.6 (Figure 5C).
 |
Figure 5 Model validation results (A) Receiver operating characteristics curve. (B) Calibration curve. (C) Decision curve. |
Interpreting the XGBoost Model Using the SHAP Approach
Herein, the SHAP algorithm was employed to ascertain the significance of each predictive variable in the prediction results of the XGBoost model. The most significant variables were listed in descending order in the variable importance plot (Figure 6A). As observed, D-dimer exhibited the highest predictive value, followed by the time from injury to admission, fibrinogen, and red blood cell, activities of daily living, platelet, age, and Caprini thrombosis risk assessment. In addition, the SHAP values were used to identify thrombotic risk factors and examine the positive and negative relationships between predictive variables and target outcomes. As shown in Figure 6B, the color represented the feature value of each feature within a sample, with red indicating a higher value. In addition, Figure 6C and D illustrate individual force plots for thrombotic and non-thrombotic patients. As observed, the predictive features for each patient and the contribution of each feature to thrombosis prediction were elucidated by the SHAP values. The values beneath f(x) represented the probability predictions, while the baseline value denoted the prediction that was made without considering the model input. In addition, the log-odds ratio for each observation was denoted by f(x). The red features represented characteristics that increased the risk of thrombosis, while the blue features represented traits that mitigated thrombotic risk. Herein, the length of the arrows facilitated the visualization of the magnitude of the impact on the prediction. As observed, the length of the arrow directly correlated with the magnitude of its impact.
 |
Figure 6 Model interpretation. (A) SHAP plot of the 8 key variables. (B) Ranking plot for the 8 key variables based on their importance. (C and D) Patients with predicted outcomes of no thrombus and thrombus, respectively. |
Discussion
DVT is a frequent occurrence in patients with hip fractures, which can result in significant rates of incidence, mortality, and disability, thereby endangering patient safety.9,27,28 In the population of elderly patients with hip fractures, the occurrence of preoperative deep vein thrombosis (DVT) has a significant negative impact. Preoperative DVT requires a comprehensive assessment of the thrombus situation to avoid serious complications such as pulmonary embolism caused by thrombus detachment during surgery, which often leads to surgical delay. Preoperative DVT also causes hypercoagulability of the blood, increasing the risk of postoperative thrombus recurrence and thus significantly raising the postoperative mortality rate. For these patients, treatment follows the principle of individualization. For those with mild conditions and stable hemodynamics, anticoagulant therapy is adopted, such as low - molecular - weight heparin combined with warfarin or new oral anticoagulants. For those with severe conditions and unstable hemodynamics, inferior vena cava filter placement is used. Although there have been advancements in anticoagulation strategies, the occurrence of deep vein thrombosis has not significantly decreased because of the substantial rise in the number of patients with hip fractures.29 Thus, promptly identifying patients at high risk for deep vein thrombosis and implementing preventive measures are crucial to decreasing mortality rates.
Herein, LR, RF, and Adaboost algorithms were employed to identify the most significant risk factors. The findings demonstrated that D-dimer, the duration between injury and admission, fibrinogen, red blood cell count, activities of daily living, platelet count, age, and Caprini thrombosis risk assessment were significant factors in the development of DVT. Based on these key factors, the application of XGBoost, SVM, MLP, AdaBoost, and LR algorithms in predicting preoperative DVT in elderly patients with hip fractures was subsequently compared. As observed from the findings, the XGBoost model outperformed all other models in terms of accuracy, sensitivity, specificity, positive predictive value, negative predictive value, F1 score, and AUC. In addition, the AUC value for this model was observed to be 0.975 (0.957–0.992), suggesting a high level of efficiency and stability. Furthermore, the AUC on the internal validation set was found to be 0.740 (0.657–0.823), indicating that the model performed well. Moreover, the comprehensive evaluation of the model’s performance, utilizing a range of metrics and visualizations such as ROC curves, calibration curves, and decision curve analysis, enhanced the credibility of the research findings. These findings, therefore, suggest that the use of machine learning models can effectively identify elderly individuals with hip fractures who are at risk of developing deep vein thrombosis, potentially reducing the risk of thrombotic complications. However, there is a certain disparity between the AUC values of the training set and the validation set, which may indicate the presence of an overfitting issue. Simultaneously, the absence of cross - validation and external validation may potentially undermine the stability of the model. As evident from earlier studies, Wei et al, reported a machine learning model that accurately predicted the risk of thrombosis in patients with lower limb fractures, demonstrating outstanding performance.30 However, the model’s lack of interpretability restricted its practical use in clinical settings. Hence, the SHAP method was used to elucidate the XGBoost model in the current study, ensuring optimal model performance and accuracy, while also aiding in its clinical interpretability. Not only does this approach aid physicians in better understanding the decision-making process of the model, it also promotes the use of the predictive outcomes for clinical prognosis downstream. Additionally, SHAP values provide critical insights into the magnitude and direction of the impact that each predictive factor has on the target variable. Thus, by analyzing the relationships between the predictive variables and their corresponding outcomes in the XGBoost model, detailed investigation into the role of the predictive variables in preoperative DVT in elderly patients with hip fractures was further explored. Throughout the design phase of the study, every effort was made to collect pertinent injury and clinical data at every stage of the clinical process, encompassing preoperative coagulation indicators, routine preoperative blood tests, and additional indicators that were not previously examined in prior studies. Accordingly, D-dimer was identified as the most crucial predictive variable in the current study. D-dimer is a byproduct of fibrin degradation and serves as a precise indicator of the fibrinolytic process in the body, reflecting the activation status of the coagulation system, thrombus formation, or other coagulation-related diseases.31,32 An earlier study by Cheng et al, reveal fibrinogen and D-dimer levels to be excellent indicators for predicting thrombosis in patients with lower limb fractures.33 This is consistent with the findings of the current study, which also revealed a positive correlation between fibrinogen and D-dimer levels, as well as the formation of deep vein thrombosis in the lower limbs. This further validates that predictive models employing machine learning algorithms can accurately capture the influence of various predictive factors on DVT, yielding results that closely align with clinical diagnoses.
However, there are numerous limitations associated with this study. First, the lack of an external validation cohort may limit the applicability of the interpretable machine learning model developed in clinical practice. Secondly, the need to position elderly hip fracture patients correctly during ultrasound procedures can pose a challenge, impacting the accuracy of the results. Although vascular ultrasound examination has become increasingly popular and is widely used, it is not regarded as the “gold standard”. Doppler ultrasound is widely used in DVT diagnosis. As a non-invasive, convenient and cost-effective method, it can clearly visualize lower limb vein morphology, structure and blood flow, serving as a common preliminary screening and diagnostic tool. For more accurate DVT diagnosis, there are other methods. Venography, the “gold standard”, directly reveals venous thrombi. However, its invasiveness, high cost and potential complications limit its widespread use. Hence, this predictive model used in this study is unable to eliminate the possibility of false positive and negative outcomes in the diagnosis of DVT.
Conclusions
An interpretable XGBoost predictive model that demonstrating outstanding performance in predicting preoperative DVT in elderly hip fracture patients was successfully developed in the current study. Additionally, by utilizing a machine learning model that could be easily understood and interpreted, patients who are at a high risk for DVT could be accurately identified, facilitating the implementation of appropriate interventions in a timely and precise manner.
Data Sharing Statement
The datasets are available from the corresponding author with a reasonable.
Ethics Approval and Consent to Participate
This study was approved by the ethics committee of The First Affiliated Hospital of Wannan Medical College. For this retrospective analysis informed consent is not required. The study was conducted in accordance with the ethical standards of the institutional research committee and the principles of the Declaration of Helsinki. All personal information was anonymized and de-identified to ensure confidentiality.
Author Contributions
All authors made a significant contribution to the work reported, whether that is in the conception, study design, execution, acquisition of data, analysis and interpretation, or in all these areas; took part in drafting, revising or critically reviewing the article; gave final approval of the version to be published; have agreed on the journal to which the article has been submitted; and agree to be accountable for all aspects of the work.
Funding
No funding was received for this study.
Disclosure
The authors declare that they have no conflict of interest request.
References
1. Alexiou KI, Roushias A, Varitimidis SE, Malizos KN. Quality of life and psychological consequences in elderly patients after a hip fracture: a review. Clin Interv Aging. 2018;13:143–150. doi:10.2147/CIA.S150067
2. Brauer CA, Coca-Perraillon M, Cutler DM, Rosen AB. Incidence and mortality of hip fractures in the United States. JAMA. 2009;302(14):1573–1579. doi:10.1001/jama.2009.1462
3. Johnell O, Kanis JA. An estimate of the worldwide prevalence, mortality and disability associated with hip fracture. Osteoporos Int. 2004;15(11):897–902. doi:10.1007/s00198-004-1627-0
4. Griffin XL, Parsons N, Achten J, Fernandez M, Costa ML. Recovery of health-related quality of life in a United Kingdom hip fracture population. The Warwick hip trauma evaluation--a prospective cohort study. Bone Joint J. 2015;97-B(3):372–382. doi:10.1302/0301-620X.97B3.35738
5. Sogaard KK, Schmidt M, Pedersen L, Horvath-Puho E, Sorensen HT. 30-year mortality after venous thromboembolism: a population-based cohort study. Circulation. 2014;130(10):829–836. doi:10.1161/CIRCULATIONAHA.114.009107
6. Song K, Yao Y, Rong Z, Shen Y, Zheng M, Jiang Q. The preoperative incidence of deep vein thrombosis (DVT) and its correlation with postoperative DVT in patients undergoing elective surgery for femoral neck fractures. Arch Orthop Trauma Surg. 2016;136(10):1459–1464. doi:10.1007/s00402-016-2535-4
7. Smith EB, Parvizi J, Purtill JJ. Delayed surgery for patients with femur and hip fractures-risk of deep venous thrombosis. J Trauma. 2011;70(6):E113–116. doi:10.1097/TA.0b013e31821b8768
8. Unlu B, Versteeg HH. Effects of tumor-expressed coagulation factors on cancer progression and venous thrombosis: is there a key factor? Thromb Res. 2014;133(Suppl 2):S76–84. doi:10.1016/S0049-3848(14)50013-8
9. Zhao K, Wang Z, Tian S, Hou Z, Chen W, Zhang Y. Incidence of and risk factors for pre-operative deep venous thrombosis in geriatric intertrochanteric fracture patients. Int Orthop. 2022;46(2):351–359. doi:10.1007/s00264-021-05215-x
10. Garry J, Duke A, Labropoulos N. Systematic review of the complications following isolated calf deep vein thrombosis. Br J Surg. 2016;103(7):789–796. doi:10.1002/bjs.10152
11. Zhuang Q, He Q, Aikebaier A, Chen W, Liu J, Wang D. The risk factors for new-onset calf muscle venous thrombosis after hip fracture surgery. J Pers Med. 2023;13(2):257. doi:10.3390/jpm13020257
12. Stafford IS, Kellermann M, Mossotto E, Beattie RM, MacArthur BD, Ennis S. A systematic review of the applications of artificial intelligence and machine learning in autoimmune diseases. NPJ Digit Med. 2020;3(1):30. doi:10.1038/s41746-020-0229-3
13. Kawaler E, Cobian A, Peissig P, Cross D, Yale S, Craven M. Learning to predict post-hospitalization VTE risk from EHR data. AMIA Annu Symp Proc. 2012;2012:436–445.
14. Rochefort CM, Verma AD, Eguale T, Lee TC, Buckeridge DL. A novel method of adverse event detection can accurately identify venous thromboembolisms (VTEs) from narrative electronic health record data. J Am Med Inform Assoc. 2015;22(1):155–165. doi:10.1136/amiajnl-2014-002768
15. Nudel J, Bishara AM, de Geus SWL, et al. Development and validation of machine learning models to predict gastrointestinal leak and venous thromboembolism after weight loss surgery: an analysis of the MBSAQIP database. Surg Endosc. 2021;35(1):182–191. doi:10.1007/s00464-020-07378-x
16. Wang X, Yang YQ, Liu SH, Hong XY, Sun XF, Shi JH. Comparing different venous thromboembolism risk assessment machine learning models in Chinese patients. J Eval Clin Pract. 2020;26(1):26–34. doi:10.1111/jep.13324
17. Jin S, Qin D, Liang BS, et al. Machine learning predicts cancer-associated deep vein thrombosis using clinically available variables. Int J Med Inform. 2022;161:104733. doi:10.1016/j.ijmedinf.2022.104733
18. Watson DS, Krutzinna J, Bruce IN, et al. Clinical applications of machine learning algorithms: beyond the black box. BMJ. 2019;364:l886. doi:10.1136/bmj.l886
19. Lancet Respiratory Medicine T. Opening the black box of machine learning. Lancet Respir Med. 2018;6(11):801. doi:10.1016/S2213-2600(18)30425-9
20. Martin SA, Townend FJ, Barkhof F, Cole JH. Interpretable machine learning for dementia: a systematic review. Alzheimers Dement. 2023;19(5):2135–2149. doi:10.1002/alz.12948
21. Blazek K, van Zwieten A, Saglimbene V, Teixeira-Pinto A. A practical guide to multiple imputation of missing data in nephrology. Kidney Int. 2021;99(1):68–74. doi:10.1016/j.kint.2020.07.035
22. Bauder RA, Khoshgoftaar TM. The effects of varying class distribution on learner behavior for medicare fraud detection with imbalanced big data. Health Inf Sci Syst. 2018;6(1):9. doi:10.1007/s13755-018-0051-3
23. Cava W, Bauer C, Moore JH, Pendergrass SA. Interpretation of machine learning predictions for patient outcomes in electronic health records. AMIA Annu Symp Proc. 2019;2019:572–581. doi:10.1145/2939672.2939785
24. Huang Y, Li W, Macheret F, Gabriel RA, Ohno-Machado L. A tutorial on calibration measurements and calibration models for clinical prediction models. J Am Med Inform Assoc. 2020;27(4):621–633. doi:10.1093/jamia/ocz228
25. Van Calster B, Wynants L, Verbeek JFM, et al. Reporting and interpreting decision curve analysis: a guide for Investigators. Eur Urol. 2018;74(6):796–804. doi:10.1016/j.eururo.2018.08.038
26. Zhao W, Zhao J, Liu T, Liu Z, Liu L. Incidence and risk factors of preoperative isolated calf deep venous thrombosis following Hip fractures. Medicine. 2022;101(12):e29140. doi:10.1097/MD.0000000000029140
27. Ruskin KJ. Deep vein thrombosis and venous thromboembolism in trauma. Curr Opin Anaesthesiol. 2018;31(2):215–218. doi:10.1097/ACO.0000000000000567
28. Raskob GE, Angchaisuksiri P, Blanco AN, et al. Thrombosis: a major contributor to global disease burden. Arterioscler Thromb Vasc Biol. 2014;34(11):2363–2371. doi:10.1161/ATVBAHA.114.304488
29. Modi S, Deisler R, Gozel K, et al. Wells criteria for DVT is a reliable clinical tool to assess the risk of deep venous thrombosis in trauma patients. World J Emerg Surg. 2016;11(1):24. doi:10.1186/s13017-016-0078-1
30. Wei C, Wang J, Yu P, et al. Comparison of different machine learning classification models for predicting deep vein thrombosis in lower extremity fractures. Sci Rep. 2024;14(1):6901. doi:10.1038/s41598-024-57711-w
31. Kelly J, Rudd A, Lewis RR, Hunt BJ. Plasma D-dimers in the diagnosis of venous thromboembolism. Arch Intern Med. 2002;162(7):747–756. doi:10.1001/archinte.162.7.747
32. Michiels JJ, Gadisseur A, van der Planken M, et al. Different accuracies of rapid enzyme-linked immunosorbent, turbidimetric, and agglutination D-dimer assays for thrombosis exclusion: impact on diagnostic work-ups of outpatients with suspected deep vein thrombosis and pulmonary embolism. Semin Thromb Hemost. 2006;32(7):678–693. doi:10.1055/s-2006-951296
33. Cheng J, Fu Z, Zhu J, Zhou L, Song W. The predictive value of plasminogen activator inhibitor-1, fibrinogen, and D-dimer for deep venous thrombosis following surgery for traumatic lower limb fracture. Ann Palliat Med. 2020;9(5):3385–3392. doi:10.21037/apm-20-1604
 © 2025 The Author(s). This work is published and licensed by Dove Medical Press Limited. The
full terms of this license are available at https://www.dovepress.com/terms
and incorporate the Creative Commons Attribution
- Non Commercial (unported, 4.0) License.
By accessing the work you hereby accept the Terms. Non-commercial uses of the work are permitted
without any further permission from Dove Medical Press Limited, provided the work is properly
attributed. For permission for commercial use of this work, please see paragraphs 4.2 and 5 of our Terms.
© 2025 The Author(s). This work is published and licensed by Dove Medical Press Limited. The
full terms of this license are available at https://www.dovepress.com/terms
and incorporate the Creative Commons Attribution
- Non Commercial (unported, 4.0) License.
By accessing the work you hereby accept the Terms. Non-commercial uses of the work are permitted
without any further permission from Dove Medical Press Limited, provided the work is properly
attributed. For permission for commercial use of this work, please see paragraphs 4.2 and 5 of our Terms.
Recommended articles
Incidence and Risk Factors of Lower Limb Deep Vein Thrombosis in Psychiatric Inpatients by Applying Machine Learning to Electronic Health Records: A Retrospective Cohort Study
Xu L, Da M
Clinical Epidemiology 2025, 17:197-209
Published Date: 25 February 2025

Machine Learning-Based Prediction of Postoperative Pneumonia Among Super-Aged Patients With Hip Fracture
Tang M, Zhang M, Dang Y, Lei M, Zhang D
Clinical Interventions in Aging 2025, 20:217-230
Published Date: 27 February 2025
Predicting Preoperative Deep Vein Thrombosis Using d-Dimer-to-Albumin Ratio Combined with Neutrophil-to-Lymphocyte Ratio in Older Patients with Hip Fracture
Lu W, Jia F, Rao M, Chen W, Liu Y, Bian J
Clinical Interventions in Aging 2025, 20:873-879
Published Date: 23 June 2025
Machine Learning–Based Early Prediction of Lower Extremity Deep Vein Thrombosis in the ICU: A Multicenter Study
Li Y, Xu L, Chen Y
Risk Management and Healthcare Policy 2026, 19:603569
Published Date: 25 May 2026

A Web-Based Machine Learning Calculator for Predicting Preoperative Deep Vein Thrombosis in Elderly Hip Fractures Patients
Zhang S, Zhou J, Han Y, Tian Z, Yao Q
Clinical Interventions in Aging 2026, 21:614064
Published Date: 25 June 2026