Back to Journals » Breast Cancer: Targets and Therapy » Volume 17
Predicting Human Epidermal Growth Factor Receptor 2 Expression in Breast Cancer Based on Radiomics of MRI Habitat and US
Authors Lin Z ![]() , Huang F, Wei L, Liao X, Gao Y
, Huang F, Wei L, Liao X, Gao Y ![]()
Received 19 May 2025
Accepted for publication 9 August 2025
Published 15 August 2025 Volume 2025:17 Pages 711—725
DOI https://doi.org/10.2147/BCTT.S535697
Checked for plagiarism Yes
Review by Single anonymous peer review
Peer reviewer comments 2
Editor who approved publication: Professor Pranela Rameshwar
Zikai Lin, Fangyi Huang, Liyan Wei, Xinhong Liao, Yong Gao
Department of Ultrasound, First Affiliated Hospital of Guangxi Medical University, Nanning, People’s Republic of China
Correspondence: Yong Gao, Department of Ultrasound, First Affiliated Hospital of Guangxi Medical University, Nanning, People’s Republic of China, Tel +86 15977486866, Email [email protected]
Purpose: This study aims to predict human epidermal growth factor receptor-2 (HER-2) expression in breast cancer based on radiomics of magnetic resonance imaging (MRI) habitat and ultrasound (US).
Patients and Methods: This retrospective study included 182 breast cancer patients confirmed by pathology from May 25, 2019 to April 15, 2025. The data set was randomly divided into a training set (n=145) and a testing set (n=37) with an 8:2 ratio. All patients underwent MRI and US before surgery. Volumes of interest were delineated on the second phase of dynamic contrast-enhanced T1-weighted imaging, which were clustered into different habitat regions via K-means clustering. Feature selection was using Spearman correlation, greedy recursive elimination strategy, least absolute shrinkage and selection operator regression. Models based on extremely randomized trees were developed using radiomics features extracted from MRI habitats, or from regions of interest on US. A clinical model was developed based on baseline data, followed by stacking the best habitat model and US model, as well as a combination of the best habitat, US, and clinical models. Model performance was evaluated by areas under the curve (AUCs) and integrated discrimination improvement (IDI). The interpretability of the best habitat model and US model was using Shapley Additive exPlanations analysis.
Results: Model_H1_multi-parametric was selected as the best habitat model (AUC was 0.880 and 0.801 in the training set and testing set). Model_H1+US+Cli (AUC was 0.945 and 0.835 in the training set and testing set) outperformed Model_H1_multi-parametric, the US model and the clinical model. The IDI analysis demonstrated further improvement by Model_H1+US+Cli.
Conclusion: A combined model based on multi-parametric MRI habitat radiomics, US imaging radiomics, and clinical features can effectively predict HER-2 expression status in breast cancer.
Keywords: habitat imaging, multi-parametric MRI, ultrasound, HER-2, breast cancer
Introduction
Breast cancer is one of the most common cancers worldwide.1 Overexpression of human epidermal growth factor receptor-2 (HER-2) is associated with high-grade tumors and lymph node metastasis.2 Trastuzumab, the first of these targeted treatments, significantly improves survival rates and prognosis.3 Several targeted therapies have also emerged for specific molecules and pathways in triple-negative breast cancer, which have shown promising results in clinical trials.4 Consequently, assessing HER-2 status is crucial for selecting the appropriate treatment and predicting prognosis in breast cancer patients.
Currently, the gold standards for evaluating HER-2 expression are immunohistochemistry (IHC) and fluorescence in situ hybridization (FISH).5 However, both methods require invasive procedures to obtain pathological tissue samples.6 Additionally, HER-2 status may change in some patients during or after neoadjuvant chemotherapy, and such alterations more frequently manifest as a loss of HER2 expression (occurring in 18–42% of cases), which may be associated with a higher recurrence rate and a worse prognosis.7 Repeated assessments of HER-2 status during treatment are necessary to adjust medication promptly, but the invasiveness of biopsies limits their use.
Ultrasound (US) and magnetic resonance imaging (MRI) are commonly used in breast cancer evaluation.8,9 While these imaging techniques can reveal features related to molecular subtypes of breast cancer, including HER-2 status, their predictive value based on visual markers remains limited.10,11 Radiomics can enable more efficient data analysis through extracting quantitative features from images.12 It has been used in various areas of breast cancer research, such as distinguishing between benign and malignant tumors, evaluating molecular subtyping, and predicting treatment efficacy and prognosis.13–16 However, most radiomics-related studies currently focus on the entire tumor region, assuming a uniform distribution of heterogeneity within the tumor.17,18
Recently, “habitat” imaging has emerged as a method for dividing tumors into subregions by identifying grayscale voxels, offering a more refined characterization of tumor heterogeneity. Studies have shown that specific tumor habitats are related to drug resistance and poor prognosis.19,20 To our knowledge, few studies has combined multi-parametric MRI habitats, US, and clinical factors to model and predict HER-2 status in breast cancer. In this research, we developed a combined model based on multi-parametric MRI habitat radiomics, US imaging radiomics, and clinical features to predict HER-2 expression status in breast cancer.
Material and Methods
Patients
The patient inclusion process is shown in Figure 1. This retrospective study was approved by the First Affiliated Hospital of Guangxi Medical University Ethical Review Committee (No. 2024-E530-01) with a waiver of informed consent, as the research involved only anonymized medical records and posed no additional risk to participants. All data were de-identified and handled in strict compliance with the Declaration of Helsinki to protect patient confidentiality.
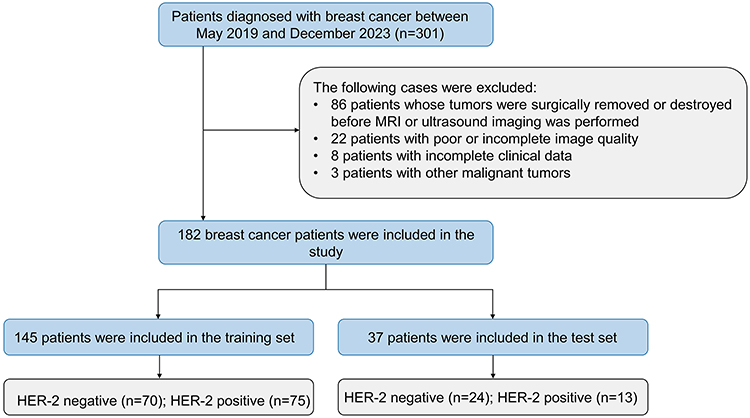 |
Figure 1 The patient recruitment in our study. Abbreviation: HER-2: Human epidermal growth factor receptor-2. |
We included breast cancer patients from May 25, 2019 to April 15, 2025. The inclusion criteria were as follows: (1) patients confirmed breast cancer by pathology; (2) HER-2 status determined by IHC and/or FISH; and (3) those who underwent multi-parametric MRI and US examinations. The exclusion criteria were as follows: (1) partial surgical resection or biopsy of the tumor before MRI or US imaging; (2) poor or incomplete image quality; (3) presence of other malignant tumors; and (4) incomplete clinical data.
Pathological Examination
Tumor tissues for pathological examination were obtained through surgery or biopsy. HER-2 status was determined via IHC and/or FISH assays.5 HER-2 positivity was defined as IHC 3+, while HER-2 negativity was defined as IHC 0 or IHC 1+. For IHC 2+ results, FISH was performed, and HER-2 was considered positive if gene amplification was observed; otherwise, it was deemed negative.
Clinical Characteristics
Clinical characteristics were extracted from patient medical records. These included body mass index, age, menopause status, family history of breast cancer, breast appearance changes, palpation findings, and serum biomarkers.
Ultrasound Examination
All patients underwent preoperative US examinations of the breast. The US machines used included GE LOGIQ E9 and VOLUSON E9 (General Electric, Boston, USA), HITACHI ARIEETTA 70 (HITACHI Ltd., Tokyo, Japan), and Mindray Resona 7 and DC-7 (Mindray, Shenzhen, China), equipped with linear array probes operating at a frequency of 9–12 MHz. Patients were positioned supine, with their arms raised above their heads to expose the breast fully. Two US physicians with 5 years of experience analyzed the US features, and any discrepancies were resolved by a third US physician with 10 years of experience. They were all blinded to the pathological results. The recorded features included multifocality, lesion location, ADLER blood flow grading, calcification, boundary, morphology, margin, internal echo, rear acoustic shadow, Breast Imaging-Reporting and Data System classification, and the maximum tumor diameter.
MRI Examination
MRI scans were performed using Siemens Verio 3.0T, Siemens Prisma 3.0T (Siemens Healthineers, Erlangen, Germany), and GE 750 3.0T imagers (General Electric, Chicago, USA). To minimize motion, patients were positioned prone. The imaging sequences included axial T1-weighted imaging (T1WI), axial turbo-spin-echo T2-weighted imaging (T2WI) with fat suppression (FS), axial single-shot diffusion-weighted imaging (DWI), and axial dynamic contrast-enhanced (DCE) imaging. Prior to DCE, a pre-contrast T1WI-FS scan was conducted, followed by an intravenous injection of gadolinium contrast (Gadopentetate Dimeglumine, Magnevist, 0.1 mmol/kg at 2 mL/s) and a 20 mL saline flush. The DCE protocol for Siemens Verio 3.0T included one pre-contrast and five post-contrast phases, each lasting 68 seconds. The Siemens Prisma 3.0T protocol comprised one pre-contrast and four post-contrast phases, each 77 seconds long. The GE 750 3.0T protocol consisted of one pre-contrast and five post-contrast phases, with each phase lasting 66 seconds. Detailed MRI sequence information is provided in Table S1.
MRI imaging features included tumor length, short axis, ADC value, time-intensity curve type (persistent, plateau, washout), presence of lymph nodes with an axillary long axis ≥1 cm, and tumor volume. Tumor volume was obtained from the volume of interest (VOI) in ITK-snap; other imaging features were based on MRI reports.
Clinical Model Development
Univariate logistic regression analysis (p<0.05) was conducted to identify significant variables. Variables with a variance inflation factor (VIF) greater than 5 were removed to address multicollinearity. Subsequently, multivariate logistic regression analysis (p<0.01) was performed to identify risk factors associated with HER-2 positivity, forming the clinical predictive model.
MRI Habitat Generation
All MR images underwent N4 bias correction for intensity normalization (http://stnava.github.io/ANTs/) and were resampled to a resolution of 1 × 1×1 mm. Image segmentation and registration were performed using ITK-Snap (Version 4.0.2, http://www.itksnap.org/). Two radiologists with 5 years of experience, who were blinded to patient results, used a semi-automatic method to delineate the VOIs on each slice of the second phase of axial dynamic contrast-enhanced (DCE2) images, with the final VOI determined by consensus. The VOIs were then applied to other sequences. T1 and the first phase of axial dynamic contrast-enhanced (DCE1) images were non-rigidly registered to DCE2, while T2 and DWI images were rigidly registered to DCE1, followed by manual adjustment for optimal alignment.
Habitats were generated by clustering the VOIs into sub-regions based on the voxel values from all MRI sequences of each sample. To better characterize the habitats, two subtraction sequences were created: SUB_1 by subtracting T1 from DCE1 and SUB_2 by subtracting DCE1 from DCE2. Voxel values from seven sequences (T1, T2, DWI, DCE1, DCE2, SUB_1, and SUB_2) were used for patient-level VOI clustering using the K-means algorithm. SUB_1 and SUB_2 were not included in subsequent analyses. The optimal number of habitats was determined by testing 3 to 10 clusters and selecting the k-value with the highest mean Calinski–Harabasz (CH) score.21
US Image Preprocessing and Segmentation
US images underwent z-score normalization to eliminate variations in grayscale values. Tumor regions of interest (ROIs) were delineated by US Physician 1 using the open-source software ITK-Snap on the cross-section of the grayscale US image showing the largest tumor dimension. For inter-observer consistency, US Physician 2 delineated ROIs for 30 randomly selected patients. The intra-class correlation coefficient (ICC) was used to quantify the consistency of radiomic features. Features showing an ICC ≥ 0.75 were considered robust.
Feature Extraction and Selection
Radiomic features were extracted using the PyRadiomics package (v3.6.2) from US or MRI images respectively, including first-order features, shape features, and texture features. Only radiomic features from US images with an ICC ≥ 0.75 were retained.
All features were standardized using Z-scores. Student’s t-test was applied to retain radiomic features. Using the Spearman rank correlation coefficient, a greedy recursive elimination strategy was applied to filter features. This approach retained only one feature from any pair with a correlation coefficient > 0.9, ensuring the retention of descriptive features. The least absolute shrinkage and selection operator (LASSO) regression model, tuned for regularization parameter λ, selected important non-zero coefficient features to form the optimal feature set for model construction.
Radiomics Model and Combined Model Development
We developed several predictive models using the extremely randomized trees (ExtraTrees) method: five models based on the combined features from the three habitat regions within each MR sequence (Model_T1_H1+H2+H3, Model_T2_H1+H2+H3, Model_DWI_H1+H2+H3, Model_DCE1_H1+H2+H3, Model_DCE2_H1+H2+H3), one US-based model, three models on the combined features from the same habitat region across all MR sequences (Model_H1_multi-parametric, Model_H2_multi-parametric, Model_H3_multi-parametric), and a habitat fusion model (Model_Habitat_whole) incorporating features from all habitat regions across all MR sequences.
Using Averaging-Based Stacking, we developed two joint prediction models. Model_H+US integrates the best habitat and US model by averaging their out-of-sample predicted probabilities into a meta-feature to train an ExtraTrees meta-learner for final predictions. Model_H+US+Cli additionally incorporates the clinical model, similarly averaging probabilities as the meta-feature to train its ExtraTrees meta-learner. Each model’s parameters were fine-tuned for optimal performance (Table S2).22
The overall study workflow is summarized in Figure 2.
 |
Figure 2 Workflow of the study. Abbreviations: DCE1, the first phase of dynamic contrast-enhanced imaging; DCE2, the second phase of dynamic contrast-enhanced imaging; DWI, diffusion-weighted imaging; T1WI, T1-weighted imaging; T2WI, T2-weighted imaging; VOI, volumes of interest; ROI, regions of interest; LASSO, least absolute shrinkage and selection operator; Model_H1+US, a model that combines the Habitat 1 based model and the ultrasound-based model; Model_H1+US+Cli, a model that combines the Habitat 1 based model, ultrasound based model and clinical based model. |
Statistical Analysis
Statistical analyses were conducted using SPSS (version 26.0) and MedCalc (version 16.2). For missing variable values, discrete variables were filled using the median and continuous variables using the mean. A variable was discarded if it had 20% or more missing values. Categorical variables were compared using the chi-square test or Fisher’s exact test. Continuous variables were compared using the Student’s t-test or Mann–Whitney U-test. Model performance was evaluated using receiver operating characteristic (ROC) curves, accuracy, F1 score, sensitivity, and specificity. Area under the curve (AUC) differences between models were compared using DeLong’s test. Incremental differences between combined and single models were measured using IDI, and clinical net benefits were determined using decision curve analysis (DCA). SHAP analysis was performed to assess the interpretability of the best habitat model and US model. Differences with p<0.05 were considered statistically significant.
Results
Baseline Data of Patients
Our study included 182 breast cancer patients with a mean age of 49.57 ± 10.49 years. Of these, 88 (48.4%) were HER-2-positive and 94 (51.6%) were HER-2-negative. Patients were randomly divided into a training set (n=145) and a testing set (n=37) at an 8:2 ratio. The baseline characteristics of the patients are shown in Table S3. Univariate and multivariate analysis identified calcifications as an independent predictor of HER-2+ status (p<0.01, Table 1).
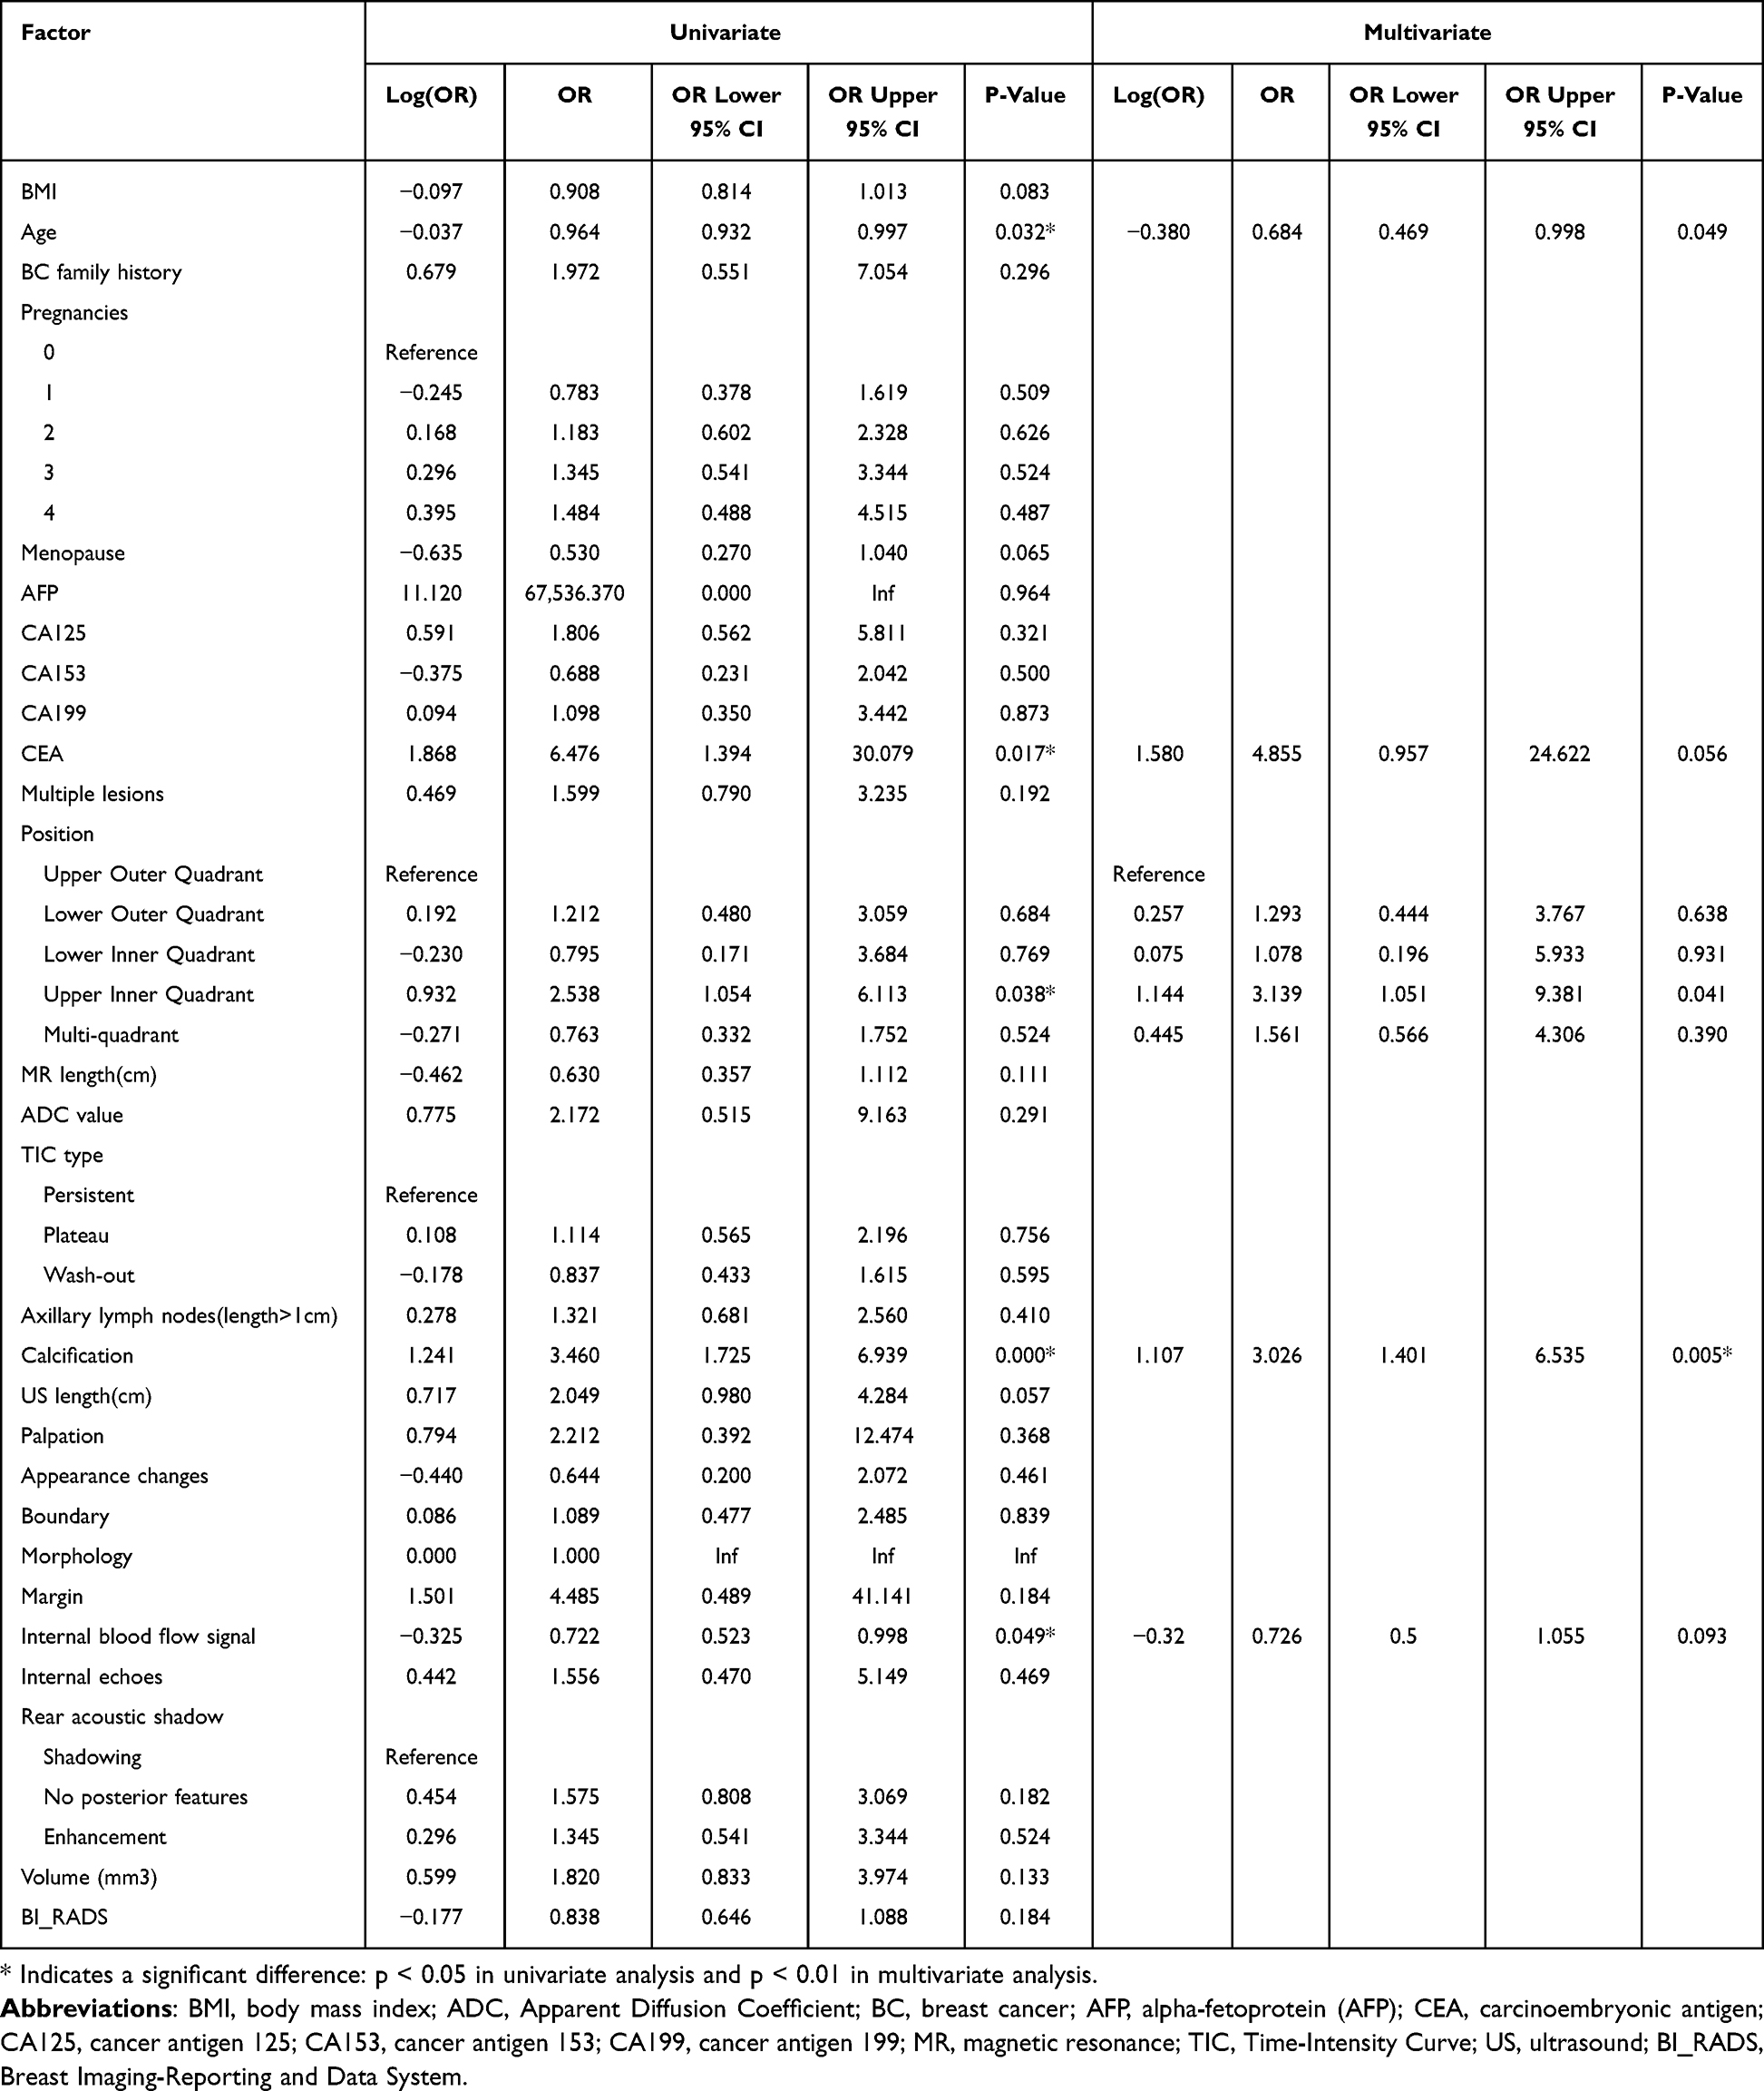 |
Table 1 Univariate and Multivariate Analyses of Patient Baseline Characteristics to Predict HER-2 Positivity in Breast Cancer |
The clinical model achieved AUCs of 0.645 (95% CI=0.568–0.723) and 0.635 (95% CI=0.478–0.792) in the training and testing sets, respectively (Figure S1).
Habitat Radiomics Feature Selection Based on MRI
The highest CH score was observed when the tumors were clustered into three habitats across the entire cohort (Figure S2). From each MRI sequence’s habitat region, 107 features were extracted, resulting in a combined feature set of 321 features per MRI sequence. Features from the same habitat region across all five sequences were combined to form three feature sets, each containing 535 features, while all habitat-extracted features were amalgamated into a single set containing 1605 features. Further details on feature selection for the habitat 1 models are provided in Figure S3A, C, E.
Habitat Model Establishment and Evaluation Based on MRI
We developed nine radiomic models using the ExtraTrees algorithm. Table S4 presents the specific performance metrics of the nine models, while Figure S4 displays the ROC curves and DeLong’s test results. The Model_H1_multi-parametric achieved AUCs of 0.880 (95% CI=0.825–0.935) and 0.801 (95% CI=0.655–0.948) in the training and testing sets, respectively. As a result, the Model_H1_multi-parametric was ultimately selected as the best habitat model.
Radiomics Feature Selection and Model Establishment Based on US
There were 1561 radiomic features extracting from the US ROIs, with 1499 robust features retained after ICC testing. Details on feature selection for the US models are provided in Figure S3B, D, F. The US model’s AUC was 0.729 (95% CI=0.647–0.811) and 0.631 (95% CI=0.432–0.831) in the training and testing set, respectively (Figure S5).
Evaluation of the Best Habitat Model, US Model, Clinical Model, and Combined Model
Employing Averaging-Based Stacking, we developed Model_H1+US and Model_H1+US+Cli (Table 2).
 |
Table 2 Performance of Combined Models in Training and Testing Sets |
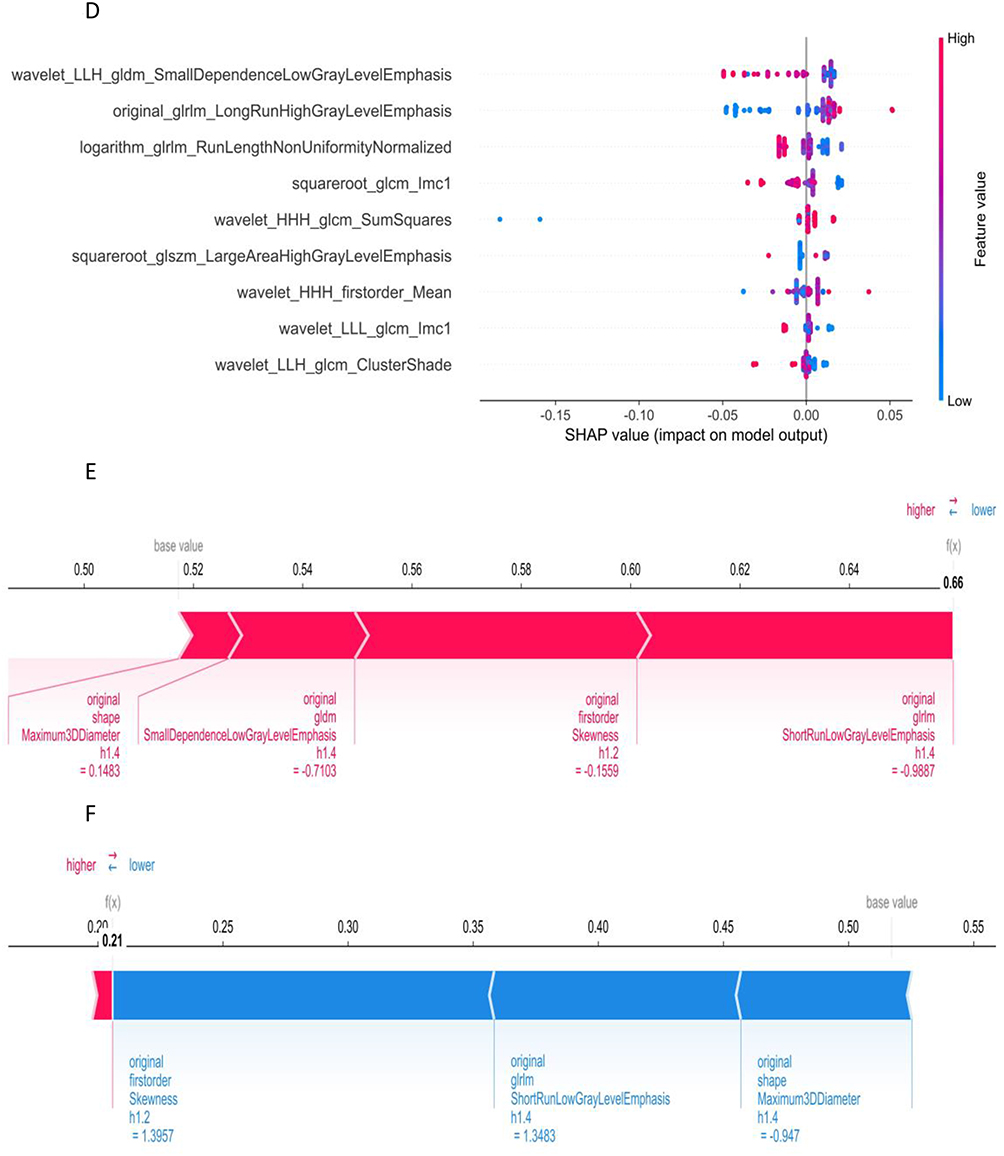
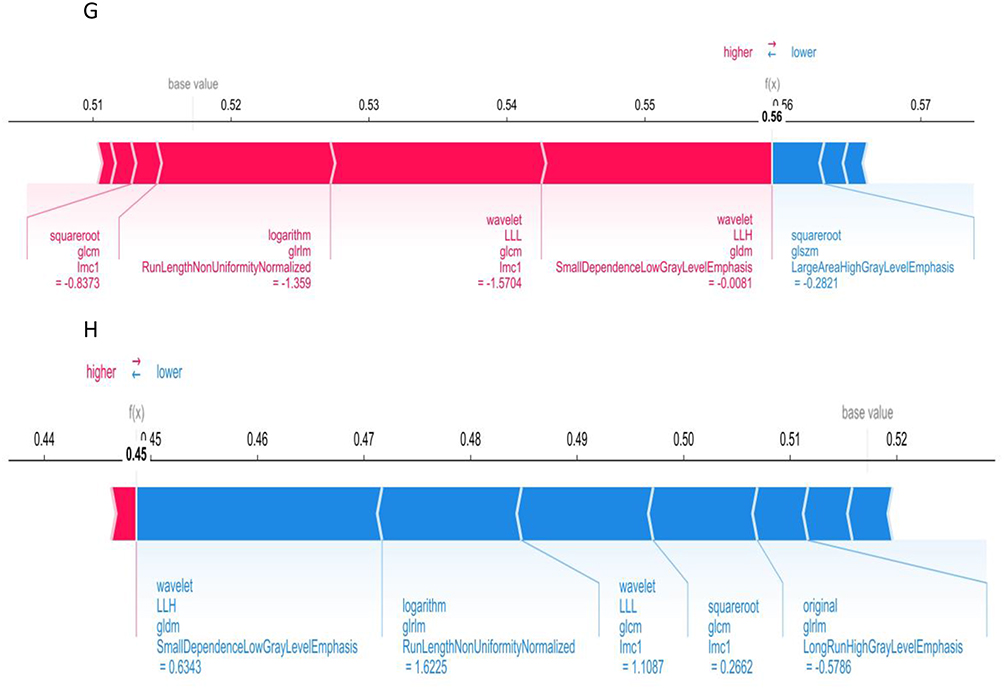
Detailed results of DeLong’s test, DCA curves, and calibration curves for Model_H1_multi-parametric, US model and the clinical model are shown in Figure S6. Figure 3 shows the feature importance, distribution and individual analysis through SHAP for both Model_H1_multi-parametric and US model. Figure 3 Continued. Figure 3 Continued. Figure 3 SHAP-based model visualization. (A and B) Bar charts illustrating the weights of the most important features in Model_H1_multi-parametric (A) and ultrasound model (B). (C and D) The bees-warm plots depicting the impact of each feature on the prediction probability for Model_H1_multi-parametric (C) and ultrasound model (D). Red and blue points represent positive and negative impacts on the prediction outcome, respectively. (E and F) SHAP force plots demonstrating correct predictions by Model_H1_multi-parametric for representative HER-2 negative (E) and HER-2 positive (F) cases. (G and H) SHAP force plots demonstrating correct predictions by the ultrasound model for representative HER-2 negative (G) and HER-2 positive (H) cases. Abbreviations: SHAP, Shapley Additive explanation; h1.1, from the habitat 1 region of the second phase of dynamic contrast-enhanced images; h1.4, from the habitat 1 region of the T2-weighted imaging.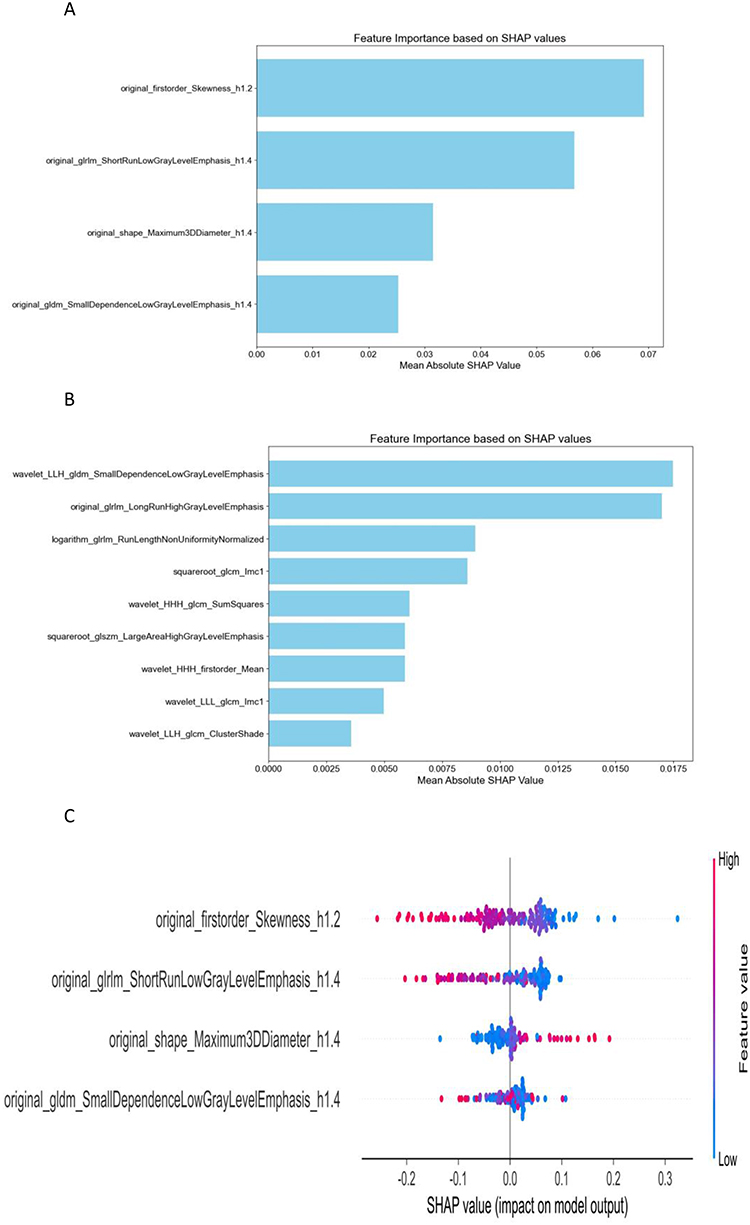
The ROC curves, DeLong test, and IDI results among Model_H1_multi-parametric and the two combined models are shown in Figure 4. Calibration curves showed good overall agreement across the three models (Figure 5A and B). DCA showed significant net benefits for all three models (Figure 5C and D). The radiomics prediction scores for each patient in Model_H1+US+Cli are presented in Figure S7.
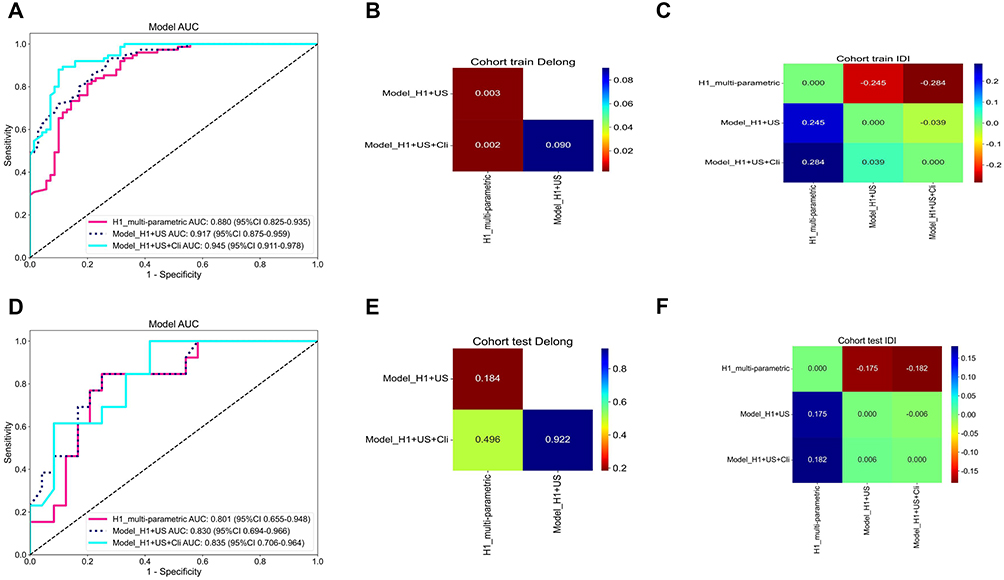 |
Figure 4 Receiver operating characteristic curves, DeLong Test and Integrated Discrimination Improvement (IDI) Test Comparisons of Three Models on Training Set (A–C) and Test Set (D–F). Abbreviations: AUC, area under the curve; Model_H1_multi-parametric, radiomics model based on habitat 1; Model_H1+US, a model that combines the Habitat 1 based model and the ultrasound-based model, Model_H1+US+Cli, a model that combines the Habitat 1 based model, ultrasound based model and clinical based model. |
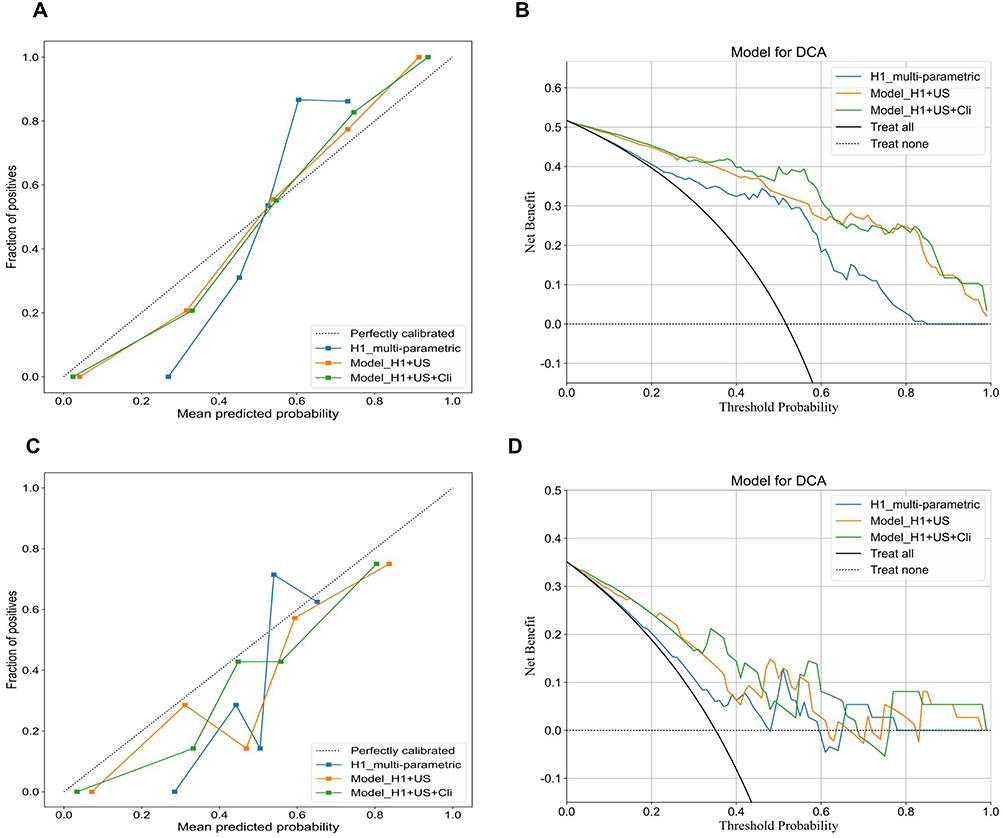 |
Figure 5 Calibration Curves and Decision Curve Analysis for Model_H1_multi-parametric, Model_H1+US and Model_H1+US+Cli on Training Set (A and B) and Test Set (C and D). |
Discussion
Our study developed a combined model by integrating the Model_H1_multi-parametric, US model, and clinical model using Averaging-Based Stacking, which demonstrated excellent performance in predicting HER-2 expression status in breast cancer (AUCs of 0.945 and 0.835 in the training and test sets, respectively).
Unlike previous studies that extracted radiomic features from the entire tumor region based on MRI, this study extracted features from habitat regions based on MRI. Habitat imaging, which emphasizes sub-regional radiomics analysis, may capture specific information related to gene or protein expression within different habitat regions.23,24 In the meantime, Model_H1_multi-parametric exhibited high accuracy, F1 scores, sensitivity, and specificity, demonstrating better performance than Model_H2_multi-parametric, Model_H3_multi-parametric, or those based on multimodal multi-habitat clustering features or unimodal multi-habitat clustering features. This improved performance may be associated with the specific characteristics of HER-2-positive breast cancer in Habitat Subregion 1. The Model_Habitat_Whole, which incorporates features from multiple habitats, may suffer from diluted or masked information due to noise, reducing its predictive performance. Similar conclusions were drawn by Wang et al.25
The primary methods for habitat generation are the k-means algorithm and the Otsu algorithm.21,26,27 The Otsu algorithm divides an image into two categories: minimizing intra-class variance and maximizing inter-class variance. When habitat generation is based on n types of imaging data, the number of habitats generated is 2n. If we had used the Otsu algorithm, it would have yielded 32 habitat regions, making the results difficult to interpret and apply. Therefore, we chose the k-means algorithm. Notably, most previous studies have performed clustering at the patient group level,21,26 ensuring the same physical meaning for each habitat category across different tumors. However, group-level clustering means that voxel values from all sample VOIs are divided into three clusters, and at the individual sample level, some clusters may be missing, resulting in incomplete radiomics features for that region. This issue has rarely been addressed in previous studies. Although missing radiomics features can be handled using methods for missing data, it may still decrease predictive performance and reduce model interpretability.28 To avoid this, we used individual-level clustering in this study, ensuring each sample had three habitat regions. We addressed the potential issue of differing physical meanings for the same habitat region across samples by using the radiomics features of one sample as an anchor and rearranging the radiomics features of the three habitat regions for all samples according to their similarity to the anchor, ensuring consistency across samples.
Our Model_H1+US, which integrated the Model_H1_multi-parametric and the US radiomics model, achieved AUCs of 0.917 and 0.830 in the training and test sets, respectively, outperforming Model_H1_multi-parametric. This result indicates that adding US information enhances the model’s predictive ability. US imaging provides supplementary information distinct from MRI, making the model more comprehensive and accurate in capturing tumor characteristics. Multimodal radiomics has been applied to distinguish benign from malignant tumors,29 predict treatment responses,30 analyze prognoses,31 and predict biomarkers,32 all achieving higher predictive performance than single-modal approaches. To date, our study is the first to use a multimodal radiomics model to predict HER-2+ in breast cancer.
Multivariate analysis revealed that the presence of calcifications is an independent predictor of HER-2+ in breast cancer (p<0.01). Microcalcifications have been associated with higher malignancy levels in breast cancer.33 By incorporating the clinical model, Model_H1+US+Cli demonstrated even better performance compared to Model_H1+US. In studies involving similar tasks, our Model_H1+US+Cli outperformed the convolutional neural network (CNN)-based deep learning radiomics model developed by Quan et al (AUCs: 0.917 [training set] and 0.810 [test set], evaluated on breast ultrasound videos from 445 patients).34 This reconfirms the value of habitat imaging, which is the cornerstone of our innovative approach. Whereas the CNN model in Quan et al’s study analyzed the entire tumor region, habitat imaging provides deconstruction capability for the spatial ecosystem of tumors by identifying distinct habitats and characterizing their spatial relationships.
Interpretable machine learning techniques, such as SHAP, have effectively addressed the “black box” issue in model predictions.35 Our SHAP analysis identified original_firstorder_Skewness as the top contributor to the Habitat 1 model, while wavelet_LLH_gldm_SmallDependenceLowGrayLevelEmphasis was key for the ultrasound model. A negative original_firstorder_Skewness value (quantifying asymmetry in the voxel value histogram) promoted a HER2-positive prediction. This indicates that within Habitat Region 1, a negatively skewed DWI distribution (characterized by a long left tail and most voxels at higher signals) suggests HER2-positivity. This distribution reflects high heterogeneity: predominant mid-high DWI signals correspond to a dense, proliferative core tumor, while the low-signal tail likely indicates micro-necrotic foci.36 These foci may associate with HER2-positive cancer’s high proliferation, known to cause vascular compromise, elevated pressure, and hypoxia, leading to necrosis, as has been described in previous studies. Correspondingly, the wavelet_LLH_gldm_SmallDependenceLowGrayLevelEmphasis feature reflects the distribution characteristics of local texture details within low gray-level regions. The feature’s high value (positively contributing to the HER2-positive prediction) indicates scattered, isolated dark pixel areas on ultrasound. Interestingly, this imaging manifestation similarly points to potential necrotic regions. In addition, force plots for both positive and negative sample cases illustrated the contribution of each feature in individual patients, enabling the calculation of final Shapley values and supporting personalized prediction outcomes for each patient.
Our integrated model demonstrated high predictive accuracy in both training (AUC=0.951, Acc=0.892) and test sets (AUC=0.951, Acc=0.892), showing strong concordance with the IHC/FISH gold standard. Critically, unlike biopsies that sample only focal regions and fail to capture tumor-wide heterogeneity, our habitat imaging generates comprehensive heterogeneity maps, particularly highlighting subregions exhibiting higher association with HER2-positive expression. While not replacing gold-standard testing, the model serves as a valuable adjuvant tool aimed at enhancing efficiency, reducing costs, and alleviating clinical burden. For instance, upon successful prospective validation and clinical integration, the model could guide biopsy strategies: High-risk patients (probability >0.8) should receive prioritized biopsy with concurrent initial IHC/FISH testing to reduce repeat procedures, while low-risk patients (probability <0.3) could selectively forgo routine FISH testing though biopsy remains indicated. Moreover, during treatment monitoring, our approach enables real-time, repeatable assessment of HER2 status changes, facilitating timely therapeutic adjustments and reducing the need for serial biopsies – thereby alleviating patient trauma and financial strain. Furthermore, for equivocal pathology, extreme model probabilities (>0.9 or <0.1) provide strong radiological evidence; and in cases of insufficient/poor-quality samples, the model aids judgment on repeat biopsy necessity.
We acknowledge several limitations in our study. First, the retrospective, single-center design may limit the generalizability and external validity of our findings, which need to be validated through future prospective, multi-center, and larger sample size studies. Second, we used a semi-automatic method for tumor segmentation. In future research, we plan to explore fully automated segmentation methods. Third, the biological interpretation of radiomic habitat subregions remains theoretical without direct histopathological validation. We plan to validate these habitats through image-guided biopsies and correlate them with tumor microenvironment features using digital pathology.
Conclusion
In conclusion, this study successfully developed and validated an effective non-invasive tool for predicting HER-2 expression status in breast cancer. Specifically, the key innovation focuses on the utilization of advanced MRI habitat analysis to characterize tumor spatial heterogeneity. Building upon this foundation, we further developed an integrated multimodal model (Model_H1+US+Cli) that combines information derived from this novel MRI habitat approach with ultrasound and clinical data. Our findings demonstrate that this multimodal framework, leveraging the unique insights from MRI habitats, exhibited superior predictive performance compared to models based solely on MRI habitats, US, or clinical data. Therefore, exploring the combination of insights derived from advanced imaging phenotyping, such as MRI habitats, with other modalities and clinical data represents a promising direction for optimizing breast cancer radiomics models.
Abbreviations
AUCs, Areas Under the Curve; AFP, Alpha-fetoprotein; BMI, Body mass index; Breast Imaging-Reporting and Data System, BI-RADS; CA125, Cancer antigen 125; CA153, Cancer antigen 153; CA199, Cancer antigen 199; CEA, Carcinoembryonic antigen; CNN, convolutional neural network; CH, Calinski-Harabasz; DCA, Decision curve analysis; DCE, axial Dynamic contrast-enhanced; DCE1, First phase of Dynamic Contrast-Enhanced T1-Weighted Imaging; DCE2, Second phase of Dynamic Contrast-Enhanced T1-Weighted Imaging; DCE-T1, Dynamically enhanced T1-weighted; DWI, Axial single-shot diffusion-weighted imaging; ExtraTrees, Extremely Randomized Trees; FISH, Fluorescence in situ hybridization; FS, fat Suppression; GEP, Gene expression profile; HER-2, Human epidermal growth factor receptor-2; ICC, Intra-class correlation coefficient; IDI, Integrated Discrimination Improvement; IHC, Immunohistochemistry; LASSO, Least absolute shrinkage and selection operator; MHC, Major histocompatibility complex; MRI, Magnetic resonance imaging; ROIs, Regions of Interest; SHAP, Shapley Additive explanations; T1WI, Axial T1-weighted imaging; T2WI, Axial T2-weighted imaging; TIC, Time-Intensity Curve; TMB, Tumor mutational burden; TNBC, Triple-negative breast cancer; US, Ultrasound; VIF, Variance inflation factor; VOIs, Volumes of interest.
Data Sharing Statement
The data that support the findings of this study are available from the corresponding author upon reasonable request.
Ethics Approval and Informed Consent
The institutional review board granted approval for this retrospective investigation in accordance with the Declaration of Helsinki, and waived the need for informed consent (approval number:2024-E530-01).
Author Contributions
All authors made a significant contribution to the work reported, whether that is in the conception, study design, execution, acquisition of data, analysis and interpretation, or in all these areas; took part in drafting, revising or critically reviewing the article; gave final approval of the version to be published; have agreed on the journal to which the article has been submitted; and agree to be accountable for all aspects of the work.
Funding
The authors state that this work has not received any funding.
Disclosure
The authors of this manuscript declare no relationships with any companies, whose products or services may be related to the subject matter of the article. The authors report no conflicts of interest in this work.
References
1. Sung H, Ferlay J, Siegel RL, et al. Global Cancer Statistics 2020: GLOBOCAN Estimates of Incidence and Mortality Worldwide for 36 Cancers in 185 Countries. Ca a Cancer J Clinicians. 2021;71(3):209–249. doi:10.3322/caac.21660
2. Fernandes CL, Silva DJ, Mesquita A. Novel HER-2 Targeted Therapies in Breast Cancer. Cancers. 2023;16(1):87. doi:10.3390/cancers16010087
3. Kreutzfeldt J, Rozeboom B, Dey N, De P. The trastuzumab era: current and upcoming targeted HER2+ breast cancer therapies. Am J Cancer Res. 2020;10(4):1045–1067.
4. Zhu S, Wu Y, Song B, et al. Recent advances in targeted strategies for triple-negative breast cancer. J Hematol Oncol. 2023;16(1):100. doi:10.1186/s13045-023-01497-3
5. Wolff AC, Hammond MEH, Allison KH, et al. Human Epidermal Growth Factor Receptor 2 Testing in Breast Cancer: American Society of Clinical Oncology/College of American Pathologists Clinical Practice Guideline Focused Update. J Clin oncol. 2018;36(20):2105–2122. doi:10.1200/jco.2018.77.8738
6. Yoen H, Chung HA, Lee SM, Kim ES, Moon WK, Ha SM. Hemorrhagic Complications Following Ultrasound-Guided Breast Biopsy: a Prospective Patient-Centered Study. Korean J Radiol. 2024;25(2):157–165. doi:10.3348/kjr.2023.0874
7. Grassini D, Cascardi E, Sarotto I, et al. Unusual Patterns of HER2 Expression in Breast Cancer: insights and Perspectives. Pathobiology. 2022;89(5):278–296. doi:10.1159/000524227
8. Geisel J, Raghu M, Hooley R. The Role of Ultrasound in Breast Cancer Screening: the Case for and Against Ultrasound. Seminars Ultrasound, CT, and MR. 2018;39(1):25–34. doi:10.1053/j.sult.2017.09.006
9. Sumkin JH, Berg WA, Carter GJ, et al. Diagnostic Performance of MRI, Molecular Breast Imaging, and Contrast-enhanced Mammography in Women with Newly Diagnosed Breast Cancer. Radiology. 2019;293(3):531–540. doi:10.1148/radiol.2019190887
10. Szep M, Pintican R, Boca B, et al. Multiparametric MRI Features of Breast Cancer Molecular Subtypes. Medicina. 2022;58(12):1716. doi:10.3390/medicina58121716
11. Shaikh S, Rasheed A. Predicting Molecular Subtypes of Breast Cancer with Mammography and Ultrasound Findings: introduction of Sono-Mammometry Score. Radiol Res Practice. 2021;2021:6691958. doi:10.1155/2021/6691958
12. Liu Z, Wang S, Dong D, et al. The Applications of Radiomics in Precision Diagnosis and Treatment of Oncology: opportunities and Challenges. Theranostics. 2019;9(5):1303–1322. doi:10.7150/thno.30309
13. Wang S, Sun Y, Li R, et al. Diagnostic performance of perilesional radiomics analysis of contrast-enhanced mammography for the differentiation of benign and malignant breast lesions. Eur Radiol. 2022;32(1):639–649. doi:10.1007/s00330-021-08134-y
14. Gu J, Tong T, Xu D, et al. Deep learning radiomics of ultrasonography for comprehensively predicting tumor and axillary lymph node status after neoadjuvant chemotherapy in breast cancer patients: a multicenter study. Cancer. 2023;129(3):356–366. doi:10.1002/cncr.34540
15. Zheng S, Yang Z, Du G, et al. Discrimination between HER2-overexpressing, -low-expressing, and -zero-expressing statuses in breast cancer using multiparametric MRI-based radiomics. Eur Radiol. 2024. doi:10.1007/s00330-024-10641-7
16. Liu Y, Wang Y, Wang Y, et al. Early prediction of treatment response to neoadjuvant chemotherapy based on longitudinal ultrasound images of HER2-positive breast cancer patients by Siamese multi-task network: a multicentre, retrospective cohort study. EClinicalMedicine. 2022;52:101562. doi:10.1016/j.eclinm.2022.101562
17. Cui H, Sun Y, Zhao D, et al. Radiogenomic analysis of prediction HER2 status in breast cancer by linking ultrasound radiomic feature module with biological functions. J Transl Med. 2023;21(1):44. doi:10.1186/s12967-022-03840-7
18. Wang H, Sang L, Xu J, Hunag C, Hunag Z. Multiparametric MRI-based radiomic nomogram for predicting HER-2 2+ status of breast cancer. Heliyon. 2024;10(9):e29875. doi:10.1016/j.heliyon.2024.e29875
19. Khan SU, Fatima K, Aisha S, Malik F. Unveiling the mechanisms and challenges of cancer drug resistance. CCS. 2024;22(1):109. doi:10.1186/s12964-023-01302-1
20. Wu J, Mayer AT, Li R. Integrated imaging and molecular analysis to decipher tumor microenvironment in the era of immunotherapy. Semi Cancer Biol. 2022;84:310–328. doi:10.1016/j.semcancer.2020.12.005
21. Zhang Y, Yang C, Sheng R, Dai Y, Zeng M. Predicting the recurrence of hepatocellular carcinoma (≤ 5 cm) after resection surgery with promising risk factors: habitat fraction of tumor and its peritumoral micro-environment. La Radiologia medica. 2023;128(10):1181–1191. doi:10.1007/s11547-023-01695-6
22. Wang Q, Lin Y, Ding C, et al. Multi-modality radiomics model predicts axillary lymph node metastasis of breast cancer using MRI and mammography. Eur Radiol. 2024. doi:10.1007/s00330-024-10638-2
23. Wang X, Xu C, Grzegorzek M, Sun H. Habitat radiomics analysis of pet/ct imaging in high-grade serous ovarian cancer: application to Ki-67 status and progression-free survival. Front Physiol. 2022;13:948767. doi:10.3389/fphys.2022.948767
24. Zhao H, Su Y, Wang Y, et al. Using tumor habitat-derived radiomic analysis during pretreatment (18)F-FDG PET for predicting KRAS/NRAS/BRAF mutations in colorectal cancer. Cancer Imag. 2024;24(1):26. doi:10.1186/s40644-024-00670-2
25. Wang S, Liu X, Wu Y, et al. Habitat-based radiomics enhances the ability to predict lymphovascular space invasion in cervical cancer: a multi-center study. Front Oncol. 2023;13:1252074. doi:10.3389/fonc.2023.1252074
26. Wu J, Gensheimer MF, Zhang N, et al. Tumor Subregion Evolution-Based Imaging Features to Assess Early Response and Predict Prognosis in Oropharyngeal Cancer. J Nucl Med. 2020;61(3):327–336. doi:10.2967/jnumed.119.230037
27. Chen L, Liu K, Zhao X, Shen H, Zhao K, Zhu W. Habitat Imaging-Based (18)F-FDG PET/CT Radiomics for the Preoperative Discrimination of Non-small Cell Lung Cancer and Benign Inflammatory Diseases. Front Oncol. 2021;11:759897. doi:10.3389/fonc.2021.759897
28. Nijman S, Leeuwenberg AM, Beekers I, et al. Missing data is poorly handled and reported in prediction model studies using machine learning: a literature review. J Clin Epidemiol. 2022;142:218–229. doi:10.1016/j.jclinepi.2021.11.023
29. Kang F, Mu W, Gong J, et al. Integrating manual diagnosis into radiomics for reducing the false positive rate of (18)F-FDG PET/CT diagnosis in patients with suspected lung cancer. Eur J Nucl Med Mol Imaging. 2019;46(13):2770–2779. doi:10.1007/s00259-019-04418-0
30. Giannini V, Mazzetti S, Bertotto I, et al. Predicting locally advanced rectal cancer response to neoadjuvant therapy with (18)F-FDG PET and MRI radiomics features. Eur J Nucl Med Mol Imaging. 2019;46(4):878–888. doi:10.1007/s00259-018-4250-6
31. Lv W, Yuan Q, Wang Q, et al. Radiomics Analysis of PET and CT Components of PET/CT Imaging Integrated with Clinical Parameters: application to Prognosis for Nasopharyngeal Carcinoma. Mol Imag biol. 2019;21(5):954–964. doi:10.1007/s11307-018-01304-3
32. Umutlu L, Kirchner J, Bruckmann NM, et al. Multiparametric Integrated (18)F-FDG PET/MRI-Based Radiomics for Breast Cancer Phenotyping and Tumor Decoding. Cancers. 2021;13(12):2928. doi:10.3390/cancers13122928
33. O’Grady S, Morgan MP. Microcalcifications in breast cancer: from pathophysiology to diagnosis and prognosis. Biochim Biophys Acta Rev Cancer. 2018;1869(2):310–320. doi:10.1016/j.bbcan.2018.04.006
34. Quan MY, Huang YX, Wang CY, Zhang Q, Chang C, Zhou SC. Deep learning radiomics model based on breast ultrasound video to predict HER2 expression status. Front Endocrinol. 2023;14:1144812. doi:10.3389/fendo.2023.1144812
35. Ali S, Akhlaq F, Imran AS, Kastrati Z, Daudpota SM, Moosa M. The enlightening role of explainable artificial intelligence in medical & healthcare domains: a systematic literature review. Comput Biol Med. 2023;166:107555. doi:10.1016/j.compbiomed.2023.107555
36. Juhász P, Méhes G. Tumor Hypoxia: how Conventional Histology Is Reshaped in Breast Carcinoma. Int J Mol Sci. 2025;26(9):4423. doi:10.3390/ijms26094423
 © 2025 The Author(s). This work is published and licensed by Dove Medical Press Limited. The
full terms of this license are available at https://www.dovepress.com/terms
and incorporate the Creative Commons Attribution
- Non Commercial (unported, 4.0) License.
By accessing the work you hereby accept the Terms. Non-commercial uses of the work are permitted
without any further permission from Dove Medical Press Limited, provided the work is properly
attributed. For permission for commercial use of this work, please see paragraphs 4.2 and 5 of our Terms.
© 2025 The Author(s). This work is published and licensed by Dove Medical Press Limited. The
full terms of this license are available at https://www.dovepress.com/terms
and incorporate the Creative Commons Attribution
- Non Commercial (unported, 4.0) License.
By accessing the work you hereby accept the Terms. Non-commercial uses of the work are permitted
without any further permission from Dove Medical Press Limited, provided the work is properly
attributed. For permission for commercial use of this work, please see paragraphs 4.2 and 5 of our Terms.
Recommended articles
Diagnostic Value of Artificial Intelligence in Minimal Breast Lesions Based on Real-Time Dynamic Ultrasound Imaging
Qu C, Xia F, Chen L, Li HJ, Li WM
International Journal of General Medicine 2024, 17:4061-4069
Published Date: 14 September 2024
Comparison of MRI and Ultrasound for Evaluation of Axillary Lymph Node Status in Early Breast Cancer
Li L, Zhao J, Li F, Pan Z
Cancer Management and Research 2024, 16:1685-1692
Published Date: 29 November 2024
Predicting Axillary Lymph Node Metastasis in Breast Cancer Using Ultrasound and Machine Learning with SHAP
Bai G, Zhong X, Wu Y, Lin W, Zhou S, Zhou P
Cancer Management and Research 2025, 17:2183-2197
Published Date: 26 September 2025
Accuracy and Influencing Factors of Axillary Lymph Node Ultrasound Assessment After Neoadjuvant Chemotherapy in Breast Cancer
Peng LQ, Tang X, Yang GX, Zhu Y
Breast Cancer: Targets and Therapy 2025, 17:967-976
Published Date: 26 October 2025
Development and Validation of a Radiomics-Based Nomogram for Predicting HER-2 Status in Breast Cancer: A Retrospective Study with Small Validation Cohort
Qiu Q, Chen C, Chen J, Liao C, Tang L
Breast Cancer: Targets and Therapy 2025, 17:1119-1132
Published Date: 2 December 2025