Back to Journals » Journal of Pain Research » Volume 12
Population pharmacokinetic modeling to facilitate dose selection of tapentadol in the pediatric population
Authors Watson E ![]() , Khandelwal A, Freijer J
, Khandelwal A, Freijer J ![]() , van den Anker J, Lefeber C
, van den Anker J, Lefeber C ![]() , Eerdekens M
, Eerdekens M ![]()
Received 12 March 2019
Accepted for publication 26 July 2019
Published 14 October 2019 Volume 2019:12 Pages 2835—2850
DOI https://doi.org/10.2147/JPR.S208454
Checked for plagiarism Yes
Review by Single anonymous peer review
Peer reviewer comments 2
Editor who approved publication: Dr Katherine Hanlon
Estelle Watson,1 Akash Khandelwal,1 Jan Freijer,1 John van den Anker,2,3 Claudia Lefeber,1 Mariëlle Eerdekens1
1Grünenthal GmbH, Aachen, Germany; 2Division of Paediatric Pharmacology and Pharmacometrics, University of Basel Children’s Hospital, Basel, Switzerland; 3Division of Clinical Pharmacology, Children’s National Medical Center, Washington, DC, USA
Correspondence: Estelle Watson
Grünenthal GmbH, Zieglerstraße 6, 52078 Aachen, Germany
Tel +49 241 569 2141
Email [email protected]
Objective: The main aim of this analysis was to characterize the pharmacokinetics (PK) of the strong analgesic tapentadol in 2-year-old to <18-year-old patients with acute pain and to inform the optimal dosing strategy for a confirmatory efficacy trial in this patient population.
Methods: The analysis dataset included tapentadol concentrations obtained from 92 pediatric patients receiving a single tapentadol oral solution (OS) dose of 1.0 mg/kg bodyweight in two single-dose PK clinical trials. Population PK analysis was performed using nonlinear mixed effects modeling. Simulations were performed to identify tapentadol OS doses in pediatric subjects (2 to <18 years) that would produce exposures similar to those in adults receiving safe and efficacious doses of tapentadol IR (50–100 mg every 4 hrs).
Results: Tapentadol PK in children aged from 2 to <18 years was best described by a one-compartment model. Mean population apparent clearance and apparent volume of distribution for a typical subject weighing 45 kg were 170 L/h and 685 L, respectively. Clearance, expressed in bodyweight units as L/h/kg, decreased with increasing age whereas total clearance (L/h) increased with increasing age. Model-based simulations suggested that a tapentadol OS dose of 1.25 mg/kg to children and adolescents aged 2 to <18 years would result in efficacious tapentadol exposures similar to those in adults receiving tapentadol immediate release 50–100 mg every 4 hrs. The proposed tapentadol OS dose was subsequently applied in a confirmatory efficacy trial in 2 to <18-year-old patients suffering from acute postsurgical pain.
Conclusion: This analysis provides an example of a model-based approach for a dose recommendation to be used in an efficacy trial in the pediatric population. Uniform dosing based on bodyweight was proposed for the treatment of acute pain in children aged from 2 to <18 years.
Keywords: tapentadol, pediatric, pain management, dosing, nonlinear mixed effects modeling
Introduction
Infants and children of all ages (including neonates) are able to perceive and experience pain.1,2 The prevalence of pain and the consequences of leaving such pain untreated in this vulnerable population have been described in a recent review,3 the first article in the thematic series “Tapentadol for moderate to severe acute pain in children and adolescents”. Severely ill children in the postsurgical setting often receive a multitude of medications, while most of the currently used analgesics have not been systematically studied in the neonatal and pediatric population,4,5 and off-label use of these medications is therefore very common.3
Tapentadol is a centrally acting strong analgesic that acts through μ-opioid receptor agonism (MOR) and noradrenaline reuptake inhibition (NRI).6 An immediate release (IR), a prolonged release (PR), and an oral solution (OS) formulation are approved for pain treatment in adults. The combination of the two synergistic mechanisms of action in one molecule provides an inherent advantage for effective pain management: in addition to effective pain relief, tapentadol also has the potential to mitigate opioid-specific side effects owing to a reduced MOR-related effect, ie a reduced µ-load.6,7 Tapentadol has a number of other characteristics which make the compound attractive for development in a pediatric population. Owing to the metabolic degradation pathway of tapentadol (primarily phase 2 glucuronidation and sulfation),8 tapentadol has a low potential for cytochrome P450 (CYP450)-based drug interactions.9 Coadministration of marketed drugs which are known to be either enzyme inducers or enzyme inhibitors of a CYP450 enzyme are unlikely to have any relevant effect on tapentadol metabolism as a relatively small amount (15%) of tapentadol is metabolized via CYP450.8 Clinically relevant interactions related to phase 2 metabolism are also unlikely to occur since glucuronidation is a high capacity system and concentrations of other coadministered drugs are generally below the concentrations required for potential inhibition of glucuronidation. This was shown in a number of interaction studies in adults using potential inhibitors of glucuronidation.10,11 The low involvement of CYP450 enzymes in tapentadol metabolism also makes reliable analgesia possible for a wider section of the pediatric population irrespective of their poor or extensive metabolizer status concerning polymorphic CYP450 enzymes. Furthermore, tapentadol has a predictable pharmacokinetic (PK) profile12 with no metabolites contributing to the analgesic effect,8 thereby simplifying its use in practice for the treating pediatric physician.
One of the major challenges in pediatric drug development is the determination of the appropriate dose and dose regimen. A recent survey suggests that about 25% of pediatric efficacy trials failed due to incorrect dosing.13 Population pharmacokinetic (PopPK) modeling can be used to characterize PK, to understand the impact of covariates on the PK of a drug, and to determine appropriate doses to achieve exposures that are known to be efficacious. The use of PopPK models is increasingly accepted by the regulatory authorities,14,15 also in support of label extension to the pediatric population. This article describes the use of PopPK modeling for tapentadol for a pediatric population (2 to <18 years) using data collected in the first two single-dose PK trials conducted with tapentadol.16,17 Tapentadol PK was characterized, including covariate effects and evaluation of the various sources of variability after single-dose administration of tapentadol OS. A dose for 2-year-old to <18-year-old children in a subsequent multiple-dose efficacy trial was proposed based on simulations performed with this developed PopPK model.
Patients and methods
Clinical trial design and patient population
Data derived from two single-dose phase 2 PK trials of tapentadol OS in children aged 2 to <18 years were used for PopPK model identification. Both trials were open label evaluating the PK profile, safety, and efficacy of tapentadol OS for the treatment of postsurgical pain in children and adolescents and are registered at www.clinicaltrials.gov (NCT01134536 and NCT01729728). Both trials were conducted in accordance with the Declaration of Helsinki and Good Clinical Practice guidelines; trial protocols and amendments were approved by independent ethics committees/institutional review boards in the participating countries (supplementary materials). Written informed consent was obtained from the parent(s)/legal guardian(s) and/or patient if applicable. The two trials are fully described in the thematic tapentadol series.16,17 Patients were stratified into three age groups: 12 to <18 years (group 1), 6 to <12 years (group 2), and 2 to <6 years (group 3). A staggered approach was followed for the recruitment of subjects. ie group 1 was recruited first followed by group 2 and then group 3.
Two strengths of tapentadol OS (4 mg/mL and 20 mg/mL) were available for use in the trials. The selection of appropriate dose (1 mg/kg) and strength of the OS were based on the bodyweight of the patient: patients with a bodyweight <20 kg were administered the 4 mg/mL solution and those with a bodyweight ≥20 kg received the 20 mg/mL solution. The total dose of tapentadol OS administered to each patient did not exceed 75 mg.
PK assessments
The planned number of PK samples drawn for the determination of serum concentrations of tapentadol and its major O-glucuronide metabolite varied between age groups. Eight venous blood samples (frequent sampling) were taken at specific time points 0.25, 0.5, 1, 2, 4, 6, 11, and 15 hrs (12 to <18 years), four venous blood samples were taken within four time windows of 0.25–1, 1–4, 4–11, and 11–15 hrs (6 to <12 years), two venous blood samples were taken within two time windows of 15 mins to 1 hr and 4 to 11 hrs (3–5 years), and four venous blood samples were taken at specific time points 1.25, 3, 5, and 8 hrs (2 years).
Population PK modeling
Data set
A total of 109 patients aged 2 to <18 years old were treated with 1.0 mg/kg tapentadol in the two PK studies.16,17 From these subjects, 462 blood samples were taken for tapentadol evaluation. Seventeen patients and their plasma concentrations (a total of 38 samples, representing 8% of the samples) were excluded from the analysis as they either vomited within 3 hrs of tapentadol intake or did not take the complete dose of tapentadol. Overall only 3% of the samples were below the lower limit of quantification (LOQ) of 0.2 ng/mL and were mainly from subjects who vomited or did not take the complete tapentadol dose. In total 424 tapentadol plasma concentrations from 92 patients were used for model building and evaluation. All subjects with at least one quantifiable serum concentration were included in the analysis. Age, bodyweight, and sex of the analysis population are listed in Table 1. Although serum concentrations for the tapentadol-O-glucuronide metabolite were also measured in these trials, this publication focuses on the modeling approach used for the active moiety tapentadol; the O-glucuronide metabolite does not contribute to the analgesic activity of tapentadol.
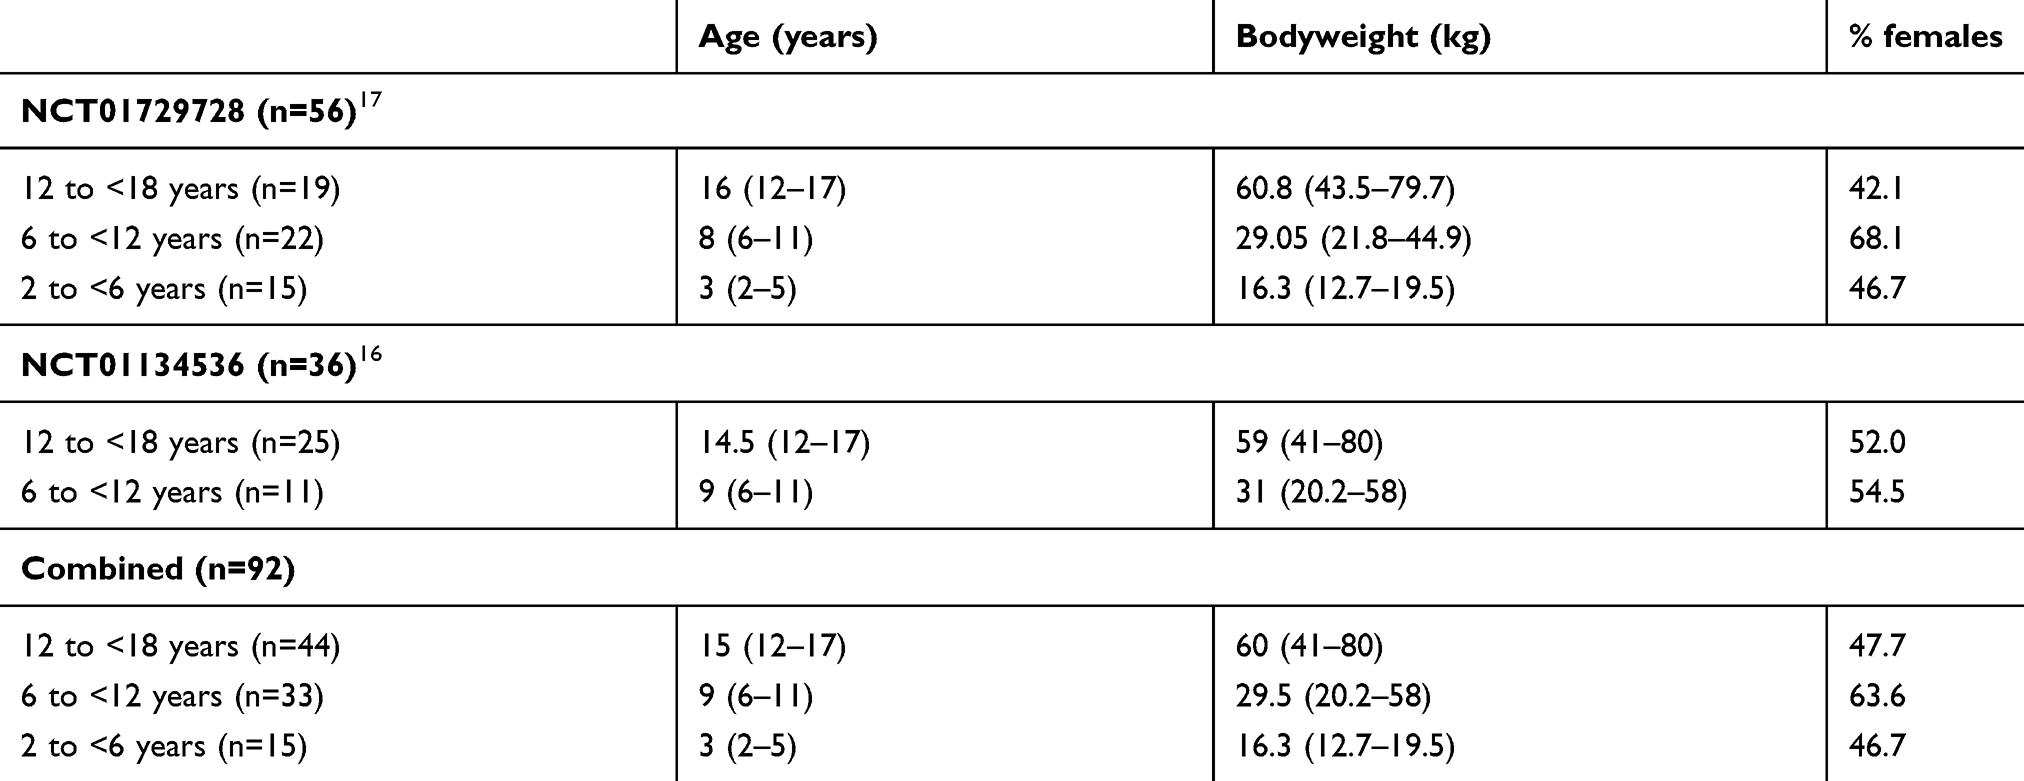 |
Table 1 Age, bodyweight, and sex (% females) of the trial populations |
Model development
PopPK modeling was performed with a nonlinear mixed effects approach, as implemented in NONMEM (version 7.2, ICON development Solutions, Ellicott City, MD, USA). Model parameters were estimated by fitting the model to the data and minimizing an objective function (OFV) based on the log likelihood (−2×LL). The first-order method with conditional estimation and interaction was used for minimizing the objective function. R (version 3.0.1) and Xpose (version 4.0) were used for data exploration and visualization as well as model diagnostics and model comparison.18 PsN 3.6.2 was used for model execution and bootstrapping, and visual predictive check.19 The calculations were performed using a validated pharmacometrics computational platform running on a red hat linux x86_64 environment. Serum samples below LOQ were excluded from analysis and not imputed or replaced with the LOQ value.
Various 1 and 2 compartment models were tested to determine the best fit to the observed data.
The interindividual variability (IIV) was included in structural model parameters as follows:

where Pi is the individual parameter estimate for individual i, and Ptv is the typical population parameter estimate, ηi a random effects realization, assumed to be normally distributed with mean 0 and variance ω2. The correlation between variability components was also tested.
The residual variability was tested as both proportional and as a combination of an additive and proportional error:

where Co,ij represents observed concentration j for individual i and Cp,ij represents predicted concentration j for individual i; ε1,ij and ε2,ij are normally distributed with mean 0 and variance σ2. The subscripts 1 and 2 represent the contribution of proportional and additive error components, respectively.
Covariate analysis
Demographics and clinical laboratory measurements were included for covariate analysis. The effect of age, sex, aspartate transaminase (AST), alanine transaminase (ALT), alkaline phosphatases (ALP), and bilirubin were tested on both clearance (CL/F) and volume of distribution (V/F). The effect of creatinine clearance (CRCL) on CL/F was also investigated. The covariate analysis was performed on a base model with bodyweight as the size descriptor in the pediatric population applied to CL/F and to V/F. A power function was used to describe the influence of bodyweight on CL/F and V/F, in which the exponents were also estimated rather than being fixed to 0.75 and 1.0, respectively.
Covariates other than bodyweight were studied by forward addition and backward elimination using stepwise covariate model (SCM) building as implemented in Perl-speaks-NONMEM version 3.6.2. In the SCM, each covariate relationship was first tested in a univariate fashion. The covariate model that resulted in the lowest significant drop in the objective function value (OFV) was carried forward. In the forward step, statistical significance was defined as a decrease in the OFV by more than 3.84 (chi-square distribution; p<0.05; 1 degree of freedom). This step was repeated for the remaining parameter–covariate relationships until no more covariates could be included. In the backward deletion step, each parameter–covariate relationship was then left out one at a time and tested using a statistical significance criterion of 1% (an increase in the OFV of at least 6.635 for 1 degree of freedom). This step was repeated until no more covariates could be excluded.
All continuous covariates were implemented using a power function:
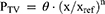
where the parameter value Ptv is a function of covariate x, θ is the parameter estimate at the reference value of the covariate, xref, which was set to the median of the covariate value in the study population, and n is an estimated exponent.
For categorical covariates (eg sex), the following relationship was used:
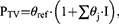
where the parameter PTV is equal to θref for the reference category (eg male), and θj the multiplicative difference with the reference value for all other categories j, and I is an indicator vector with the size of the number of categories minus the reference, which is 1 if the individual covariate category matches category j, and 0 if it does not match category j.
Criteria for model selection
Model selection was guided by assessing the reduction of the OFV when comparing two models of different complexity, the standard error of the parameter estimates, scientific plausibility, and goodness-of-fit plots. The latter included plots of observed values (DV) versus population prediction (PRED) and DV versus individual prediction (IPRED), to evaluate for concordance with the line of identity; plots of conditional population residual (conditional weighted residuals [CWRES]) versus time and population prediction versus time were used to evaluate random distribution of the residuals around the zero line. Histograms of the individual random effects were constructed to assess the normality of the subject-specific random effects. Histograms of the CWRES were used to ensure that the residuals were unimodal and symmetrically distributed around zero.
Model evaluation
Evaluation of the parameter uncertainty was performed via stratified bootstrap sampling with replacement. The stratification was based on age groups so that the proportion of subjects and number of samples in each replicate was similar to the original dataset. A random 500 bootstrap samples were generated, and parameters were re-estimated for each of the bootstrap samples. The median and 2.5, and 97.5% quantiles from the bootstrap estimates were compared with the NONMEM estimates and 95% confidence intervals derived from the covariance matrix of these estimates. In addition, a Visual Predictive Check (VPC) was performed by simulating 2000 datasets using the final parameter estimates. The observed concentration data were then compared with the simulated concentrations.
Simulation to inform dose selection for efficacy trial
Exposure distributions were simulated at various OS dose levels to inform the selection of a dose for an efficacy trial that would match the range for adequate efficacy in adults. To this end, 3000 virtual subjects aged 2 to <18 years (1000 subjects in each age group) were simulated keeping the correlation between age and bodyweight as observed in the two previous single-dose trials in children aged from 2 up to <18 years of age.16,17 The lowest and highest bodyweight (kg) were set to the 2.5th and 97.5th percentile of the Center for Disease Control growth charts.20 Pediatric subjects were simulated to receive either 1 mg/kg, 1.25 mg/kg, or 1.5 mg/kg every 4 hrs for 5 days. The final model was used to simulate the exposure in the simulated pediatric population at the different dosing scenarios. Corresponding simulated exposure distributions were generated for adults using a previously published adult PopPK model.21 Simulations of adult exposures were performed for 50, 75, and 100 mg IR every 4 hrs for 5 days.
Results
The proportion of males and females enrolled in the two trials were virtually equal, with 46.7% males and 53.3% females enrolled. Their mean (SD) bodyweight and age were 43 (19.7) kg and 11 (4.7) years, respectively (Table 1). The bodyweight and age, as expected in this age range, were highly correlated (r=0.92). The tapentadol concentration-time data obtained from these subjects, stratified by age groups, are displayed in Figure 1.
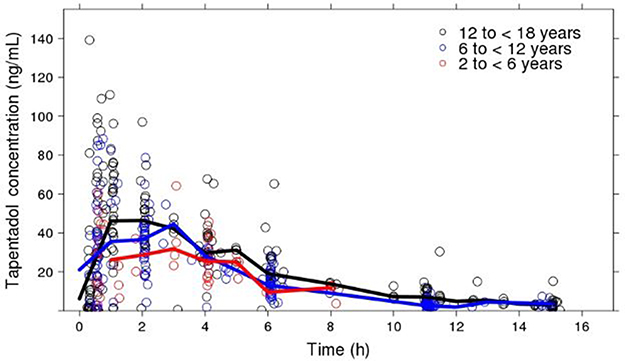 |
Figure 1 Scatter plot of observed tapentadol concentration versus time. The open circles represent the observed tapentadol concentrations and the lines represent the median concentrations. |
The final population model was best described as a 1-compartment model with linear oral absorption from a dose compartment into the central compartment, with a lag time and linear elimination from the central compartment. Estimated allometric scaling on CL/F and V/F was also found to give a significant reduction in OFV and improvement in fit compared to fixing the values to the standard 0.75 and 1, respectively. Interindividual variability was best described using a full correlation matrix between the parameters, while the residual error was best described with a proportional and additive error model.
The population values and variability of the parameters in the final PK model for tapentadol were estimated with good precision. Estimates for a typical 45-kg subject based on the final model were CL/F =170 L/h, V/F =685 L, Ka =2.03 h−1, and lag time =0.247 h (Table 2). The exponents for the effect of weight (WT) on CL/F and V/F were 0.638 and 0.847, respectively. The IIV on CL/F, V/F, and Ka was 21.8%, 15.5%, and 141.1%, respectively. The estimated correlations between CL-V, CL-KA, and V-KA were 0.88, 0.03, and −0.33, respectively. The residual additive and proportional error variabilities were 0.181 ng/mL and 32.9%, respectively. Shrinkage was less than 25% for all random effect parameters.
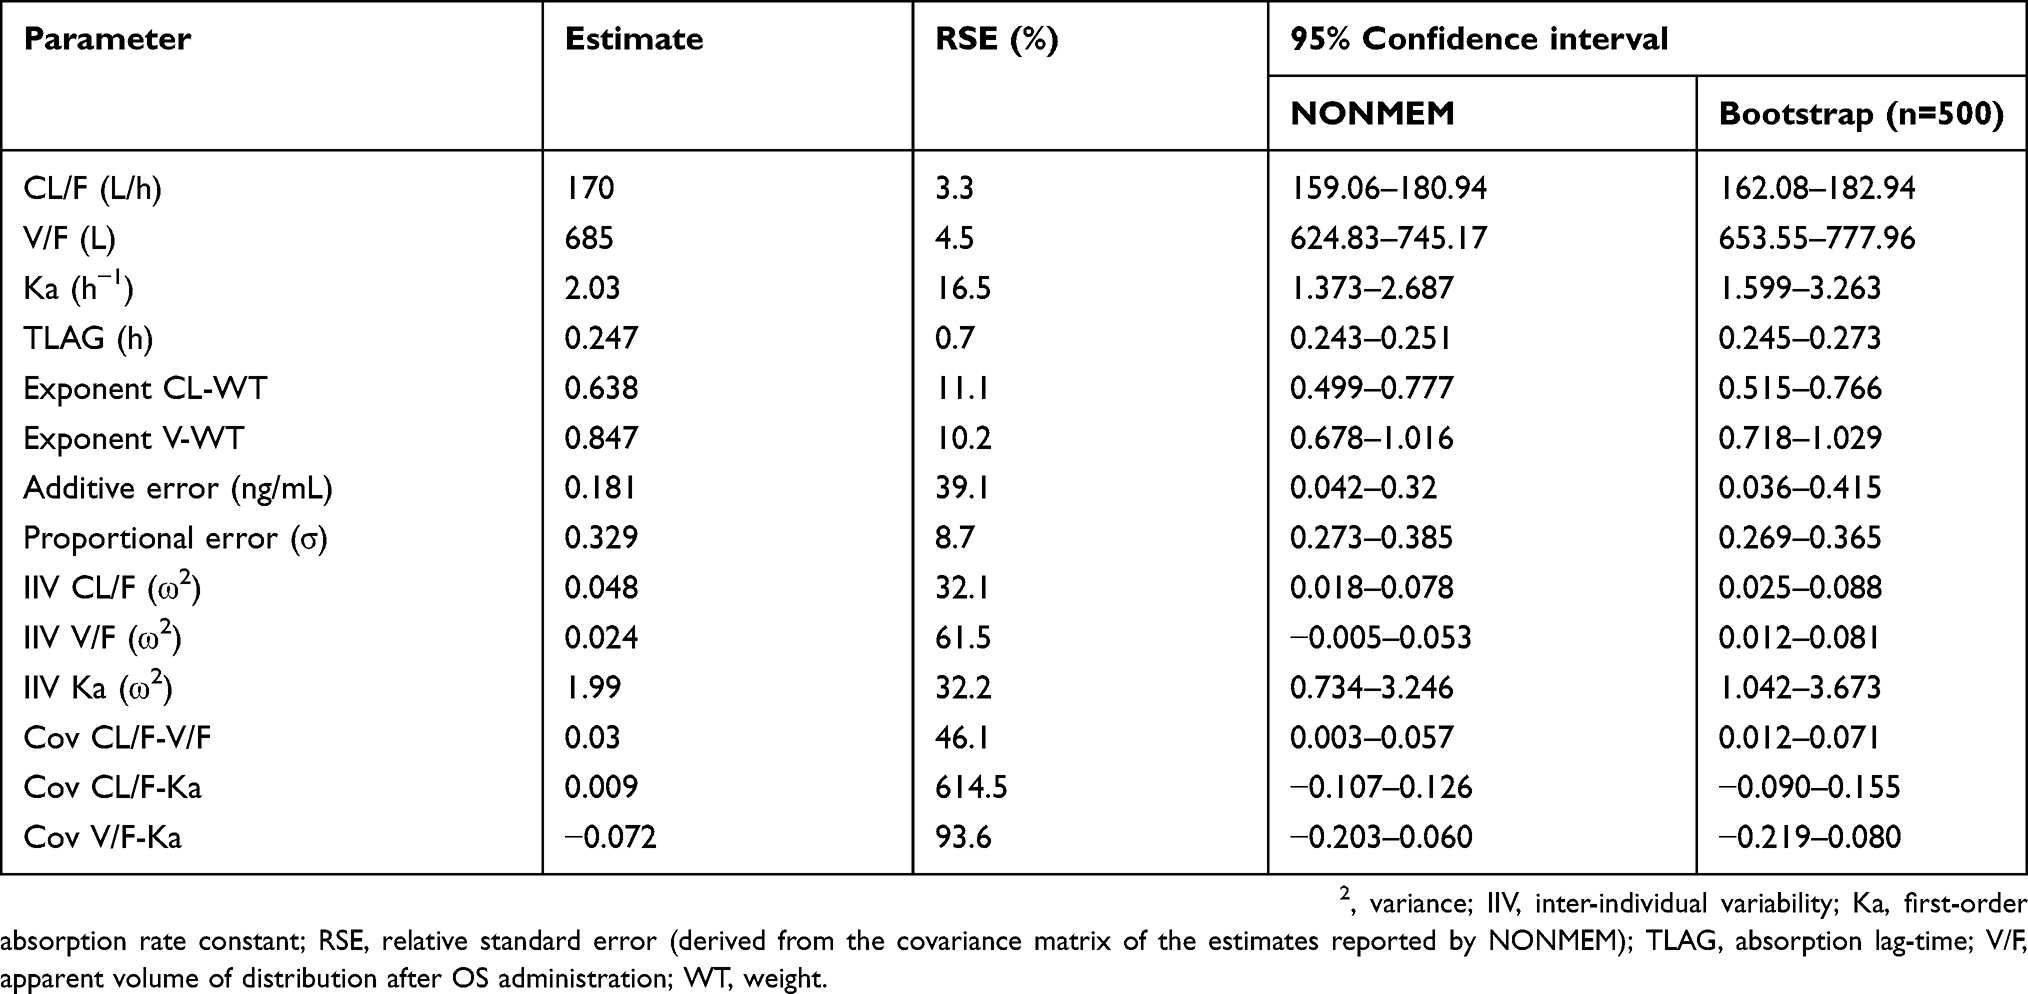 |
Table 2 Final tapentadol population pharmacokinetics parameter estimates and 95% confidence intervals. Estimates of CL/F and V/F relate to a reference weight of 45 kg |
Figure 2 displays the goodness of fit plots. The upper two panels show the observed versus the population predicted and individual predicted observations, respectively, on a log scale. The data are evenly distributed between the line of identity in plots of population predicted and individual predicted concentrations versus observed concentrations. Additionally, the reduced scattering in the plot with the individual predicted concentrations compared with the population predicted concentrations demonstrates that individual variability can be accounted for by the random effects. The plot of CWRES vs population predictions and time shows that the residuals are randomly distributed around the population predictions and time and stay within the limits of ±2 times the normalized standard deviation (Figure 2). The histogram of the CWRES shows an unimodal distribution and is symmetrically distributed around zero (Figure S1). Histograms of the individual random effects show normality of the subject-specific random effects (Figure S1).
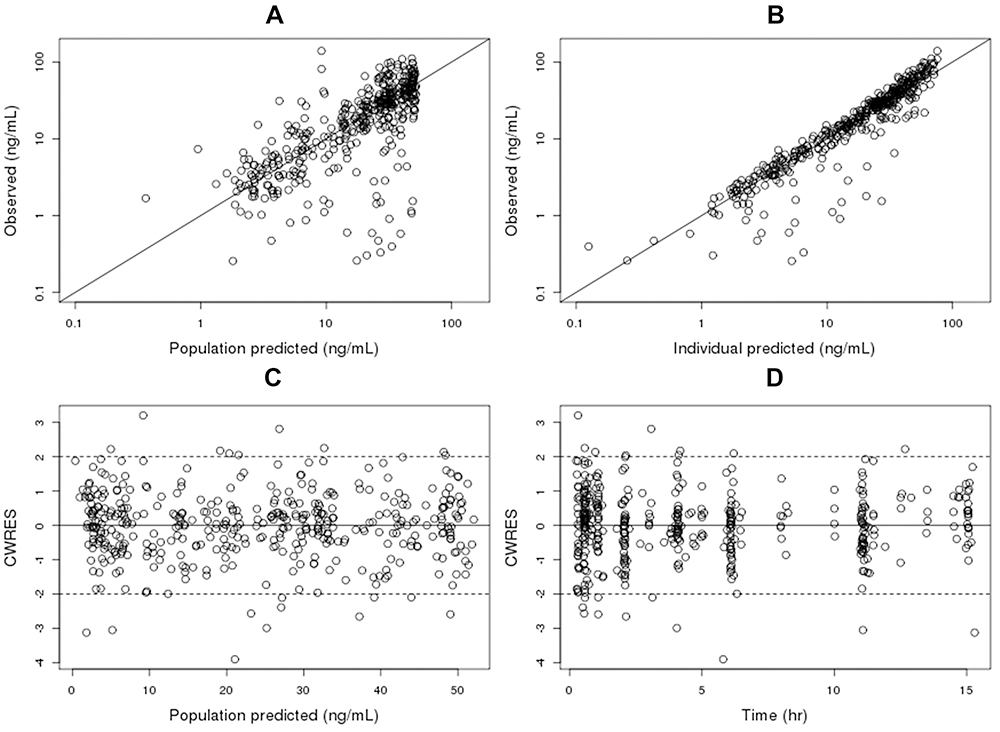 |
Figure 2 Plot of observed tapentadol concentration versus population predicted (A), observed tapentadol concentration versus individual predicted (B), conditional weighted residuals versus population predicted (C), conditional weighted residuals versus time (D). The black represents the identity line (A, B) or the zero line (C, D). Abbreviation: CWRES, conditional weighted residuals. |
The VPC plot for tapentadol plasma concentrations shows the agreement of the model prediction with the observed data (Figures 3 and S2). The VPC indicates that simulated data from the final model are similar to the observed data. The relative standard errors of fixed effects parameters from the bootstrap were all below 20% and the derived 95% CIs are close to those derived from the covariance matrix of the estimates (Table 2). This suggests that the parameter estimates are robust and insensitive to inclusion or exclusion of different individuals. These results together with the goodness-of-fit plots indicate acceptable model performance.
 |
Figure 3 Simulated concentration-time curve for the pediatric population (2 to <18 years) using final parameter estimates from the population pharmacokinetic model, showing the variability (blue area, representing the 95% prediction interval) and central trend (red line: median prediction), together with the observations (open circles). Abbreviation: y, years. |
During the first iteration of the forward inclusion, the addition of ALP, ALT, and CRCL on CL/F and ALP on V/F resulted in a significant drop in the objective function value. The most significant reduction in OFV (ΔOFV =6.16) occurred after the addition of ALT on CL/F and hence this covariate was carried forward. The final forward inclusion model contained the effect of ALT on CL/F and of AST on V/F. However, during backward deletion, both these covariates were removed from the model as they did not significantly decrease the objective function value. Therefore, the final model was the same as the original base model, ie the base model with bodyweight as size descriptor for V/F and CL/F.
The median (range) empirical Bayesian estimates for CL/F in 12 to <18 years, 6 to <12 years, and 2 to <6 years were 3.45 L/h/kg (1.65–4.43 L/h/kg), 4.47 L/h/kg (2.94–6.67 L/h/kg), and 5.28 L/h/kg (3.89–6.32 L/h/kg), respectively. The median (range) empirical Bayesian estimates for V/F in 12 to <18 years, 6 to <12 years, and 2 to <6 years were 14.54 L/kg (9.93–19.33 L/kg), 16.57 L/kg (12.82–22.36 L/kg), and 18.03 L/kg (14.61–20.2 L/kg), respectively.
The approved adult therapeutic tapentadol IR dose range, which is generally associated with efficacy and good tolerability, is 50–100 mg every 4–6 hrs. Simulations were performed to identify tapentadol doses that would produce steady-state area under the curve (AUCss) in pediatric subjects similar to the AUCss in adults receiving 50–100 mg every 4 hrs. It is important to note that the AUCs at steady state are driven by dose and the CL/F distribution estimated with the adult model. Specifically, the range between the 2.5th percentile of the AUCss of the 50-mg adult dose and 97.5th percentile of AUCss 100 mg was considered a safe and efficacious target AUC range in the pediatric population (Figure 4, Table 4).
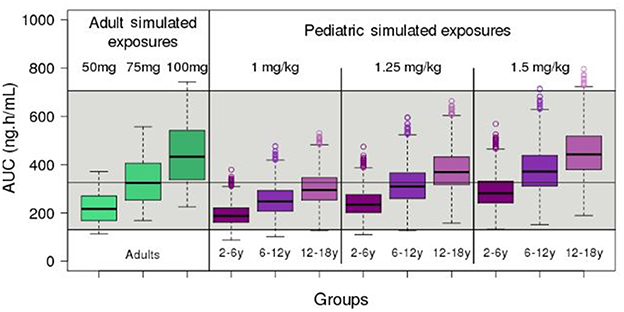 |
Figure 4 Boxplot of the simulated steady-state area under the curve (AUCss) of tapentadol in adults and pediatric subjects 2 to <18 years of age receiving 1.0 mg/kg, 1.25 mg/kg, and 1.5 mg/kg of tapentadol every 4 hrs. The gray shaded area represents the 2.5th and the 97.5th percentile of the AUCss in adults receiving 50 mg and 100 mg tapentadol every 4 hrs, respectively. The central black line indicates the 50th percentile (median) of the AUC in adults receiving 75 mg tapentadol every 4 hrs. Abbreviations: AUC, area under the curve; y, years. |
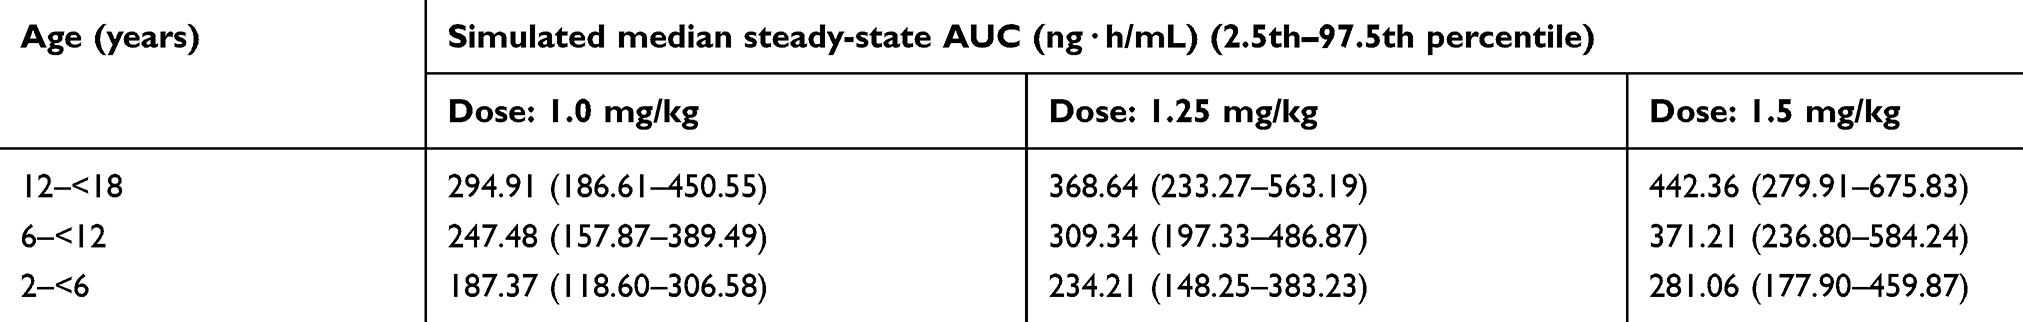 |
Table 3 Simulated steady-state tapentadol area under the curve in pediatric subjects receiving tapentadol every 4 hrs for 5 days |
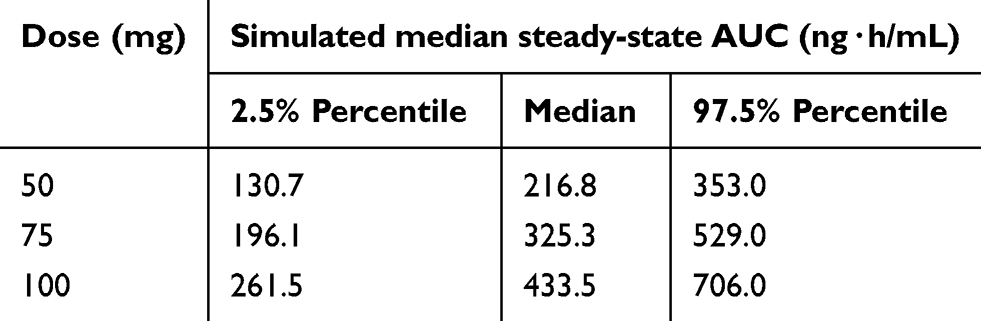 |
Table 4 Simulated steady-state tapentadol area under the curve in adult subjects receiving tapentadol every 4 hrs for 5 days |
Tapentadol exposures were simulated for OS doses of 1.0 mg/kg, 1.25 mg/kg, and 1.5 mg/kg every 4 hrs for 5 days in children aged from 2 to <18 years. The median and 2.5th and 97.5th percentile AUCss in pediatric and adult subjects are shown in Tables 3 and 4, respectively, and compared graphically as boxplots in Figure 4.
As expected from the linearity of the model, the AUCss increases linearly with increasing dose in each age group. For example, median AUCss for group 1 (12 to <18 years) with 1.0 mg/kg and 1.5 mg/kg administered every 4 hrs are 295 ng·h/mL and 442 ng·h/mL, respectively. Similar trends were also observed for other age groups. The simulated AUCss of tapentadol in pediatric subjects 2 to <18 years receiving 1 mg/kg, 1.25 mg/kg, and 1.5 mg/kg of tapentadol every 4 hrs is shown in Figure 4. The simulated AUCss following a dose of 1.25 mg/kg to each of the three age groups, 12 to <18 years, 6 to <12 years, and 2 to <6 years is also presented as a histogram (Figure S3) for evaluation of the distribution of exposure across the age ranges (Tables S1 and S2).
Discussion
Population PK model
This is the first PopPK analysis of tapentadol in children aged from 2 to <18 years with moderate-to-severe acute postsurgical pain. Tapentadol PK was best described by a one-compartment model with first-order absorption and first-order elimination. None of the studied covariates were found to be either statistically significant or clinically relevant except for bodyweight, which was already included in the base model. This suggests that the tested covariates, ie age, sex, CRCL, AST, ALT, ALP, and bilirubin, have no relevant impact on the PK of tapentadol in the currently studied pediatric population older than 2 years of age.
Based on the present model, the mean population clearance for a 71-kg subject is 227 L/h, which is comparable to a previously published value of 214 L/h based on an adult tapentadol population PK model.21 Bodyweight normalized CL/F (L/h/kg) and V/F (L/kg) were highest for the youngest age group and decreased with increasing age (Figure 5). The highest CL/F (L/h/kg) translates to the lowest AUC in the youngest age group. On the other hand, total CL/F (L/h) (uncorrected for bodyweight) increased with age owing to the associated increase in bodyweight.
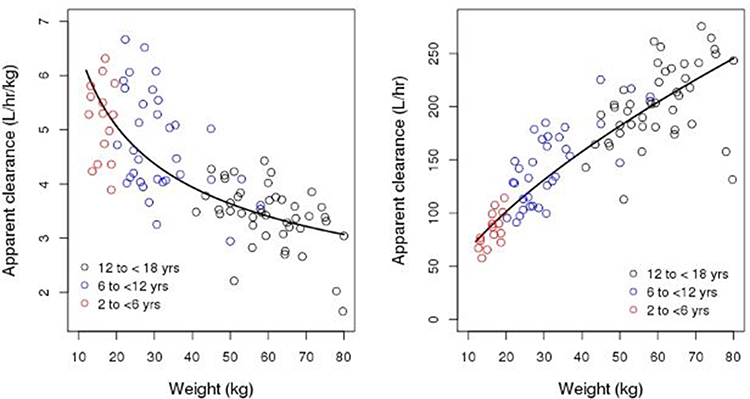 |
Figure 5 Empirical Bayesian estimates of bodyweight-normalized apparent clearance (left panel) and apparent clearance (right panel) versus weight together with modeled relationship, using a power function (line) (Table 2). Abbreviations: AUC, area under the curve; yrs, years. |
Maturation
The current model suggests that bodyweight is an adequate descriptor for CL/F and V/F in the pediatric population. The estimated exponents for the effect of bodyweight on V/F and CL/F (Table 2) are slightly lower than the values that are generally applied in allometric scaling (1 and 0.75 for V/F and CL/F, respectively). The data support identification of the exponents, providing the most accurate description of the relationship of V/F and CL/F and weight (Figure 5). Fixed exponents are applied due to the belief that the exponents are universal. This is based on the observation that interspecies metabolic rate and organ cross-sectional areas scale linearly with a slope of about 0.75.22,23 However, there is a debate in the modeling community whether the exponents should be fixed or estimated, and both approaches have been used.23,24
Below 2 years of age, an additional equation is required to describe age-related changes in CL/F and V/F related to maturation of the liver and kidney function in addition to the above mentioned size-related changes.22 The maturation is usually complete in 2-year-old children, as was demonstrated in a range of pediatric studies. The current results confirm these findings, as age in addition to weight did not contribute to a better explanation of the variation in CL/F and V/F. This indicates that the major route of tapentadol metabolism (glucuronidation involving several UGT isoforms) is essentially mature by the age of 2 years. Since children younger than 2 years were not included in the current studies, the current model does not inform the population PK in children younger than 2 years.
Exposure matching
Although pain intensity measurements were taken in the trials that formed the basis for the current pediatric population PK model, these trials were not designed to generate robust efficacy data: it was only intended to explore efficacy after a single dose in a preliminary fashion and not to investigate a possible PK/PD relationship in children.
Identification of a PK/PD relationship across the different age groups is hindered by a multitude of pain scales used in children and adults.3 In spite of the difficulties in measuring pain response in different age groups, the two mechanisms of action of tapentadol (µ-opioid receptor agonism and noradrenaline reuptake inhibition) are well understood in adults, and there is evidence that both mechanisms are functioning even in very young children.25–27 The latter implies that dose levels in children could be optimized by matching the resulting exposures to the levels that are known to be efficacious and safe in adults. The efficacy of tapentadol IR has been demonstrated in adult acute pain patients, with a clear exposure/response relationship for dosages from 50 to 100 mg IR every 4–6 hrs.28–32
Dose selection for a confirmatory efficacy trial
Simulations were performed to determine the optimal dose of tapentadol in pediatric patients from 2 to <18 years. Table 3 and Figure 4 present the exposure distributions for the three age groups for three different dose levels. The incremental increase in dose from 1 mg/kg to 1.5 mg/kg yields a relatively small change in the exposure distribution for each given age group. This is due to the high degree of variability within the pediatric population and is a reflection of the different age and weight combinations even within the predefined age group. The exposures are lowest in the youngest age group, which is related to the exponent in the relationship between clearance and weight (Table 2, Figure 5), and results in higher clearances per kg bodyweight in young children. However, there is a high degree of overlap in exposure between the three age groups for a given dose (Figures 4 and S3). The similarity in exposure (based on the overlay coefficient33) between the youngest and oldest age groups is 37% (Table S2) and the middle group, 6 to <12 years, have exposures closer to the older group with an overlay coefficient of 73% compared to an overlay coefficient of 60% with the younger group (Table S2). The median exposure between the oldest and youngest group decreases by 36% (Table 3). The abovementioned characteristics of the exposure distributions do not warrant different dose levels for the different age groups. The optimal dose level for all age groups is 1.25 mg/kg every 4 hrs, as this shows exposures best matching those after administration of 50–100 mg every 4 hrs, given as an IR formulation to adults (Figure 4). The percentage of subjects within the target AUC range in the three age groups (12 to <18 years, 6 to <12 years, and 2 to <6 years) using 1.25 mg/kg were 100%, 99.9%, and 97.7%. This is better than for 1.0 mg/kg (99.9%, 99.7%, and 94.4%, respectively), and 1.5 mg/kg (98.2%, 100%, and 100%). It is also important to take into account the percentage of the population that exceeds the target AUC range (Table S3) and to note that efficacy was observed in the single-dose trials at 1.0 mg/kg, making it difficult to justify the 50% higher dose at 1.5 mg/kg. Though the majority of the simulated subjects are within the therapeutic range, the lower dose of 1.0 mg/kg has the potential to underdose a small number of the youngest children, while the higher dose of 1.5 mg/kg could potentially lead to higher than desired exposure in some of the older children. Subjects with a bodyweight greater than or equal to 80 kg are to receive a maximum dose of 100 mg every 4 hrs, which is identical to the maximum adult dose. The proposed dosing regimen was investigated in a confirmatory efficacy trial (www.clinicaltrials.gov:NCT02081391) which will be reported separately in this tapentadol series.34
Conclusion
A one-compartment model with first-order absorption and linear elimination best described tapentadol PK data across the age range from 2 to <18 years. Weight was identified as the most important covariate on clearance and volume of distribution. A dosing scheme of 1.25 mg/kg every 4 hrs is proposed in order to achieve exposures that were safe and efficacious in adults after administration of 50–100 mg tapentadol IR every 4 hrs. The proposed tapentadol OS dose was subsequently applied in a confirmatory efficacy trial in 2-year-old to <18-year-old patients suffering from acute postsurgical pain.
Abbreviations
ALP, alkaline phosphatase; ALT, alanine transaminase; AST, aspartate transaminase; AUC, area under the curve; CL/F, total clearance after non-intravenous administration; COV, covariate; CYP450, cytochrome P450; CRCL, creatinine clearance; CWRES, conditional population residual; DV, observed values; IIV, interindividual variability; IR, immediate release; Ka, first-order absorption rate constant; LOQ, limit of quantification; MOR, μ-opioid receptor agonism; NRI, noradrenaline reuptake inhibition; OFV, objective function value; OS, oral solution; PK, pharmacokinetics; PopPK, population pharmacokinetics; PR, prolonged release; PRED, prediction; SCM, stepwise covariate model; Tlag, lag-time; TVP, typical value of the parameter; VPC, visual predictive check; V/F, volume of distribution after nonintravenous administration; WT, weight.
Data sharing statement
The authors will share upon request the final clinical trial report. They will also consider on a case-by-case basis requests for access to other documents and/or data including individual patient data. There is no limitation regarding document/data availability.
Acknowledgments
Data for this analysis were collected in two trials. Both trials were funded by Grünenthal GmbH; NCT01134536 in collaboration with Janssen Research & Development, LLC. The authors thank all patients, parents/legal guardians, investigators, and site teams involved in these trials. The analysis was funded by Grünenthal GmbH. Editorial assistance was provided by Martin Brett and Elke Grosselindemann and was paid for by Grünenthal GmbH.
Disclosure
Estelle Watson, Jan Freijer, Claudia Lefeber, and Mariëlle Eerdekens are employees of Grünenthal GmbH. Akash Khandelwal was an employee of Grünenthal GmbH at the time of drafting the manuscript. John van den Anker is a paid consultant for Grünenthal. The authors report no other conflicts of interest in this work.
References
1. Anand KJ, Hickey PR. Pain and its effects in the human neonate and fetus. N Engl J Med. 1987;317(21):1321–1329. doi:10.1056/NEJM198711193172105
2. Fitzgerald M. The development of nociceptive circuits. Nat Rev Neurosci. 2005;6(7):507–520. doi:10.1038/nrn1701
3. Eerdekens M, Beuter C, Lefeber C, van den Anker J. The challenge of developing pain medications for children: therapeutic needs and future perspectives. J Pain Res. 2019;12:1649–1664. doi:10.2147/JPR.S195788
4. Wharton GT, Murphy MD, Avant D, et al. Impact of pediatric exclusivity on drug labeling and demonstrations of efficacy. Pediatrics. 2014;134(2):e512–e518. doi:10.1542/peds.2013-2987
5. The 2017 Commission Report on the Paediatric Regulation in the EU. State of paediatric medicines in the EU. 10 years of the EU paediatric regulation. Available from: https://ec.europa.eu/health/sites/health/files/files/paediatrics/docs/2017_childrensmedicines_report_en.pdf.
6. Tzschentke TM, Christoph T, Kögel BY. The mu-opioid receptor agonist/noradrenaline reuptake inhibition (MOR-NRI) concept in analgesia: the case of tapentadol. CNS Drugs. 2014;28:319–329. doi:10.1007/s40263-014-0151-9
7. Raffa RB, Elling C, Tzschentke TM. Does ‘strong analgesic’ equal ‘strong opioid’? Tapentadol and the concept of ‘µ-load’. Adv Ther. 2018;35:1471–1484. doi:10.1007/s12325-018-0778-x
8. Terlinden R, Kogel BY, Englberger W, Tzschentke TM. In vitro and in vivo characterization of tapentadol metabolites. Methods Find Exp Clin Pharmacol. 2010;32:31–38. doi:10.1358/mf.2010.32.1.1434165
9. Kneip C, Terlinden R, Beier H, Chen G. Investigations into the drug-drug interaction potential of tapentadol in human liver microsomes and fresh human hepatocytes. Drug Metab Lett. 2008;2:67–75.
10. Smit JW, Oh C, Rengelshausen J, et al. Effects of acetaminophen, naproxen, and acetylsalicylic acid on tapentadol pharmacokinetics: results of two randomized, open-label, crossover, drug-drug interaction studies. Pharmacotherapy. 2010;30:25–34. doi:10.1592/phco.30.1.25
11. Smit J, Oh C, Lannie C, et al. Effects of probenecid on tapentadol pharmacokinetics: results of an open label, crossover, drug-drug interaction study. J Clin Pharmacol. 2009;49:
12. Göhler K, Brett M, Smit JW, Rengelshausen J, Terlinden R. Comparative pharmacokinetics and bioavailability of tapentadol following oral administration of immediate- and prolonged-release formulations. Int J Clin Pharmacol Ther. 2013;51(4):338–348. doi:10.5414/CP201722
13. Momper JD, Mulugeta Y, Burckart GJ. Failed pediatric drug development trials. Clin Pharmacol Ther. 2015;98:245–251. doi:10.1002/cpt.142
14. Manolis E, Osman TE, Herold R, et al. Role of modeling and simulation in pediatric investigation plans. Paediatr Anaesth. 2011;21:214–221. doi:10.1111/j.1460-9592.2011.03523.x
15. Lee JY, Garnett CE, Gobburu JVS, et al. Impact of pharmacometric analyses on new drug approval and labelling decisions: a review of 198 submissions between 2000 and 2008. Clin Pharmacokinet. 2011;50:627–635. doi:10.2165/11593210-000000000-00000
16. Finkel J, Goldberg J, Rosenburg R, et al. First evaluation of tapentadol oral solution for the treatment of moderate to severe acute pain in children aged 6 to <18. J Pain Res. 2019;12:1925–1936. doi:10.2147/JPR.S197348
17. Muse D, Tarau E, Lefeber C, et al. Pharmacokinetics, safety, and efficacy of tapentadol oral solution for treating moderate to severe pain in pediatric patients. J Pain Res. 2019;12:1777–1790. doi:10.2147/JPR.S197039
18. Jonsson EN, Karlsson MO. Xpose–an S-PLUS based population pharmacokinetic/pharmacodynamic model building aid for NONMEM. Comput Methods Programs Biomed. 1999;58:51–64.
19. Lindbom L, Ribbing J, Jonsson EN. Perl-speaks-NONMEM (PsN)–a Perl module for NONMEM related programming. Comput Methods Programs Biomed. 2004;75:85–94. doi:10.1016/j.cmpb.2003.11.003
20. National Center for Health Statistics in collaboration with the National Center for Chronic Disease Prevention and Health Promotion. Available from: http://www.cdc.gov/growthcharts/percentile_data_files.htm.
21. Xu XS, Smit JW, Lin R, Stuyckens K, Terlinden R, Nandy P. Population pharmacokinetics of tapentadol immediate release (IR) in healthy subjects and patients with moderate or severe pain. Clin Pharmacokinet. 2010;49:671–682. doi:10.2165/11535390-000000000-00000
22. Anderson BJ, Holford NHG. Mechanism-based concepts of size and maturity in pharmacokinetics. Ann Rev Pharmacol Toxicol. 2008;48:303–332. doi:10.1146/annurev.pharmtox.48.113006.094708
23. Neely M, Bayard D, Desai A, Kovanda L, Edington A. Pharmacometric modeling and simulation is essential to pediatric clinical pharmacology. J Clin Pharmacol. 2018;58:S73–S85. doi:10.1002/jcph.1316
24. Mahmood I. Dosing in children: A critical review of the pharmacokinetic allometric scaling and modelling approaches in paediatric drug development and clinical settings. Clin Pharmacokinet. 2014;53:327–346. doi:10.1007/s40262-014-0134-5
25. Nandi R, Fitzgerald M. Opioid analgesia in the newborn. Eur J Pain. 2005;9(2):105–108. doi:10.1016/j.ejpain.2004.05.005
26. Hathway GJ, Koch S, Low L, Fitzgerald M. The changing balance of brainstem-spinal cord modulation of pain processing over the first weeks of rat postnatal life. J Physiol. 2009;587(Pt 12):2927–2935. doi:10.1113/jphysiol.2008.168013
27. Schwaller F, Kanellopoulos AH, Fitzgerald M. The developmental emergence of differential brainstem serotonergic control of the sensory spinal cord. Sci Rep. 2017;7(1):2215. doi:10.1038/s41598-017-02509-2
28. Daniels SE, Upmalis D, Okamoto A, Lange C, Haeussler J. A randomized, double-blind, phase III study comparing multiple doses of tapentadol IR, oxycodone IR, and placebo for postoperative (bunionectomy) pain. Curr Med Res Opin. 2009;25:765–776. doi:10.1185/03007990902728183
29. Daniels S, Casson E, Stegmann JU, et al. A randomized, double-blind, placebo-controlled phase 3 study of the relative efficacy and tolerability of tapentadol IR and oxycodone IR for acute pain. Curr Med Res Opin. 2009;25:1551–1561. doi:10.1185/03007990902952825
30. Vorsanger GJ, Klopfer AM, Xiang J, Benson CJ, Moskovitz BL, Rosenthal NR. Immediate-release tapentadol or oxycodone for treatment of acute postoperative pain after elective arthroscopic shoulder surgery: a randomized, phase IIIb study. J Opioid Manag. 2013;9:281–290. doi:10.5055/jom.2013.0170
31. Hartrick C, Van Hove I, Stegmann J-U, Oh C, Upmalis D. Efficacy and tolerability of tapentadol immediate release and oxycodone HCl immediate release in patients awaiting primary joint replacement surgery for end-stage joint disease: a 10-day, phase III, randomized, double-blind, active- and placebo-controlled study. Clin Ther. 2009;31:260–271. doi:10.1016/j.clinthera.2009.02.009
32. Stegmann J-U, Weber H, Steup A, Okamoto A, Upmalis D, Daniels S. The efficacy and tolerability of multiple-dose tapentadol immediate release for the relief of acute pain following orthopedic (bunionectomy) surgery. Curr Med Res Opin. 2008;24:3185–3196. doi:10.1185/03007990802448056
33. Mizuno S, Yamaguchi T, Fukushima A, Matsuyama Y, Ohashi Y. Overlap coefficient for assessing the similarity of pharmacokinetic data between ethnically different populations. Clin Trials. 2005;2:174–181. doi:10.1191/1740774505cn077oa
34. Beuter C, Volkers G, Radic T, Goldberg J, van den Anker J. Efficacy and safety of multiple doses of oral tapentadol solution in the treatment of moderate to severe acute pain in children aged 2 to <18 years – a randomized, double-blind, placebo-controlled trial. J Pain Res. In press 2019.
Supplementary materials
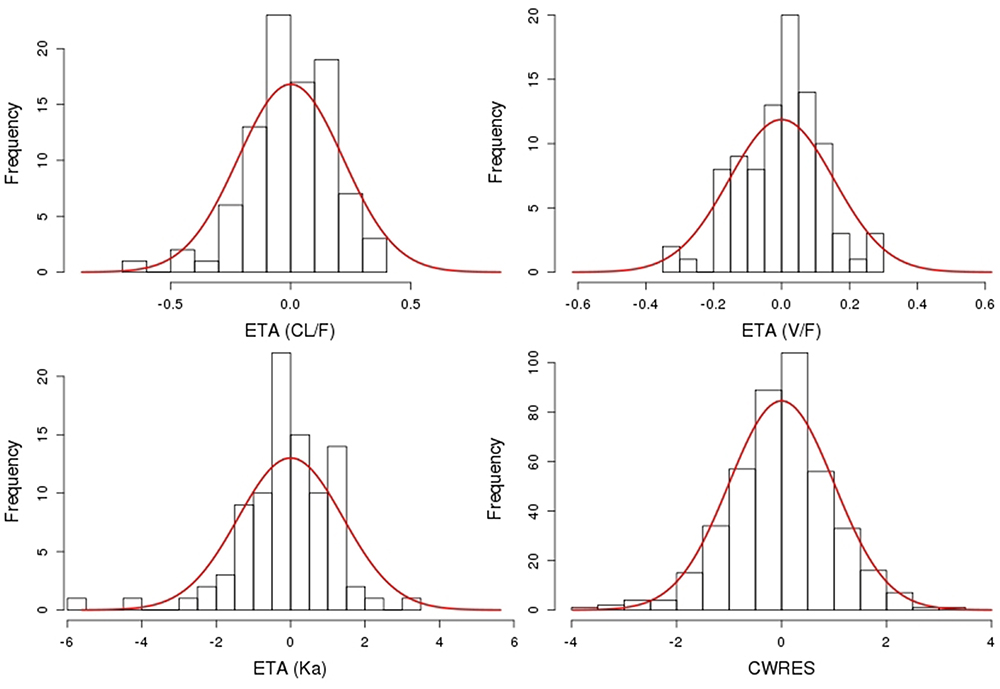 |
Figure S1 Histograms of the random effects (ETA) for clearance (CL/F), volume of distribution (V/F), absorption rate constant (Ka), and the conditional weighted residuals (CWRES). The solid line represents the scaled (by area) probability density functions with mean zero, and variances of ETA as estimated by mixed effects modeling (Table 2). The variance of CWRES is equal to one. |
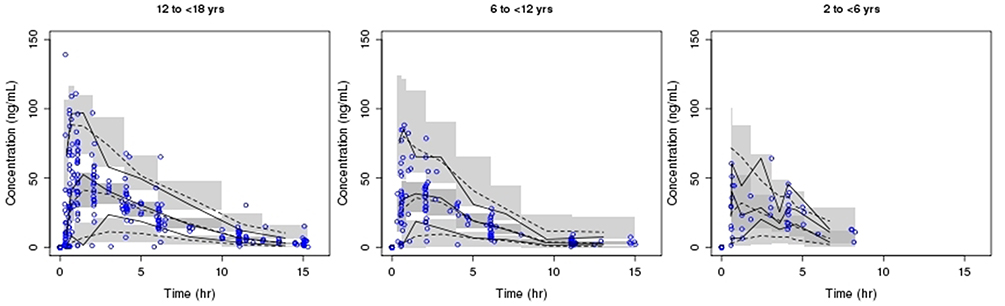 |
Figure S2 Simulation based visual predictive check (VPC) using final parameter estimates from the population pharmacokinetic model based on NCT01729728 and NCT01134536 data. Blue open circles represent observed tapentadol concentrations; solid lines represent observed 2.5th, median, and 97.5th percentile of tapentadol concentration-time course, dotted lines represent 2.5th, median, and 97.5th percentile of the predicted tapentadol concentration-time course; gray areas represent the corresponding 95% confidence intervals. Abbreviation: yrs, years. |
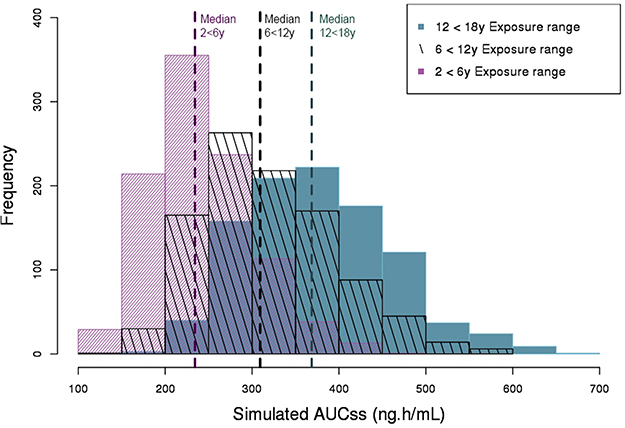 |
Figure S3 Overlaid histograms of the simulated AUCss produced following a dose of 1.25 mg/kg every 4 h in children aged 2 to <18 years. The median simulated AUCss for each age group are displayed. Abbreviations: AUCss, area under the curve at steady-state; y, years. |
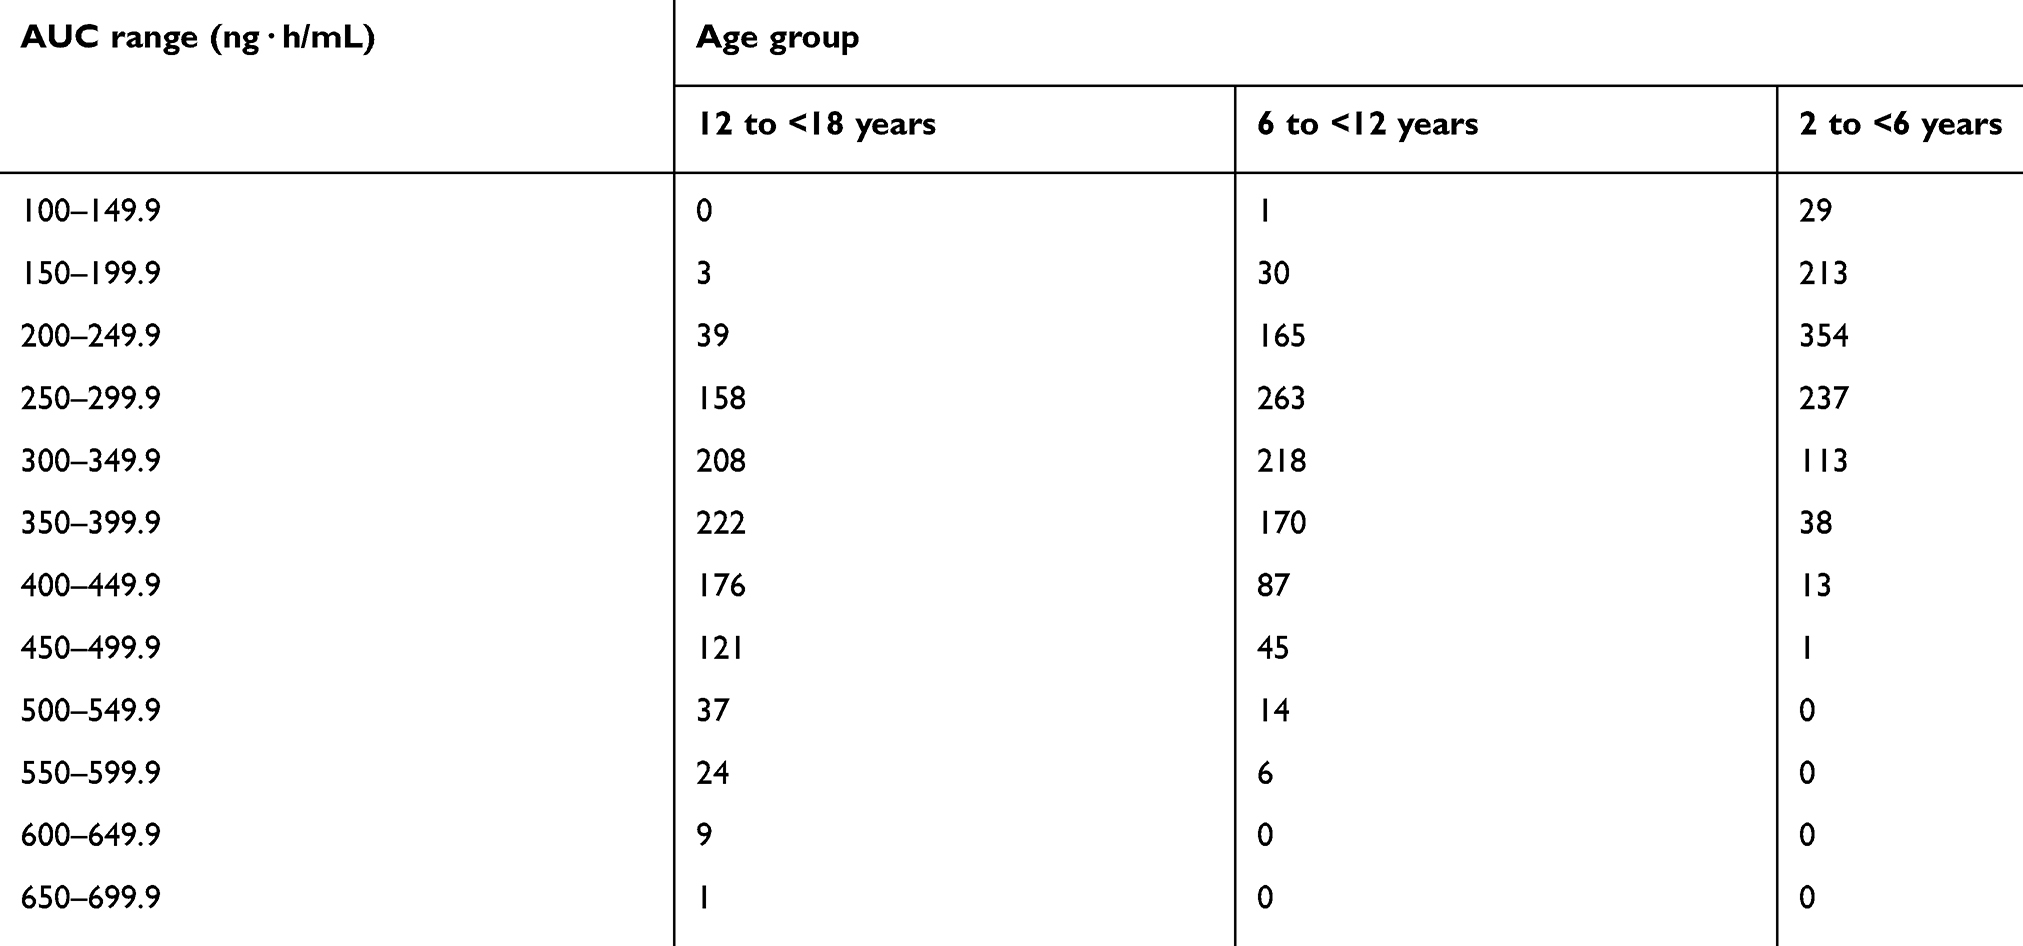 |
Table S1 Frequency count obtained from the 1000 simulated tapentadol AUC at steady-state with 1.25 mg/kg |
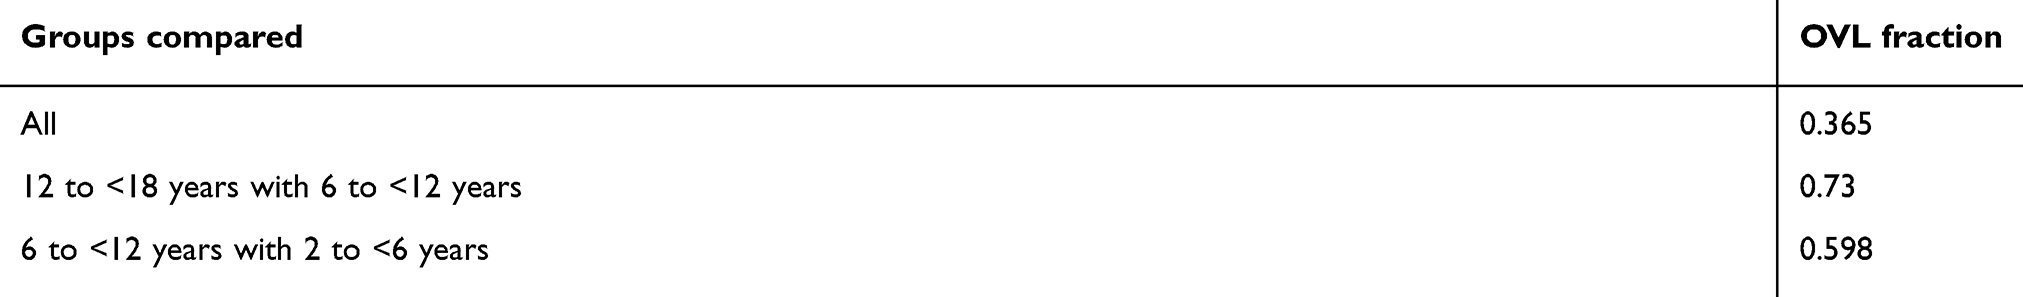 |
Table S2 Calculated overlay coefficient for each age group |
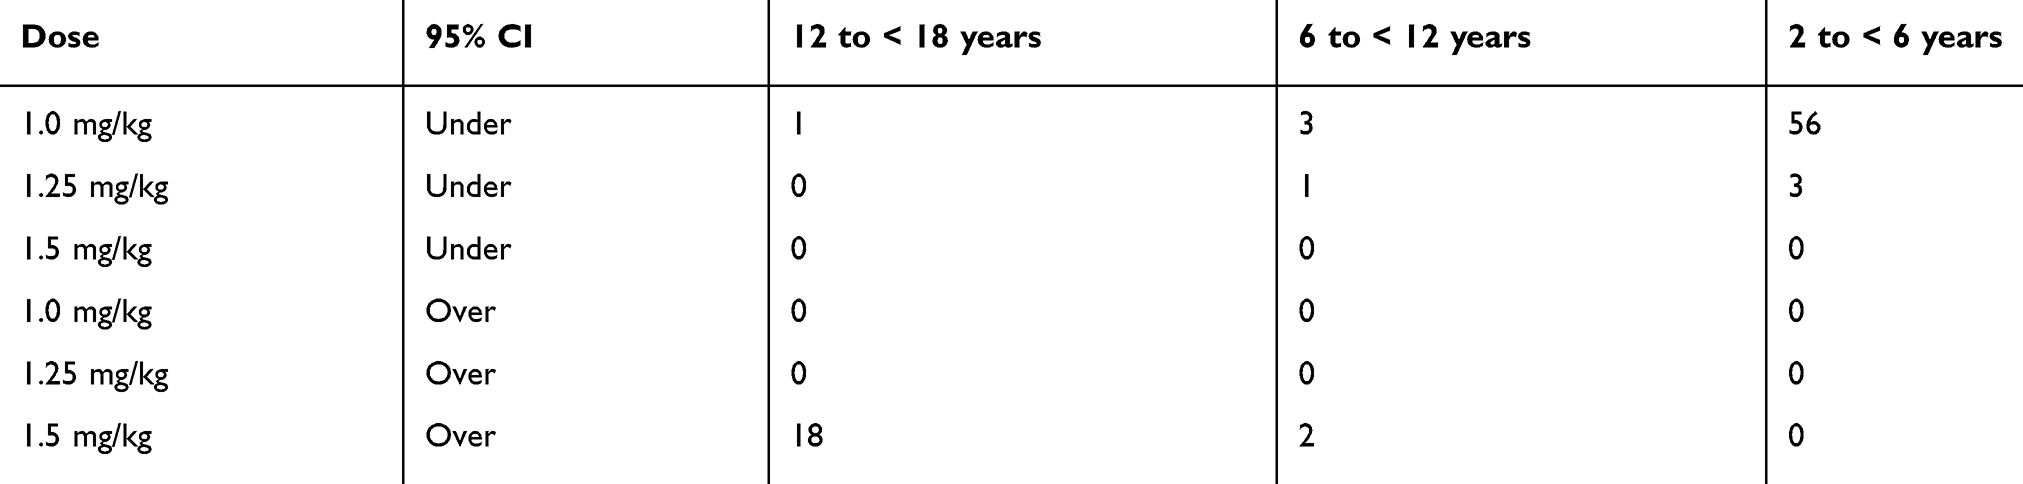 |
Table S3 Number of simulated steady-state AUCs from 1000 simulations which are outside of the 95% CI for each age group and each dose level |
List of institutional review boards/independent ethics committees
For all sites that enrolled subjects in the two trials
NCT01134536
Canada
Hamilton Integrated Research Ethics Board (HIREB), Hamilton ON
CHUS-Centre Hospitalier Universitaire de Sherbrooke, Sherbrooke QC
Spain
Comité Ético de Investigación Clínica, Hospital Clinico San Carlos, Madrid
Hospital Gregorio Marañón, Oficina Técnica CEIC, Madrid
Comité Ético de Investigación Clínica, Hospital Clinico Universitario de Valladolid, Valladolid
Hospital 12 de Octubre, Unidad Administrativa CEIC, Madrid
USA
Western Institutional Review Board, Olympia WA
Sterling Institutional Review Board, Atlanta GA
Carolina Health System IRB, Charlotte NC
Duke University Medical Center Institutional Review Board, Durham NC
Biomedical Research Alliance of New York, Lake Success NY
University of Arkansas For Medical Service Institutional Review Board, Little Rock AR
NCT01729728
Quorum Review, Inc, Seattle, USA
 © 2019 The Author(s). This work is published and licensed by Dove Medical Press Limited. The
full terms of this license are available at https://www.dovepress.com/terms
and incorporate the Creative Commons Attribution
- Non Commercial (unported, 3.0) License.
By accessing the work you hereby accept the Terms. Non-commercial uses of the work are permitted
without any further permission from Dove Medical Press Limited, provided the work is properly
attributed. For permission for commercial use of this work, please see paragraphs 4.2 and 5 of our Terms.
© 2019 The Author(s). This work is published and licensed by Dove Medical Press Limited. The
full terms of this license are available at https://www.dovepress.com/terms
and incorporate the Creative Commons Attribution
- Non Commercial (unported, 3.0) License.
By accessing the work you hereby accept the Terms. Non-commercial uses of the work are permitted
without any further permission from Dove Medical Press Limited, provided the work is properly
attributed. For permission for commercial use of this work, please see paragraphs 4.2 and 5 of our Terms.