
Back to Journals » Journal of Inflammation Research » Volume 19
Peripheral Immune Reprogramming Characterizes a Low C-Peptide Subgroup of Type 2 Diabetes: Transcriptomic Profiling of Peripheral Blood Mononuclear Cells and Systemic Inflammation
Authors Xu Y  , Li Y, Zeng X, Chen L, Lin H, Xie W, Wang Z, Jiang Z, Duan H, Huang H
Received 26 January 2026
Accepted for publication 20 June 2026
Published 8 July 2026 Volume 2026:19 594793
DOI https://doi.org/10.2147/JIR.S594793
Checked for plagiarism Yes
Review by Single anonymous peer review
Peer reviewer comments 3
Editor who approved publication: Dr Quan Zhang
Yajing Xu,1 Yiting Li,1 Xiying Zeng,1 Lijun Chen,1 Hongli Lin,1 Wenxin Xie,1 Zitong Wang,2 Zhengrong Jiang,1 Honghong Duan,3 Huibin Huang1
1Department of Endocrinology, The Second Affiliated Hospital of Fujian Medical University, Quanzhou, Fujian, People’s Republic of China; 2Independent Researcher, West New York, NJ, USA; 3Department of Obstetrics and Gynecology, The Second Affiliated Hospital of Fujian Medical University, Quanzhou, Fujian, People’s Republic of China
Correspondence: Zhengrong Jiang, Department of Endocrinology, The Second Affiliated Hospital of Fujian Medical University, Quanzhou, Fujian, People’s Republic of China, Email [email protected] Huibin Huang, Department of Endocrinology, The Second Affiliated Hospital of Fujian Medical University, Quanzhou, Fujian, People’s Republic of China, Email [email protected]
Background: Type 2 diabetes (T2DM) is clinically heterogeneous. A subgroup with markedly reduced C-peptide has poorer glycemic stability and different therapeutic needs, but the associated peripheral immune features and practical non-invasive markers are not well defined. We investigated whether T2DM with low C-peptide (T2DM-LowC) is associated with a distinct peripheral immune profile.
Methods: In this single-center, cross-sectional study, patients with T2DM were propensity score-matched 1:1 by disease duration into low C-peptide (T2DM-LowC, n=109) and preserved C-peptide (T2DM-PresC, n=109) groups. Clinical and metabolic variables were compared. In an exploratory sub-cohort (n=21; HC=7, PresC=7, LowC=7), transcriptomic profiling of peripheral blood mononuclear cells (PBMCs) was analyzed using differential expression analysis, weighted gene co-expression network analysis, and CIBERSORTx deconvolution. Candidate genes were validated in an independent cohort (n=40) by RT-qPCR.
Results: Compared with T2DM-PresC, the T2DM-LowC subgroup had lower BMI and triglycerides, higher alkaline phosphatase, and a higher systemic inflammation response index (SIRI; neutrophils × monocytes/lymphocytes). Higher SIRI remained associated with low C-peptide status after adjustment (OR = 2.38, p = 0.007). Exploratory PBMC transcriptomic analyses identified lower mast-cell-related signatures, higher resting NK-cell and resting CD4 memory T-cell signatures, and a shift toward memory B cells. CSF2RB, NIBAN1, and TLR1 were consistently downregulated in T2DM-LowC, and the three-gene panel discriminated the two T2DM subgroups in the validation cohort (AUC = 0.903; sensitivity 75.0%; specificity 90.0%).
Conclusion: In this cross-sectional dataset, low C-peptide T2DM was associated with a distinct clinical and peripheral immune profile. Integrating SIRI with a three-gene PBMC signature may provide a non-invasive adjunct for identifying this subgroup. These deconvolution-derived immune-cell findings require validation in larger and functionally characterized cohorts.
Keywords: type 2 diabetes, C-peptide, peripheral blood mononuclear cells, transcriptomics, systemic inflammation, biomarkers
Introduction
Type 2 diabetes (T2DM) is characterized by significant clinical heterogeneity, with the progressive decline of pancreatic β-cell function being its core pathophysiology.1 This process leads to substantial variability in disease management and prognosis, highlighting the necessity for precise stratification of T2DM.
Clinical studies have identified a subgroup of patients with T2DM who have markedly reduced endogenous insulin secretory capacity, usually reflected by low C-peptide levels. This phenotype partially overlaps with insulin-deficient clusters described in data-driven subtyping studies, including severe insulin-deficient diabetes (SIDD), but the present study focuses on a clinically defined low C-peptide phenotype identified by C-peptide-based assessment. Patients with low C-peptide typically have poorer glycemic stability, greater hypoglycemia risk, and less favorable responses to therapies that depend on residual insulin secretion, underscoring the need for earlier recognition of this subgroup.2–7
Although the clinical importance and unique therapeutic implications of low C-peptide T2DM are increasingly recognized, the biological processes associated with accelerated β-cell decline in this subgroup remain incompletely understood. Low C-peptide has also been linked to diabetic complications independently of diabetes duration,8,9 suggesting that this phenotype reflects more than cumulative metabolic exhaustion. Chronic metabolic inflammation is a plausible contributor: innate immune activation can amplify β-cell stress, and adaptive immune abnormalities have also been reported in subsets of patients with T2DM.10–13 Related observations in obesity- and autoimmunity-associated inflammatory conditions further support the relevance of immune dysregulation across chronic disease states.14–16 Peripheral immune dysregulation could therefore influence β-cell failure through sustained inflammatory signaling, altered antigen presentation, and impaired tissue repair, but its relevance to the low C-peptide phenotype has not been systematically defined.
Accordingly, a key unresolved question is whether low C-peptide T2DM is associated with a distinct peripheral immune landscape and molecular signature beyond the effect of longer disease duration alone.
Early identification of this phenotype remains challenging. C-peptide testing is not routinely performed in many clinical settings, single measurements may be influenced by glycemic status and renal function, and thresholds defining severe insulin deficiency vary across studies.1,17,18 A complementary marker that reflects a more stable pathophysiological state could therefore be clinically useful.
Peripheral blood mononuclear cells (PBMCs) provide an accessible window into systemic immune status. Their transcriptomic profiles can integrate chronic inflammatory and metabolic signals and have been explored as biomarkers in several immune-related disorders.19–24
We therefore conducted a cross-sectional comparison of duration-matched T2DM-LowC and T2DM-PresC groups, integrating PBMC RNA sequencing, immune-cell deconvolution, and network analysis to characterize the peripheral immune landscape of the low C-peptide subgroup, identify candidate molecular markers, and assess whether these markers, together with systemic inflammatory indices, could aid identification of the low C-peptide subgroup.
Materials and Methods
Study Design and Ethics
This single-center, cross-sectional study was conducted in accordance with the Declaration of Helsinki and was approved by the Ethics Committee of the Second Affiliated Hospital of Fujian Medical University (Approval No. [2024] 666). All participants provided written informed consent. The study included a duration-matched clinical comparison and an exploratory discovery-validation workflow for PBMC transcriptomic biomarkers.
Study Population and Grouping
Clinical Analysis Cohort
Cohort selection: Between October 1, 2024 and June 1, 2025, inpatient electronic medical records were queried to define an initial screening frame of clinically diagnosed T2DM patients with available GADA results, before applying eligibility criteria (Supplementary Figure S1).
Inclusion criteria for T2DM were: (1) age 30–80 years; (2) diagnosis according to American Diabetes Association (ADA) criteria; (3) no prior history of diabetic ketoacidosis (DKA); (4) disease duration ≥6 months from diagnosis to enrollment; and (5) glycemic control maintained with lifestyle modification and/or oral antidiabetic drugs (without insulin) for the first 6 months post-diagnosis.
Exclusion criteria for T2DM included: (1) positive glutamic acid decarboxylase antibody (GADA) titers (indicating latent autoimmune diabetes or misclassification); (2) acute onset requiring immediate insulin therapy or rapid weight loss (>5%) within 1–3 months of diagnosis; (3) BMI <18.5 kg/m2; (4) severe hepatic or renal dysfunction (eGFR <30 mL/min/1.73 m2 or ALT/AST >3 times the upper limit of normal [ULN]); (5) major infection, surgery, or acute cardiovascular/cerebrovascular event within the last 3 months; (6) active malignancy or hematological disorders; (7) long-term use of high-dose glucocorticoids or immunosuppressants; and (8) pregnancy or lactation.
Inclusion criteria for healthy controls (HC) were: age 30–80 years; no history of diabetes with FPG <7.0 mmol/L and HbA1c <6.5% (or 2-hour post–oral glucose tolerance test (OGTT) glucose <11.1 mmol/L if available); and exclusion of the same severe comorbidities and acute stress conditions as T2DM patients.
T2DM stratification: To avoid the transient suppressive effect of glucotoxicity, this study used both fasting C-peptide (FCP) and the fasting C-peptide to glucose ratio (FCPGR) to define subgroups. T2DM-PresC was defined as FCP ≥1.1 ng/mL and FCPGR ≥0.15, while T2DM-LowC was defined as FCP <1.1 ng/mL and FCPGR <0.15. Patients with discordant FCP and FCPGR classifications were excluded.
Propensity score matching (PSM): Considering that diabetes duration is the primary time-dependent confounder affecting β-cell decline, while age, sex, BMI, lipids, and inflammatory markers are the potential clinical features this study aims to explore in relation to the low C-peptide state, a PSM strategy using only disease duration as the covariate was employed. Specifically, a 1:1 nearest-neighbor matching without replacement was performed between the T2DM-PresC and T2DM-LowC groups. Propensity scores were generated via logistic regression with disease duration, and a caliper width of 0.2 times the standard deviation of the logit of the propensity score was set. Successful matching was defined by a standardized mean difference (SMD) for duration <0.1. This design aimed to ensure comparable temporal exposure to β-cell decline between the two subgroups, so that post-matching differences could be interpreted with reduced confounding by disease duration. Concurrent glucose-lowering medications were not included in the matching strategy and were not incorporated as covariates in the primary regression model.
Molecular Sub-Cohorts
From the eligible participants, 21 individuals (7 each for HC, PresC, and LowC) were selected for RNA-seq. Peripheral blood was collected into K2-EDTA tubes, and PBMC isolation was completed within 2 hours of venipuncture. An independent RT-qPCR validation cohort of 40 individuals (PresC = 20, LowC = 20) was also recruited, and samples were processed according to the same PBMC isolation and RNA extraction workflow. RNA quality control criteria are detailed in Total RNA Extraction and Quality Control.
Clinical Data Collection and Indicator Definitions
Participants fasted for at least 8 hours before testing, and venous blood was collected between 6:00 and 10:00 AM. On the same day, height and weight were measured to calculate the body mass index (BMI = weight/height2, kg/m2). Fasting plasma glucose (FPG), total cholesterol (TC), triglycerides (TG), high-density lipoprotein cholesterol (HDL-C), low-density lipoprotein cholesterol (LDL-C), uric acid (UA), and liver enzymes (ALT, alanine aminotransferase; AST, aspartate aminotransferase; GGT, gamma-glutamyl transferase; ALP, alkaline phosphatase) were measured on an automated biochemical analyzer. Glycated hemoglobin (HbA1c) was determined by high-performance liquid chromatography. FCP was measured by chemiluminescence. Blood cell counts were performed by an automated hematology analyzer. If multiple tests were available within one week, the results from the same day as the FCP test or the most recent one were prioritized. FCPGR was calculated as FCP (ng/mL) / FPG (mmol/L).
Inflammatory/immune-derived indices (with cell counts in ×10^9/L) were defined as follows: Neutrophil-to-Lymphocyte Ratio (NLR) = Neutrophils/Lymphocytes; Platelet-to-Lymphocyte Ratio (PLR) = Platelets/Lymphocytes; Lymphocyte-to-Monocyte Ratio (LMR) = Lymphocytes/Monocytes; Systemic Immune-Inflammation Index (SII) = Platelets × Neutrophils/Lymphocytes; Systemic Inflammation Response Index (SIRI) = Neutrophils × Monocytes/Lymphocytes; and Aggregate Index of Systemic Inflammation (AISI) = Neutrophils × Monocytes × Platelets/Lymphocytes. Current smoking was defined as having smoked ≥100 cigarettes in a lifetime and currently smoking. Current drinking was defined as alcohol consumption ≥1 time per week in the past 6 months.
PBMC Isolation and Total RNA Extraction
Venous blood was collected into K2-EDTA anticoagulant tubes and processed under RNase-free conditions within 2 hours. Whole blood was diluted 1:1 with PBS and carefully layered onto Ficoll-Paque PLUS. Centrifugation was performed at 1000 × g for 20 min at room temperature (brakes off). The buffy coat was collected, resuspended in PBS, and centrifuged at 700 × g for 15 min. This washing step was repeated twice. After the supernatant was discarded, the cell pellet was lysed with TRIzol (approximately 0.5–1 mL/tube), mixed, and stored at –80°C for subsequent RNA extraction.
Total RNA Extraction and Quality Control
Total RNA was extracted according to the TRIzol reagent (Invitrogen, Carlsbad, CA, USA; Cat# 15596018CN) manufacturer’s protocol (chloroform phase separation, isopropanol precipitation, 75% ethanol wash), followed by genomic DNA removal with DNase I and column purification. RNA purity was assessed using a NanoDrop 2000 (Thermo Fisher Scientific) (A260/280 ratio of 1.8–2.0, A260/230 ratio ≥1.8). RNA integrity was evaluated with an Agilent 2100 Bioanalyzer (Agilent Technologies) (RIN ≥7.0) before library construction.
Library Construction and High-Throughput Sequencing
Strand-specific libraries were prepared using the VAHTS Universal V6 RNA-seq Library Prep Kit for Illumina® (Vazyme, Nanjing, China; cat#NR604-02). The process involved mRNA enrichment with Oligo (dT) magnetic beads, fragmentation, first- and second-strand cDNA synthesis, end repair, A-tailing, adapter ligation, magnetic bead-based size selection (insert size ~250–300 bp), and limited-cycle PCR amplification (~10–12 cycles). Library quantification and fragment distribution were assessed using a Qubit 2.0/4.0 (Thermo Fisher Scientific) and an Agilent 2100. Sequencing was performed on an Illumina NovaSeq 6000 platform (Illumina, San Diego, CA, USA) with a PE150 strategy.
Bioinformatics Processing
FASTQ files underwent quality control with fastp (v0.20.1) and were then aligned to the human reference genome GRCh38 (Ensembl release 110) using HISAT2 (v2.2.1). StringTie (v2.1.4) was used for reference-guided transcript assembly and quantification. The assemblies from all samples were merged using stringtie-merge and compared against the Ensembl annotation with gffcompare. Novel transcripts meeting quality thresholds (MSTRG entries) were included for exploratory presentation only. Gene-level differential expression analysis was performed on the featureCounts matrix using the limma-voom workflow. Lowly expressed genes (zero counts in >50% of samples) were filtered out. The remaining data were subjected to mean-variance modeling and weight assignment with voom. A linear model was fitted with lmFit, followed by empirical Bayes moderation with eBayes. To enhance detection power in the small sample context (n=7/group), the primary analysis used a threshold of raw p < 0.05 and a fold change (FC) ≥1.5, which was used for volcano plot generation. To address the issue of Type I errors from multiple testing, Benjamini–Hochberg corrected FDR results and corresponding plots were also provided in the supplementary materials, and sensitivity analyses with stricter thresholds (eg, FDR < 0.05 and FC ≥2.0) were conducted to assess the robustness of key findings. The comparisons included: PresC vs HC, LowC vs HC, and LowC vs PresC. Complete differential-expression outputs for these three comparisons are provided in Supplementary Datasets S1–S3.
Weighted Gene Co-Expression Network Analysis (WGCNA)
Using the normalized expression matrix as input, low-variance genes were removed based on the median absolute deviation (MAD), and outlier samples/genes were filtered using goodSamplesGenes. An unsigned network type was chosen. The soft-thresholding power β was selected using the pickSoftThreshold function to achieve a scale-free topology fitting index (R2 > 0.85) while maintaining high mean connectivity. The adjacency matrix was defined as a_ij = |cor_Pearson(i,j)|^β. The topological overlap matrix (TOM) was calculated, and hierarchical clustering was performed using 1-TOM as the distance measure. Initial modules were identified using dynamic tree cutting (sensitivity=4, minModuleSize=15). Modules with a module eigengene (ME) correlation >0.9 were merged. Pearson correlations were calculated between MEs and the HC/PresC/LowC traits. The two modules with the greatest separation, ranked by Δr=|r(PresC)−r(LowC)|, were selected. Gene significance (GS) and module membership (MM) were calculated within these modules. Candidate genes were screened based on |MM| ≥0.5 and |GS| ≥0.5. The module network with edge weights ≥0.1 was exported for further analysis.
Direction-Constrained Intersection and Protein-Protein Interaction (PPI)
Building on the limma-voom results, differentially expressed genes (DEGs) from the LowC vs PresC comparison (S1) were first selected. This set was then split based on the direction of change relative to HC (downregulated in PresC vs HC [S2], upregulated in LowC vs HC [S3]; and the reverse pattern S4/S5). The intersections S1∩S2∩S3 and S1∩S4∩S5 were retained to obtain a direction-constrained set S6. This set was mapped to the STRING database (v12, score≥0.4) to construct a PPI network. The intersection of this network with the WGCNA candidate gene set (S7) yielded the final priority candidate gene set for validation and modeling.
Immune Cell Deconvolution Analysis (CIBERSORTx)
The relative proportions of 22 LM22 immune cell signatures were estimated using CIBERSORTx (Permutations = 100; quantile normalization disabled for RNA-seq data). Only samples with a deconvolution P < 0.05 were included in downstream analyses. The deconvolution outputs were reported as PBMC-derived estimates rather than direct cell counts, and the raw deconvolution output for all samples is provided in Supplementary Dataset S4. The Kruskal–Wallis test was used for three-group comparisons, followed by pairwise Wilcoxon rank-sum tests when the global test was significant. The statistical threshold was set at a two-sided P < 0.05.
Real-Time Quantitative PCR (RT-qPCR) Validation
Total RNA was extracted from PBMCs of the independent validation cohort (T2DM-PresC = 20, T2DM-LowC = 20) as described in PBMC Isolation and Total RNA Extraction. cDNA was synthesized using the PrimeScript RT Reagent Kit (Takara, Shiga, Japan; cat#RR047A) according to the manufacturer’s instructions. Amplification and detection were performed using TB Green Premix Ex Taq (Takara, Shiga, Japan; cat#RR420A) on a real-time PCR system (Molarray, Suzhou, China; cat#MA-6000). GAPDH was used as the internal reference. Relative expression levels were calculated using the 2^−ΔΔCt method, with the T2DM-PresC group serving as the calibrator group. Primer sequences for all target and reference genes are listed in Supplementary Table 1, as in previous RT-qPCR-based expression studies.25
Statistical Analysis
Data analyses were performed using SPSS 26.0 (IBM Corp., Armonk, NY, USA), GraphPad Prism 9.0.0 (GraphPad Software, San Diego, CA, USA), and R 4.2.1 (R Foundation for Statistical Computing, Vienna, Austria).
The normality of continuous variables was assessed using the Shapiro–Wilk test. Normally distributed variables are presented as mean ± standard deviation (Mean ± SD), and comparisons between two groups were performed using a paired t-test. Non-normally distributed variables are presented as median (interquartile range) [Median (IQR)], and comparisons were made using the Wilcoxon signed-rank test. Categorical variables are presented as frequency (percentage) [n (%)], and comparisons were made using McNemar’s test.
In the conditional logistic regression, with the matched-pair ID as the strata variable, independent factors associated with the low C-peptide status were evaluated. The dependent variable was the group status, with the LowC group coded as 1 (event) and the PresC group as 0 (reference). For categorical variables, females were the reference category. Strongly right-skewed variables (TG, NLR, LMR, SIRI, AISI) were natural log-transformed. The base model included sex, age at diagnosis, BMI, UA, ln(TG), HDL-C, and ALP as covariates. Immune-inflammatory indices were introduced stepwise using the forward likelihood ratio method (Pin=0.05, Pout=0.10). The odds ratio (OR) for log-transformed variables is interpreted as the effect per e-fold increase; for ease of clinical interpretation, the OR per doubling was also reported (calculated as OR^(ln 2)).
Receiver operating characteristic (ROC) curves were constructed based on the linear predictors from the regression models, and the area under the curve (AUC) with its 95% confidence interval (CI) was calculated. The optimal diagnostic cutoff was determined by the Youden index, and the corresponding sensitivity and specificity were calculated. The discriminatory power of single-gene or multi-gene combination models was also assessed using ROC curves.
All statistical tests were two-sided, and a p < 0.05 was considered statistically significant.
Results
Clinical Phenotype and Low C-Peptide Status
From a pool of 418 T2DM patients, individuals were stratified into the T2DM-PresC (n=309) and T2DM-LowC (n=109) groups based on FCP and FCPGR criteria. Through 1:1 PSM using only disease duration as a covariate, 109 pairs were successfully matched. Post-matching, disease duration was well-balanced between the two groups (PresC: 10.0 [4.0–12.0] years vs. LowC: 10.0 [3.0–16.0] years, SMD = 0.04, p = 0.348), ensuring comparability of temporal exposure (Table 1).
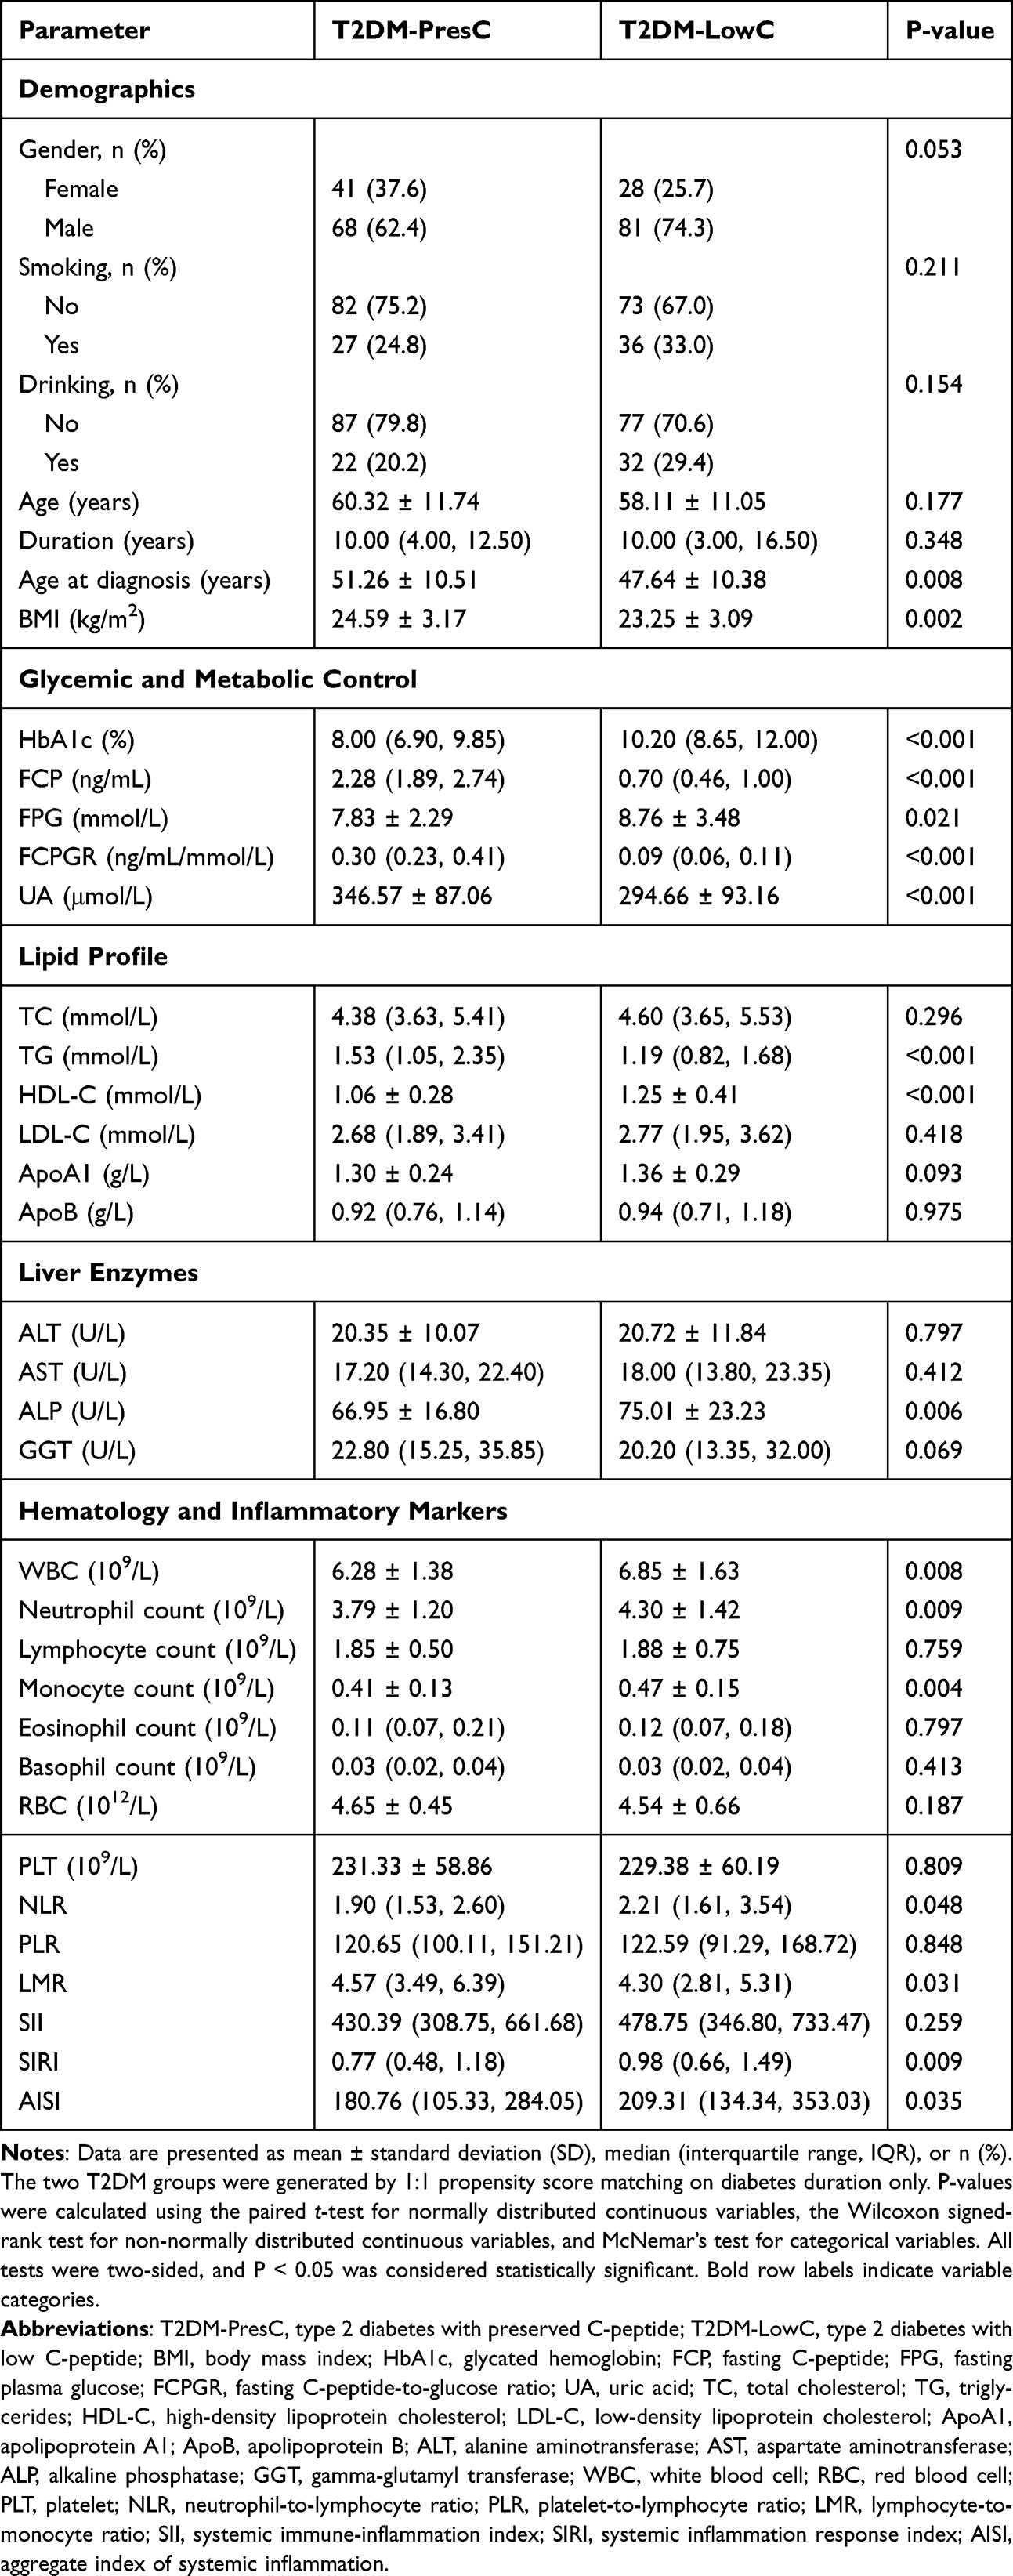 |
Table 1 Clinical and Laboratory Characteristics of the Propensity Score-Matched T2DM Subgroups |
With comparable disease duration, the LowC group exhibited a series of significant differences (Table 1): (1) Demographic characteristics: younger age at diagnosis (p = 0.008), lower BMI (p = 0.002), and a higher proportion of males (marginally significant, p = 0.053); (2) Poorer glycemic control: both HbA1c and FPG were significantly elevated (both p < 0.05); (3) Islet function: FCP and FCPGR were significantly lower (both p < 0.001), consistent with the group definitions; (4) Metabolic reprogramming: UA and TG were lower, HDL-C was higher, and ALP was higher (all p < 0.01), while TC and LDL-C showed no difference; (5) Increased inflammatory burden: white blood cell (WBC), neutrophil, and monocyte counts were elevated (all p < 0.01), and the composite inflammatory indices NLR, LMR, SIRI, and AISI were all significantly altered (all p < 0.05).
These data indicate that, after matching for disease duration, the low C-peptide subgroup was associated with an earlier age at diagnosis, lower BMI and TG, higher ALP, and higher immune-inflammatory indices. This clinical pattern provided the framework for the subsequent exploratory immune-cell and transcriptomic analyses.
Clinical and Inflammatory Factors Associated with Low C-Peptide Status
To identify clinical and inflammatory factors independently associated with low C-peptide status, we performed conditional logistic regression analysis in the propensity score-matched cohort, using a base clinical-metabolic model followed by stepwise evaluation of inflammatory indices (Figure 1).
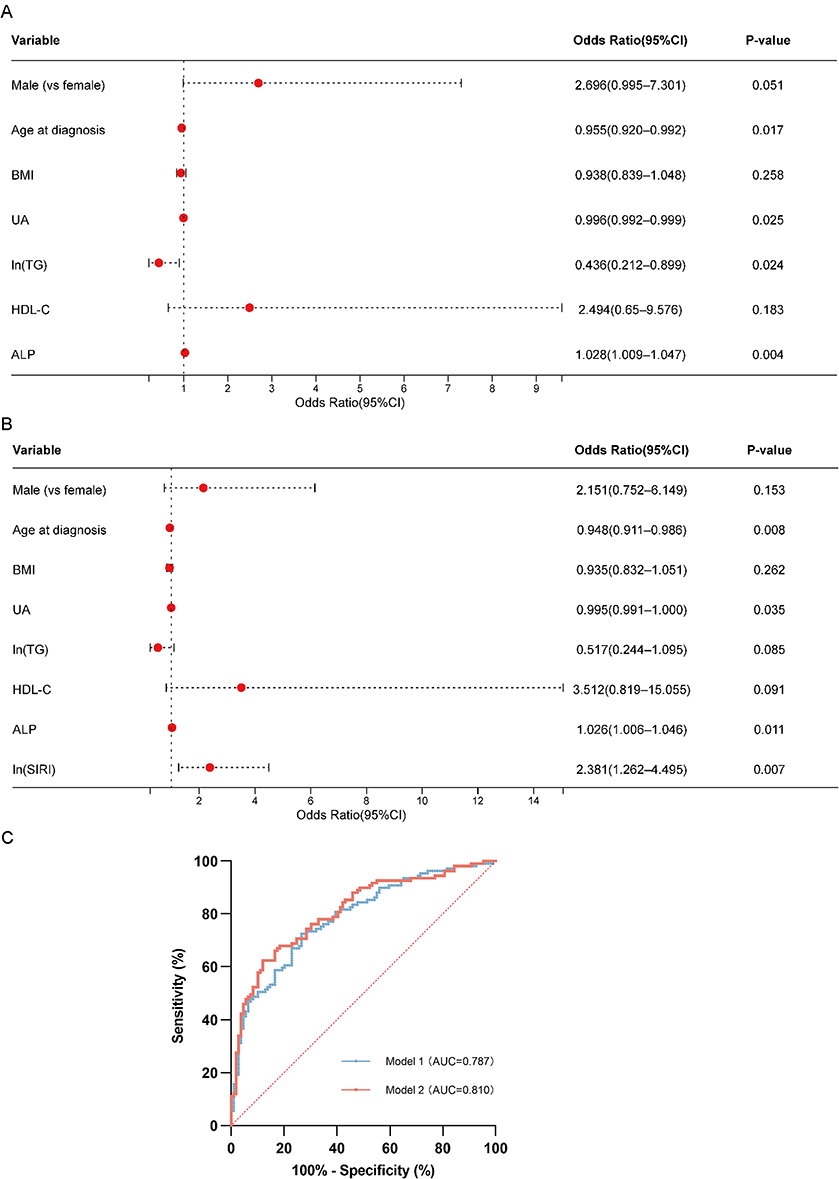 |
Figure 1 Factors associated with low C-peptide status and discrimination of the regression models. Forest plots showing the conditional logistic regression results for the propensity score-matched cohort. Vertical dashed lines in panels A and B indicate OR = 1, and the diagonal dotted line in panel C indicates the no-discrimination reference. (A) Base model (Model 1), including demographic and metabolic variables. Younger age at diagnosis, lower UA, lower ln(TG), and higher ALP were associated with T2DM-LowC status. (B) Integrated model (Model 2). Among the inflammatory indices examined, ln(SIRI) was retained in the final model. Younger age at diagnosis, lower UA, higher ALP, and higher ln(SIRI) remained associated with T2DM-LowC status. For log-transformed variables, the OR represents the change associated with a one-unit increase on the natural-log scale. Red dots represent ORs and horizontal lines represent 95% CIs. (C) ROC curves of Model 1 (blue line, AUC = 0.787) and Model 2 (red line, AUC = 0.810) for discriminating T2DM-LowC from T2DM-PresC. Abbreviations: T2DM-LowC, type 2 diabetes with low C-peptide; T2DM-PresC, type 2 diabetes with preserved C-peptide; PSM, propensity score matching; UA, uric acid; TG, triglycerides; ALP, alkaline phosphatase; SIRI, systemic inflammation response index; OR, odds ratio; CI, confidence interval; ROC, receiver operating characteristic; AUC, area under the curve. |
The base model (including sex, age at diagnosis, BMI, UA, ln[TG], HDL-C, and ALP) showed that lower age at diagnosis (OR = 0.955, 95% CI 0.920–0.992, p = 0.017), lower UA (OR = 0.996, 95% CI 0.992–0.999, p = 0.025), lower ln(TG) (OR = 0.436, 95% CI 0.212–0.899, p = 0.024), and higher ALP (OR = 1.028, 95% CI 1.009–1.047, p = 0.004) were associated with LowC status. Male sex showed a borderline association with LowC status (OR = 2.696, 95% CI 0.995–7.301, p = 0.051).
When immune-inflammatory indices were stepwise added to the base model, only ln(SIRI) was retained in the final model and improved model fit (Δ−2LL = 8.934, p = 0.003). In the final model, higher SIRI remained associated with low C-peptide status (OR = 2.381, 95% CI 1.262–4.495, p = 0.007; approximately 1.83 per doubling), while age at diagnosis, UA, and ALP showed associations similar to those in the base model (Figure 1A and B).
ROC curve analysis showed that the AUC for the base model was 0.787 (95% CI 0.727–0.846), with a sensitivity of 72.48% and specificity of 73.39% at the optimal cutoff. The addition of SIRI increased the AUC to 0.810 (95% CI 0.753–0.867), with the model favoring high-specificity identification (sensitivity 62.39%, specificity 88.07%) (Figure 1C).
In summary, after accounting for disease duration, younger age at diagnosis, lower UA and TG, higher ALP, and higher SIRI were features associated with the low C-peptide subgroup. SIRI provided modest additional discriminatory value beyond baseline clinical variables in this dataset.
Co-Expression Network Analysis Identifies Subgroup-Discriminating Modules and Candidate Genes
Based on the PBMC RNA-seq cohort (n=7 each for HC, PresC, and LowC), WGCNA identified two modules that showed the greatest separation between the two T2DM subgroups: the darkturquoise module (r(PresC) = 0.37, p = 0.1; r(LowC) = −0.56, p = 7.8×10⁻³) and the lightyellow module (r(PresC) = 0.67, p = 8.9×10⁻⁴; r(LowC) = −0.46, p = 0.04). These two modules showed divergent correlations with the T2DM subgroups, with negative correlations with LowC and positive correlations with PresC, suggesting that their expression patterns may help distinguish the subgroups (Figure 2). With the LowC group as the target phenotype, 242 candidate genes were screened from these two modules using the criteria of |MM| ≥0.5, |GS| ≥0.5, and an edge weight ≥0.1.
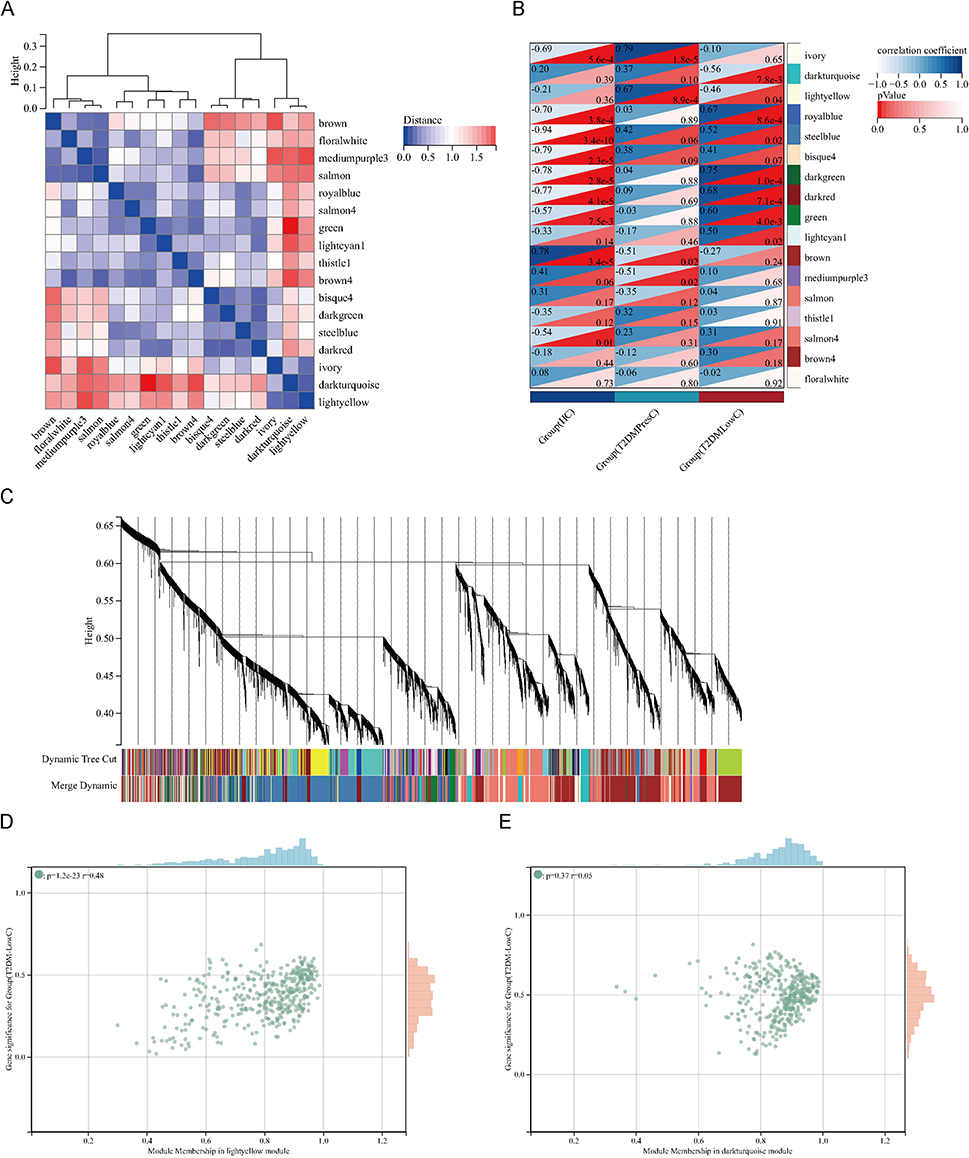 |
Figure 2 WGCNA identifies gene modules associated with low C-peptide status. (A) Hierarchical clustering of MEs. The heatmap shows the dissimilarity (1 - correlation) between MEs, with red indicating high adjacency (positive correlation) and blue indicating low adjacency (negative correlation). (B) Heatmap of the correlation between MEs and clinical traits (HC, T2DM-PresC, and T2DM-LowC). For each cell, the upper triangle displays the Pearson correlation coefficient (color scale: dark blue = +1.0, white = −1.0), and the lower triangle displays the P-value (color scale: dark red = highly significant). The lightyellow and darkturquoise modules showed the most significant and divergent correlations with the T2DM subgroups. (C) Dendrogram of all expressed genes clustered based on a dissimilarity measure (1-TOM). The colored bars below the dendrogram represent the gene modules identified by dynamic tree cutting. (D and E) Scatter plots of GS for the T2DM-LowC group versus MM in the lightyellow module (D) and the darkturquoise module (E). A strong positive correlation between GS and MM in these modules indicates that genes highly associated with the LowC phenotype are also central elements of these modules. Abbreviations: WGCNA, Weighted Gene Co-expression Network Analysis; MEs, module eigengenes; HC, Healthy Control; GS, Gene Significance; MM, Module Membership. Other abbreviations are as previously defined. |
Multi-Strategy Integration Identifies Key Genes Characterizing the LowC Subgroup
To identify exploratory molecular features that differentiated T2DM-LowC from both HC and T2DM-PresC, a multi-tiered screening strategy was applied (Figure 3).
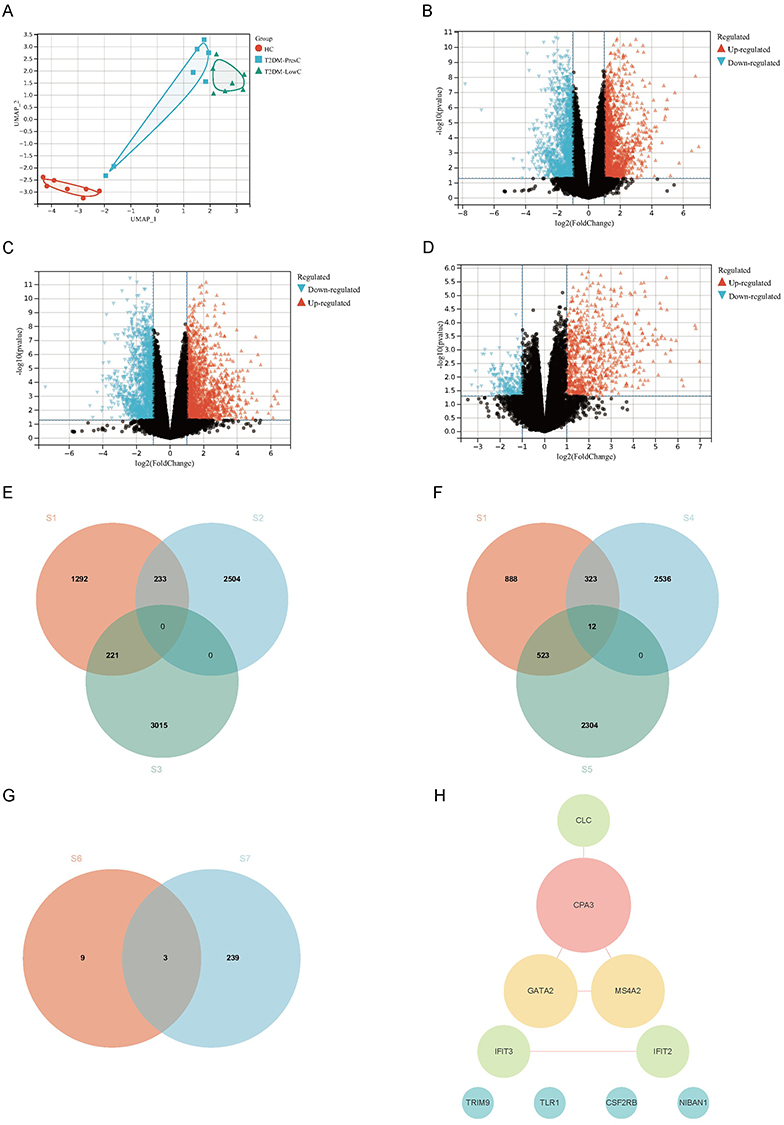 |
Figure 3 Identification of key DEGs associated with low C-peptide status through an integrated multi-strategy approach. (A) UMAP plot of PBMC transcriptomes from Healthy Controls (HC, n=7), T2DM-PresC (n=7), and T2DM-LowC (n=7) groups, showing distinct clustering of the three groups. (B–D) Volcano plots displaying DEGs for the comparisons T2DM-PresC vs. HC (B), T2DM-LowC vs. HC (C), and T2DM-LowC vs. T2DM-PresC (D). Genes with a raw P-value < 0.05 and FC ≥ 1.5 are highlighted as upregulated (red) or downregulated (blue); FDR-based sensitivity analyses are shown in Supplementary Figure S2. (E and F) Venn diagrams illustrating the “direction-constrained” screening strategy. (E) shows the intersection aiming to find genes with a “LowC↑ / PresC↓” pattern relative to HC. The sets are: differentially expressed genes in T2DM-LowC vs. T2DM-PresC (S1), genes down-regulated in T2DM-PresC vs. HC (S2), and genes up-regulated in T2DM-LowC vs. HC (S3). This intersection yielded no overlapping genes. (F) shows the intersection aiming to find genes with a “LowC↓ / PresC↑” pattern relative to HC. The sets are: differentially expressed genes in T2DM-LowC vs. T2DM-PresC (S1), genes up-regulated in T2DM-PresC vs. HC (S4), and genes down-regulated in T2DM-LowC vs. HC (S5). This intersection identified 12 key genes. (G) Venn diagram showing the intersection of the 12 direction-constrained genes from (F) (S6, including two novel transcripts) and the 242 candidate genes from WGCNA (S7). This final integration step yielded three key candidate genes: CSF2RB, NIBAN1, and TLR1. (H) PPI network constructed from the 12 identified direction-constrained genes. The network highlights a core module related to mast cell/eosinophil function, with CPA3 as a central hub connecting GATA2, MS4A2, and CLC. Abbreviations: DEGs, Differentially Expressed Genes; UMAP, Uniform Manifold Approximation and Projection; PBMCs, peripheral blood mononuclear cells; FDR, false discovery rate; FC, fold change; PPI, protein-protein interaction. Other abbreviations are as previously defined. |
Differential expression analysis using an exploratory threshold of raw P < 0.05 and FC ≥ 1.5 revealed 2871 upregulated/2737 downregulated genes in PresC vs HC; 3236 upregulated/2839 downregulated genes in LowC vs HC; and 564 upregulated/1182 downregulated genes in LowC vs PresC (Figure 3A–D).
A “direction-constrained strategy” was used to screen for genes that simultaneously met the following criteria (Figure 3E and F): (1) significantly different in LowC vs PresC; and (2) exhibiting opposite expression directions relative to HC (ie, LowC↓/PresC↑ or LowC↑/PresC↓). This strategy yielded 12 intersection genes, all following the “LowC↓/PresC↑” pattern: CSF2RB, TLR1, NIBAN1, IFIT2, IFIT3, CLC, TRIM9, MS4A2, GATA2, CPA3, and two novel transcripts (MSTRG.13498, MSTRG.12678). No genes matching the opposite “LowC↑/PresC↓” pattern were identified.
MSTRG.13498 and MSTRG.12678 were novel transcripts identified by StringTie assembly with no current functional annotation and were included for exploratory purposes only.
PPI analysis showed that these 12 genes formed a network centered on molecules related to mast cells/eosinophils (Figure 3H). CPA3 was the hub node (highest degree) in the network, directly connecting to GATA2, MS4A2, and CLC, which together constitute a “mast cell-eosinophil” functional module involved in the FcεRI signaling pathway and granule protein release. IFIT2 and IFIT3 interacted with each other, belonging to a type I interferon response subnetwork. The remaining genes (TLR1, CSF2RB, NIBAN1, TRIM9) had low connectivity or were at the periphery of the network. Functional enrichment analysis indicated that these genes are mainly involved in innate immune recognition, FcεRI signal transduction, and granulocyte/mast cell differentiation and activation pathways.
By intersecting these 12 direction-constrained genes with the WGCNA candidate gene set (n=242), three overlapping genes were ultimately obtained: CSF2RB, NIBAN1, and TLR1 (Figure 3G). These three genes simultaneously satisfied a “triple constraint”: (1) differentially expressed in LowC vs PresC under the FDR-based sensitivity threshold (FDR < 0.05 and FC ≥2.0; Supplementary Figure S2); (2) showing opposite expression directions relative to HC (downregulated in LowC, upregulated in PresC); and (3) located within the WGCNA modules with the greatest subgroup separation. Therefore, they were prioritized as key candidate genes for subsequent RT-qPCR validation and ROC discrimination analysis.
RT-qPCR Validation and Molecular Identification Model
In the independent validation cohort (T2DM-PresC=20, T2DM-LowC=20), RT-qPCR analysis confirmed that the expression of all three candidate genes (CSF2RB, NIBAN1, and TLR1) was significantly lower in the LowC group than in the PresC group (all p < 0.05), consistent with the RNA-seq results (Figure 4A–C).
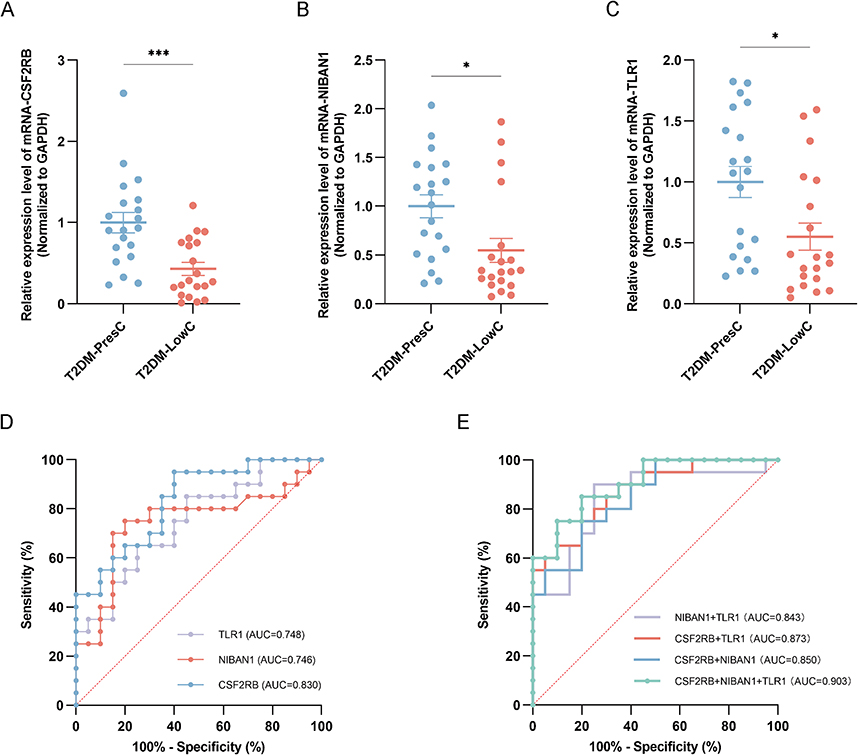 |
Figure 4 Validation and diagnostic performance of candidate gene biomarkers in the RT-qPCR validation cohort. (A–C) Relative mRNA expression levels of CSF2RB (A), NIBAN1 (B), and TLR1 (C) in PBMCs from the validation cohort, comprising T2DM-PresC (n = 20) and T2DM-LowC (n = 20). Expression was quantified by RT-qPCR, normalized to GAPDH, and calculated using the 2^−ΔΔCt method with T2DM-PresC as the calibrator group. Data are presented as individual points with the median and interquartile range. Statistical significance was assessed using the Mann–Whitney U-test. *P < 0.05, ***P < 0.001. (D) ROC curves for the diagnostic performance of the individual gene-expression markers CSF2RB, NIBAN1, and TLR1 in discriminating T2DM-LowC from T2DM-PresC. The diagonal dotted line in panel D indicates the no-discrimination reference. (E) ROC curves for the diagnostic performance of the combined two-gene and three-gene models in discriminating T2DM-LowC from T2DM-PresC. AUC values are shown for each model. The diagonal dotted line in panel E indicates the no-discrimination reference. Abbreviations: RT-qPCR, reverse transcription quantitative polymerase chain reaction. All other abbreviations are as previously defined. |
Single-gene discriminatory performance: ROC curve analysis showed that CSF2RB demonstrated the best single-gene discriminatory power (AUC = 0.830, 95% CI 0.706–0.954; sensitivity 95.0%, specificity 60.0% at the optimal cutoff). NIBAN1 (AUC = 0.746, 95% CI 0.584–0.909; sensitivity 75.0%, specificity 80.0%) and TLR1 (AUC = 0.748, 95% CI 0.597–0.898; sensitivity 65.0%, specificity 75.0%) had comparable performance (Table 2 and Figure 4D).
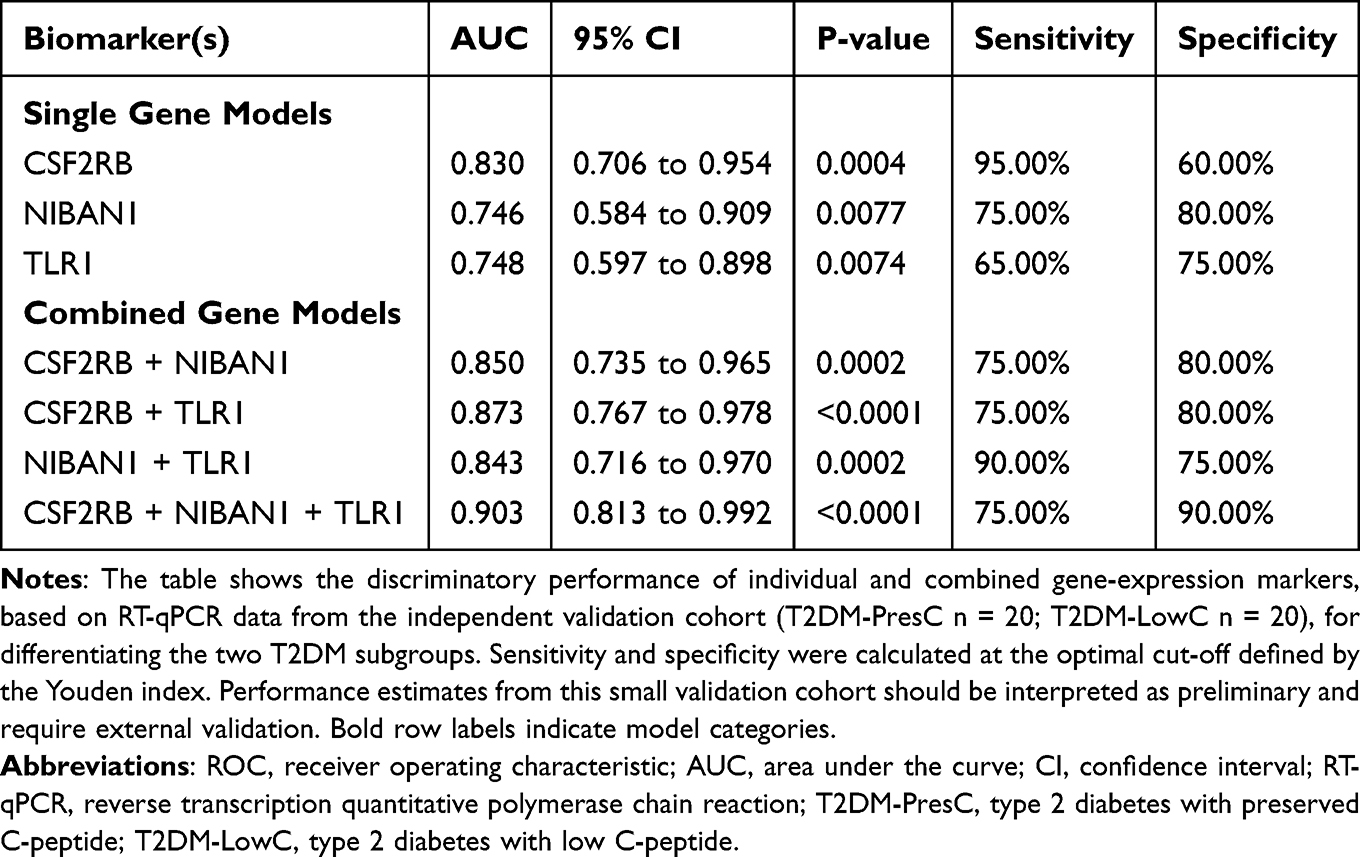 |
Table 2 ROC Analysis of Individual and Combined Gene-Expression Biomarkers in the RT-qPCR Validation Cohort |
Multi-gene combined model: Combining any two genes improved the discriminatory power (AUC range 0.843–0.873). The three-gene combined model achieved the best performance (AUC = 0.903, 95% CI 0.813–0.992; sensitivity 75.0%; specificity 90.0%; Table 2 and Figure 4E). Together, these findings indicate that combined measurement of CSF2RB, NIBAN1, and TLR1 provided better subgroup discrimination than any single gene in this dataset.
Subgroup Differences in Deconvolution-Derived Immune Cell Signatures
To explore PBMC immune signatures associated with the low C-peptide subgroup, CIBERSORTx was used to estimate the relative proportions of 22 LM22 immune cell signatures from the PBMC transcriptomes (Figure 5 and Supplementary Table 2).
 |
Figure 5 Deconvolution-derived immune cell signatures in PBMC transcriptomes among healthy controls, T2DM-PresC, and T2DM-LowC groups. Box plots show the estimated relative proportions of 22 LM22 immune cell signatures inferred from PBMC transcriptomes from HC (n = 7), T2DM-PresC (n = 7), and T2DM-LowC (n = 7). The y-axis represents the estimated relative proportion of each signature. Each box shows the median and interquartile range, with whiskers extending to 1.5 times the interquartile range. Colors indicate HC, T2DM-PresC, and T2DM-LowC groups as shown in the figure legend. Overall between-group differences were assessed using the Kruskal–Wallis test. Symbols above each cell category indicate the overall test result: #P < 0.05, ##P < 0.01, and ###P < 0.001. Annotation brackets indicate pairwise Wilcoxon rank-sum comparisons between the connected groups, and bracketed asterisks indicate pairwise significance: *P < 0.05, **P < 0.01, and ***P < 0.001. Only statistically significant overall and pairwise results are annotated; exact P-values, including nonsignificant and non-estimable comparisons, are provided in Supplementary Table 2. Because these values are deconvolution-derived estimates from PBMC transcriptomes, granulocyte-, eosinophil-, and mast-cell-related signatures should be interpreted cautiously. All abbreviations are as previously defined. |
Compared to HC, T2DM patients exhibited common immune features: an increase in resting CD4 memory T cells, decreases in activated CD4 memory T cells, and reductions in activated mast cells and eosinophils (all p < 0.05). Regulatory T cells (Tregs) were suppressed in both T2DM groups relative to HC, with no difference between subgroups. Resting natural killer (NK) cells showed inconsistent directions between subgroups: they were decreased in PresC vs HC (p = 0.03) but tended to be increased in LowC vs HC (p = 0.05), with a significant overall difference among groups (p = 8.1×10⁻³).
Within the T2DM cohort, the LowC subgroup presented more pronounced cellular reprogramming:
(1) Adaptive immune cells: A decrease in naïve B cells and an increase in memory B cells were observed (both p < 0.05), suggesting a shift toward memory B cells. The proportion of resting CD4 memory T cells was elevated (p = 0.01), while activated CD4 memory T cells showed no difference.
(2) Innate immune cells: The resting NK-cell signature was higher in the LowC group (p = 0.01), whereas the activated NK-cell signature did not differ between the two T2DM groups. Monocyte signatures were numerically higher in LowC (p = 0.07).
(3) Granulocyte- and mast-cell-related signatures: The neutrophil-related LM22 signal was lower in LowC (p = 0.002). Resting mast-cell signatures were also lower (p = 0.01), in parallel with reduced expression of mast-cell-associated genes (CPA3, MS4A2, and GATA2) in the PPI network from Multi-Strategy Integration Identifies Key Genes Characterizing the LowC Subgroup. Activated mast-cell signatures were not detected in either T2DM group. Eosinophil-related signatures were close to the lower limit of detection in both T2DM groups (PresC/LowC both 0.0 ± 0.0), precluding subgroup comparison. These low-abundance PBMC signals were therefore treated as deconvolution-derived signatures rather than direct cell-count estimates.
In summary, the low C-peptide T2DM subgroup showed deconvolution patterns consistent with a shift toward memory B cells, higher resting CD4 memory T-cell and NK-cell signatures, a trend toward higher monocyte representation, and reduced mast-cell-related signatures.
Discussion
This study examined whether the low C-peptide subgroup of type 2 diabetes (T2DM-LowC) is associated with a distinct peripheral immune profile after accounting for disease duration. In addition to differences in clinical phenotype and systemic inflammatory burden, the T2DM-LowC subgroup showed PBMC transcriptomic and deconvolution patterns consistent with altered peripheral immune composition. These findings support the view that, rather than representing a separate disease entity, low C-peptide T2DM represents a clinically relevant insulin-deficient phenotype within the broader heterogeneity of T2DM.
Clinical-Metabolic Phenotype and Inflammatory Burden of the Low C-Peptide Subgroup
By balancing disease duration through propensity score matching, we sought to distinguish features associated with the low C-peptide state from those attributable mainly to longer disease exposure. In this context, the LowC subgroup was associated with a clinical-metabolic pattern characterized by younger age at diagnosis, lower BMI, lower TG and UA, higher ALP, and greater inflammatory burden.
Lower UA and TG together with higher ALP formed a consistent metabolic pattern in the LowC subgroup. Although this combination may appear counterintuitive in diabetes, it is compatible with a phenotype characterized less by classic obesity-related insulin resistance and more by relative insulin deficiency and reduced anabolic reserve. U-shaped associations between UA and adverse outcomes have been reported in diabetes, and within the physiological range UA also contributes to antioxidant defense; accordingly, lower UA in LowC may reflect diminished antioxidant buffering or altered renal-metabolic handling during progressive β-cell failure.26–28 Likewise, lower TG may be more consistent with reduced hepatic lipogenesis in the setting of impaired endogenous insulin action than with a metabolically favorable state.29 Higher total ALP may indicate accompanying hepatic, bone, or inflammatory stress, although the present data cannot distinguish among these sources.30 Taken together, these variables are better interpreted as metabolic correlates of the low C-peptide phenotype than as direct mechanistic mediators.
Consistently, the elevated absolute monocyte count and SIRI point to a more inflammatory systemic milieu in the LowC subgroup. This pattern is consistent with evidence of monocytosis and innate immune activation in T2DM.31,32 In our duration-matched analysis, ln(SIRI) remained associated with low C-peptide status (OR ≈ 2.38 per e-fold increase, 95% CI 1.26–4.50) and modestly improved discrimination beyond the base clinical-metabolic model (AUC 0.787 to 0.810). Because SIRI integrates neutrophils, monocytes, and lymphocytes, it may capture the balance between myeloid activation and adaptive immune restraint. In this setting, SIRI is best viewed as a readily accessible marker of the inflammatory dimension of the LowC phenotype, rather than direct evidence that systemic inflammation is the upstream cause of β-cell failure.
Reprogramming of the Peripheral Immune Landscape: Coordinated Dysregulation of Innate and Adaptive Immunity
Against this background of systemic inflammation, the LowC subgroup showed coordinated shifts in PBMC-derived immune signatures. Two analytical features are important for interpreting these findings. First, only samples with a CIBERSORTx deconvolution P < 0.05 were retained. Second, for LM22 classes with limited resolution in PBMC-based analysis, we placed greater weight on concordance between the deconvolution output and the corresponding gene-expression patterns. Accordingly, the mast-cell-, eosinophil-, and granulocyte-related findings are interpreted here as evidence of altered peripheral immune programs rather than direct quantification of those cell populations.
Among the deconvolution-derived signals, mast-cell-related changes were particularly notable A reverse-separation pattern was observed across the three groups: resting mast-cell signatures were higher in PresC than in HC, but lower in LowC than in PresC, whereas activated mast-cell signatures were essentially absent in both T2DM groups. This pattern was accompanied by reduced expression of CPA3, GATA2, MS4A2, and CSF2RB, supporting coordinated downregulation of mast-cell-associated transcriptional programs in LowC. Similar reductions in FcεRI- and c-Kit-related mast-cell features have been described in adipose tissue from obese individuals with T2DM,33 suggesting that the PBMC-based signal may reflect a broader alteration in mast-cell biology, although it remains an indirect inference. Because functional assays were not performed, these data do not establish mast-cell depletion or dysfunction directly; however, they are compatible with impaired mast-cell maintenance or activation signaling in the low C-peptide state. Given experimental evidence that insulin can support mast-cell survival,34–36 relative insulin deficiency may be one plausible contributor to this pattern.
The NK-cell pattern also suggests altered innate immune activation in LowC. We observed higher resting NK-cell signatures without a corresponding increase in activated NK-cell signatures. Although deconvolution data cannot define function directly, this distribution is compatible with previous reports of reduced NK-cell cytotoxicity, impaired degranulation, and increased exhaustion-associated markers in T2DM.37–39 One possible interpretation is that the higher resting signal reflects relative enrichment of less responsive NK states rather than true functional quiescence. Compartmentalization may also contribute, with activated NK cells preferentially recruited to inflammatory tissues and circulating PBMC profiles remaining enriched for resting-like signatures.40–42 Overall, these findings are more consistent with altered NK-cell responsiveness than with preserved NK-cell activation, although functional validation is still required.
Adaptive immune remodeling was also evident in the LowC subgroup. The combination of lower naïve B-cell and higher memory B-cell signatures suggests a shift toward antigen-experienced B-cell states, a pattern that overlaps with features of immunosenescence and chronic inflammatory activation.43–47 In parallel, resting CD4 memory T-cell signatures were increased, whereas activated CD4 memory T-cell signatures did not differ, implying that peripheral T-cell remodeling in LowC may involve altered activation thresholds or tissue redistribution rather than simple expansion of circulating effector cells. One plausible explanation is compartmentalization, whereby activated lymphocytes are preferentially retained in inflamed tissues such as islets, adipose tissue, or other target organs, while peripheral blood remains relatively enriched for resting or memory-like subsets.48–50 Although this cannot be resolved directly in the present PBMC dataset, the coordinated B- and T-cell changes support the view that adaptive immunity contributes to the immunologic distinctiveness of the LowC phenotype.
Synergistic Interpretation of Multidimensional Immune Biomarkers: From Molecular Signals to Systemic Inflammation
Our integrated screening strategy prioritized three genes—TLR1, CSF2RB, and NIBAN1—that were consistently downregulated in LowC and showed good discriminatory performance in the RT-qPCR cohort. These genes should be regarded as candidate markers emerging from an exploratory discovery-validation framework rather than definitive determinants of disease biology.
Among these genes, CSF2RB is biologically relevant because it participates in IL-3/IL-5/GM-CSF receptor signaling and may relate to the reduced mast-cell- and eosinophil-associated transcriptional signals observed in the discovery dataset.51–55 TLR1 downregulation may indicate altered innate immune sensing, whereas NIBAN1 may reflect broader cellular stress responses. Rather than assigning singular mechanistic roles to each transcript, we interpret the three-gene panel as a compact molecular readout of broader immune-associated alterations linked to the low C-peptide phenotype. In the validation cohort, the combined model (AUC = 0.903) showed better discrimination than any single marker, suggesting that these transcripts may capture partially non-overlapping biological information. However, the present data remain insufficient to define the mechanistic contribution of each gene individually.
At the systemic level, the elevation of SIRI complements the PBMC gene-expression findings by capturing the hematologic dimension of immune activation. Because SIRI integrates neutrophils, monocytes, and lymphocytes, it may reflect a shift toward myeloid-predominant inflammation with relative attenuation of adaptive immune balance. This is biologically relevant in diabetes, where higher systemic inflammatory indices have been linked to insulin resistance and dysglycemia.32,56 In our matched analysis, SIRI remained associated with low C-peptide status and modestly improved subgroup discrimination, suggesting that systemic inflammatory tone and PBMC molecular signatures provide nonredundant information. Nevertheless, the present data do not establish that elevated SIRI lies upstream of β-cell failure; rather, it may represent one measurable component of the broader immunometabolic milieu accompanying the LowC phenotype.
Clinical Translation and Study Limitations
From a translational perspective, the multidimensional marker framework proposed here may help refine identification of patients with a low C-peptide phenotype. One potential application would be a sequential assessment strategy based on clinical features and SIRI, followed—where feasible—by PBMC qPCR assessment of CSF2RB, NIBAN1, and TLR1, with formal C-peptide testing reserved for patients with a high-suspicion profile. Such a sequential strategy is attractive because it combines an inexpensive inflammatory index with a more specific molecular readout. At present, however, this framework should be regarded as hypothesis-generating and will require prospective validation before routine clinical use.
This study has several limitations. First, the cross-sectional design precludes causal inference, and duration matching reduces—but does not eliminate—confounding related to disease chronicity. Second, PBMC transcriptomics reflects systemic immune status and cannot substitute for direct assessment of islet or tissue microenvironments. Third, the RNA-seq discovery cohort was small (n = 7 per group), so the transcriptomic and deconvolution findings should be considered exploratory. Fourth, medication exposure was not incorporated into the matching strategy or primary regression model, and the immunomodulatory effects of glucose-lowering therapies cannot be excluded. Fifth, immune-cell states inferred from CIBERSORTx were not validated with functional assays. Future prospective and mechanistic studies are needed to determine whether the three-gene signature and SIRI predict subsequent C-peptide decline and clinical outcomes, and to clarify how peripheral immune remodeling relates to progressive β-cell dysfunction.
Conclusion
In patients with type 2 diabetes and matched disease duration, low C-peptide status was associated with a distinct immunometabolic profile characterized by higher systemic inflammatory burden and PBMC transcriptomic/deconvolution patterns consistent with altered peripheral immune composition. Integrating SIRI with PBMC expression of CSF2RB, NIBAN1, and TLR1 may provide a non-invasive adjunct for identifying this subgroup. Given the cross-sectional design and small RNA-seq discovery cohort, these findings support candidate biomarker discovery and require prospective validation before mechanistic interpretation or clinical application.
Data Sharing Statement
The data that support the findings of this study are available from the corresponding author, Huibin Huang, upon reasonable request.
Ethics Approval and Consent to Participate
This study was conducted in accordance with the Declaration of Helsinki. The protocol was approved by the Ethics Committee of the Second Affiliated Hospital of Fujian Medical University (Approval No. [2024] 666). Written informed consent was obtained from all participants.
Acknowledgments
We extend our sincere gratitude to all the participants who generously contributed their time and samples to this study. We also thank the nursing staff and technicians at the Department of Endocrinology, the Second Affiliated Hospital of Fujian Medical University, for their invaluable assistance in patient recruitment and sample collection. Graphic abstract created by BioRender.com.
Author Contributions
Huibin Huang: Conceptualization, methodology, supervision, project administration, funding acquisition, writing - review & editing.
Zhengrong Jiang: Conceptualization, methodology, supervision, funding acquisition, writing - review & editing.
Yajing Xu: Investigation, formal analysis, data curation, visualization, writing - original draft, writing - review & editing.
Yiting Li: Investigation, formal analysis, data curation, visualization, writing - original draft, writing - review & editing.
Xiying Zeng: Investigation, validation, resources, writing - review & editing.
Lijun Chen: Investigation, validation, resources, writing - review & editing.
Hongli Lin: Investigation, validation, resources, writing - review & editing.
Wenxin Xie: Investigation, validation, resources, writing - review & editing.
Zitong Wang: Investigation, validation, resources, writing - review & editing.
Honghong Duan: Conceptualization, methodology, supervision, funding acquisition, writing - review & editing.
All authors gave final approval of the version to be published; have agreed on the journal to which the article has been submitted; and agree to be accountable for all aspects of the work.
Funding
This research was supported by grants from the Joint Funding Program of the Natural Science Foundation of Fujian Province (grant number 2023J01740, to H.D.); the Fujian Provincial Health and Wellness Program for Urban and Rural Communities to Promote Appropriate Technologies (grant number 2023TG015, to H.D.); the Key Specialty Clinical Research Program of the Second Affiliated Hospital of Fujian Medical University (grant numbers ZD2024001, to Z.J. and ZD2024002, to H.H.); and the Second Affiliated Hospital of Fujian Medical University Doctoral Research Project (grant number 2022BD0702, to H.H.).
Disclosure
The authors declare no conflicts of interest.
References
1. Lin Y, McCrimmon RJ, Pearson ER. Exploring the potential role of C-peptide in type 2 diabetes management. Diabet Med. 2025;42(3):e15469. doi:10.1111/dme.15469
2. Christensen MB, Gæde P, Hommel E, Gotfredsen A, Nørgaard K. Glycaemic variability and hypoglycaemia are associated with C-peptide levels in insulin-treated type 2 diabetes. Diabetes Metab. 2020;46(1):61–21. doi:10.1016/j.diabet.2019.02.002
3. Hope SV, Knight BA, Shields BM, et al. Random non-fasting C-peptide testing can identify patients with insulin-treated type 2 diabetes at high risk of hypoglycaemia. Diabetologia. 2018;61(1):66–74. doi:10.1007/s00125-017-4449-2
4. Landgraf W, Owens DR, Frier BM, Zhang M, Bolli GB. Fasting C-peptide, a biomarker for hypoglycaemia risk in insulin-naïve people with type 2 diabetes initiating basal insulin glargine 100 U/mL. Diabetes Obes Metab. 2020;22(3):315–323. doi:10.1111/dom.13897
5. Jones AG, McDonald TJ, Shields BM, et al. Markers of β-cell failure predict poor glycemic response to GLP-1 receptor agonist therapy in type 2 diabetes. Diabetes Care. 2016;39(2):250–257. doi:10.2337/dc15-0258
6. Iwamoto Y, Kimura T, Shimoda M, et al. C-peptide index at 2 h post-meal is a useful predictor of endogenous insulin secretory capacity and withdrawal from insulin therapy in subjects with type 2 diabetes. Diabetes Obes Metab. 2024;26(7):2761–2773. doi:10.1111/dom.15595
7. Hope SV, Jones AG, Goodchild E, et al. Urinary C-peptide creatinine ratio detects absolute insulin deficiency in Type 2 diabetes. Diabet Med. 2013;30(11):1342–1348. doi:10.1111/dme.12222
8. Kuo JZ, Guo X, Klein R, et al. Association of fasting insulin and C peptide with diabetic retinopathy in Latinos with type 2 diabetes. BMJ Open Diabetes Res Care. 2014;2(1):e000027. doi:10.1136/bmjdrc-2014-000027
9. Huang Y, Wang Y, Liu C, et al. C-peptide, glycaemic control, and diabetic complications in type 2 diabetes mellitus: a real-world study. Diabetes Metab Res Rev. 2022;38(4):e3514. doi:10.1002/dmrr.3514
10. Wentworth JM, Fourlanos S, Harrison LC. Reappraising the stereotypes of diabetes in the modern diabetogenic environment. Nat Rev Endocrinol. 2009;5(9):483–489. doi:10.1038/nrendo.2009.149
11. Velloso LA, Eizirik DL, Cnop M. Type 2 diabetes mellitus--an autoimmune disease? Nat Rev Endocrinol. 2013;9(12):750–755. doi:10.1038/nrendo.2013.131
12. Pedicino D, Liuzzo G, Trotta F, et al. Adaptive immunity, inflammation, and cardiovascular complications in type 1 and type 2 diabetes mellitus. J Diabetes Res. 2013;2013:184258. doi:10.1155/2013/184258
13. Brooks-Worrell B, Narla R, Palmer JP. Islet autoimmunity in phenotypic type 2 diabetes patients. Diabetes Obes Metab. 2013;15 Suppl 3(s3):137–140. doi:10.1111/dom.12167
14. Kadhim AS, Al-Karawi AS. Investigating the multifactorial correlation between obesity and rheumatoid arthritis: a study of immunological and biochemical markers. Obesity Med. 2025;53:100578. doi:10.1016/j.obmed.2024.100578
15. Kadhim HI, Saad Kadhim A. Exploring the association between obesity, inflammation, and type II diabetes: insights from body mass index correlation and immune response analysis. Al-Nahrain J Sci. 2024;27(3):50–55. doi:10.22401/ANJS.27.3.06
16. Kadhim AS, Al-Karawi AS. Correlation between vitamin D3 levels, autoantibodies, and antibody-related diseases in patients with Hashimoto’s thyroiditis. Turkish J Immunol. 2024;12(3):92–97. doi:10.4274/tji.galenos.2024.65982
17. Maddaloni E, Bolli GB, Frier BM, et al. C-peptide determination in the diagnosis of type of diabetes and its management: a clinical perspective. Diabetes Obes Metab. 2022;24(10):1912–1926. doi:10.1111/dom.14785
18. Iqbal S, Jayyab AA, Alrashdi AM, Reverté-Villarroya S. The predictive ability of C-peptide in distinguishing type 1 diabetes from type 2 diabetes: a systematic review and meta-analysis. Endocr Pract. 2023;29(5):379–387. doi:10.1016/j.eprac.2023.01.004
19. Santos AS, Cunha-Neto E, Gonfinetti NV, et al. Prevalence of inflammatory pathways over immuno-tolerance in peripheral blood mononuclear cells of recent-onset type 1 diabetes. Front Immunol. 2021;12:765264. doi:10.3389/fimmu.2021.765264
20. Sun L, Ren C, Leng H, et al. Peripheral blood mononuclear cell biomarkers for major depressive disorder: a transcriptomic approach. Depress Anxiety. 2024;2024(1):1089236. doi:10.1155/2024/1089236
21. Li Y, Ma C, Liao S, et al. Combined proteomics and single cell RNA-sequencing analysis to identify biomarkers of disease diagnosis and disease exacerbation for systemic lupus erythematosus. Front Immunol. 2022;13:969509. doi:10.3389/fimmu.2022.969509
22. Goossens J, Morrens M, Coppens V. The potential use of peripheral blood mononuclear cells as biomarkers for treatment response and outcome prediction in psychiatry: a systematic review. Mol Diagn Ther. 2021;25(3):283–299. doi:10.1007/s40291-021-00516-8
23. Li X, Liao M, Guan J, et al. Identification of key genes and pathways in peripheral blood mononuclear cells of type 1 diabetes mellitus by integrated bioinformatics analysis. Diabetes Metab J. 2022;46(3):451–463. doi:10.4093/dmj.2021.0018
24. Wong J, McLennan SV, Molyneaux L, Min D, Twigg SM, Yue DK. Mitochondrial DNA content in peripheral blood monocytes: relationship with age of diabetes onset and diabetic complications. Diabetologia. 2009;52(9):1953–1961. doi:10.1007/s00125-009-1424-6
25. Jaber SQ, Kadhim AS, Al Kateeb AI. Investigating the expression of miR 203a 3p and its role in inflammatory response in severe preeclampsia of iraqi women patients – a comparative study. Biomed Biotechnol Res J. 2024;8(3):291–296. doi:10.4103/bbrj.bbrj_210_24
26. Waring WS, McKnight JA, Webb DJ, Maxwell SR. Uric acid restores endothelial function in patients with type 1 diabetes and regular smokers. Diabetes. 2006;55(11):3127–3132. doi:10.2337/db06-0283
27. Huang R, Tian S, Han J, et al. U-shaped association between serum uric acid levels and cognitive functions in patients with type 2 diabetes: a cross-sectional study. J Alzheimers Dis. 2019;69(1):135–144. doi:10.3233/JAD-181126
28. Gawlik K, Naskalski JW, Fedak D, et al. Markers of antioxidant defense in patients with type 2 diabetes. Oxid Med Cell Longev. 2016;2016(1):2352361. doi:10.1155/2016/2352361
29. Ren Y, Ren Q, Lu J, et al. Low triglyceride as a marker for increased risk of cardiovascular diseases in patients with long-term type 2 diabetes: a cross-sectional survey in China. Diabetes Metab Res Rev. 2018;34(2). doi:10.1002/dmrr.2960
30. Malo MS. A high level of intestinal alkaline phosphatase is protective against type 2 diabetes mellitus irrespective of obesity. EBioMedicine. 2015;2(12):2016–2023. doi:10.1016/j.ebiom.2015.11.027
31. Bambo GM, Asmelash D, Alemayehu E, Gedefie A, Duguma T, Kebede SS. Changes in selected hematological parameters in patients with type 1 and type 2 diabetes: a systematic review and meta-analysis. Front Med Lausanne. 2024;11:1294290. doi:10.3389/fmed.2024.1294290
32. He R, Sun H, Liu H, Li J. The relationship between novel inflammatory markers SII, SIRI, MHR, UHR and insulin resistance in patients with type 2 diabetes: based on a retrospective analysis. Front Endocrinol. 2025;16:1648823. doi:10.3389/fendo.2025.1648823
33. Lopez-Perez D, Redruello-Romero A, Garcia-Rubio J, et al. In obese patients with type 2 diabetes, mast cells in omental adipose tissue decrease the surface expression of CD45, CD117, CD203c, and FcϵRI. Front Endocrinol. 2022;13:818388. doi:10.3389/fendo.2022.818388
34. Lessmann E, Grochowy G, Weingarten L, et al. Insulin and insulin-like growth factor-1 promote mast cell survival via activation of the phosphatidylinositol-3-kinase pathway. Exp Hematol. 2006;34(11):1532–1541. doi:10.1016/j.exphem.2006.05.022
35. Carvalho Vde F, Barreto Ede O, Farias-Filho FA, et al. Reduced expression of IL-3 mediates intestinal mast cell depletion in diabetic rats: role of insulin and glucocorticoid hormones. Int J Exp Pathol. 2009;90(2):148–155. doi:10.1111/j.1365-2613.2008.00620.x
36. e Silva PM, Carvalho VF, Cordeiro RS, Martins MA. Down-regulation of allergic responses in conditions of experimental diabetes: a role for glucocorticoids? Neuroimmunomodulation. 2009;16(1):13–18. doi:10.1159/000179662
37. Wang H, Cao K, Liu S, Xu Y, Tang L. Tim-3 expression causes NK cell dysfunction in type 2 diabetes patients. Front Immunol. 2022;13:852436. doi:10.3389/fimmu.2022.852436
38. Yoon Kim D, Kwon Lee J. Type 1 and 2 diabetes are associated with reduced natural killer cell cytotoxicity. Cell Immunol. 2022;379:104578. doi:10.1016/j.cellimm.2022.104578
39. Kim JH, Park K, Lee SB, et al. Relationship between natural killer cell activity and glucose control in patients with type 2 diabetes and prediabetes. J Diabetes Investig. 2019;10(5):1223–1228. doi:10.1111/jdi.13002
40. Golden GJ, Wu VH, Hamilton JT, et al. Immune perturbations in human pancreas lymphatic tissues prior to and after type 1 diabetes onset. bioRxiv. 2024. doi:10.1101/2024.04.23.590798
41. Zhou W, Liu Y, Hu Q, Zhou J, Lin H. The landscape of immune cell infiltration in the glomerulus of diabetic nephropathy: evidence based on bioinformatics. BMC Nephrol. 2022;23(1):303. doi:10.1186/s12882-022-02906-4
42. Wang Q, Yang Y. Bioinformatics analysis of effective biomarkers and immune infiltration in type 2 diabetes with cognitive impairment and aging. Sci Rep. 2024;14(1):23279. doi:10.1038/s41598-024-74480-8
43. Bulati M, Buffa S, Candore G, et al. B cells and immunosenescence: a focus on IgG+IgD-CD27- (DN) B cells in aged humans. Ageing Res Rev. 2011;10(2):274–284. doi:10.1016/j.arr.2010.12.002
44. Grubeck-Loebenstein B, Della Bella S, Iorio AM, Michel JP, Pawelec G, Solana R. Immunosenescence and vaccine failure in the elderly. Aging Clin Exp Res. 2009;21(3):201–209. doi:10.1007/BF03324904
45. Cancro MP. Age-associated B cells. Annu Rev Immunol. 2020;38(1):315–340. doi:10.1146/annurev-immunol-092419-031130
46. Chung MKY, Gong L, Kwong DL, et al. Functions of double-negative B cells in autoimmune diseases, infections, and cancers. EMBO Mol Med. 2023;15(9):e17341. doi:10.15252/emmm.202217341
47. Winslow GM, Papillion AM, Kenderes KJ, Levack RC. CD11c+ T-bet+ memory B cells: immune maintenance during chronic infection and inflammation? Cell Immunol. 2017;321:8–17. doi:10.1016/j.cellimm.2017.07.006
48. Dhenni R, Phan TG. The geography of memory B cell reactivation in vaccine-induced immunity and in autoimmune disease relapses. Immunol Rev. 2020;296(1):62–86. doi:10.1111/imr.12862
49. Pangrazzi L, Meryk A. Molecular and cellular mechanisms of immunosenescence: modulation through interventions and lifestyle changes. Biology. 2024;14(1). doi:10.3390/biology14010017
50. Fu S, Cheng Y, Wang X, et al. Identification of diagnostic gene biomarkers and immune infiltration in patients with diabetic kidney disease using machine learning strategies and bioinformatic analysis. Front Med Lausanne. 2022;9:918657. doi:10.3389/fmed.2022.918657
51. Charlet A, Kappenstein M, Keye P, et al. The IL-3, IL-5, and GM-CSF common receptor beta chain mediates oncogenic activity of FLT3-ITD-positive AML. Leukemia. 2022;36(3):701–711. doi:10.1038/s41375-021-01462-4
52. Esnault S, Hebert AS, Jarjour NN, Coon JJ, Mosher DF. Proteomic and phosphoproteomic changes induced by prolonged activation of human eosinophils with IL-3. J Proteome Res. 2018;17(6):2102–2111. doi:10.1021/acs.jproteome.8b00057
53. Elieh Ali Komi D, Wöhrl S, Bielory L. Mast cell biology at molecular level: a comprehensive review. Clin Rev Allergy Immunol. 2020;58(3):342–365. doi:10.1007/s12016-019-08769-2
54. Tontini C, Bahri R, Higham A, Singh D, Simpson A, Bulfone-Paus S. Microenvironment-driven mast cell plasticity: insights from cytokine-activated gene signatures in skin and respiratory diseases. Allergy. 2025;80(11):3077–3094. doi:10.1111/all.70052
55. Li Y, Qi X, Zhao D, Urban JF, Huang H. IL-3 expands pre-basophil and mast cell progenitors by upregulating the IL-3 receptor expression. Cell Immunol. 2022;374:104498. doi:10.1016/j.cellimm.2022.104498
56. Zhang D, Zeng Y, Sun B, et al. Inflammatory indices-systemic immune-inflammation index (SII) and systemic inflammatory response index (SIRI)-during pregnancy and associations with gestational diabetes mellitus. J Inflamm Res. 2024;17:6521–6532. doi:10.2147/JIR.S474154
 © 2026 The Author(s). This work is published and licensed by Dove Medical Press Limited. The
full terms of this license are available at https://www.dovepress.com/terms
and incorporate the Creative Commons Attribution
- Non Commercial (unported, 4.0) License.
By accessing the work you hereby accept the Terms. Non-commercial uses of the work are permitted
without any further permission from Dove Medical Press Limited, provided the work is properly
attributed. For permission for commercial use of this work, please see paragraphs 4.2 and 5 of our Terms.
© 2026 The Author(s). This work is published and licensed by Dove Medical Press Limited. The
full terms of this license are available at https://www.dovepress.com/terms
and incorporate the Creative Commons Attribution
- Non Commercial (unported, 4.0) License.
By accessing the work you hereby accept the Terms. Non-commercial uses of the work are permitted
without any further permission from Dove Medical Press Limited, provided the work is properly
attributed. For permission for commercial use of this work, please see paragraphs 4.2 and 5 of our Terms.
Recommended articles

Machine Learning-Based Predictive Modeling of Diabetic Nephropathy in Type 2 Diabetes Using Integrated Biomarkers: A Single-Center Retrospective Study
Zhu Y, Zhang Y, Yang M, Tang N, Liu L, Wu J, Yang Y
Diabetes, Metabolic Syndrome and Obesity 2024, 17:1987-1997
Published Date: 10 May 2024

Heterogeneity Assessment of Breast Cancer Tumor Microenvironment: Multiparametric Quantitative Analysis with DCE-MRI and Discovery of Radiomics Biomarkers
Ma W, Yang L, Zhang Y, Gao Y, Jie H, Huang C
Breast Cancer: Targets and Therapy 2025, 17:573-581
Published Date: 8 July 2025