Back to Journals » Drug Design, Development and Therapy » Volume 20
Optimizing Mirtazapine Initial Dosing: A Population Analysis of the Effects of BMI, Paroxetine and Fluvoxamine
Authors Yan H, Huang W ![]() , Xia H, Luo Y, Li Y
, Xia H, Luo Y, Li Y ![]() , Shang D
, Shang D
Received 4 February 2026
Accepted for publication 7 May 2026
Published 3 June 2026 Volume 2026:20 601238
DOI https://doi.org/10.2147/DDDT.S601238
Checked for plagiarism Yes
Review by Single anonymous peer review
Peer reviewer comments 2
Editor who approved publication: Prof. Dr. Tin Wui Wong
Hui Yan,1,2 Wanting Huang,1,2 Hui Xia,1,2 Ya Luo,1,2 Yuqing Li,1,2 Dewei Shang1,3
1Department of Pharmacy, Affiliated Brain Hospital, Guangzhou Medical University, Guangzhou, People’s Republic of China; 2School of Pharmacy, Guangzhou Medical University, Guangzhou, People’s Republic of China; 3Guangdong Engineering Technology Research Center for Translational Medicine of Mental Disorders, Guangzhou, People’s Republic of China
Correspondence: Dewei Shang, Email [email protected]
Purpose: This study aimed to develop a population pharmacokinetic (PPK) model of mirtazapine (MTZ) in Chinese patients with depression and to optimize initial dosing regimens by systematically evaluating the impact of body mass index (BMI) and concomitant medications (paroxetine and fluvoxamine).
Patients and Methods: A retrospective analysis was conducted using 210 serum concentration observations from 105 inpatients. A one-compartment model was developed using nonlinear mixed-effects modeling (NONMEM). Potential covariates, including demographic characteristics and drug-drug interactions, were investigated. The final model was evaluated using goodness-of-fit plots, bootstrap analysis, normalized prediction distribution errors (NPDE), and external validation with independent clinical data (n = 49) and literature data. Monte Carlo simulations were performed to recommend individualized dosing regimens for different subgroups.
Results: The final PPK model estimated the typical apparent clearance (CL/F) and apparent volume of distribution (V/F) as 29.3 L/h and 348 L, respectively. BMI, paroxetine, and fluvoxamine were identified as significant covariates affecting CL/F. Specifically, obesity (BMI ≥ 28 kg/m2), co-administration of paroxetine, and co-administration of fluvoxamine reduced CL/F by 29.4%, 26.9%, and 51.1%, respectively. Simulation results indicated that while a daily dose of 30– 37.5 mg is appropriate for typical patients, dose reductions are necessary for specific subgroups to avoid drug accumulation and toxicity. The recommended dose is 22.5– 30 mg/d for obese patients or those co-medicated with paroxetine and 15 mg/d for those co-medicated with fluvoxamine.
Conclusion: The developed PPK model accurately characterizes the pharmacokinetics of MTZ in Chinese patients, identifying BMI, paroxetine, and fluvoxamine as main factors influencing clearance. These findings provide a valuable reference for optimizing individualized MTZ dosing.
Keywords: mirtazapine, population pharmacokinetics, depression, precision medicine, BMI
Introduction
Mirtazapine (MTZ) is a noradrenergic and specific serotonergic antidepressant (NaSSA). Its mechanism of action is unique; it not only blocks postsynaptic 5-HT2 and 5-HT3 receptors and antagonizes presynaptic adrenergic α2-auto- and heteroreceptors but also acts as a powerful antagonist of histamine H1 receptors.1,2 MTZ is approved by the U.S. Food and Drug Administration (FDA) for the treatment of major depressive disorder (MDD), with a recommended daily dose of 15–45 mg by both the FDA and the European Medicines Agency (EMA).3 Additionally, an off-label dose of 7.5 mg/day is used in clinical practice to alleviate symptoms of insomnia.4,5 This is because MTZ acts as a potent inhibitor of histamine H1 receptors while maintaining low affinity for central and peripheral dopaminergic receptors. Consequently, it can significantly enhance sleep efficiency and continuity without suppressing rapid eye movement (REM) sleep. Given that patients with depression often exhibit characteristic circadian rhythm disruptions, such as shortened REM sleep latency and increased REM activity,6 MTZ plays a significant role in improving symptoms of depression comorbid with insomnia. Moreover, approximately 30–40% of patients with depression still face challenges such as poor efficacy or treatment-resistant depression (TRD) after using traditional antidepressants.7 Therefore, precise dose optimization of MTZ is essential to alleviate the heavy individual and social burdens on these patients, while also improving their residual symptoms and overall quality of life.
Previous retrospective studies1,8–10 have indicated that age, sex, smoking status, and race may influence the serum concentrations of MTZ. For example, one study10 has reported that the concentration-to-dose (C/D) ratio is higher in Asians compared to Caucasians and that co-medication with paroxetine is positively correlated with increased serum concentrations. Furthermore, a case report11 showed that the combination of MTZ and fluvoxamine increased mirtazapine serum concentrations by three to fourfold. Another case report12 documented a patient who developed serotonin syndrome while receiving this combination therapy. However, there is a lack of research on population pharmacokinetic (PPK) on MTZ at present. Only one PPK study13 conducted in a Caucasian population has investigated the impact of CYP2D6 genotypes on clearance. However, this study was limited by a small sample size (n = 65) and the absence of Asian subjects, which limits the extrapolation of its conclusions.
Regarding its pharmacokinetics (PK), MTZ exhibits linear characteristics within the therapeutic dose range and achieves steady state in about 5 days.1,2 The drug undergoes extensive metabolism, mainly involving the cytochrome P450 isoenzymes CYP3A4, CYP2D6, and CYP1A2.14,15 Therefore, its clearance is susceptible to genetic polymorphisms and concomitant medications (eg., CYP inhibitors). Given the significant individual differences, the Consensus Guidelines for Therapeutic Drug Monitoring in Neuropsychopharmacology (AGNP Consensus Guidelines)15 recommend therapeutic drug monitoring (TDM) for MTZ (recommendation level 2), suggesting a therapeutic reference range of 30–80 ng/mL. Specifically, 30 ng/mL serves as the lower threshold for efficacy, while 80 ng/mL represents the upper limit of the therapeutic range. Although MTZ exhibits low toxicity in monotherapy overdose, the guidelines still set 160 ng/mL to an alert threshold (twice the upper limit of the therapeutic window).
Moreover, weight gain is one of the most common adverse reactions of MTZ,16,17 and such weight fluctuations may further influence therapeutic outcomes in depression.18 However, there is still a lack of in-depth research on the relationship between weight, dose and concentration. For patients of different weights, especially those with drug-induced weight gain, there is still a lack of research evidence on changes in drug concentrations in their bodies and the necessity of dose adjustment.
Population pharmacokinetic (PPK) modeling, utilizing the nonlinear mixed-effects (NONMEM) approach, serves as a powerful tool for optimizing individualized dosing regimens. It enables the quantitative estimation of population typical values and inter-individual variability (IIV) of pharmacokinetic parameters based on sparse sampling data from clinical TDM. Therefore, this study aims to develop a PPK model of MTZ using TDM data from Chinese patients with depression. We systematically investigate the impact of potential covariates, including weight and concomitant medications (such as paroxetine and fluvoxamine), on pharmacokinetic process, thereby providing a basis for formulating precise, individualized dosing regimens in clinical practice.
Materials and Methods
Study Design
Data on serum concentrations and associated electronic medical records (EMR) were retrospectively collected from inpatients with depression who underwent therapeutic drug monitoring (TDM) for MTZ at The Affiliated Brain Hospital of Guangzhou Medical University between May 1, 2024, and September 15, 2025. This study was approved by the Ethics Committee of the Affiliated Brain Hospital of Guangzhou Medical University (approval number: 2021027) and was conducted in accordance with the Declaration of Helsinki.
Inclusion Criteria
(1) Inpatients receiving MTZ treatment; (2) Patients diagnosed with the following depressive disorders according to ICD-11 or DSM-5 criteria: post-schizophrenic depression, major depressive disorder, recurrent depressive disorder, mixed anxiety and depressive disorder, depressive disorder with anxious distress or severe depressive episode with or without psychotic symptoms; (3) Patients of Chinese ethnicity.
Exclusion Criteria
(1) Serum concentrations outside the quantitative range; (2) Patients with incomplete clinical data; (3) Patients with diseases causing severe hepatic impairment, including viral hepatitis, alcoholic liver disease, ischemic hepatitis, non-alcoholic steatohepatitis (NASH), and autoimmune hepatitis; (4) Patients with severe renal impairment (estimated glomerular filtration rate GFR < 30 mL/[min·1.73m2]).
Dosing Regimens and Concentration Measurement
Drug Administration and Reagents
MTZ tablets were manufactured by Harbin Sanlian Pharmaceutical Co., Ltd. (15 mg per tablet). The daily dosage ranged from 7.5 to 45 mg, administered once nightly. All serum concentration data were derived from therapeutic drug monitoring (TDM). The assay kits were produced by Hybribio Co., Ltd., and analysis was performed using a liquid chromatography-tandem mass spectrometry (LC-MS/MS) system manufactured by Shimadzu Corporation (Japan). The linear quantitative range of the method was 7.56–453.6 ng/mL. According to the AGNP Consensus Guidelines,15 the therapeutic reference range for MTZ is 30–80 ng/mL, with a toxic threshold of 160 ng/mL.
Sample Collection and Preparation
Steady-state blood samples (3–5 mL) were collected between 8:00 and 9:00 AM the morning following each dose. Samples were centrifuged at 3500 rpm. A 100 μL aliquot of serum was transferred to a 2 mL centrifuge tube, to which 20 μL of internal standard (IS) working solution was added. Subsequently, 500 μL of acetonitrile was added for protein precipitation. The mixture was vortexed for 30 s and centrifuged at high speed for 5 min. Finally, 100 μL of the supernatant was transferred to an autosampler vial for LC-MS/MS analysis.
Chromatographic and Mass Spectrometric Conditions
Chromatographic separation was performed on an Agilent XBD-C18 column. The mobile phase consisted of 5 mM ammonium formate in 75% methanol and pure methanol, using isocratic elution. The flow rate was set at 0.5 mL/min, the column temperature was maintained at 40°C, and the injection volume was 1 μL. Mass spectrometric analysis was conducted in positive ion mode. Key parameters included a desolvation line (DL) temperature of 250°C, a drying gas temperature of 350°C, and a drying gas flow rate of 15 L/min.
Data Collection
The following data were collected for this study: (1) demographic characteristics (sex, age, height, weight, and body mass index [BMI]); (2) daily dosage; (3) serum concentrations; (4) concomitant medications (venlafaxine, fluvoxamine, paroxetine, duloxetine, fluoxetine and risperidone); (5) liver function indicators (aspartate aminotransferase and alanine aminotransferase); and (6) renal function indicators (glomerular filtration rate [GFR] and creatinine).
Data Analysis and Modeling Software
Data analysis was performed using nonlinear mixed-effects modeling. Model parameters were estimated using a one-compartment model (subroutine ADVAN2) implemented in NONMEM (version 7.3, Icon Development Solutions, Ellicott City, MD, USA). The First-Order Conditional Estimation with Interaction (FOCE-I) method was employed. Model development and evaluation were managed using Pirana (version 2.9.0). R (version 4.1.2), GraphPad Prism (version 10.1.2), and Origin (version 2025) were utilized for statistical analysis and graphical visualization.
Base Model
Since the majority of MTZ serum concentrations were measured approximately 12 hours after the last dose (corresponding to the elimination phase), data characterizing the absorption phase were insufficient. Consequently, the absorption rate constant Ka was fixed at a literature-based value of 1.2 h−1 during the analysis.
Inter-individual variability (IIV) for pharmacokinetic parameters, specifically clearance (CL/F) and apparent volume of distribution (V/F), was described using an exponential model:

Where  represents the parameter value for the
  individual, and
  denotes the typical population value. The random variable
  is assumed to follow a normal distribution with a mean of 0 and a variance of
  .
.
Residual variability was described using a proportional error model:

Where  and
and  respectively represent the observed and predicted concentrations for the
  individual at time
  . Where
  denotes the proportional residual error. This residual variability was assumed to follow a normal distribution with a mean of 0 and a variance of
  .
.
Covariate Model
Covariate model building was conducted using a stepwise approach consisting of forward inclusion and backward elimination. Continuous covariates (age, AST, ALT, eGFR, and CR) were evaluated using a linear model, while categorical covariates (sex, BMI, and concomitant medications) were evaluated using a proportional model.


 denotes the median value of the continuous variable,
  is the variable used to adjust the
  PK parameter. For BMI covariates, a
  of 1 represents BMI ≥ 28 kg/m2 and 0 represents BMI < 28 kg/m2. For gender covariates, a
  of 1 represents female and 0 represents male. For concomitant medication, a
  of 1 represents co-administration and 0 represents no co-administration.
During the forward inclusion process, covariates were sequentially added to the model. In the first round, a significance level of  was applied; a covariate was included if its addition resulted in a decrease in the objective function value (OFV) of more than 6.63 (
 ). After evaluating all covariates, the model demonstrating the largest reduction in OFV was selected as the new reference model. Subsequently, a second round of inclusion was conducted with a significance level of
  (requiring a decrease in OFV >6.63). This procedure yielded the full model.
In the backward elimination process, each covariate was sequentially removed from the full model. A stricter significance level of  was applied. A covariate was retained in the final model only if its removal caused an increase in the OFV of more than 10.83, indicating statistical significance.
Model Evaluation
Internal Evaluation
The final model was evaluated using Goodness-of-Fit (GOF) plots, bootstrap analysis, and The normalized prediction distribution error (NPDE).
GOF Plots
The GOF plots included observed concentrations (DV) versus population predictions (PRED), DV versus individual predictions (IPRED), conditional weighted residuals (CWRES) versus PRED, and CWRES versus time after last dose (TALD). For the DV vs. PRED and DV vs. IPRED plots, a close alignment between the trend lines and the line of identity (y = x) indicated a good description of the central tendency of the data. For the CWRES plots, the model fit was considered adequate if most data points were symmetrically distributed around the zero line (y = 0) (mainly within the range of ±2) and showed no significant systematic bias or temporal trends.
Bootstrap Analysis
A bootstrap analysis was performed to assess parameter stability by generating 1,000 resampled datasets. The model was considered stable if the 95% confidence intervals (2.5th to 97.5th percentiles) derived from the bootstrap runs included the final model estimates, and the successful convergence rate exceeded 80%.
NPDE
The NPDE and associated visual diagrams were generated for each dataset through nonparametric bootstrapping (n = 1,000), utilizing R (version 4.5.1) and the corresponding package.
External Evaluation
External validation was performed using independent datasets to evaluate the predictive performance and robustness of the final model across different data sources. The validation data were derived from two sources: independent clinical patient data newly collected at our institution and published pharmacokinetic data obtained via a literature search.
Independent Clinical Data Evaluation
MTZ therapeutic drug monitoring (TDM) data were collected from inpatients at our institution between September 16, 2025, and November 17, 2025. To ensure data quality and independence from the modeling dataset, the following screening criteria were established: Inclusion criteria: (1) Continuous administration of MTZ for more than 10 days to ensure that steady-state plasma concentrations were achieved; (2) A clear dosing regimen with a frequency of once nightly (QD), and blood sampling strictly controlled between 7:00 and 8:00 AM on the morning following the last dose (representing steady-state concentrations); (3) Complete therapeutic drug monitoring records. Exclusion criteria: (1) Missing demographic information; (2) BMI ≥ 28kg/m2 (obese patients); (3) Co-administration of paroxetine or fluvoxamine; (4) Patients already included in the model-building dataset (to ensure complete independence of the validation set).
Literature Data Evaluation
Published pharmacokinetic data of MTZ were collected by systematically searching the Web of Science and Scopus databases. The search strategy in Web of Science was: MTZ (Topic) AND concentration OR “drug monitoring” OR serum OR plasma OR “blood level” OR TDM (Topic) and Article (Document Types). The search strategy in Scopus was: TITLE (MTZ) AND TITLE-ABS-KEY (concentration* OR “drug monitoring” OR serum OR plasma OR “blood level*” OR TDM) AND (LIMIT-TO (DOCTYPE, “ar”)).
Model Simulation
Based on the final population pharmacokinetic model, Monte Carlo simulations were performed (n = 1000). To reflect real-world clinical practice, a once-daily dosing regimen administered at 20:00 was simulated. Given the elimination half-life of MTZ (20–40 h), steady-state conditions are typically achieved within 3–8 days; therefore, a dosing duration of 15 days was selected to ensure steady-state serum concentrations were reached. The sampling time was set at 8:00 a.m. following the last dose. Simulations were conducted across common daily dose levels (7.5, 15, 22.5, 30, 37.5, and 45 mg). Virtual patients were stratified into six subgroups based on BMI cutoffs and co-medication status: (1) BMI < 28kg/m2 without co-medication; (2) BMI < 28kg/m2 with paroxetine; (3) BMI < 28kg/m2 with fluvoxamine; (4) BMI ≥ 28kg/m2 without co-medication; (5) BMI ≥ 28kg/m2 with paroxetine; (6) BMI ≥ 28kg/m2 with fluvoxamine.
Result
Study Population
A total of 210 serum concentration observations from 105 patients were included in this study. The study population consisted of 43 males and 62 females, aged 13–79 years. Detailed demographic information is summarized in Table 1.
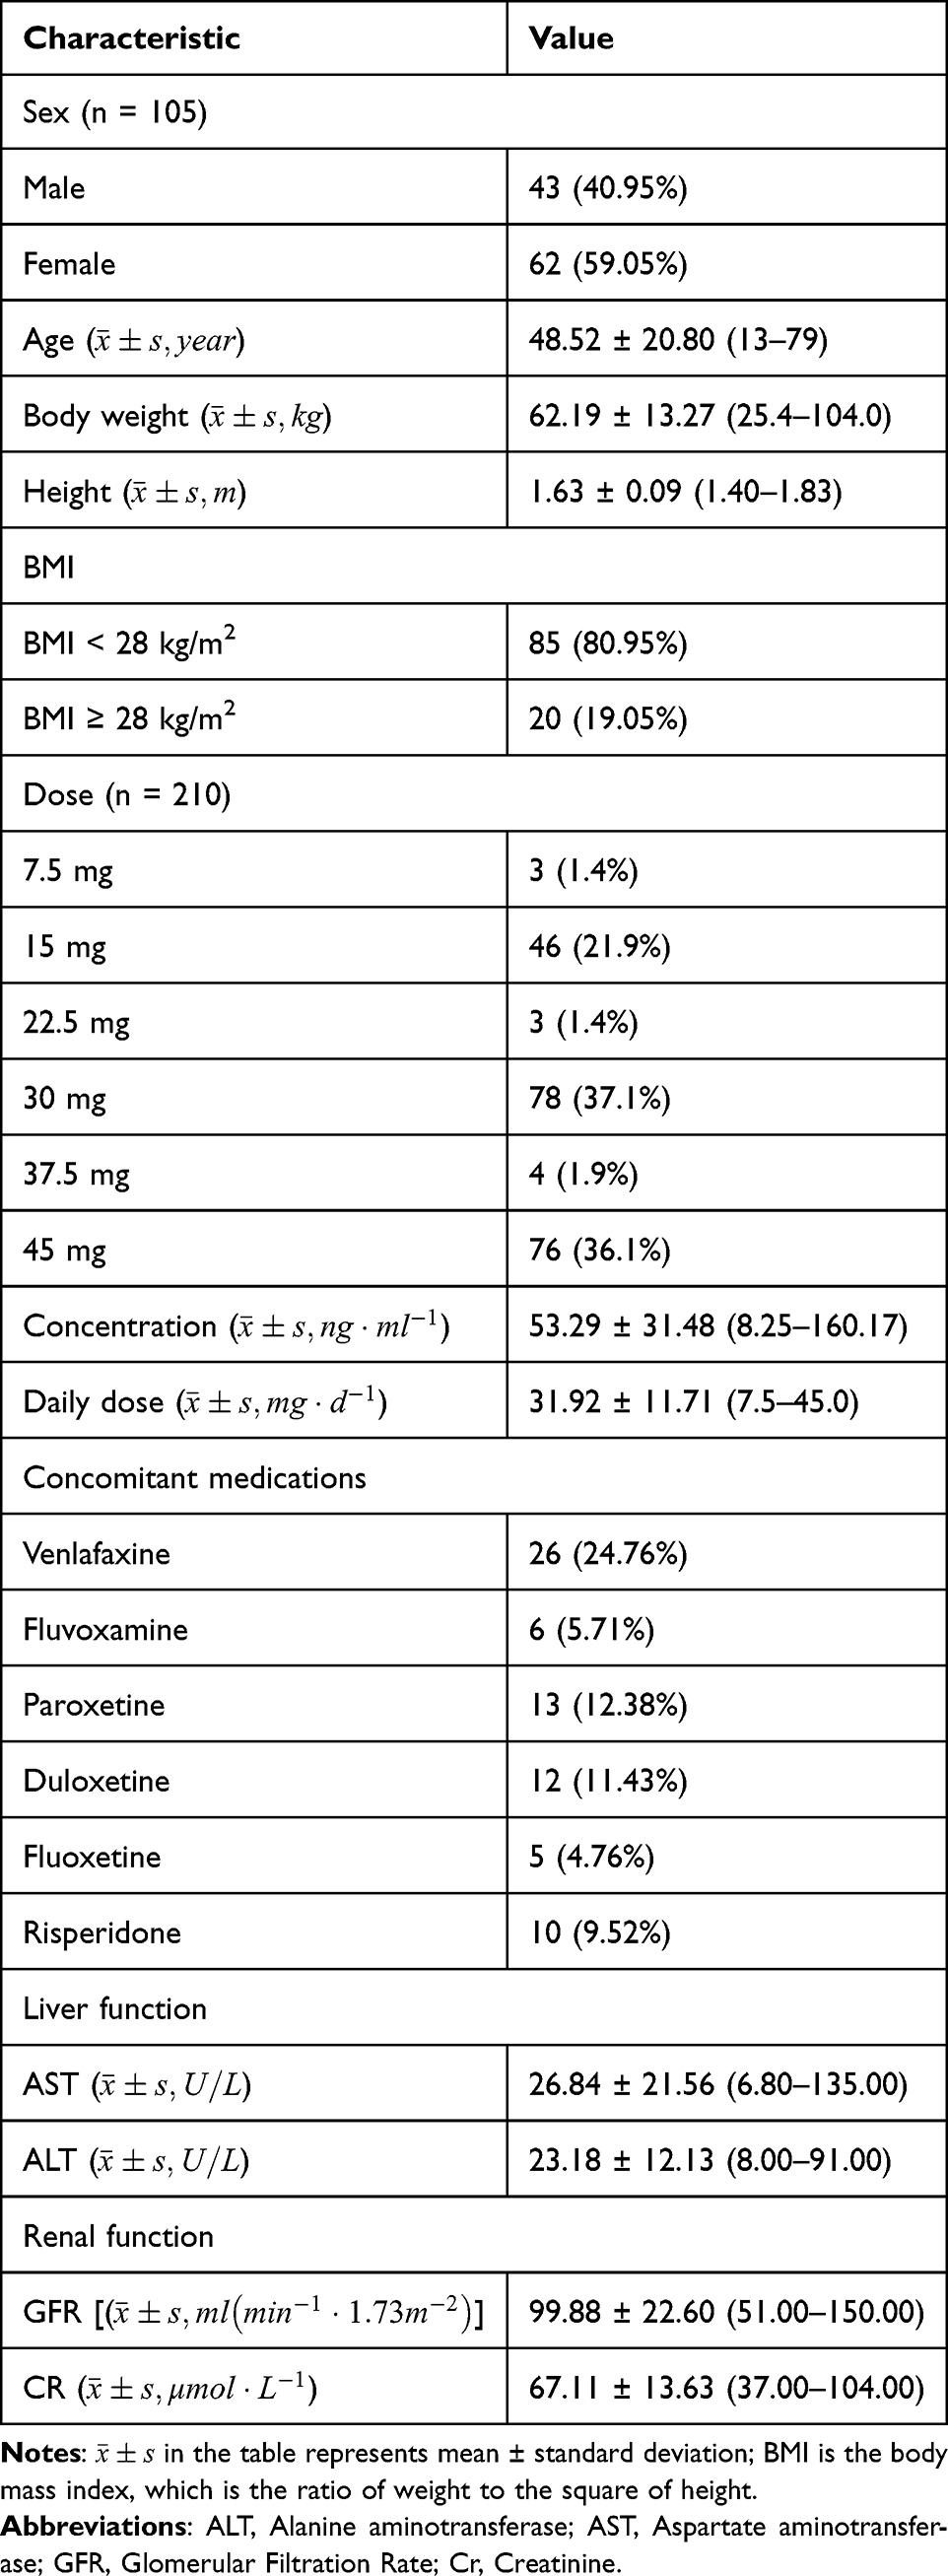 |
Table 1 Characteristics of Patients in the Population Pharmacokinetic Model |
Development of Population Pharmacokinetic Model


The typical population values of CL/F and V/F in the final model are 28.9 and 310, respectively. The results of covariate screening showed that BMI, combined paroxetine and combined fluvoxamine have an effect on CL/F. The relative standard error (RSE%) of all parameters is within 25% (Table 2).
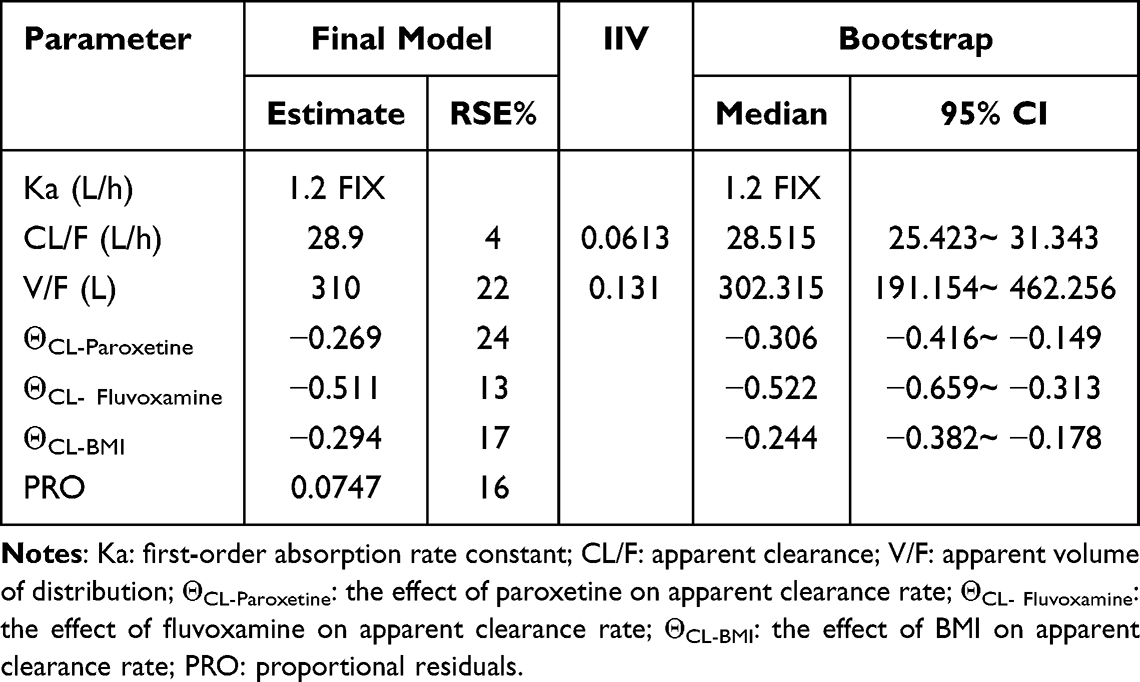 |
Table 2 Parameter Estimates and Bootstrap Results of Mirtazapine Pharmacokinetic Model |
Covariate Effects on Mirtazapine Apparent Clearance
Covariable analysis shows that BMI, paroxetine and fluvoxamine are significant factors affecting the CL/F of MTZ. As shown intuitively in Figure 1, the existence of these factors has led to a decrease in the clearance rate of MTZ. (The detailed covariate analysis process is presented in Supplementary Tables 1–3).
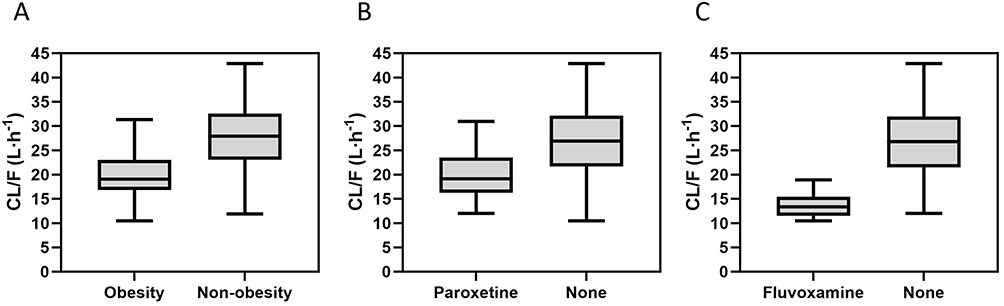 |
Figure 1 Boxplots of individual apparent clearance (CL/F) values estimated by the final model using collected real-world clinical data. The distributions are stratified by (A) obesity status (BMI ≥ 28 kg/m2), (B) co-administration of paroxetine, and (C) co-administration of fluvoxamine. |
Model Evaluation
Internal Validation
GOF Plots
The GOF plots of the final model are shown in Figure 2. Figure 2A and B show that there is good consistency between the PRED and the IPRED and the DV. The vast majority of data points are evenly distributed on both sides of the equal weighted line (y = x), indicating that there is no obvious deviation in the model. Although the trend line is slightly off in the high-concentration area, it may be due to the small clinical sample size (sparse data) in the high-concentration range. Figure 2C and D show that the CWRES is mainly distributed in the ±2 range, and there is no significant tendency to change with the predicted concentration or time after last dose, indicating that the model fits well.
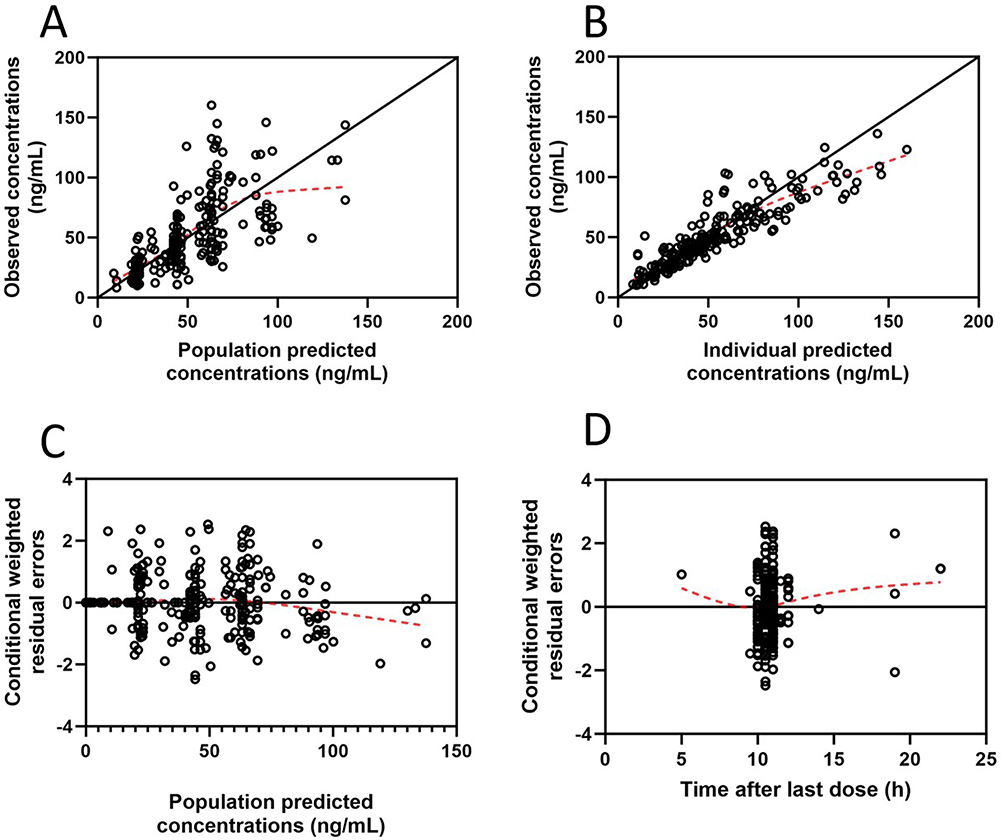 |
Figure 2 Goodness-of-fit plots for the final population pharmacokinetic model. (A) Observed concentrations (DV) versus population predicted concentrations (PRED); (B) DV versus individual predicted concentrations (IPRED); (C) Conditional weighted residuals (CWRES) versus PRED; (D) CWRES versus time after last dose (TAD). The solid black lines represent the lines of identity (y = x) or the zero lines (y = 0), while the dashed red lines represent the locally weighted scatterplot smoothing (LOESS) trend lines. |
Bootstrap Analysis
The results of the bootstrap analysis are shown in Table 2. The median parameter values obtained from bootstrapping fell within the 95% confidence intervals (CIs) and were consistent with the estimates of the final model. Furthermore, the final model successfully converged in 924 out of 1,000 bootstrap runs, corresponding to a success rate of 92.4%. These findings indicate that the model possesses good stability.
NPDE
Figure 3 confirms the model’s predictive performance. The histogram (A) and Q-Q plot (B) show that the errors follow a standard normal distribution. In the scatterplots (C and D), no specific trends are observed against time or predicted concentrations. The data mainly fall within the 95% PI. These results demonstrate that the final model is robust and has no significant bias.
 |
Figure 3 The normalized prediction distribution error (NPDE) for the final model. (A) Histogram of the NPDE distribution overlaid with the theoretical density of a standard normal distribution; (B) Quantile-quantile (Q-Q) plot of the NPDE against the theoretical standard normal distribution; (C) Scatterplot of NPDE versus time; (D) Scatterplot of NPDE versus predicted concentrations (Predicted DV). Notes: In plots C and D, the solid lines represent the empirical 5th, 50th, and 95th percentiles of the NPDE. The pink and blue shaded areas indicate the 95% prediction intervals for the median and the extreme boundaries (5th and 95th percentiles), respectively. |
External Evaluation
Independent Clinical Data Evaluation
The study collected data on the steady-state concentration of MTZ of 49 new patients for verification. The results show that the vast majority of external observations (43/49, about 87.8%) fall within the 95% prediction interval (95% PI) of the model simulation. This indicates that the model adequately captures the concentration distribution characteristics of real-world patients and demonstrates good predictive accuracy.
Literature Data Evaluation
After passing the strict screening process, it was finally included in 8 relevant literatures4,9,19–24 (in Supplementary Figure 1 and Supplementary Table 4 for the screening process and details). Since most of the data reported in the literature are group averages or medians, we compared these aggregate data with the simulation intervals of the corresponding dose group. As shown in Figure 4, the concentration points of all literature sources are completely within the 95% PI range of the model simulation, which further confirms the robustness of the model among different research groups.
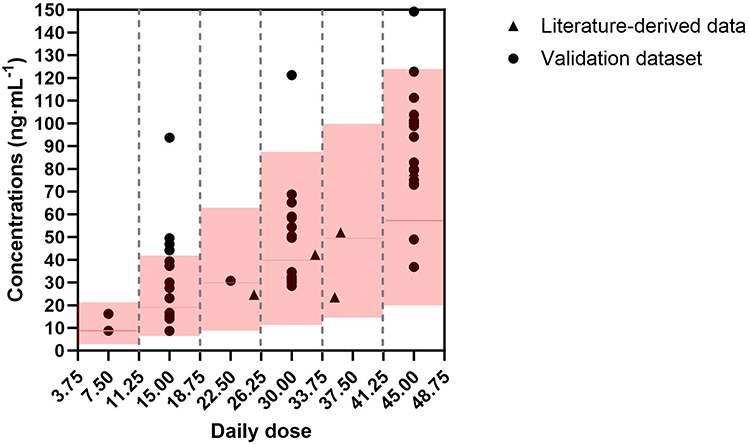 |
Figure 4 External validation of the final population pharmacokinetic model. The plot compares external observed concentrations with model-simulated profiles across various daily dose levels. Solid black circles represent individual plasma concentrations from the independent clinical validation dataset (n = 49). Solid black triangles represent aggregate concentration values (mean or median) extracted from published literature. The solid red line indicates the median of the model simulations, while the red shaded regions represent the 95% prediction intervals (PI) of the simulated concentrations. |
Monte Carlo Simulations
The simulation results revealed significant effects of covariates on MTZ exposure and therapeutic target attainment (PTA) (Figure 5).
 |
Figure 5 Simulated steady-state concentration distributions and probability of target attainment (PTA) at various dose levels across different subgroups based on the final model. (A) Typical patients without covariates; (B) Obese patients (BMI ≥ 28kg/m2); (C) Co-administration with paroxetine; (D) Co-administration with fluvoxamine; (E) Obese patients co-administered with paroxetine; (F) Obese patients co-administered with fluvoxamine. Main plots (Raincloud plots): These plots illustrate the distribution of simulated concentrations. The x-axis represents the simulated concentration values, and the y-axis represents the daily dose. The colored areas show the kernel density estimation curves, indicating the shape of the data distribution. The scatter points below the curves represent individual simulated concentrations. The central dots and horizontal lines denote the medians and interquartile ranges (IQR), respectively. The black vertical dashed lines demarcate the therapeutic window (30–80 ng/mL), while the red vertical solid line represents the laboratory alert concentration (160 ng/mL). Inset plots: The line graphs display the PTA. The x-axis represents the daily dose, and the y-axis represents the percentage of simulated concentrations falling within the therapeutic window. |
For typical patients (Figure 5A), the PTA under low doses (15 mg/d) is low, only 16.0%. In the dose range of 30–37.5 mg/d, PTA reached a peak (70.0% and 74.6% respectively). Even at the highest dose (45 mg/d), the concentration rate decreased slightly (66.5%), but few simulated concentrations exceeded the alert threshold.
Compared to typical patients, patients with obesity or co-administered paroxetine (Figure 5B and C) significantly improved the standard rate (48.8% or 45.9%) at low doses. At the dose of 22.5–30mg/d, the PTA of both groups had exceeded 70%. It is worth noting that when the dose is increased to ≥37.5 mg/d, the concentration of some individuals has begun to exceed the alert threshold of 160 ng/mL, suggesting a potential risk of overdose.
For patients co-administered fluvoxamine (Figure 5D), a high PTA (78.4%) was achieved even at the low dose of 15 mg/d. However, the risk of drug accumulation increased sharply with escalating doses. When doses exceeded 30 mg/d, a substantial proportion of simulated concentrations surpassed the alert threshold; at 45 mg/d, the median concentration approached the alert limit.
Obese patients co-administered paroxetine or fluvoxamine (Figure 5E and F) can achieve high PTA (76.5% and 69.8% respectively) at low doses of 15 mg/d. However, the risk under high doses is further amplified. Especially for obese patients who co-administered fluvoxamine (Figure 5F), at a higher dose of 37.5–45 mg/d, the simulated concentration was almost completely out of the therapeutic window (PTA of only 4.7% and 2.0%, respectively), and the concentration of the vast majority of individuals far exceeded the alert threshold.
As shown in the Figure 6, the simulation results are classified according to BMI (obese vs. non-obese) and BMI significantly alters the dose-concentration relationship. A comparison between Figure 6A and B reveals that, under same co-medication conditions, the curves in Figure 6B are located above those in Figure 6A, indicating that obese patients have higher drug concentrations at the same doses. To achieve the same target concentration (eg., the equal concentration points of the cross-cutting curves in the figure), the dose required for obese patients is significantly lower than that for non-obese patients. This difference is numerically about 7.5 mg (equivalent to half a standard tablet). Specific subgroups and their corresponding recommended and high-risk doses are summarized in Table 3.
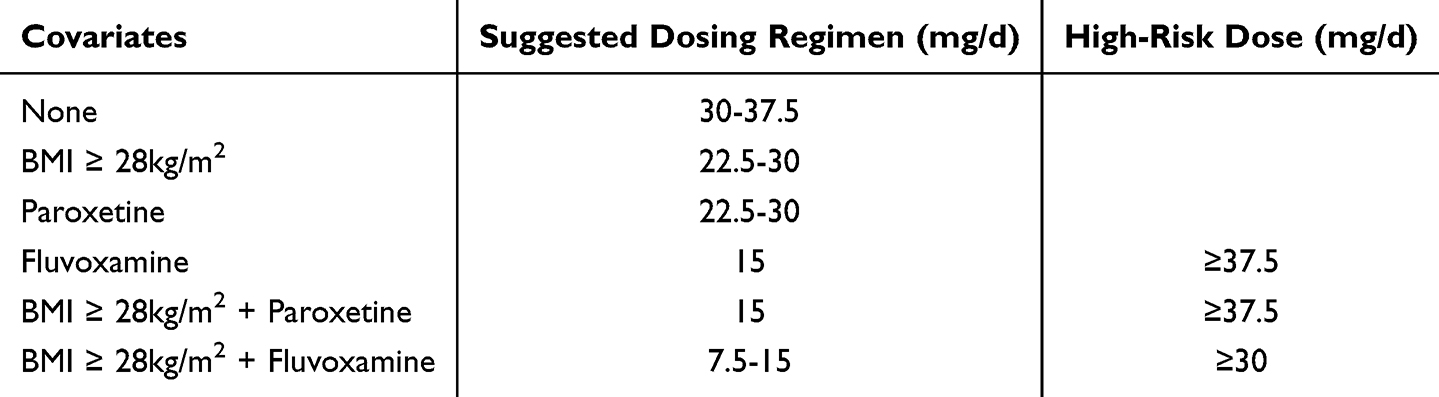 |
Table 3 Recommended and High-Risk Doses of Mirtazapine Across Different Subgroups |
 |
Figure 6 Mirtazapine dose versus simulated steady-state concentration profiles stratified by BMI and co-medication status. (A) Dose versus simulated steady-state concentration profiles in non-obese patients (BMI < 28kg/m2) stratified by co-medication status. (B) Dose versus simulated steady-state concentration profiles in obese patients (BMI ≥ 28kg/m2) stratified by co-medication status. Abbreviations: PRX, paroxetine; FLV, fluvoxamine. |
Discussion
In this study, a PPK model of MTZ was developed and validated in a Chinese population, with a systematic evaluation of the effects of demographic and co-medication factors on model parameters. Given the sparsity of the clinical data, the absorption rate constant (Ka) was fixed at 1.2 h−1 based on previous study.13 The model-estimated apparent clearance (CL/F, 28.9 L/h) and apparent volume of distribution (V/F, 310 L) fell within reasonable ranges. Although the estimated CL/F was slightly lower than values reported in healthy subjects (eg., 42 L/h)1, this finding is consistent with the characteristics of the Chinese population (associated with a higher concentration-to-dose ratio in Asians)10 and real-world clinical patients (including the elderly and those with varying physiological states).1 The final model identified BMI, paroxetine, and fluvoxamine as key factors of MTZ clearance. The specific clinical implications of these covariates are discussed below.
BMI
In this study, patients were divided into obese and non-obese groups using a BMI cutoff of 28 kg/m2.25 Previous study26 indicated that psychiatric patients exhibit various metabolic disturbances compared to the general population. Furthermore, two studies18,27 have suggested that poor antidepressant response may be associated with excessive BMI. In this context, BMI measurement serves as a rapid and convenient method to preliminarily assess a patient’s metabolic status.
Two clinical studies1,28 have demonstrated that MTZ is associated with significantly greater weight gain compared to SSRIs. Other studies indicate that short-term treatment with MTZ (4–12 weeks) leads to a mean weight gain of 1.74 kg,29 while long-term treatment (24 months) results in a mean weight gain reaching 7.35 kg.30 It can be seen that the factor of weight is a factor that cannot be ignored in patients taking MTZ, whether as a covariant or an adverse reaction.
Our study revealed that the clearance of MTZ in obese patients was 29.4% lower than in non-obese patients, resulting in a slower clearance rate and higher systemic exposure in the obese patients. Obesity involves more than just weight gain; it causes a series physiological changes, which will impact drug clearance. A study31 suggests three major factors influencing clearance in obesity: the hepatic extraction ratio (ER), relative enzyme activity, and plasma protein binding. MTZ exhibits non-specific and reversible plasma protein binding of about 85% and is mainly eliminated via hepatic metabolism.2 Consequently, among the above three factors, the hepatic extraction ratio and relative enzyme activity are the primary determinants governing the hepatic clearance of MTZ.
Typically, as BMI increases, liver volume and hepatic blood flow (Qh) increase.31 For high-ER drugs, increased blood flow usually translates directly to increased clearance. However, CYP3A4, which accounts for approximately 40% of total hepatic CYP enzymes,32 is a key metabolic pathway for MTZ. Many studies33–35 have shown that the activity of CYP3A4 is inversely correlated with body weight in obese patients, directly contributing to reduced clearance. The observed 29.4% reduction in clearance in this study indicates that, among the above two influencing factors, relative enzyme activity plays the dominant role in influencing MTZ clearance.
Regarding dosing regimens for conditions involving reduced enzyme activity (eg., CYP3A4 downregulation), previous study31 recommends “flat dosing” or even dose reductions lower than the standard fixed dose, rather than weight-based increased dose. Our simulation results show that obese patients require a lower initial dose of 22.5–30 mg/day (compared to 30–37.5 mg/day for the general population) to achieve target concentrations. This confirms that for drugs like MTZ, which are sensitive to CYP enzyme inhibition, weight-based dosing is unnecessary and dose reduction may be warranted. It proves that for MTZ, a drug affected by CYP enzyme inhibition, there is no need to reduce the dose according to body weight, and even need to reduce the dose appropriately, which is highly consistent with the prediction model of drugs with low ER and impaired enzyme activity in the previous studies.
Paroxetine
In the present study, the combination of paroxetine can lead to a decrease in the MTZ clearance by about 26%. This drug-drug interaction (DDI) is mainly attributable to the inhibition of MTZ metabolic pathways by paroxetine.
First, the in vivo metabolism of MTZ is closely related to the cytochrome P450 enzyme system. Existing studies indicate that the metabolic clearance of MTZ is significantly influenced by CYP2D6 genetic polymorphisms. Compared to normal metabolizers (NMs), poor metabolizers (PMs) and intermediate metabolizers (IMs) exhibit MTZ C/D ratios that are 18% and 14% higher, respectively.36 Furthermore, individuals carrying the CYP2D6*4 allele demonstrate elevated C/D levels.37 This pharmacogenetic evidence confirms that CYP2D6 serves as a key rate-limiting enzyme in the clearance of MTZ. Concurrently, a study10 reports a positive correlation between paroxetine co-administration and MTZ C/D ratios, which aligns with the reduction in clearance observed in the present study. As paroxetine is a clinically known powerful CYP2D6 inhibitor,38 its co-administration essentially simulates the physiological state of CYP2D6 poor metabolizers (phenocopying), thereby hindering the metabolic elimination of MTZ and leading to increased drug concentrations.
Despite the above pharmacokinetic interactions, this combination regimen remains of significant clinical value. As a NaSSA, MTZ promotes the release of norepinephrine (NE) and 5-HT from the presynaptic membrane by antagonizing α2-adrenergic autoreceptors and heteroreceptors; whereas paroxetine, as an SSRI, increases the concentration of 5-HT in the synaptic cleft by inhibiting reuptake. This “dual-trigger” mechanism activates the monoamine neurotransmitter system more comprehensively. A study39 indicates that for patients with treatment-resistant depression (TRD) who respond poorly to monotherapy, the combination regimen achieved a significantly higher remission rate at week 6 compared to monotherapy groups (43% vs. 19–26%), demonstrating its superior efficacy in overcoming treatment bottlenecks. Regarding adverse drug reactions, sexual dysfunction (such as decreased libido and erectile dysfunction) caused by paroxetine is a primary reason for treatment discontinuation; however, studies have shown that MTZ can effectively mitigate paroxetine-induced sexual dysfunction.11,40 Furthermore, depression is often accompanied by severe anxiety and circadian rhythm disturbances. By potently antagonizing H1 and 5-HT2 receptors, MTZ can significantly improve patients’ difficulty falling asleep and alleviate acute anxiety symptoms early in treatment. This rapid-onset advantage compensates for paroxetine’s slower onset of action (typically requiring 2–4 weeks), helping to improve early treatment adherence.41
Therefore, to preserve the clinical benefits of combination therapy while mitigating the risk of drug accumulation, it is necessary to optimize the dosing of MTZ. For patients co-medicated with paroxetine, the recommended dose should be lowered to 22.5–30 mg/d due to the inhibition of clearance. This dosing strategy aims to offset the increased exposure resulting from enzyme inhibition, ensuring that drug concentrations are maintained within the safe and effective therapeutic window.
Fluvoxamine
Regarding the subgroup co-medicated with fluvoxamine, despite the limited sample size (n = 6, 5.7%), the substantial reduction in clearance (−51.1%) captured by the model exhibits high biological plausibility.
Fluvoxamine is a clinically recognized powerful inhibitor of CYP1A2, while also exerting significant inhibitory effects on CYP2C19 and CYP3A4.42 Notably, CYP1A2 and CYP3A4 constitute the main metabolic pathways for MTZ. Theoretically, such a combined inhibitory mechanism inevitably leads to significant accumulation of MTZ. The magnitude of concentration increase predicted in this study (about 2-fold) is consistent with the direction of previous case reports11 (3–4-fold) but is more conservative, thereby confirming the reliability of this DDI signal. Given the substantial risk that “standard dosing equates to overdosing” in this context, it is recommended to reduce the maintenance dose to 15 mg/d for such patients. Furthermore, to mitigate the risks of serotonin syndrome12 or excessive sedation,43 close monitoring of therapeutic drug levels via TDM is strongly advised during clinical administration.
BMI and Concomitant Medications
When obese patients are co-administered CYP inhibitors (paroxetine or fluvoxamine), these covariates have a significant cumulative or synergistic inhibitory effect on MTZ clearance, potentially transforming standard “therapeutic doses” into “toxic doses.”
For the “Obesity + Paroxetine” subgroup, 15 mg/d represents the optimal initial dose (target attainment rate: 76.5%), whereas 30 mg/d exposes the majority of patients to supratherapeutic concentrations. Blindly increasing the dose according to weight may cause side.
In the “Obesity + Fluvoxamine” subgroup, despite the limited sample size (5.7%), the CYP3A4 inhibition induced by obesity (−29.4%) is compounded by the powerful enzymatic inhibition of fluvoxamine (−51.1%), resulting in a profound cumulative effect. Simulation results highlight a strong safety signal: 30 mg/d carries an extremely high risk, whereas a low-dose regimen of 7.5–15 mg/d (with 7.5 mg/d offering superior safety and 15 mg/d maximizing target attainment) is more appropriate.
Limitations
Limited Sample Size in Specific
Subgroups in this study, only 6 patients (5.7% of the total sample) received concomitant fluvoxamine. Although the model estimated a 51.1% increase in plasma concentrations due to this combination, the limited sample size requires a cautious interpretation of this value. Similarly, fluoxetine, a potent CYP2D6 inhibitor, should theoretically increase serum concentrations of MTZ; however, it did not reach statistical significance during covariate screening. This may be attributed to the small sample size (n = 5) and the long half-life of its active metabolite (ranging from several days to two weeks). Consequently, this may suggest that fluoxetine’s inhibition of CYP2D6 is gradual and requires a prolonged period (typically more than 4 weeks) to reach a steady state of enzyme inhibition. Future studies with larger subgroup cohorts are necessary to further investigate the impact of these drug-drug interactions.
Constraints in Controlling Confounding Factors
This study did not include patients with a history of smoking; therefore, this inducer of CYP1A2 was not examined.
Lack of Pharmacogenetic Data
This study did not include genotype data. Consequently, we were unable to assess the influence of genetic polymorphisms (eg., CYP2D6, CYP1A2) on the individualized pharmacokinetic parameters of MTZ.
Ethnic Limitations and Lack of Validation
The study population was limited to Chinese patients, and external validation was not performed for the specific subgroups. Consequently, the subgroup dose recommendations derived from model simulations should be regarded as “exploratory guidance” and interpreted with caution in clinical practice. Before these recommendations can be incorporated into clinical guidelines, they must undergo prospective validation in larger and more diverse multi-ethnic cohorts.
Conclusion
By developing a population pharmacokinetic model, this study clarifies the pharmacokinetic characteristics of mirtazapine in the Chinese population and the main influencing factors of its clearance: BMI, paroxetine, and fluvoxamine. In particular, under complex clinical scenarios involving obesity and co-medication, standard dosing regimens may pose potential safety risks. The dose optimization strategies proposed herein assist clinicians in minimizing the risk of adverse reactions while ensuring therapeutic efficacy.
Data Sharing Statement
The data that support the findings of this study are available from the corresponding author upon reasonable request.
Ethical Approval
This study was approved by the Ethics Committee of the Affiliated Brain Hospital of Guangzhou Medical University (approval number: 2021027). This study was a retrospective study, and the informed consent was waived by the IRB. We confirm that this study was conducted in accordance with the Declaration of Helsinki. All participants’ related data were deidentified to ensure privacy and confidentiality.
Acknowledgment
We thank all subjects who participated in this study.
Author Contributions
All authors made a significant contribution to the work reported, whether that is in the conception, study design, execution, acquisition of data, analysis and interpretation, or in all these areas; took part in drafting, revising or critically reviewing the article; gave final approval of the version to be published; have agreed on the journal to which the article has been submitted; and agree to be accountable for all aspects of the work.
Funding
This work was supported by the clinical characteristic technology project of Guangzhou Region (2023C-TS22), Guangzhou Key Clinical Specialty (Clinical Medical Research Institute), and Guangzhou Municipal Key Discipline in Medicine Grant Number: (2025–2027).
Disclosure
The authors report no conflicts of interest in this work.
References
1. Croom KF, Perry CM, Plosker GL. Mirtazapine: a review of its use in major depression and other psychiatric disorders. CNS Drugs. 2009;23:427–17. doi:10.2165/00023210-200923050-00006
2. Mehra A, Sachdeva V, Khanna J, et al. Mirtazapine revisited: new therapeutic perspectives and formulation advances. Naunyn Schmiedebergs Arch Pharmacol. 2025;399(2):1689–1710. doi:10.1007/s00210-025-04525-w
3. Kamp CB, Petersen JJ, Faltermeier P. The risks of adverse events with mirtazapine for adults with major depressive disorder: a systematic review with meta-analysis and trial sequential analysis. BMC Psychiatry. 2025;25(1):67. doi:10.1186/s12888-024-06396-6
4. Bakker MH, Hugtenburg JG, Bet PM, Twisk JW, van der Horst HE, Slottje P. Effectiveness of low-dose amitriptyline and mirtazapine in patients with insomnia disorder and sleep maintenance problems: a randomised, double-blind, placebo-controlled trial in general practice (DREAMING). Br J Gen Pract. 2025;75(756):e474–e483. doi:10.3399/BJGP.2024.0173
5. Nguyen PV-Q, Dang-Vu TT, Forest G. Mirtazapine for chronic insomnia in older adults: a randomised double-blind placebo-controlled trial-the MIRAGE study. Age Ageing. 2025;54(3):afaf050. doi:10.1093/ageing/afaf050
6. Monteleone P, Martiadis V, Maj M. Circadian rhythms and treatment implications in depression. Prog Neuropsychopharmacol Biol Psych. 2011;35:1569–1574. doi:10.1016/j.pnpbp.2010.07.028
7. Fiorillo A, Demyttenaere K, Martiadis V, et al. Editorial: treatment resistant depression (TRD): epidemiology, clinic, burden and treatment. Front Psychiatry. 2025;16:1588902. doi:10.3389/fpsyt.2025.1588902
8. Scherf-Clavel M, Weber H, Weiss C, et al. CYP1A2 genotype-dependent effects of smoking on mirtazapine serum concentrations. J Psychopharmacol. 2025;39:847–854. doi:10.1177/02698811251337387
9. Nierychlewski K, Paal M, Meinzer S, et al. Optimizing therapeutic drug monitoring of mirtazapine - applying therapeutic reference range, concentration-dose ratio/dose-related concentration, and metabolic ratio in a naturalistic setting. Eur J Clin Pharmacol. 2025;81:1677–1687. doi:10.1007/s00228-025-03907-6
10. Myung W, Jang J-H, Yoon H, Lee S-Y, Kim D. Therapeutic drug monitoring of mirtazapine in a routine outpatient setting in Asian psychiatric patients. Pharmacopsychiatry. 2014;47(06):210–214. doi:10.1055/s-0034-1383655
11. Anttila SA, Rasanen I, Leinonen EV. Fluvoxamine augmentation increases serum mirtazapine concentrations three- to fourfold. Ann Pharmacother. 2001;35(10):1221–1223. doi:10.1345/aph.1A014
12. Demers JC, Malone M. Serotonin syndrome induced by fluvoxamine and mirtazapine. Ann Pharmacother. 2001;35(10):1217–1220. doi:10.1345/aph.10418
13. Grasmäder K, Verwohlt Pl Fau Kühn KU, Kühn Ku Fau Dragicevic A, et al. Population pharmacokinetic analysis of mirtazapine. Eur J Clin Pharmacol. 2004;60(7):473–480. doi:10.1007/s00228-004-0737-0
14. De Donatis D, Verrastro M, Fanelli G, et al. Mirtazapine blood levels and antidepressant response. Int J Psychiatry Clin Pract. 2024;28:102–106. doi:10.1080/13651501.2024.2409654
15. Hiemke C, Bergemann N, Clement H. Consensus guidelines for therapeutic drug monitoring in neuropsychopharmacology: update 2017. Pharmacopsychiatry. 2018;51(1–02):e1. doi:10.1055/s-0037-1600991
16. Elmaleh-Sachs A, Schwartz JL, Bramante CT, Nicklas JM, Gudzune KA, Jay M. Obesity Management in Adults: a Review. JAMA. 2023;330(20):2000–2015. doi:10.1001/jama.2023.19897
17. Alam MT, Sarkar AA, Khan MZR, et al. Therapeutic Effects and Safety of Mirtazapine for Insomnia in Major Depressive Disorder: Findings from a 6-Week Open-Label Pre- and Post-Intervention Study. Neuropsychobiology. 2026;85(1):1–11. doi:10.1159/000547983
18. Xiao L, Zhou J, Galling B, et al. The association of body mass index (BMI) with treatment outcomes in patients with major depressive disorder. J Affect Disord. 2021;281:799–804. doi:10.1016/j.jad.2020.11.059
19. Shinozaki M, Pierce J, Hayashi Y, et al. 8-Hydroxylation and glucuronidation of mirtazapine in japanese psychiatric patients: significance of the glucuronidation pathway of 8-hydroxy-mirtazapine. Pharmacopsychiatry. 2019;52(05):237–244. doi:10.1055/a-0918-6408
20. Reis M, Aamo T, Spigset O, et al. Serum concentrations of antidepressant drugs in a naturalistic setting: compilation based on a large therapeutic drug monitoring database. Therapeutic Drug Monitor. 2009;31(1):42–56. doi:10.1097/FTD.0b013e31819114ea
21. Warrings B, Samanski L, Deckert J, et al. Impact of body mass index on serum concentrations of antidepressants and antipsychotics. Therapeutic Drug Monitor. 2021;43(2):286–291. doi:10.1097/FTD.0000000000000812
22. Grasmäder K, Verwohlt Pl Fau Kühn KU, Kühn Ku Fau Frahnert C, et al. Relationship between mirtazapine dose, plasma concentration, response, and side effects in clinical practice. Pharmacopsychiatry. 2005;38(3):113–117. doi:10.1055/s-2005-864120
23. Schüle C, Baghai TC, Eser D, Nothdurfter C, Rupprecht R. Lithium but not carbamazepine augments antidepressant efficacy of mirtazapine in unipolar depression: an open-label study. World J Biol Psychiatry. 2009;10(4 Pt 2):390–399. doi:10.1080/15622970701849978
24. Shams M, Hiemke C, Hartter S. Therapeutic drug monitoring of the antidepressant mirtazapine and its N-demethylated metabolite in human serum. Therapeutic Drug Monitor. 2004;26:78–84. doi:10.1097/00007691-200402000-00015
25. Zhou B-F, Cooperative Meta-Analysis Group of the Working Group on Obesity In C. Predictive values of body mass index and waist circumference for risk factors of certain related diseases in Chinese adults--study on optimal cut-off points of body mass index and waist circumference in Chinese adults. Biomed Environ Sci. 2002;15:83–96.
26. Barton BB, Zagler A, Engl K, Rihs L, Musil R. Prevalence of obesity, metabolic syndrome, diabetes and risk of cardiovascular disease in a psychiatric inpatient sample: results of the Metabolism in Psychiatry (MiP) Study. Eur Arch Psychiatry Clin Neurosci. 2020;270(5):597–609. doi:10.1007/s00406-019-01043-8
27. Dreimüller N, Lieb K, Tadić A, et al. Body mass index (BMI) in major depressive disorder and its effects on depressive symptomatology and antidepressant response. J Affect Disord. 2019;256:524–531. doi:10.1016/j.jad.2019.06.067
28. Watanabe N, Omori IM, Nakagawa A. Safety reporting and adverse-event profile of mirtazapine described in randomized controlled trials in comparison with other classes of antidepressants in the acute-phase treatment of adults with depression: systematic review and meta-analysis. CNS Drugs. 2010;24(1):35–53. doi:10.2165/11319480-000000000-00000
29. Serretti A, Mandelli L. Antidepressants and body weight: a comprehensive review and meta-analysis. J Clin Psychiatry. 2010;71:1259–1272. doi:10.4088/JCP.09r05346blu
30. Arterburn D, Sofer T, Boudreau D. Long-Term weight change after initiating second-generation antidepressants. J Clin Med. 2016;5(4):48. doi:10.3390/jcm5040048
31. Zhang T, Calvier EAM, Krekels EHJ, Knibbe CAJ. Impact of obesity on hepatic drug clearance: what are the influential variables? AAPS J. 2024;26(3):59. doi:10.1208/s12248-024-00929-3
32. Gouju J, Legeay S. Pharmacokinetics of obese adults: not only an increase in weight. Biomed Pharmacother. 2023;166:115281. doi:10.1016/j.biopha.2023.115281
33. Krogstad V, Peric A, Robertsen I, et al. Correlation of body weight and composition with hepatic activities of cytochrome P450 enzymes. J Pharm Sci. 2021;110:432–437. doi:10.1016/j.xphs.2020.10.027
34. Ulvestad M, Skottheim IB, Jakobsen GS. Impact of OATP1B1, MDR1, and CYP3A4 expression in liver and intestine on interpatient pharmacokinetic variability of atorvastatin in obese subjects. Clin Pharmacol Ther. 2013;93(3):275–282. doi:10.1038/clpt.2012.261
35. Cheng P-Y, Morgan E. Hepatic cytochrome P450 regulation in disease states. Curr Drug Metab. 2001;2(2):165–183. doi:10.2174/1389200013338676
36. Hole K, Molden E. Association between CYP2D6 genotypes and serum concentrations of mirtazapine and mianserin. Basic Clin Pharmacol Toxicol. 2025;136(4):e70013. doi:10.1111/bcpt.70013
37. Ozdemir F, Dural E, Baskak NS, et al. The association of CYP2D6*4 and POR*28 polymorphisms on mirtazapine plasma level in subjects with major depressive disorder and anxiety disorders. Comb Chem High Throughput Screen. 2020;23(10):1032–1040. doi:10.2174/1386207323666200402081512
38. Juřica J, Žourková A. Dynamics and persistence of CYP2D6 inhibition by paroxetine. J Clin Pharm Ther. 2013;38(4):294–300. doi:10.1111/jcpt.12042
39. Blier P, Gobbi G, Turcotte JE. Mirtazapine and paroxetine in major depression: a comparison of monotherapy versus their combination from treatment initiation. Eur Neuropsychopharmacol. 2009;19(7):457–465. doi:10.1016/j.euroneuro.2009.01.015
40. AlBreiki M, AlMaqbali M, AlRisi K, AlSinawi H, Al Balushi M, Al Zakwani W. Prevalence of antidepressant-induced sexual dysfunction among psychiatric outpatients attending a tertiary care hospital. Neurosciences (Riyadh). 2020;25(1):55–60. doi:10.17712/nsj.2020.1.20190058
41. Kim JE, Yoon SJ, Kim J. Efficacy and tolerability of mirtazapine in treating major depressive disorder with anxiety symptoms: an 8-week open-label randomised paroxetine-controlled trial. Int J Clin Pract. 2011;65(3):323–329. doi:10.1111/j.1742-1241.2010.02624.x
42. Dieckmann LHJ, Haddad M, Wendt Viola T, Franco Scarante F, Rodrigues da Silva N, Mari JDJ. An overview of the systematic reviews about the efficacy of fluvoxamine on depression. Pharmaceuticals. 2025;18(5):711. doi:10.3390/ph18050711
43. Alberti S, Chiesa A, Andrisano C, et al. Insomnia and somnolence associated with second-generation antidepressants during the treatment of major depression: a meta-analysis. J Clin Psychopharmacol. 2015;35:296–303. doi:10.1097/JCP.0000000000000329
 © 2026 The Author(s). This work is published and licensed by Dove Medical Press Limited. The
full terms of this license are available at https://www.dovepress.com/terms
and incorporate the Creative Commons Attribution
- Non Commercial (unported, 4.0) License.
By accessing the work you hereby accept the Terms. Non-commercial uses of the work are permitted
without any further permission from Dove Medical Press Limited, provided the work is properly
attributed. For permission for commercial use of this work, please see paragraphs 4.2 and 5 of our Terms.
© 2026 The Author(s). This work is published and licensed by Dove Medical Press Limited. The
full terms of this license are available at https://www.dovepress.com/terms
and incorporate the Creative Commons Attribution
- Non Commercial (unported, 4.0) License.
By accessing the work you hereby accept the Terms. Non-commercial uses of the work are permitted
without any further permission from Dove Medical Press Limited, provided the work is properly
attributed. For permission for commercial use of this work, please see paragraphs 4.2 and 5 of our Terms.
Recommended articles
Awareness and Predictors of the Use of Bioinformatics in Genome Research in Saudi Arabia
Alomair L, Abolfotouh MA
International Journal of General Medicine 2023, 16:3413-3425
Published Date: 11 August 2023
A Real-Time Plasma Concentration Prediction Model for Voriconazole in Elderly Patients via Machine Learning Combined with Population Pharmacokinetics
Liu R, Ma P, Chen D, Yu M, Xie L, Zhao L, Huang Y, Shang S, Chen Y
Drug Design, Development and Therapy 2025, 19:4021-4037
Published Date: 17 May 2025
Psychological Distress and Disordered Eating in Adults Attending an Obesity Outpatient Clinic
Cyranka K, Zych Z, Cyganek K, Małecki MT, Styczeń K, Pietruś M, Dudek D, Klupa T, Matejko B
Diabetes, Metabolic Syndrome and Obesity 2026, 19:594879
Published Date: 8 June 2026