Back to Journals » Journal of Hepatocellular Carcinoma » Volume 13
Novel Unsupervised Machine Learning Model Using Multi-Parametric Radiomics for Prognostic Stratification of Bifocal Hepatocellular Carcinoma
Authors Jia X, Wu F ![]() , Dai H, Xiao Y, Yang C, Zeng M
, Dai H, Xiao Y, Yang C, Zeng M
Received 19 March 2026
Accepted for publication 8 May 2026
Published 19 May 2026 Volume 2026:13 606780
DOI https://doi.org/10.2147/JHC.S606780
Checked for plagiarism Yes
Review by Single anonymous peer review
Peer reviewer comments 2
Editor who approved publication: Dr Mohamed Shaker
Xi Jia,1,2,* Fei Wu,1,2,* Haoran Dai,1,2,* Yuyao Xiao,1,2 Chun Yang,1,2 Mengsu Zeng1,2
1Department of Radiology, Zhongshan Hospital, Fudan University, Shanghai, People’s Republic of China; 2Shanghai Institute of Medical Imaging, Shanghai, People’s Republic of China
*These authors contributed equally to this work
Correspondence: Mengsu Zeng, Department of Radiology, Zhongshan Hospital, Fudan University, No. 180 Fenglin Road, Xuhui District, Shanghai, 200032, People’s Republic of China, Email [email protected] Chun Yang, Department of Radiology, Zhongshan Hospital, Fudan University, No. 180 Fenglin Road, Xuhui District, Shanghai, 200032, People’s Republic of China, Email [email protected]
Purpose: To identify radiomics subtypes that reflect tumor heterogeneity in bifocal hepatocellular carcinoma (bHCC) using an unsupervised machine learning approach. Additionally, to develop a preoperative model and a postoperative fusion model aimed at predicting recurrence-free survival (RFS) and overall survival (OS) in bHCC patients following hepatectomy.
Methods: This retrospective study included 182 bHCC patients (91 in the training set, 91 in the test set). To capture the overall tumor characteristics, radiomics features were extracted from both lesions across six MR sequences and integrated using a two-lesion fusion approach to represent each patient as a single analytical entity. The similarity network fusion approach was utilized to construct a patient similarity matrix based on multi-sequence radiomic features, aiming to identify distinct subgroups that capture patterns of tumor imaging heterogeneity through spectral clustering. Multivariable Cox regression analysis was conducted to develop prognostic models for RFS and OS. The preoperative radiomics image heterogeneity (RIH) model and postoperative model including pathological features were built to predict prognosis of bHCC patients after hepatectomy.
Results: Unsupervised clustering analysis based on multi-parametric radiomics revealed two subtypes correlated with distinct clinical outcomes, where high-radiomics image heterogeneity (high-RIH) was associated with poorer RFS (Log-rank p = 0.0059) and OS (Log-rank p = 0.0343). The independent predictors of shorter RFS included RIH cluster (HR, 1.782; 95% CI, 1.189– 2.670), pathological satellite nodule (HR, 1.946; 95% CI, 1.094– 3.460), MVI (HR, 1.714; 95% CI, 1.231– 2.386). The independent predictors of shorter OS included RIH cluster (HR, 2.008; 95% CI, 1.119– 3.605), radiological satellite nodule (HR, 1.982; 95% CI, 1.008– 3.901), MVI (HR, 4.350; 95% CI, 2.358– 8.028).
Conclusion: This study identified two different radiomics subtypes in bHCC which could reveal the heterogeneity of bHCC and predict clinical outcomes in post-hepatectomy bHCC patients. The diagram illustrates a radiomics workflow. It begins with imaging acquisition, showing a group of people and an MRI scan. This leads to tumor segmentation, depicted with a segmented tumor on an MRI image. Next is radiomics features extraction, including shape, histogram and texture features. This information is used in similarity network fusion, represented by a network diagram and a heatmap. The process results in risk stratification into high and low risk, labeled as High-RIH and Low-RIH. Each risk group is associated with icons of people, a checklist, a microscope and test tubes. Two survival probability graphs are shown: one for high risk (Cluster 1) and one for low risk (Cluster 2), both plotting survival probability against follow-up time in months, with a log-rank p-value of 0.001 for high risk.Radiomics: imaging, feature extraction, fusion, risk stratification, survival graphs.
Keywords: hepatocellular carcinoma, magnetic resonance imaging, unsupervised machine learning, prognosis
Introduction
Hepatocellular carcinoma (HCC) has a 5-year relative survival rate of approximately 18%, making it the third leading cause of cancer-related deaths globally. The grim prognosis is underscored by the nearly identical incidence and mortality rates.1 Multifocal HCC (mHCC), particularly characterized by its biological heterogeneity, exhibits worse long-term outcomes compared to single-nodular HCC.2 Notably, bifocal HCC (bHCC), accounting for more than 80% of mHCC cases, is often treated aggressively with radical resection in many Asian countries.3–5 Despite curative-intent treatments, the postoperative recurrence rate among bHCC patients remains alarmingly high, which is largely attributed to pronounced tumor heterogeneity.6 Given this challenge, effective risk assessment and long-term prognostic stratification are crucial for guiding clinical decision-making and optimizing management of bHCC patients. While previous studies primarily focused on risk stratification for solitary HCC,7–10 these approaches are inherently limited in bHCC as they fail to account for the comprehensive tumor burden derived from both lesions. Therefore, a comprehensive evaluation should encompass both tumor lesions in bHCC to capture the full extent of tumor characteristics.
Radiomics has demonstrated its capacity to characterize the complex imaging phenotypes of tumors and has shown significant potential in assessing both the tumor heterogeneity and prognosis of HCC.11 Prior studies have predominantly utilized supervised machine learning techniques, including random forests, support vector machines, convolutional neural networks, transfer learning, and other deep learning algorithms.7 Recently, the integration of unsupervised machine learning algorithms with radiomics has opened new avenues for uncovering intricate patterns in medical imaging datasets.12,13 Unlike traditional supervised radiomics analyses, unsupervised machine learning algorithms eliminate the need for manual labeling of clinical outcomes; this approach groups patients based on intrinsic phenotypic similarities rather than predefined outcomes.14
Similarity network fusion (SNF), an unsupervised machine learning algorithm, constructs networks of patients based on each available data type and then effectively merges these into a single network, representing the full spectrum of underlying data.15 This approach substantially outperforms single-data-type analyses and established integrative methods in identifying cancer heterogeneity, and it has proven effective in predicting survival outcomes.16–20 The originality of this study lies in the application of SNF to address the unique challenges of bHCC. Unlike traditional integrative methods that often suffer from noise and loss of information during simple feature concatenation, SNF constructs patient similarity networks for two nodules and MRI multi-sequences, subsequently fusing them into a unified network. This approach is particularly suitable for bHCC as it effectively captures the synergistic radiomics signals from both lesions without discarding the imaging features of either nodule. By computing and fusing these patient similarity networks derived from multi-parametric MRI radiomics separately, SNF leverages the complementary nature of the data to better explore the heterogeneity in bHCC.
Therefore, the purpose of this study was to develop an SNF-based radiomics framework that jointly integrates two-lesion and multi-parametric MRI features to identify Radiomics Image Heterogeneity (RIH) clusters in bHCC. Based on subtype classification, we stratified bHCC patients into different prognostic risk subgroups preoperatively, and developed a clinical-radiological-radiomics model using multivariate Cox regression analysis to predict recurrence-free survival (RFS) and overall survival (OS).
Materials and Methods
The Institutional Review Board of Zhongshan Hospital approved this retrospective study (B2021-682R), which was conducted in accordance with the Declaration of Helsinki. The requirement to obtain written informed consent was waived due to the retrospective design of this study. We stated that patient data was strictly confidential. This study was conducted in accordance with the CLEAR, CLEAR-E3, and METRICS guidelines to ensure transparency, reproducibility, and methodological rigor in radiomics research.21–23
Study Patients
From January 2015 to January 2019, patients with bHCC reported by MRI were retrospectively and continuously registered by retrieving our institutional picture archive and communication system (PACS). Inclusion criteria were as follows: Patients who received curative hepatic resection as the first-line treatment (R0 resection) and patients without major vascular invasion on preoperative MRI (n = 489). Exclusion criteria were as follows: (a) previous history of treatments before MRI including (chemotherapy, radiotherapy, trans-arterial chemoembolization, radiofrequency ablation, hepatectomy, liver transplantation and systemic therapy) (n = 148); (b) presence of extrahepatic metastasis (n = 51); (c) any lesion pathologically diagnosed as non-HCC after surgery, including combined hepatocellular carcinoma-cholangiocarcinoma (n = 16), intrahepatic cholangiocarcinoma (n = 4); (d) incomplete follow-up data (n = 63); (e) poor image quality due to breathing motion artifacts (n = 8), which assess by radiologist 1 (six years in liver imaging); (f) long time interval (longer than 1 month) between MRI examination and surgical resection (n = 17). Finally, 182 patients were included in our study and were randomly divided into training set and validation set in a ratio of 1:1 (Figure 1).
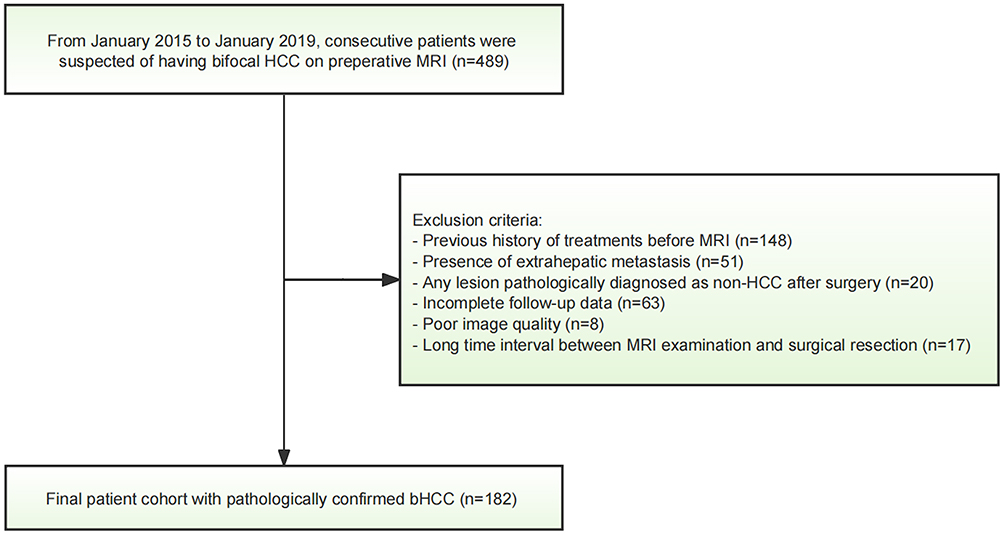 |
Figure 1 Patient enrollment flowchart. Abbreviations: HCC, hepatocellular carcinoma; bHCC, bifocal HCC. |
Laboratory and Pathological Data
All variables were retrospectively collected through the electronic medical record system in our institute. Clinical information, including sex and age, was obtained during admission through medical history taking. Laboratory data were obtained from blood tests conducted within one week prior to surgery, including status of HBV or HCV infection, preoperative HBV deoxyribonucleic acid (HBV-DNA) load, levels of alpha fetoprotein (AFP), total bilirubin (TBIL), direct bilirubin (DBIL), total protein (TP), albumin (ALB), alanine aminotransferase (ALT), aspartate aminotransaminase (AST), alkaline phosphatase (ALP), g-glutamyl transferase (GGT), total bile acid (TBA), prothrombin time (PT), and platelet count (PLT). Following the surgical procedure, pathological evaluation of the resected specimens was performed by two experienced pathologists within 1–2 weeks. Histopathologic features such as microvascular invasion (MVI), cirrhosis of the noncancerous liver parenchyma, satellite nodule, and Edmondson-Steiner (E-S) grade were evaluated based on these findings.
Clinical Outcome
Follow-up clinical data were obtained by a review of medical records or telephone interviews. RFS was defined as the time from the date of surgery to the date of first recurrence, metastasis, or last follow-up. OS was defined as the time from the date of surgery to the date of death or last follow-up. The data were censored on December 31, 2021.
Power Analysis
Prior to the study, a power analysis was conducted to determine the minimum sample size required to detect significant differences in diagnostic performance, as measured by the area under the receiver operating characteristic (AUC-ROC) curve, with a significance level of 0.05 and a statistical power ranging from 0.80 to 0.95. The results indicated that to detect AUC values of 0.66, 0.70, 0.75, and 0.80, at least 86, 62, 42, and 30 patients, respectively, would be required. Given that 182 patients were included in the study and the observed AUC values ranged from 0.66 to 0.83, the sample size was deemed sufficient to ensure a high level of statistical confidence and validity. To further ensure the robustness of our prognostic modeling, we assessed the adequacy of the training dataset (n = 91) using the Events Per Variable (EPV) criterion. Given the high maturity of our cohort, with a maximum follow-up of 80 months and minimal censoring, the event density (127 for RFS and 52 for OS) provided ample statistical power. In the training cohort, the EPV ratios were maintained at a level that supports stable parameter estimation for both the RFS and OS multivariable Cox models, effectively minimizing the risk of overfitting.
MRI Protocol
All patients were scanned in a 1.5-T MR scanner (MAGNETOM Aera, Siemens Healthcare). Routine liver protocols consisted of transverse T2-weighted imaging (T2WI), T1-weighted imaging (PRE) and diffusion-weighted imaging (DWI). Dynamic imaging was performed with a T1-weighted fat-suppressed sequence. The arterial phase (AP) was acquired when the contrast agent (gadolinium diethylenetriamine pentaacetic acid, Gd-DTPA; Magnevist, Bayer HealthCare) reached the ascending aorta after intravenous administration at a dose of 0.1 mmol/kg at a rate of 2 mL/s. The portal venous phase (VP) and delayed phase sequences (DP) were acquired at 70–90 s and 160–180 s, respectively. Detailed information is available in Table S1. The use of a single scanner was intentional to minimize inter-scanner variability and technical noise, which are known to significantly affect the stability and reproducibility of radiomics features during the model development phase.
MRI Features Evaluation
Three radiologists with 3, 8, and 19 years of experience in abdominal imaging, respectively, blinded to clinical and pathological information independently evaluated the following qualitative imaging features: 1) Larger Diameter > 5 cm; 2) satellite nodule; 3) hemorrhage in mass; 4) fat in mass; 5) arterial rim enhancement; 6) radiological capsule; 7) arterial peritumoral enhancement; 8) mosaic architecture; 9) nodule-in-nodule architecture; 10) unsmooth margin; 11) atypical enhancement pattern (Supplementary material 1). If any HCC lesion showed the qualitative MRI feature described above, the feature was considered present in the patient. The radiological liver cirrhosis was also assessed. After independent interpretation of images, discrepancies between readers were resolved by a consensus discussion. The radiological total tumor diameter (TTD) and ratio of the largest to the smallest tumor diameter (RLSD = diameter of the largest tumor/diameter of the smallest tumor) were also calculated.
Tumor Segmentation and Radiomics Feature Extraction
A radiologist (X.J., with 3 years of abdominal imaging analysis experience) performed tumor segmentation by ITK-SNAP software, these segmentation results were checked by a senior radiologist (C.Y., with 19 years of abdominal imaging analysis experience). Volumes of interest (VOIs) were manually delineated on 6 sequences of pre-T1WI, AP, PVP, DP, T2WI-FS and DWI with b values of 500 s/mm2. In addition, MR images of randomly selected 30 lesions were delineated again after 1 month by X.J. to assess the intra-observer reproducibility, and these 30 MRI images were also delineated by another radiologist (F.W., with 8 years of abdominal imaging analysis experience) independently to evaluate inter-observer reproducibility.
According to the radiomics checklist,21–23 image preprocessing involved the following steps: 1) Intensity non-uniformity was corrected using N4 bias field correction (the Python-based package “Advanced Normalization Tools”);
(2) Multi-sequence registration was performed using Symmetric Normalization (SyN) in antspyx, with pre-contrast T1WI as the fixed reference;
(3) An adaptive normalizer excluded voxels below the 1% and above the 99% intensity percentiles;
(4) Intensity values were rescaled to a [0, 1] range via min-max normalization (SimpleITK, Python version 3.10).
Radiomic features, including first-order features and textural features using the PyRadiomics package, extracted from multiple imaging sequences: pre-contrast T1WI, AP, PVP, DP, T2WI-FS, and DWI (b = 500 s/mm2). First-order features described the distribution of voxel intensities, and textural features were obtained based on five textural matrices to describe the radiological pattern of the ROI, including the gray level cooccurrence matrix (GLCM), gray level dependence matrix (GLDM), gray level run length matrix (GLRLM), gray level size zone matrix (GLSZM), and neighboring gray tone difference matrix (NGTDM). Detailed parameter settings for feature extraction, along with their justifications and supporting references, are provided in Supplementary Material 2 to ensure experimental reproducibility. To account for the collective tumor burden in patients with bHCC, two lesions were treated as a single entity rather than selecting only the largest one. For each patient, radiomics features were extracted independently from both lesions, and a patient-level feature representation was calculated using the arithmetic mean:
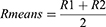
where R1 and R2 represent the radiomics features of the first and second lesion, respectively. This averaging-based integration was implemented to capture the comprehensive radiomics phenotype and reflect the total tumor burden of patients with bHCC.
Intra- and inter-class correlation coefficients (ICCs) of radiomics features were calculated for repeatability analysis, with only features having ICC values >0.75 retained for further analysis. A total of 2447 features were, respectively, obtained in each sequence. To further refine the feature set, we excluded features with zero variance across patients and those with a median absolute deviation (MAD) ≤ 1,20,24 as only features with a MAD > 1 were considered highly variable; the resulting number of highly variable, heterogeneity-related features identified across the six MR sequences is summarized in Table S2.
SNF and Spectral Clustering
Inter-patient similarity matrices were constructed using multi-sequences radiomics features from pre-T1WI, AP, PVP, DP, T2WI-FS and DWI sequences, with Pearson’s correlation employed as the core metric. The similarity matrices, representing patient similarity based on multi-sequence radiomics data, were then fused using the SNF algorithm (R package “SNFtool”15) separately for the training and testing sets.
Spectral clustering was subsequently performed on the fused similarity network to categorize patients into distinct RIH clusters. Following established methodological frameworks, the optimal number of clusters was determined using the “Spectrum” function within the “R package Spectrum”, which evaluates the algorithm’s internal consistency and the intrinsic structural properties of the patient similarity network. With predefined parameters (t = 10, sigma = 0.4),25 the algorithm identified two clusters as the most robust and stable latent structure for partitioning the cohort, representing the most significant divergence in imaging phenotypes. The association between RIH subtypes and prognosis was assessed using Kaplan–Meier survival curves and Log rank tests.
Statistical Analysis
Statistical analysis was performed using Python (v3.10) with packages “statsmodels” and “scikit-survival”. Continuous variables were presented as mean ± standard deviation or median with interquartile range, depending on statistics distribution determined by Shapiro–Wilk test. Categorical variables were presented as counts with percentages. Statistical significance of intra-group differences was calculated by Chi-squared test, Student’s t test or Mann Whitney U-test. For high-dimensional radiomics data, we integrated the stable and highly variable features (identified via ICC and MAD as described above) into a representative RIH cluster using the SNF algorithm. This dimensionality reduction strategy ensured that the subsequent multivariable analysis remained statistically parsimonious.
Cox proportional hazard regression was applied to assess each variable’s association with OS or RFS. Variables with significant statistical significance in the univariate Cox regression were passed on to multivariate Cox regression, and features shown significance in the multivariate analysis were used to construct prediction model. The selection of variables for the final models was strictly controlled to maintain a balanced EPV ratio, ensuring that the prognostic findings are statistically sound. K-M curve analysis was used to evaluate OS and RFS with Log rank testing for group differences. Concordance index (C-Index), ROC curve analysis, calibration curve were used as evaluation metrics for model performance. 95% confidence interval (CI) was calculated using a bootstrapped method with 1000 random resamples. Models were constructed on the training dataset, then evaluated on the testing set. The p value of 0.05 was considered statistically significant.
Results
Study Population
Figure 1 illustrated the initial enrollment of 489 patients in this retrospective study. Following the application of specific exclusion criteria, 182 patients with bHCC who underwent preoperative multi-parametric MRI were ultimately enrolled. These patients were randomly divided into training and test sets in a 1:1 ratio. Table 1 presented the baseline characteristics of the enrolled patients. For both the training and test cohorts, no significant differences were observed between patients regarding clinical and imaging characteristics.
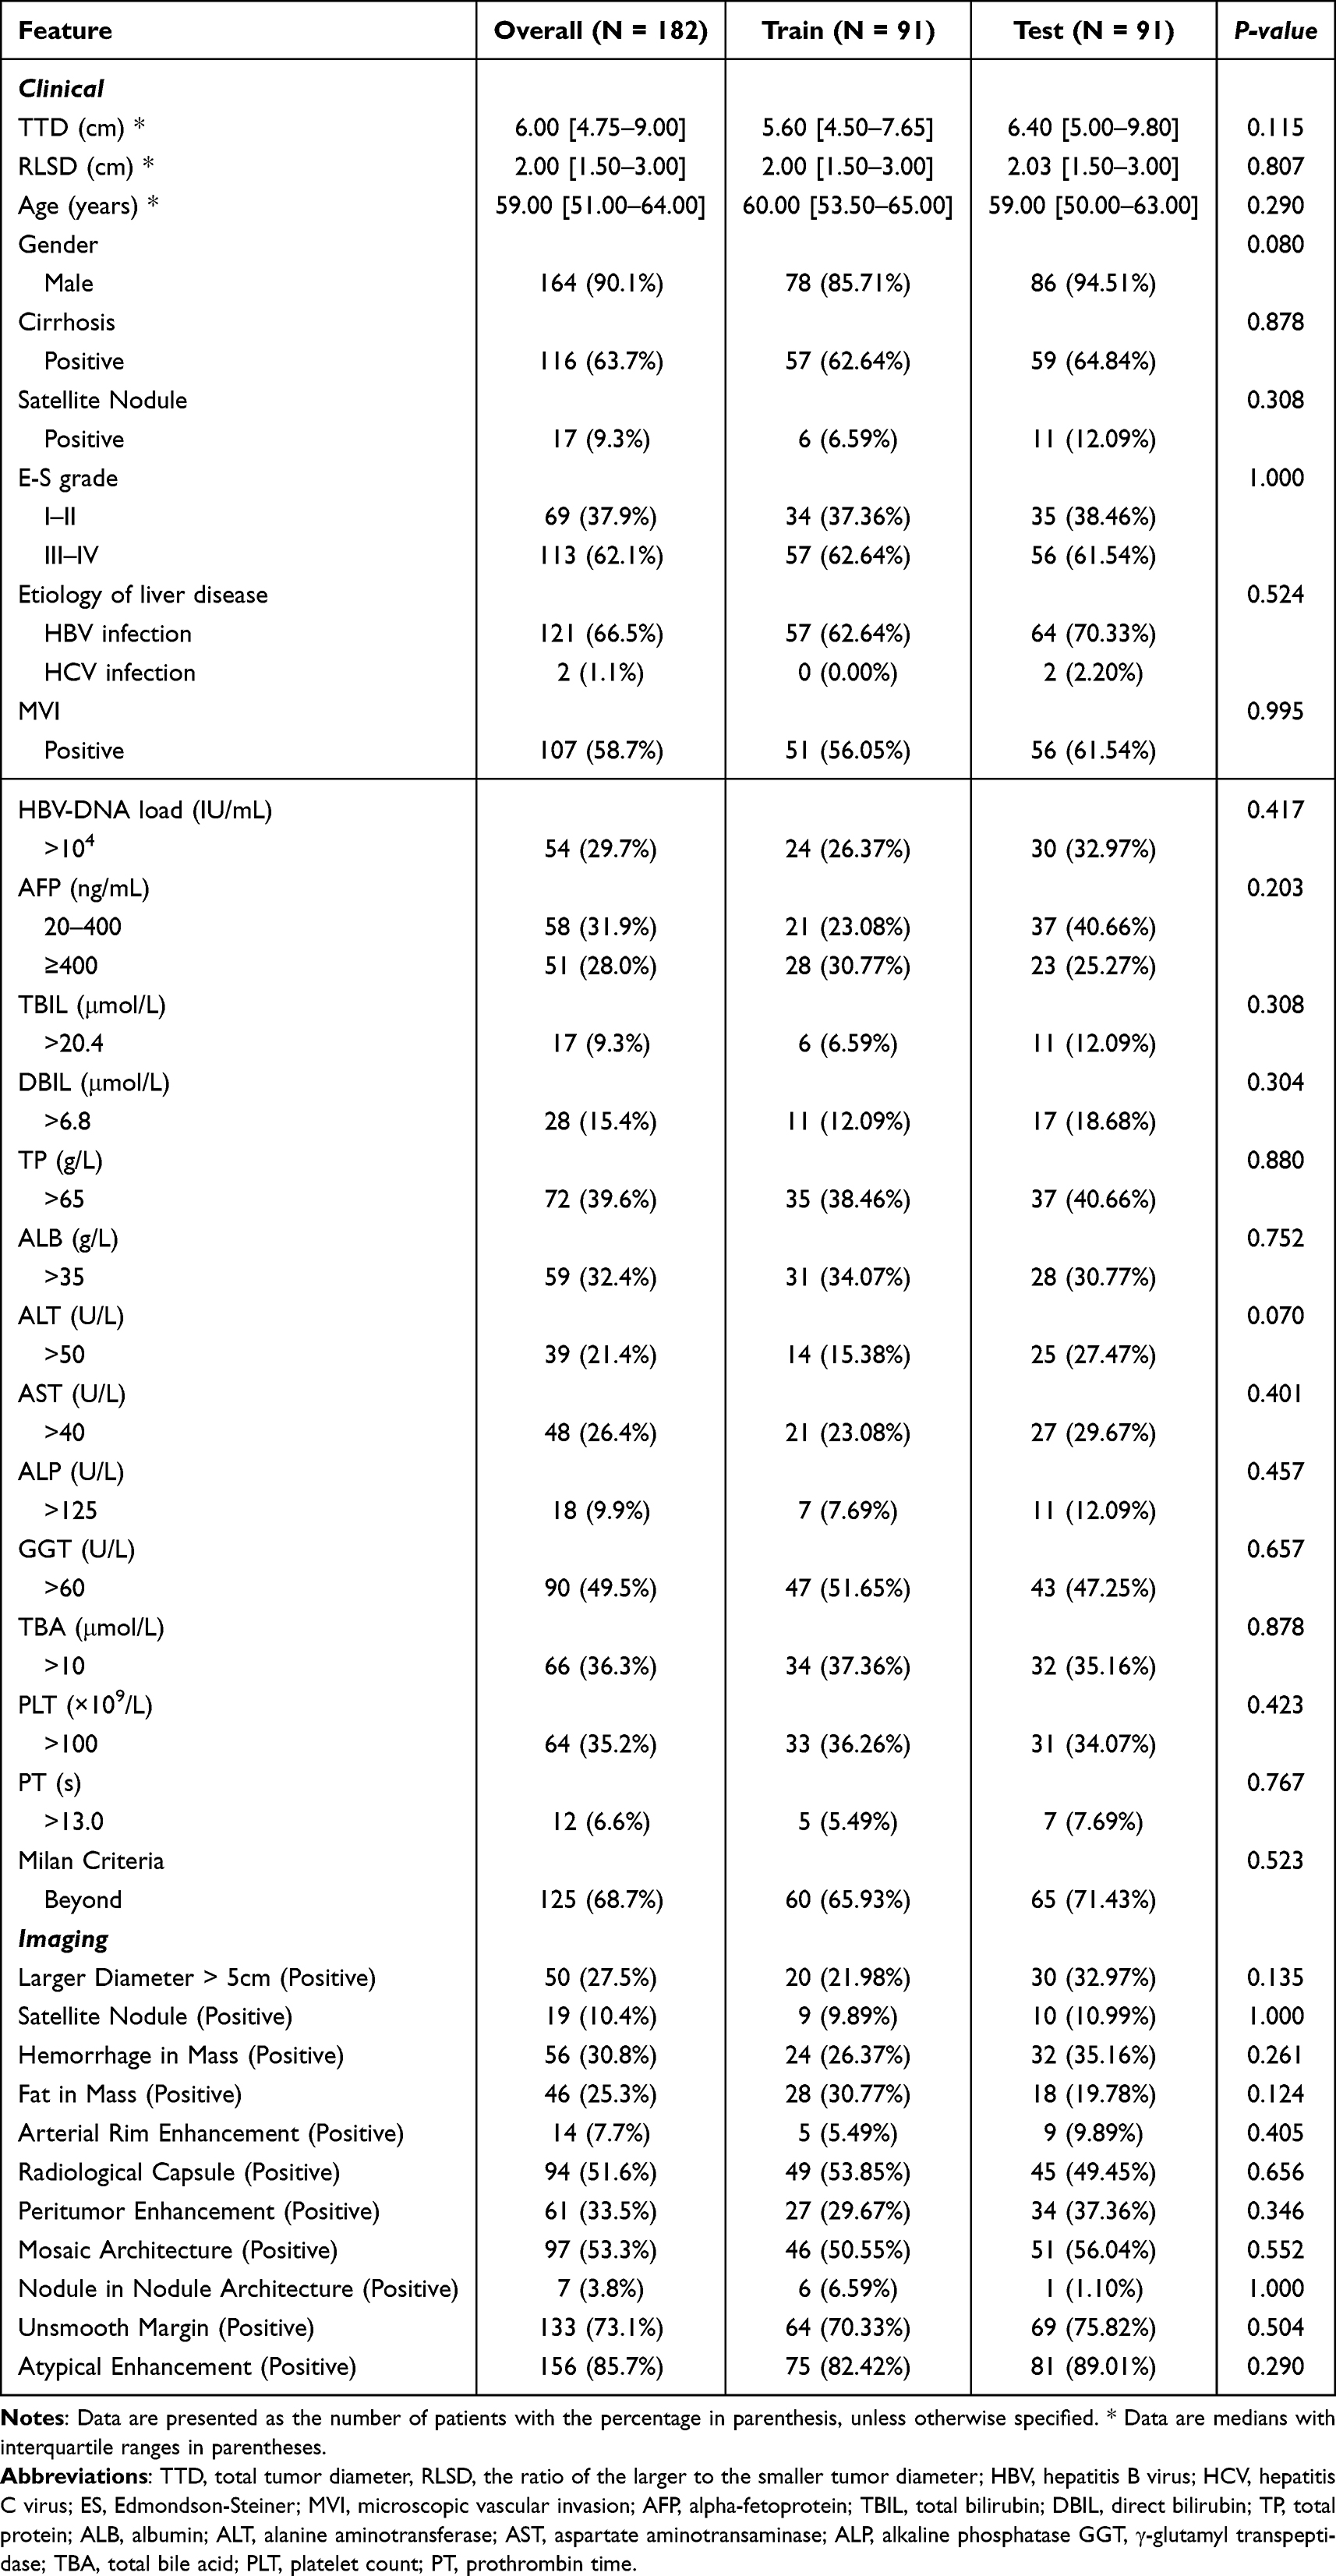 |
Table 1 The Baseline Characteristics of Patients with Bifocal HCC |
Tables 2 and 3 separately showed the results of Cox regression analysis focusing on clinical and radiologic hallmarks. In the univariable Cox regression analysis of the training cohort, the presence of Unsmooth Margin, pathological satellite nodule, MVI and AFP were independent risk factors for shorter RFS within the clinical and imaging models (all p < 0.05, Table 2). The Cox regression analysis also indicated that larger diameter >5 cm, the presence of Satellite Nodule in imaging features, along with pathological Satellite Nodule, E-S grade, MVI and AFP in clinical features were independent predictors of OS (all p < 0.05, Table 2).
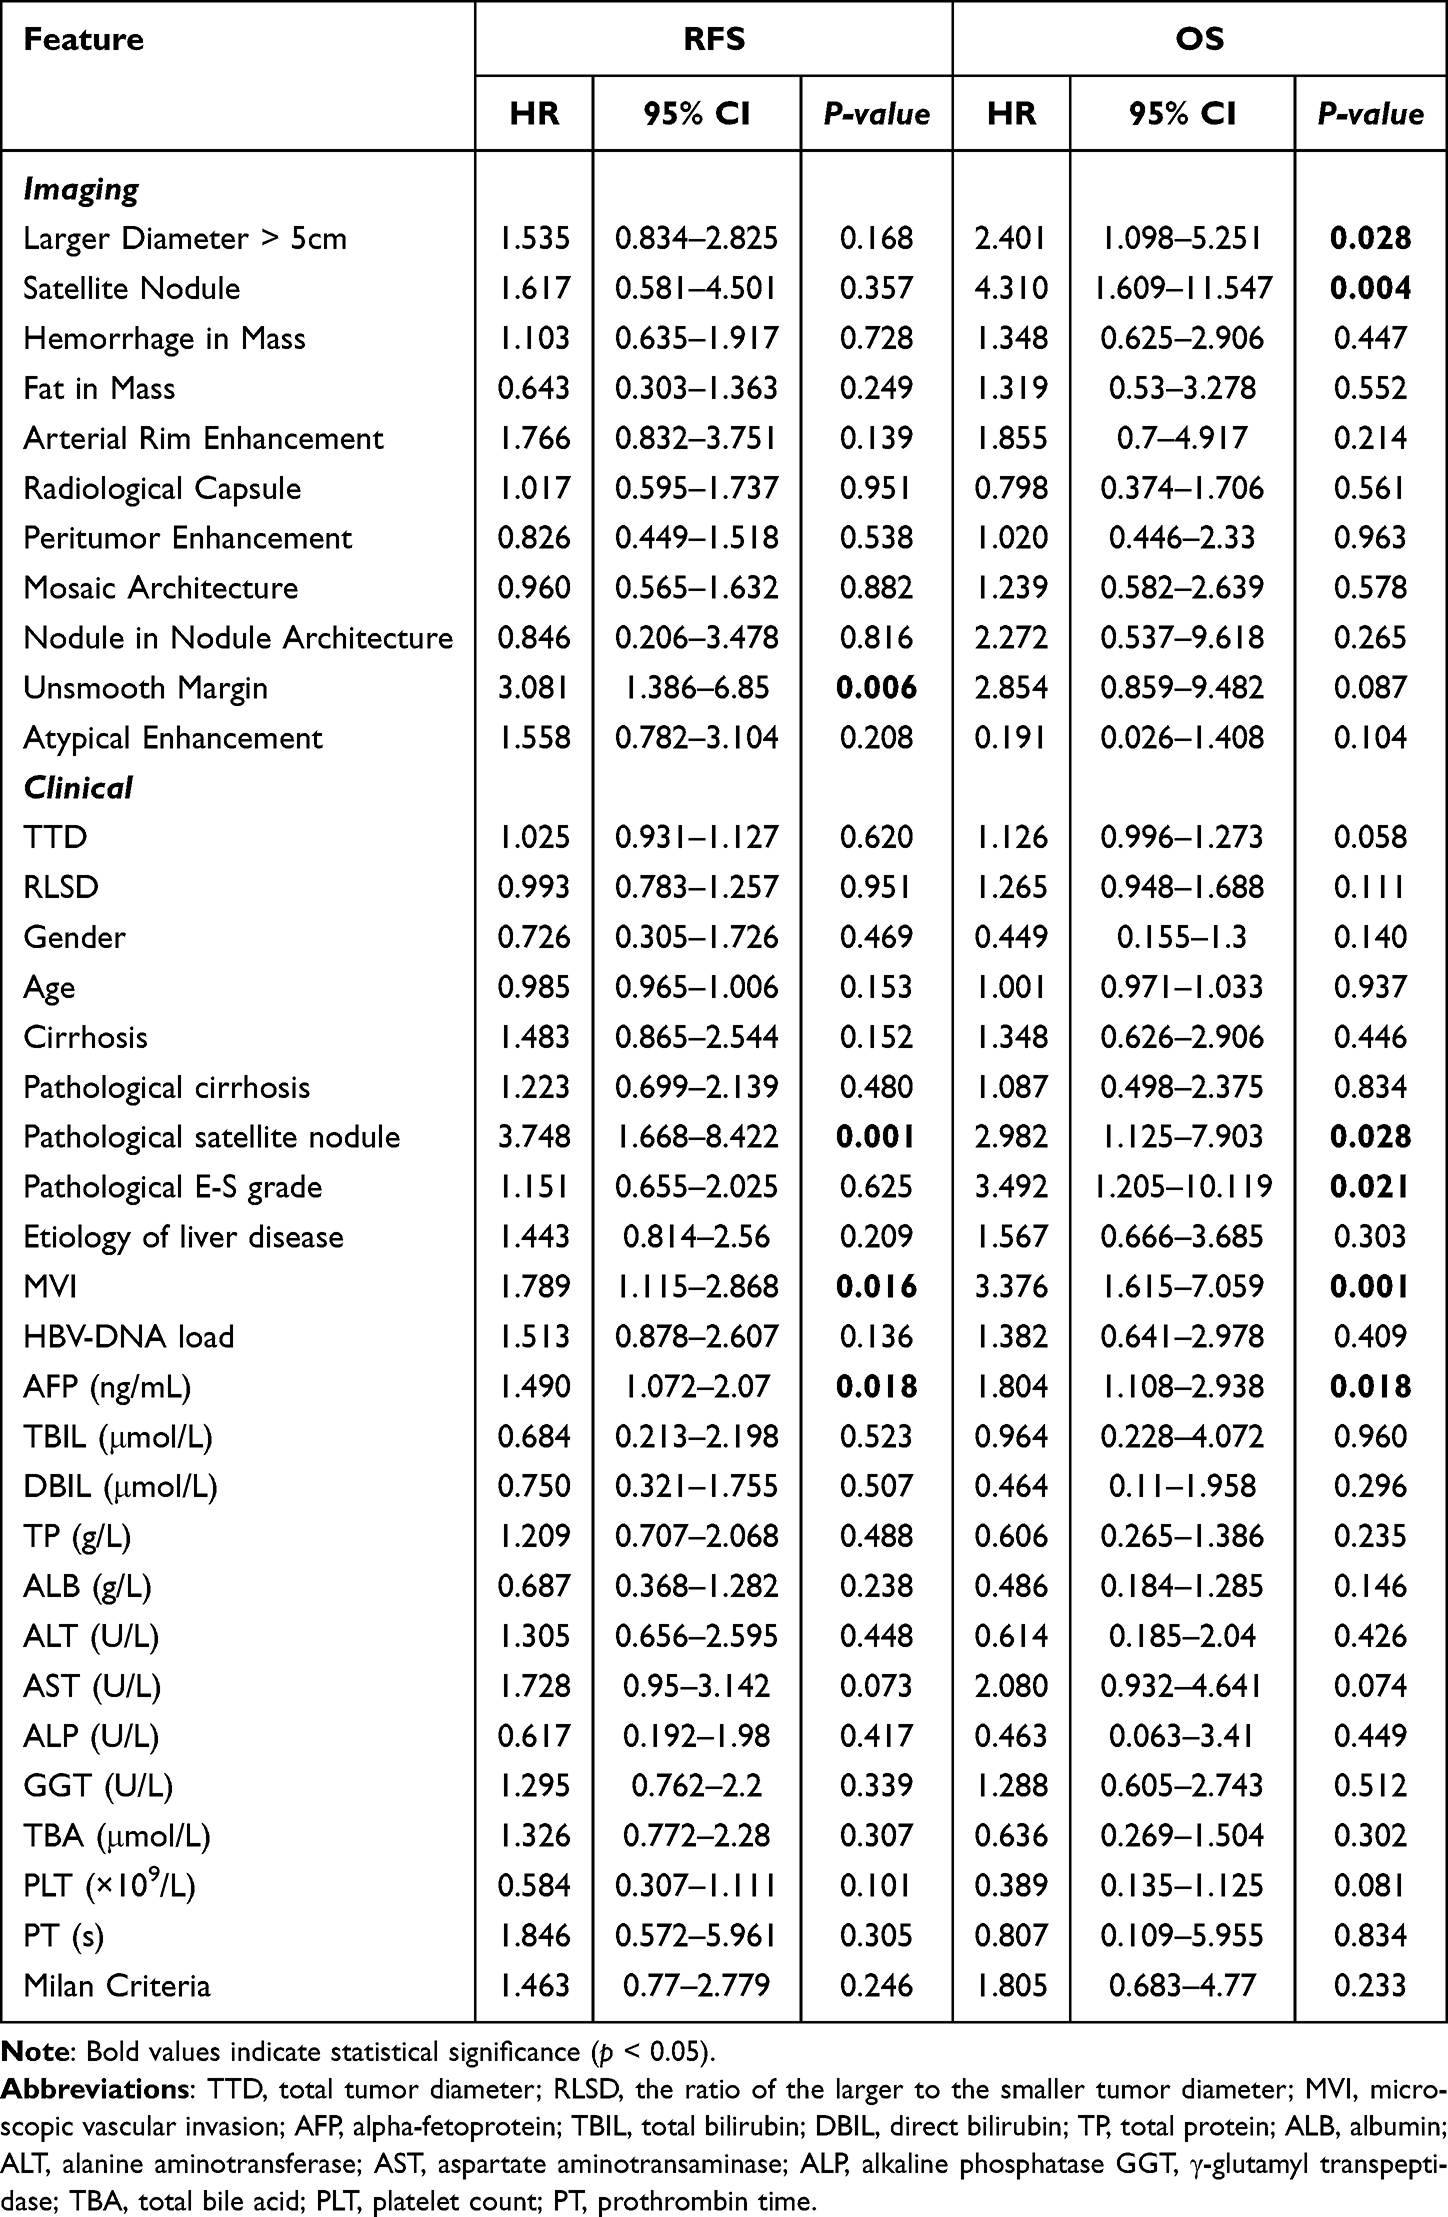 |
Table 2 Univariate Cox Regression Analyses for RFS and OS in Bifocal HCC Patients |
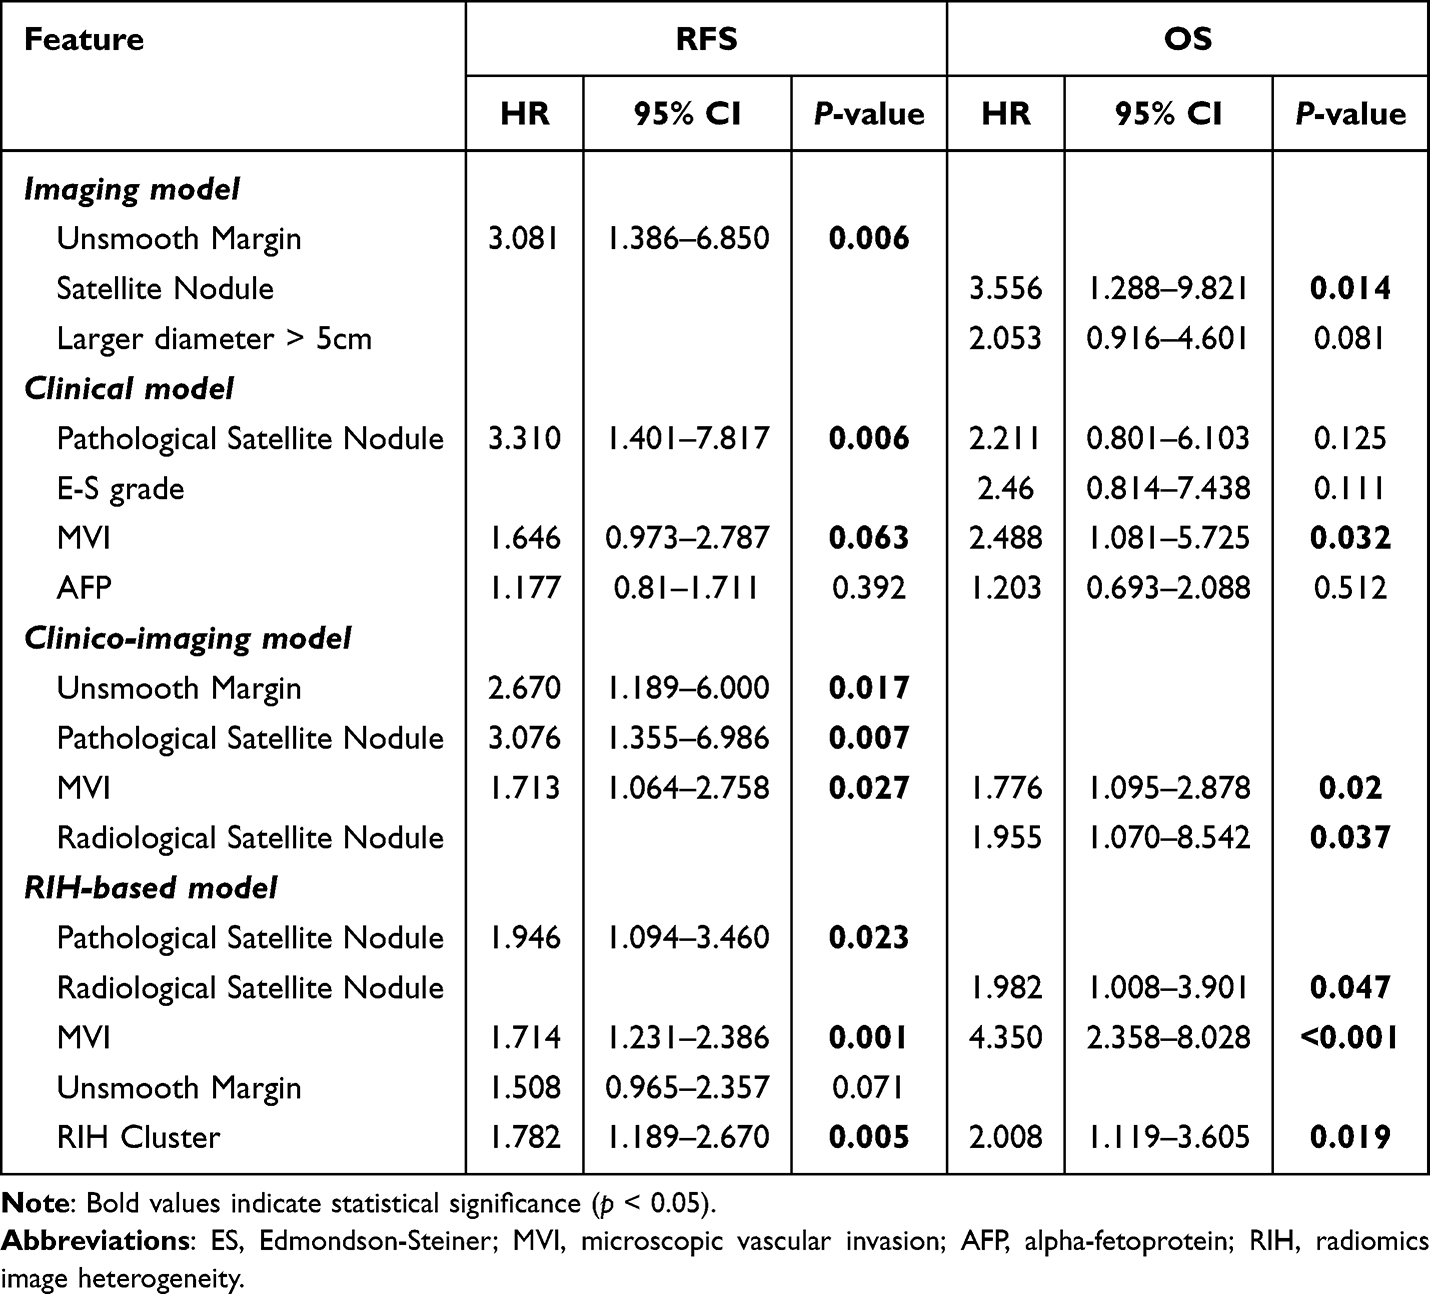 |
Table 3 Multivariate Cox Regression Analyses for RFS and OS in Bifocal HCC Patients |
In the multivariable Cox regression analysis, the predictors of RFS included Radiological Unsmooth Margin (HR, 3.081; 95% CI, 1.386–6.850) in the Imaging model and Pathological Satellite Nodule (HR, 3.310; 95% CI, 1.401–7.817), MVI (HR, 1.646; 95% CI, 0.973–2.787) in the Clinical model (Table 3). For OS, the predictors identified were Radiological Satellite Nodule (HR, 3.556; 95% CI, 1.288–9.821) in Imaging model and MVI (HR, 2.488; 95% CI, 1.081–5.725) in Clinical model (Table 3). Based on these analyses, we constructed the Imaging model and the Clinical model for RFS and OS, respectively. In Clinico-Imaging model, Unsmooth Margin (HR, 2.670; 95% CI, 1.189–6.0), Pathological Satellite Nodule (HR, 3.076; 95% CI, 1.355–6.986) and MVI (HR, 1.713; 95% CI, 1.064–2.758) were independent risk factors for shorter RFS. The Clinico-Imaging model for OS comprised MVI (HR, 1.776; 95% CI, 1.095–2.878) and Radiological satellite nodule (HR, 1.955; 95% CI, 1.070–8.542).
Unsupervised Learning Based on Radiomic Features Among bHCC Patients
In this study, we extracted multi-parametric radiomics from two lesions of bHCC that contained comprehensive radiomics information. The extracted features comprised first-order statistics and textural features derived from the GLCM, GLDM, GLRLM, GLSZM, and NGTDM matrices. The averaged features of the two lesions were used to represent the tumor radiomics characteristics of the patient. Features with zero variance and the MAD less than 1 were filtered to reduce dimensionality and minimize noise in the data (Table S2).
After calculating the similarity between the radiomics of bHCC and constructing the similarity matrix, the patients were classified into different categories using the spectral clustering algorithm (Figure 2). The two diverse subtypes suggested significant differences in the heterogeneity of radiomics features. We found that Radiomics Subtype B is characterized by high radiomics image heterogeneity (high-RIH), whereas Radiomics Subtype A is characterized by low radiomics image heterogeneity (low-RIH) (Figure 3).
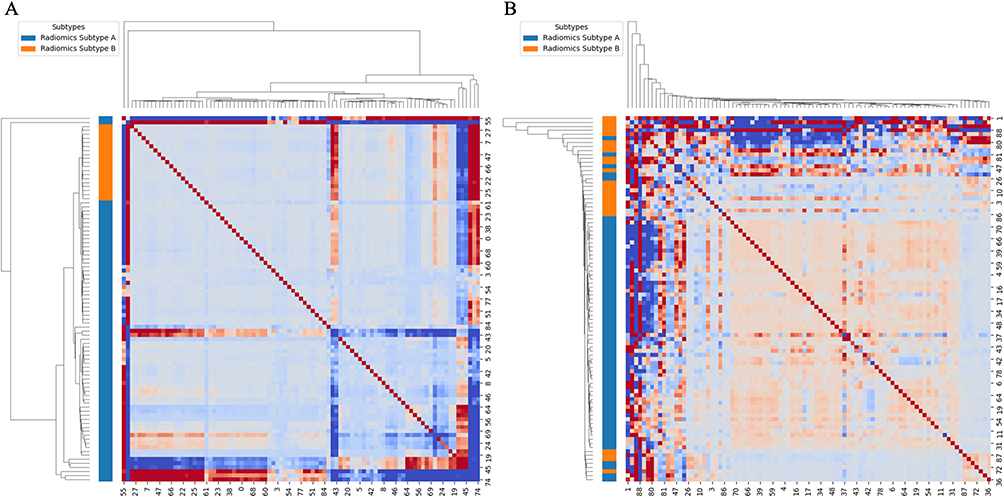 |
Figure 2 Spectral clustering heatmap of similarity network fusion based on radiomics features of bHCC patients (A) in the training cohort and (B) in the test cohort. The color bar on the left of the heatmap identifies the two main subtypes derived from the clustering analysis: Radiomics Subtype A (blue) and Radiomics Subtype B (Orange). |
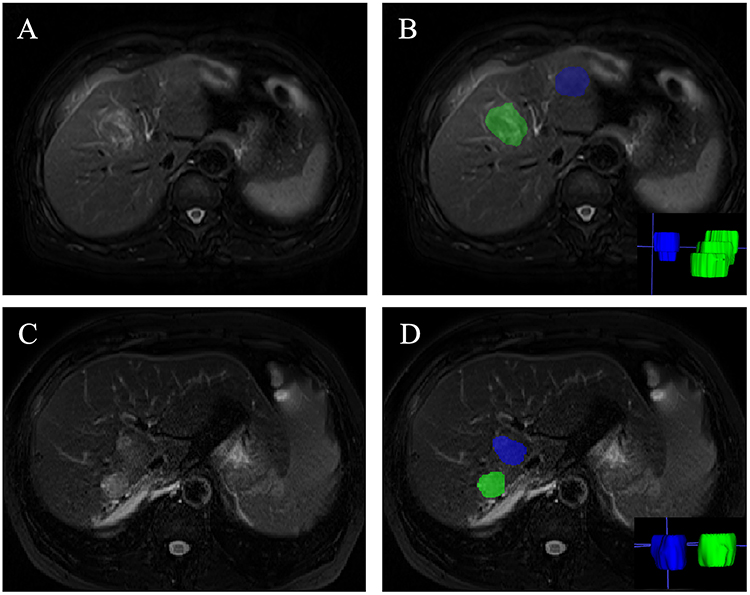 |
Figure 3 Representative MRI images of high RIH (A and B) and low (C and D) RIH. (A and B) Low-RIH image of a 66-year-old female patient. No recurrence was observed in this patient until the last follow-up. (C and D) High-RIH image of a 65-year-old male patient. Recurrence was detected 12 months after surgery and OS was 32 months. |
Characteristics of Radiomics Subtypes
Interestingly, the radiomics-based clustering stratified patients solely based on radiomics features, rather than on any predefined clinical labels. However, the TTD of low-RIH cluster were significantly lower than that of high-RIH (TTD: low-RIH/high-RIH = 5.55 [4.60–7.78] vs. 7.50 [6.50–9.15], p = 0.004) (Table 4). Significant differences were also observed in etiology of liver disease, TP, ALB levels, PLT and the Milan Criteria in training cohort (Hepatitis B virus infection: p = 0.032; TP > 65g/L: p = 0.034; ALB > 35g/L: p = 0.040; PLT > 100 × 109/L: p = 0.019; the Milan Criteria: p < 0.001). Regarding imaging features, the enhancement type also showed a statistically significant difference between the two clusters (p = 0.001).
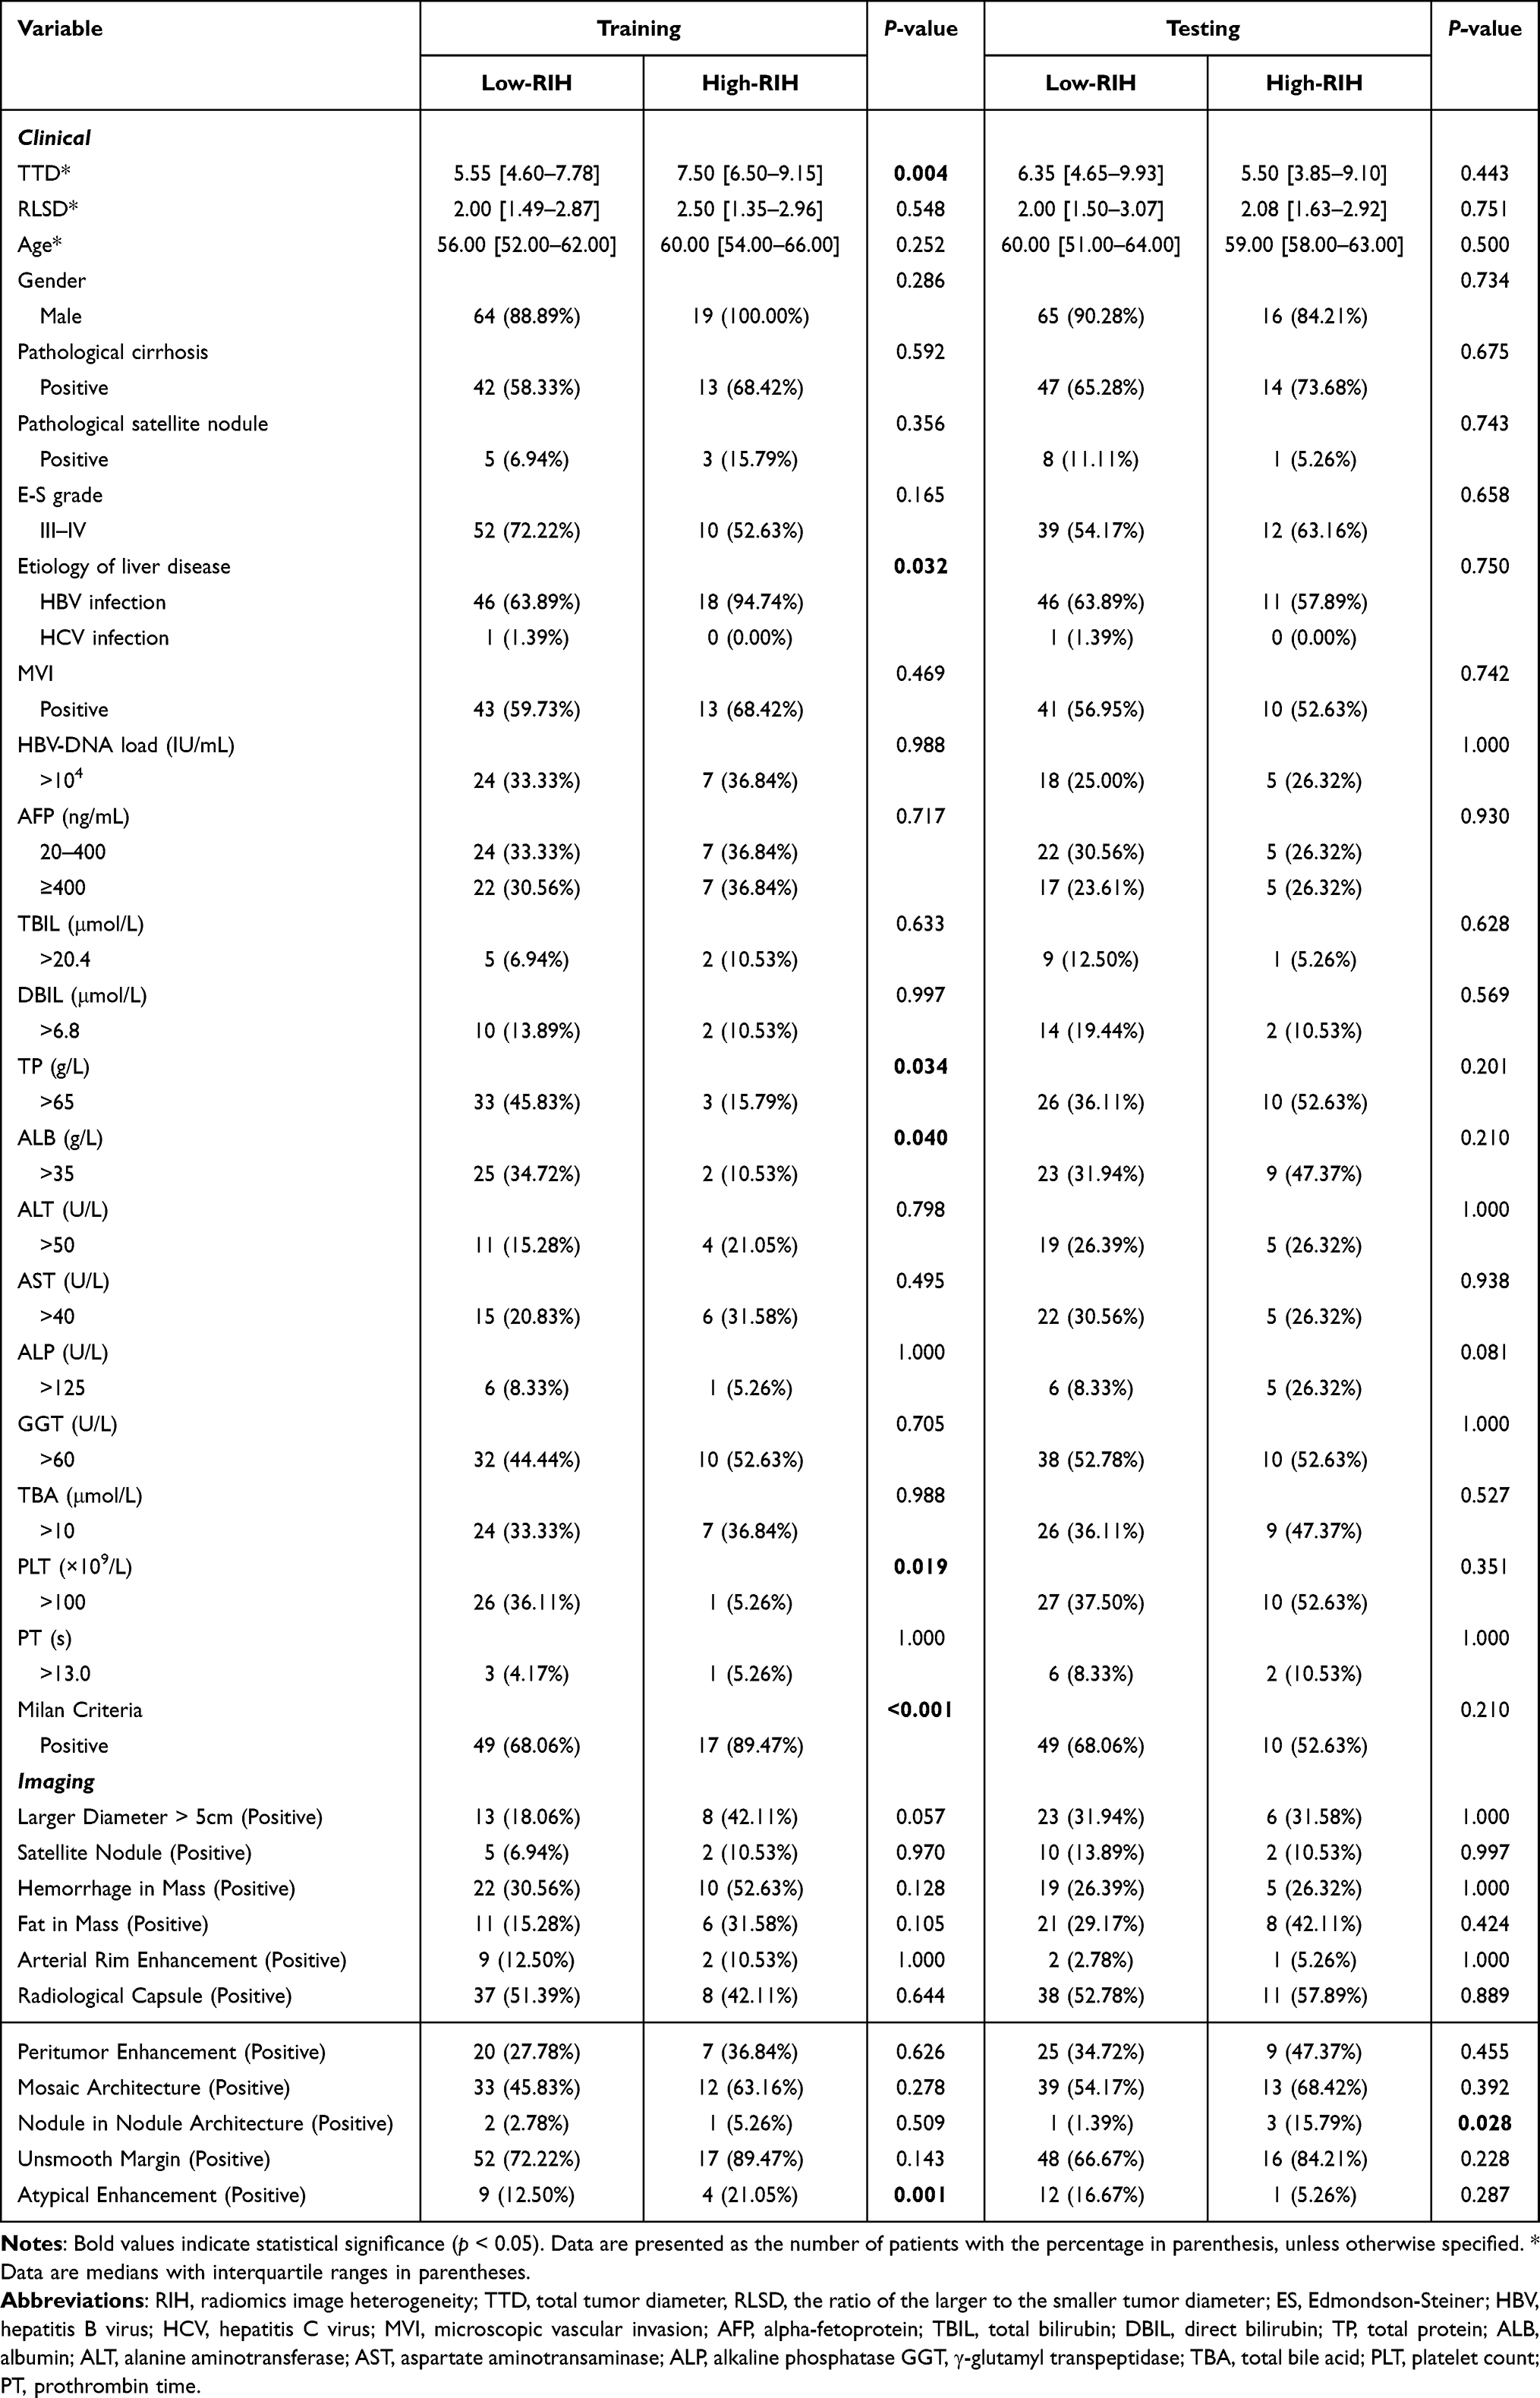 |
Table 4 Comparison of Radiomics Subgroups Identified by Unsupervised Analysis |
RIH Cluster Reveals Prognostic Value in Predicting Outcomes of bHCC
RIH cluster based solely on robust radiomics features stratified two patient groups with significantly different RFS (log-rank p = 0.0059) and OS (log-rank p = 0.0343) (Figure 4). RIH cluster was identified as an independent predictor of RFS in multivariate Cox regression analyses, after adjusting for the clinical and conventional imaging characteristics (HR = 1.782 [95% CI: 1.189–2.670], p = 0.005; Table 3 and Figure S1). RIH cluster were also significantly associated with OS (HR = 2.008 [95% CI: 1.119–3.605], p = 0.019; Table 3 and Figure S1). The AUC of RIH cluster predicting 1-,3-,5- years OS in training cohort were 0.78, 0.83, 0.81, respectively (Figure S2). The AUC of RIH cluster predicting 1-,3-,5- years RFS in training cohort were 0.75, 0.69, 0.66, respectively.
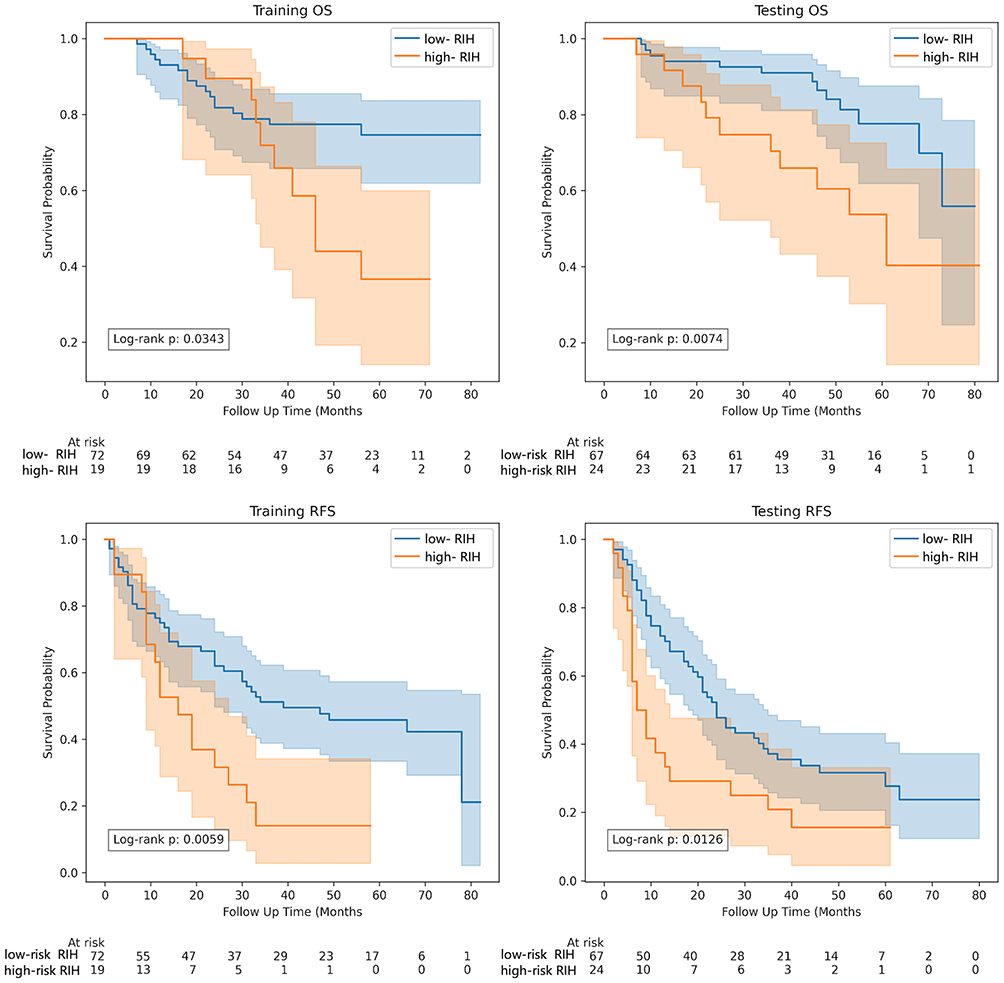 |
Figure 4 Kaplan–Meier curves of RFS and OS risk group stratified by RIH clusters. Abbreviations: OS, overall survival; RFS, recurrence-free survival; RIH, radiomics image heterogeneity. |
Improved Efficacy of Fusion Model in Predicting Prognosis
The Clinico-Imaging-Radiomics models (RIH-based model) was developed to predict RFS based on Pathological Satellite Nodule (HR = 1.946, 95% CI = 1.094–3.460, p = 0.023), MVI (HR = 1.714, 95% CI = 1.231–2.386, p = 0.001) and RIH Cluster (HR = 1.782, 95% CI = 1.189–2.670, p = 0.005) (Table 3). Additionally, we constructed the RIH-based model to predict OS by incorporating Radiological Satellite Nodule (HR = 1.982, 95% CI = 1.008–3.901, p = 0.047), MVI (HR = 4.350, 95% CI = 2.358–8.028, p < 0.001) and RIH Cluster (HR = 2.008, 95% CI = 1.119–3.605, p = 0.019) (Table 3).
Based on RIH-based model, all patients were stratified into low-risk and high-risk cohorts. Figure S3 illustrated that patients in high-risk group had significantly shorter OS than those in low-risk group (log-rank p < 0.001 in training cohort, long-rank p = 0.001 in test cohort) and RFS (log-rank p = 0.006 in training cohort, long-rank p = 0.007 in test cohort).
The C-index demonstrated that the RIH-based model, with the addition of the RIH cluster, could better predict progression compared to the other three models, particularly the Imaging model (training cohort: form 0.670 [0.557–0.780] to 0.797 [0.711–0.871], p = 0.011; testing cohort: from 0.626 [0.535–0.729] to 0.740 [0.658–0.819], p = 0.030) (Figure 5 and Table S3). Similarly, the RIH-based model enhanced the predictive efficacy for RFS in comparison to others model, particularly the Imaging model (training cohort: form 0.587 [0.527–0.647] to 0.664 [0.589–0.729], p = 0.041; testing cohort: from 0.546 [0.488–0.611] to 0.647 [0.577–0.709], p = 0.034).
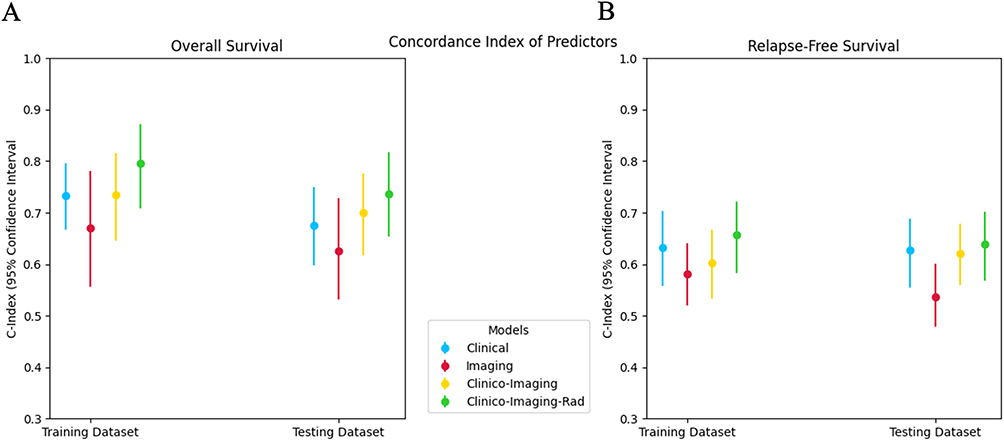 |
Figure 5 Comparison of C-indexes for Clinical, Imaging, Clinco-Imaging and Clinco-Imaging-Rad models in both training and testing sets for (A) OS and (B) RFS. |
Discussion
In this study, we innovatively extracted the radiomics features from two lesions in bHCC patients, using the mean radiomics features to represent each patient’s tumor characteristics. We then employed unsupervised machine learning and spectral clustering to establish a non-invasive MRI-based radiomics model (RIH cluster) to assess tumor heterogeneity. The RIH cluster identified two subgroups of bHCC with significantly different RFS and OS. The RIH cluster remained an independent predictor for clinical outcomes even after multivariable Cox regression analysis. Finally, we constructed the RIH-based model to predict outcomes in bHCC patients after resection by integrating RIH clusters with clinical and imaging features.
HCC is characterized by the high tumor heterogeneity, which results the early tumor recurrence and poor clinical outcome. 26 Although radiomics has emerged as an innovative tool for characterizing such heterogeneity 27 and predict outcome 28 in solitary HCC, its application in non-solitary cases has remained constrained. Previous studies have often relied on a single dominant or largest lesion to represent the disease status, potentially overlooking the overall tumor burden and the collective phenotypic state of the patient. To address this limitation, we employed the arithmetic mean to integrate features from both nodules into a unified, patient-level representation. Unlike traditional approaches, this fusion method ensures that the biological contribution of the other lesion is not ignored, thereby providing a more holistic reflection of the total disease burden. While averaging might partially smooth inter-lesion variance, it provides a stable and reproducible estimator of the average aggressiveness across different anatomical locations, reducing the impact of idiosyncratic noise from a single lesion. As an early exploration into fusion-based radiomics for non-solitary HCC, this approach establishes a primary framework for representing multifocal disease; however, we recognize that more sophisticated strategies, such as volume-weighted averaging or multi-instance learning, warrant further investigation in the future. Parallel to this patient-level feature integration, the choice of predictive modeling is crucial for capturing complex biological variations. While previous studies have commonly employed supervised algorithms for prediction, the reliance of supervised machine learning on large training datasets often leaves insufficient data for validation. In contrast, unsupervised machine learning provides an alternative approach that can overcome this limitation.29 SNF, as an unsupervised clustering analysis, comprehensively analyzes data by constructing patient networks from multiple data types and fusing them into a single network that represents the full spectrum of the data.12,20,30 In the prior study, Su et al20 formulated a noninvasive radiomics methodology using SNF analysis to effectively investigate intratumor heterogeneity in breast cancer. However, to date, there has been a lack of studies focusing on HCC, especially regarding bHCC, which is characterized by a higher degree of tumor heterogeneity.26
Therefore, we utilized the SNF to analyze the tumor heterogeneity of bHCC based on radiomics features of two lesions images. This algorithm capitalized on the complementary nature of multiple MRI sequences, without requiring a priori knowledge, to compute and fuse patient similarity networks derived from each sequence. By utilizing an unsupervised approach like SNF, we reduce the risk of overfitting that often plagues supervised models, as the feature selection and clustering are driven by the intrinsic structure of the data rather than being forced to fit specific clinical labels. Based on the similarity matrix, we constructed a Laplacian matrix of radiomics to identify two distinct subgroups. We observed significant prognostic differences between the subgroups, with low-RIH patients exhibiting better outcomes, and high-RIH patients showing shorter RFS and OS. Unlike biopsy-based methods that are limited by sampling bias and may fail to represent the entire tumor,31,32 our radiomics framework offers a comprehensive, three-dimensional, and non-invasive evaluation. The RIH clusters were found to be complementary to routine clinical and imaging tests, suggesting that radiomics can capture “invisible” biological variations between multiple lesions.
In the fusion model, Pathological Satellite Nodule and MVI were independent predictors for RFS, while Radiological Satellite Nodule and MVI predicted OS. Our study corroborated the widely recognized role of MVI as a significant risk factor for HCC recurrence following curative resection.33,34 Satellite Nodule, which represents intrahepatic metastases within the venous drainage area surrounding the tumor, is closely associated with MVI.35,36 They imply a heightened risk of aggressiveness and recurrence.37 Notably, some predictors that were significant in univariate analysis, such as AFP levels and morphological features like unsmooth margins, lost their statistical significance in the multivariate models. This phenomenon likely stems from the inherent biological and statistical correlations between these variables. For instance, elevated AFP and unsmooth margins are often closely associated with MVI38,39 and pathological satellite nodules,40 which are more direct indicators of tumor invasiveness. When entered into the same multivariate Cox model, the more powerful independent predictors, specifically MVI and the RIH cluster, tend to capture the shared variance, thereby mediating the prognostic value of these overlapping clinical and imaging factors. Our findings further demonstrated that integrating these variables with the RIH cluster significantly enhanced predictive performance. From a clinical perspective, this integrated model may potentially assist clinicians in identifying high-risk patients who might benefit from more aggressive adjuvant therapies or intensified surveillance protocols after surgery. However, its practical implementation in clinical decision-making requires further validation through prospective, multicenter studies to ensure its reliability and generalizability across diverse patient populations.
To ensure the reliability and generalizability of our prognostic models, we implemented several rigorous strategies to address the risk of overfitting. First, we employed a strict dimensionality reduction workflow for radiomics, including repeatability and variability filtering, to distill over a thousand features into a single representative RIH cluster. Second, we adhered to the EPV principle to maintain a balanced ratio between event density and the number of predictors, ensuring that our multivariable Cox models remained statistically parsimonious.
Our study has several limitations. Firstly, our study is an exploratory investigation with a retrospective design, which may introduce potential selection bias. One of the primary limitations is the relatively small sample size from a single center. Although we verified model stability through internal testing and bootstrap resamples to achieve high consistency in performance, the lack of multi-center validation limits the immediate generalizability of our findings to different imaging protocols or diverse patient populations. Specifically, while the use of a single MRI scanner ensured the consistency of radiomics features, the lack of scanner variability in our training set may affect the robustness of the RIH model when applied to images acquired from different manufacturers or hardware configurations. Furthermore, while our inclusion and exclusion criteria were clearly defined to ensure a homogeneous surgical cohort, we excluded patients with macrovascular invasion (eg, portal vein tumor thrombus). Although this was necessary to focus on candidates for radical hepatectomy, it may further limit the generalizability of our findings to the broader HCC population, particularly those in more advanced clinical stages. Secondly, our study focused solely on the relationship between tumor imaging heterogeneity and prognosis. Although previous research has explored the potential links between radiomics and genomic expression levels, the biological significance of imaging heterogeneity remains unclear. Therefore, we plan to conduct integrated studies combining radiomics and genomics to further investigate the potential connections between imaging phenotypes and genomic features, aiming to elucidate the multidimensional information underlying tumor heterogeneity. Thirdly, to address the potential risk of overfitting and the instability of radiomic features, we strictly adhered to radiomics guidelines and checklists to maximize the reliability of radiomic analyses. This included implementing a multi-step feature selection process and maintaining a conservative variable-to-event ratio to ensure the findings were not driven by random noise. Despite these precautions, further validation across different imaging protocols and centers is warranted to ensure the reproducibility of our results.
Conclusion
In this study, we employed unsupervised machine learning to assess radiomics features heterogeneity in patients with bifocal HCC, ultimately constructing a RIH-based model for predicting RFS and OS. While the model demonstrates potential for enhancing prognostic stratification, further external validation in multicenter cohorts is warranted to confirm its clinical applicability as a reliable tool for guiding therapeutic decision-making.
Abbreviations
HCC, Hepatocellular carcinoma; mHCC, Multifocal HCC; bHCC, bifocal HCC; SNF, Similarity network fusion; RIH, Radiomics image heterogeneity; AFP, alpha fetoprotein; TBIL, total bilirubin; DBIL, direct bilirubin; TP, total protein; ALB, albumin; ALT, alanine aminotransferase; AST, aspartate aminotransaminase; ALP, alkaline phosphatase; GGT, g-glutamyl transferase; TBA, total bile acid; PT, prothrombin time; PLT, platelet count; E-S, Edmondson-Steiner; TTD, The radiological total tumor diameter; RLSD, diameter of the largest tumor/diameter of the smallest tumor; MAD, median absolute deviation; ICCs, inter-class correlation coefficients.
Ethics Approval and Informed Consent
This retrospective study was approved by the Zhongshan Hospital, Fudan University (Ethics approval No. B2021-682R) ethics committees.
Funding
This work was supported by National Natural Science Foundation of China (Grant number [82371923] and [82171897]), Shanghai Municipal Health Commission (Grant number [202240152]), China National Key R&D Program (Grant number [2022YFC2401605]), Scientific Research Development Plan of SHDC and UNITED IMAGING and Science and Technology Commission of Shanghai Municipality (Grant number [23Y11907400]).
Disclosure
The authors report no conflicts of interest in this work.
References
1. Vogel A, Meyer T, Sapisochin G, Salem R, Saborowski A. Hepatocellular carcinoma. Lancet. 2022;400(10360):1345–17. doi:10.1016/S0140-6736(22)01200-4
2. Kudo M, Izumi N, Kubo S, et al. Report of the 20th nationwide follow-up survey of primary liver cancer in Japan. Hepatol Res. 2020;50(1):15–46.
3. Ito K, Takemura N, Inagaki F, Mihara F, Kokudo N. Difference in treatment algorithms for hepatocellular carcinoma between world’s principal guidelines. Glob Health Med. 2020;2(5):282–291. doi:10.35772/ghm.2020.01066
4. Zhou J, Sun H, Wang Z, et al. Guidelines for the diagnosis and treatment of primary liver cancer (2022 edition). Liver cancer. 2023;12(5):405–444
5. Hasegawa K, Takemura N, Yamashita T, et al. Clinical practice guidelines for hepatocellular carcinoma: The Japan society of hepatology 2021 version (5th JSH-HCC guidelines). Hepatol Res. 2023;53(5):383–390. doi:10.1111/hepr.13892
6. Wu F, Sun H, Zhou C, et al. Prognostic factors for long-term outcome in bifocal hepatocellular carcinoma after resection. Eur Radiol. 2023;33(5):3604–3616. doi:10.1007/s00330-023-09398-2
7. Bo Z, Chen B, Zhao Z, et al. Prediction of response to lenvatinib monotherapy for unresectable hepatocellular carcinoma by machine learning radiomics: a multicenter cohort study. Clin Cancer Res. 2023;29(9):1730–1740.
8. Liu Q, Li J, Liu F, et al. A radiomics nomogram for the prediction of overall survival in patients with hepatocellular carcinoma after hepatectomy. Cancer Imaging. 2020;20(1):82. doi:10.1186/s40644-020-00360-9
9. Feng Z, Li H, Liu Q, et al. CT radiomics to predict macrotrabecular-massive subtype and immune status in hepatocellular carcinoma. Radiology. 2023;307(1):e221291. doi:10.1148/radiol.221291
10. yi XT, hao ZZ, pan MX, et al. Predicting microvascular invasion in hepatocellular carcinoma using CT-based radiomics model. Radiology. 2023;307(4):e222729. doi:10.1148/radiol.222729
11. Gong XQ, Tao YY, Wu Y, et al. Progress of MRI radiomics in hepatocellular carcinoma. Front Oncol. 2021;11:698373. doi:10.3389/fonc.2021.698373
12. Wang Q, Nilsson H, Xu K, et al. Exploring tumor heterogeneity in colorectal liver metastases by imaging: Unsupervised machine learning of preoperative CT radiomics features for prognostic stratification. Eur J Radiol. 2024;175:111459. doi:10.1016/j.ejrad.2024.111459
13. Wang Q, Li C, Chen G, et al. Unsupervised machine learning of MRI radiomics features identifies two distinct subgroups with different liver function reserve and risks of post-hepatectomy liver failure in patients with hepatocellular carcinoma. Cancers. 2023;15(12):3197. doi:10.3390/cancers15123197
14. Avanzo M, Wei L, Stancanello J, et al. Machine and deep learning methods for radiomics. Med Phys. 2020;47(5). doi:10.1002/mp.13678
15. Wang B, Mezlini AM, Demir F, et al. Similarity network fusion for aggregating data types on a genomic scale. Nat Meth. 2014;11(3):333–337. doi:10.1038/nmeth.2810
16. Wang TH, Lee CY, Lee TY, Huang HD, Hsu JBK, Chang TH. Biomarker identification through multiomics data analysis of prostate cancer prognostication using a deep learning model and similarity network fusion. Cancers. 2021;13(11):2528. doi:10.3390/cancers13112528
17. Chiu AM, Mitra M, Boymoushakian L, Coller HA. Integrative analysis of the inter-tumoral heterogeneity of triple-negative breast cancer. Sci Rep. 2018;8(1):11807. doi:10.1038/s41598-018-29992-5
18. Pitroda SP, Khodarev NN, Huang L, et al. Integrated molecular subtyping defines a curable oligometastatic state in colorectal liver metastasis. Nat Commun. 2018;9(1):1793. doi:10.1038/s41467-018-04278-6
19. Cavalli FMG, Remke M, Rampasek L, et al. Intertumoral heterogeneity within medulloblastoma subgroups. Cancer Cell. 2017;31(6):737–754.e6. doi:10.1016/j.ccell.2017.05.005
20. Su GH, Xiao Y, You C, et al. Radiogenomic-based multiomic analysis reveals imaging intratumor heterogeneity phenotypes and therapeutic targets. Sci Adv. 2023;9(40):eadf0837. doi:10.1126/sciadv.adf0837
21. Kocak B, Baessler B, Bakas S, et al. CheckList for evaluation of radiomics research (CLEAR): a step-by-step reporting guideline for authors and reviewers endorsed by ESR and EuSoMII. Insights Imaging. 2023;14(1):75. doi:10.1186/s13244-023-01415-8
22. Kocak B, Borgheresi A, Ponsiglione A, et al. Explanation and elaboration with examples for CLEAR (CLEAR-E3): An EuSoMII radiomics auditing group initiative. Eur Radiol Exp. 2024;8(1):72. doi:10.1186/s41747-024-00471-z
23. Kocak B, Akinci D’Antonoli T, Mercaldo N, et al. METhodological RadiomICs score (METRICS): a quality scoring tool for radiomics research endorsed by EuSoMII. Insights Imaging. 2024;15(1):8. doi:10.1186/s13244-023-01572-w
24. Leys C, Ley C, Klein O, Bernard P, Licata L. Detecting outliers: Do not use standard deviation around the mean, use absolute deviation around the median. J Exp Soc Psychol. 2013;49(4):764–766. doi:10.1016/j.jesp.2013.03.013
25. Ng AY, Jordan MI, Weiss Y. On spectral clustering: analysis and an algorithm.
26. Miranda J, Paules C, Noell G, et al. Similarity network fusion to identify phenotypes of small-for-gestational-age fetuses. iScience. 2023;26(9):107620. doi:10.1016/j.isci.2023.107620
27. Wang Y, Zhu GQ, Yang R, et al. Deciphering intratumoral heterogeneity of hepatocellular carcinoma with microvascular invasion with radiogenomic analysis. J Transl Med. 2023;21(1):734. doi:10.1186/s12967-023-04586-6
28. Liu HF, Wang M, Lu YJ, et al. CEMRI-based quantification of intratumoral heterogeneity for predicting aggressive characteristics of hepatocellular carcinoma using habitat analysis: comparison and combination of deep learning. Acad Radiol. 2023:S1076633223006591. doi:10.1016/j.acra.2023.11.024.
29. Chong HH, Yang L, Sheng RF, et al. Multi-scale and multi-parametric radiomics of gadoxetate disodium–enhanced MRI predicts microvascular invasion and outcome in patients with solitary hepatocellular carcinoma ≤ 5 cm. Eur Radiol. 2021;31(7):4824–4838. doi:10.1007/s00330-020-07601-2
30. Qin Q, Qu J, Yin Y, et al. Unsupervised machine learning model to predict cognitive impairment in subcortical ischemic vascular disease. Alzheimers Dement. 2023;19(8):3327–3338. doi:10.1002/alz.12971
31. Gerlinger M, Swanton C. How darwinian models inform therapeutic failure initiated by clonal heterogeneity in cancer medicine. Br J Cancer. 2010;103(8):1139–1143. doi:10.1038/sj.bjc.6605912
32. Kern SE. Why your new cancer biomarker may never work: recurrent patterns and remarkable diversity in biomarker failures. Cancer Res. 2012;72(23):6097–6101. doi:10.1158/0008-5472.CAN-12-3232
33. Xu XF, Xing H, Han J, et al. Risk factors, patterns, and outcomes of late recurrence after liver resection for hepatocellular carcinoma: a multicenter study from China. JAMA Surg. 2019;154(3):209. doi:10.1001/jamasurg.2018.4334
34. Chan AWH, Zhong J, Berhane S, et al. Development of pre and post-operative models to predict early recurrence of hepatocellular carcinoma after surgical resection. J Hepatol. 2018;69(6):1284–1293. doi:10.1016/j.jhep.2018.08.027
35. Choi JY, Lee JM, Sirlin CB. CT and MR imaging diagnosis and staging of hepatocellular carcinoma: part I. Development, growth, and spread: key pathologic and imaging aspects. Radiology. 2014;272(3):635–654. doi:10.1148/radiol.14132361
36. McHugh PP, Gilbert J, Vera S, Koch A, Ranjan D, Gedaly R. Alpha-fetoprotein and tumour size are associated with microvascular invasion in explanted livers of patients undergoing transplantation with hepatocellular carcinoma. HPB. 2010;12(1):56–61. doi:10.1111/j.1477-2574.2009.00128.x
37. Rodríguez-Perálvarez M, Luong TV, Andreana L, Meyer T, Dhillon AP, Burroughs AK. A systematic review of microvascular invasion in hepatocellular carcinoma: diagnostic and prognostic variability. Ann Surg Oncol. 2013;20(1):325–339. doi:10.1245/s10434-012-2513-1
38. Wu F, Sun H, Shi Z, et al. Estimating microvascular invasion in patients with resectable multinodular hepatocellular carcinoma by using preoperative contrast-enhanced MRI: establishment and validation of a risk score. J Hepatocell Carcinoma. 2023;10:1143–1156. doi:10.2147/JHC.S410237
39. Che F, Li Q, Ren W, et al. 3D fractal dimension analysis of CT imaging for microvascular invasion prediction in hepatocellular carcinoma. Eur Radiol. 2025. doi:10.1007/s00330-025-11878-6
40. Zhang K, He K, Zhang L, et al. Gadoxetic acid–enhanced MRI scoring model to predict pathologic features of hepatocellular carcinoma. Radiology. 2025;314(2):e233229. doi:10.1148/radiol.233229
 © 2026 The Author(s). This work is published and licensed by Dove Medical Press Limited. The
full terms of this license are available at https://www.dovepress.com/terms
and incorporate the Creative Commons Attribution
- Non Commercial (unported, 4.0) License.
By accessing the work you hereby accept the Terms. Non-commercial uses of the work are permitted
without any further permission from Dove Medical Press Limited, provided the work is properly
attributed. For permission for commercial use of this work, please see paragraphs 4.2 and 5 of our Terms.
© 2026 The Author(s). This work is published and licensed by Dove Medical Press Limited. The
full terms of this license are available at https://www.dovepress.com/terms
and incorporate the Creative Commons Attribution
- Non Commercial (unported, 4.0) License.
By accessing the work you hereby accept the Terms. Non-commercial uses of the work are permitted
without any further permission from Dove Medical Press Limited, provided the work is properly
attributed. For permission for commercial use of this work, please see paragraphs 4.2 and 5 of our Terms.
Recommended articles
Prognosis of Primary Liver Cancer Based on LI-RADS Classification with Extracellular Agent-Enhanced MRI
Li Y, Ni X, Liu X, Yang C, Wang Y, Lu X, Zhou C
Journal of Hepatocellular Carcinoma 2023, 10:399-411
Published Date: 9 March 2023
Estimating Microvascular Invasion in Patients with Resectable Multinodular Hepatocellular Carcinoma by Using Preoperative Contrast-Enhanced MRI: Establishment and Validation of a Risk Score
Wu F, Sun H, Shi Z, Zhou C, Huang P, Xiao Y, Yang C, Zeng M
Journal of Hepatocellular Carcinoma 2023, 10:1143-1156
Published Date: 20 July 2023
Prognostic Impact of CCA Components in Combined Hepatocellular Carcinoma-Cholangiocarcinoma
Zhu Z, Yang C, Zeng M, Zhou C
Journal of Hepatocellular Carcinoma 2024, 11:2483-2492
Published Date: 18 December 2024
Noninvasive Prediction of High Ki-67 Expression in Hepatocellular Carcinoma Using Multiparametric MRI and Clinical Biomarkers
Zhang F, Chen G, Huang M, Yang Y, Wang Z, Shen Y, Luo Y, Hu X, Li Z
Journal of Hepatocellular Carcinoma 2026, 13:574222
Published Date: 17 February 2026