Back to Journals » Journal of Inflammation Research » Volume 16
Nomograms Based on the Albumin/Neutrophil-to-Lymphocyte Ratio Score for Predicting Coronary Artery Disease or Subclinical Coronary Artery Disease
Authors Wei C ![]() , Fan W, Zhang Y
, Fan W, Zhang Y ![]() , Liu Y, Ding Z, Si Y, Liu J, Sun L
, Liu Y, Ding Z, Si Y, Liu J, Sun L ![]()
Received 10 October 2022
Accepted for publication 6 January 2023
Published 13 January 2023 Volume 2023:16 Pages 169—182
DOI https://doi.org/10.2147/JIR.S392482
Checked for plagiarism Yes
Review by Single anonymous peer review
Peer reviewer comments 2
Editor who approved publication: Professor Ning Quan
Chen Wei, Wenjun Fan, Ying Zhang, Yixiang Liu, Zhenjiang Ding, Yueqiao Si, Jingyi Liu, Lixian Sun
Department of Cardiology, The Affiliated Hospital of Chengde Medical University, Chengde, Hebei, 067000, People’s Republic of China
Correspondence: Lixian Sun, Department of Cardiology, The Affiliated Hospital of Chengde Medical University, Chengde, Hebei, 067000, People’s Republic of China, Tel +86 0314 227 9016, Fax +86 0314 227 4895, Email [email protected]
Purpose: To develop and validate two nomograms incorporating the albumin/neutrophil-to-lymphocyte ratio score (ANS) for predicting the risk of coronary artery disease (CAD) or subclinical CAD.
Patients and Methods: Four hundred fifty patients with suspected CAD who underwent coronary computed tomographic angiography were consecutively enrolled between September 2015 and June 2017. Nomograms were established based on independent predictors of CAD or subclinical CAD.
Results: In total, 437 patients with suspected CAD who underwent coronary computed tomographic angiography were included. Male sex, age ≥ 65 years, smoking, hypertension, diabetes, dyslipidemia, ischemic stroke, and ANS were independent predictors of CAD and subclinical CAD. The areas under the curve of each nomogram were 0.799 (95% CI: 0.752– 0.846) and 0.809 (95% CI: 0.762– 0.856), respectively. The calibration curve and decision curve analysis showed good performance for the diagnostic nomograms. The prediction of CAD or subclinical CAD by the ANS was not modified by the independent predictors (all, p for interaction > 0.05).
Conclusion: Our ANS-based nomograms can provide accurate and individualized risk predictions for patients with suspected CAD or subclinical CAD.
Keywords: albumin/neutrophil-to-lymphocyte ratio score, ANS, coronary artery disease, diagnosis, nomogram
Introduction
Coronary artery disease (CAD) is the leading cause of an enormous global health and economic burden.1–3 However, frequently there is uncertainty in clinical practice over the use of preventive therapies, particularly for patients at borderline or intermediate risk. The fact that CAD and subclinical CAD is associated with an increased risk of long-term mortality and cardiovascular events in the general population is well-known.4–8
The atherosclerosis process is a chronic inflammatory process, and monocytes, neutrophils, and lymphocytes are the main cells of this process.9 Therefore, recent studies have focused on the peripheral blood inflammatory cell count and its derived indicators, which are easy to measure and can also predict the severity of the disease.10 The neutrophil-to-lymphocyte ratio (NLR) is a marker of exacerbated systemic inflammation, which has been associated with CAD in previous studies.11,12 Recently few studies have reported that the novel albumin/NLR score (ANS), which combines the NLR and albumin level, has shown prognostic value for patients with colorectal cancer and patients after mandibulofacial reconstruction with a fibula flap.13,14 However, to our knowledge, no study has assessed the diagnostic use of the ANS for CAD or subclinical CAD.
Albumin is the most abundant plasma protein, deemed an essential transport protein that binds and transports various pharmaceutical agents and substances. Crucially, it maintains the oncotic (colloid-osmotic) pressure of blood and influences the physiological function of the circulatory system, in addition to its antioxidant, anti-inflammatory, and antithrombotic properties.15 According to several cohort studies and meta-analyses, albumin plays an important role as a robust predictor of risk in patients with CAD.16–18
Nomograms are useful in predicting patients’ probability of clinical events using risk factors and have become a common prognostic tool in clinical practice.19–21 Thus, we developed and validated nomograms based on the ANS to predict the risk of CAD or subclinical CAD. Additionally, we performed a subgroup analysis to verify the reliability of our conclusions.
Materials and Methods
Ethics Statements
The study in accordance with the Declaration of Helsinki and was approved by the Institutional Review Board of the Affiliated Hospital of Chengde Medical University (Number: LL2021036). All participants provided written informed consent.
Study Population
We included 450 inpatients with suspected CAD who underwent coronary computed tomographic angiography (CCTA) at the Affiliated Hospital of Chengde Medical University between September 2015 and June 2017. The inclusion criteria were as follows: patients with myocardial ischemic symptoms and a clinically suspected diagnosis of CAD, and those who underwent CCTA. The CCTA criterion for diagnosing CAD was as follows: at least one branch with stenosis ≥50% in the left main, left anterior descending, left circumflex, or right coronary artery.10,22 The CCTA criteria for diagnosing subclinical CAD were as follows: a coronary artery calcium (CAC) score ≥100 AU and/or at least one branch with stenosis ≥50% in the left main, left anterior descending, left circumflex, or right coronary artery.23–25 The exclusion criteria were as follows: patients with acute coronary syndrome, connective tissue disease, severe valvular heart disease, hypertrophic cardiomyopathy, and constrictive pericarditis.
Clinical Data Collection
Data of patients’ demographic and clinical characteristics were collected during hospitalization by postgraduate students. Age, sex, height, weight, routine blood test results, and biochemical results were recorded. The typical clinical risk factors for CAD, such as diabetes, hypertension, dyslipidemia, and ischemic stroke, were also carefully assessed. Hypertension was defined as a systolic blood pressure ≥140 mmHg (1 mmHg = 0.133 kPa) and/or diastolic blood pressure ≥90 mmHg at rest, or a previous diagnosis of hypertension with antihypertensive therapy.26 Diabetes mellitus was defined according to the American Diabetes Association as follows: (1) glycated hemoglobin value ≥6.5%, (2) fasting plasma glucose level ≥126 mg/dL (7.0 mmol/L), (3) 2-hour plasma glucose level ≥200 mg/dL (11.1 mmol/L) during an oral glucose tolerance test using 75 g of glucose, and/or (4) classic symptoms of hyperglycemia (eg, polyuria, polydipsia, and weight loss) or hyperglycemic crisis with a random plasma glucose level ≥200 mg/dL (11.1 mmol/L). In the absence of unequivocal hyperglycemia, the first three criteria were confirmed by repeating the test.27 Dyslipidemia was defined as a serum total cholesterol level ≥5.18 mmol/L, high-density lipoprotein cholesterol level ≤1.04 mmol/L, low-density lipoprotein cholesterol level ≥3.37 mmol/L, triglyceride level ≥1.7 mmol/L, or a previous diagnosis of dyslipidemia with prescribed medication.28 Ischemic stroke was diagnosed by 2 experienced clinical neurologists from the Department of Neurology based on the recommendations of the World Health Organization. Diagnoses were confirmed by evaluating patients’ clinical symptoms, neurological examination results, and computed tomography and/or magnetic resonance imaging findings.29
The NLR was calculated using the following formula: NLR = neutrophil count (109/L) / lymphocyte count (109/L).12 The ANS was calculated using the following data: the cut-off points for albumin and NLR were 42.15 g/L (area under the curve [AUC] of albumin, 0.662; 95% confidence interval [CI]: 0.606–0.718) and 2.55 (AUC of NLR, 0.650; 95% CI: 0.596–0.704), respectively, as defined by receiver operating characteristic [ROC] curve analysis. For the ANS assessment, patients with serum albumin levels ≥42.15 g/L and NLRs ≤2.55 were assigned a score of 0; patients with either hypoalbuminemia (albumin level, <42.15 g/L) or elevated NLR levels (>2.55) were scored as 1; and those with both hypoalbuminemia (albumin level, <42.15 g/L) and an increase in NLR levels (>2.55) were scored as 2.13,14
CAC Score Measurement
CCTA was performed using a 320-detector row computed tomography scanner (Aquilion ONE; Toshiba Medical Systems, Otawara, Japan). At least 3 contiguous imaging pixels >1 mm2 with a density >130 Hounsfield units (HU) were defined as calcium. The CAC score was the sum of the calcium scores of the 4 main coronary arteries according to the Agatston scoring algorithm.30 The main coronary arteries included the left main, left anterior descending, left circumflex, and right coronary arteries. A weighting factor of 1–4 (1 for 130–199 HU, 2 for 200–299 HU, 3 for 300–399 HU, and 4 for ≥400 HU) was assigned on the basis of computed tomography density; the CAC score is calculated as the lesion’s area multiplied by the weighting factor.25 The patients were categorized into 4 groups based on their CAC scores as follows: absent (CAC score = 0), mild (CAC score = 1–100), moderate (CAC score = 101–400), and severe (CAC score >400).
Statistical Analysis
The Kolmogorov–Smirnov test was used to analyze the continuous variables. Continuous variables are expressed as mean ± standard deviation (normally distributed data), median and quartile spacing [M (25th percentile–75th percentile)] (non-normally distributed data). To compare the relationship of all continuous variables between the CAD and non-CAD groups, continuous variables were analyzed using the Student’s t-test for normally distributed data and Mann–Whitney U-test for non-normally distributed data. Categorical variables are expressed as frequency and percentage and were compared using the chi-square test. Multivariable logistic regression models were constructed to evaluate the association between the ANS and CAD or subclinical CAD in the general population and different subgroups. The odds ratio (OR) was determined based on per 1 score increase in the ANS. In addition, for subgroup analysis, the baseline variables with a p-value <0.3 were selected and entered into the multivariable logistic regression models. Multivariate logistic regression analysis was performed to identify independent risk factors (statistical significance was set at p < 0.05).
A nomogram was established based on the independent predictors using the “rms” package in R. The discriminative ability, predictive accuracy, and clinical usefulness of the model were assessed using a receiver operating characteristic curve, calibration plot, and decision curve analysis (DCA). DCA was performed using the “rmda” R package of R software (version 4.1.3, The R Project for Statistical Computing, Vienna, Austria). A total of 1000 bootstrap resamples were used to reduce the overfitting bias. The “visreg” package of R software was used to visualize the possible interactions.
All statistical analyses were performed using SPSS (version 26.0; IBM Corp., Armonk, BY, USA), GraphPad Prism 8.0 (GraphPad Software Inc., La Jolla, CA) and R software. Statistical significance was set at p < 0.05.
Results
Patient Characteristics
In total, 437 patients with suspected stable angina pectoris who underwent CCTA were included in our study (Figure 1) and assigned to the CAD (n = 316) and non-CAD groups (n = 121). Clinical characteristics of the patients are shown in Table 1. We observed that the CAD group had a higher prevalence of male sex, chest pain, smoking, hypertension, diabetes mellitus, dyslipidemia, ischemic stroke, total cholesterol level ≥5.2 mmol/L, low-density lipoprotein cholesterol level ≥3.38 mmol/L, aortic valve calcification, abnormal wall motion, and ANS of 0 and 2 (all, p < 0.05). The neutrophil count, monocyte count, creatinine, blood urea nitrogen, left atrium, left ventricular end-systolic diameter, left ventricular end-diastolic diameter, CAC score, and NLR were significantly higher in the CAD group than in the non-CAD group (all, p < 0.05). In addition, we also grouped 437 patients into the subclinical CAD (n = 321) and non-CAD groups (n = 116). Clinical characteristics of the patients are shown in Table 2. We observed that the subclinical CAD group had a higher prevalence of male sex, chest pain, smoking, hypertension, diabetes mellitus, dyslipidemia, ischemic stroke, total cholesterol level ≥5.2 mmol/L, aortic valve calcification, abnormal wall motion, and ANS of 0 and 2 (all, p < 0.05). The neutrophil count, creatinine, blood urea nitrogen, left atrium, left ventricular end-systolic diameter, left ventricular end-diastolic diameter, CAC score, and NLR were significantly higher in the subclinical CAD group than in the non-CAD group (all, p < 0.05).
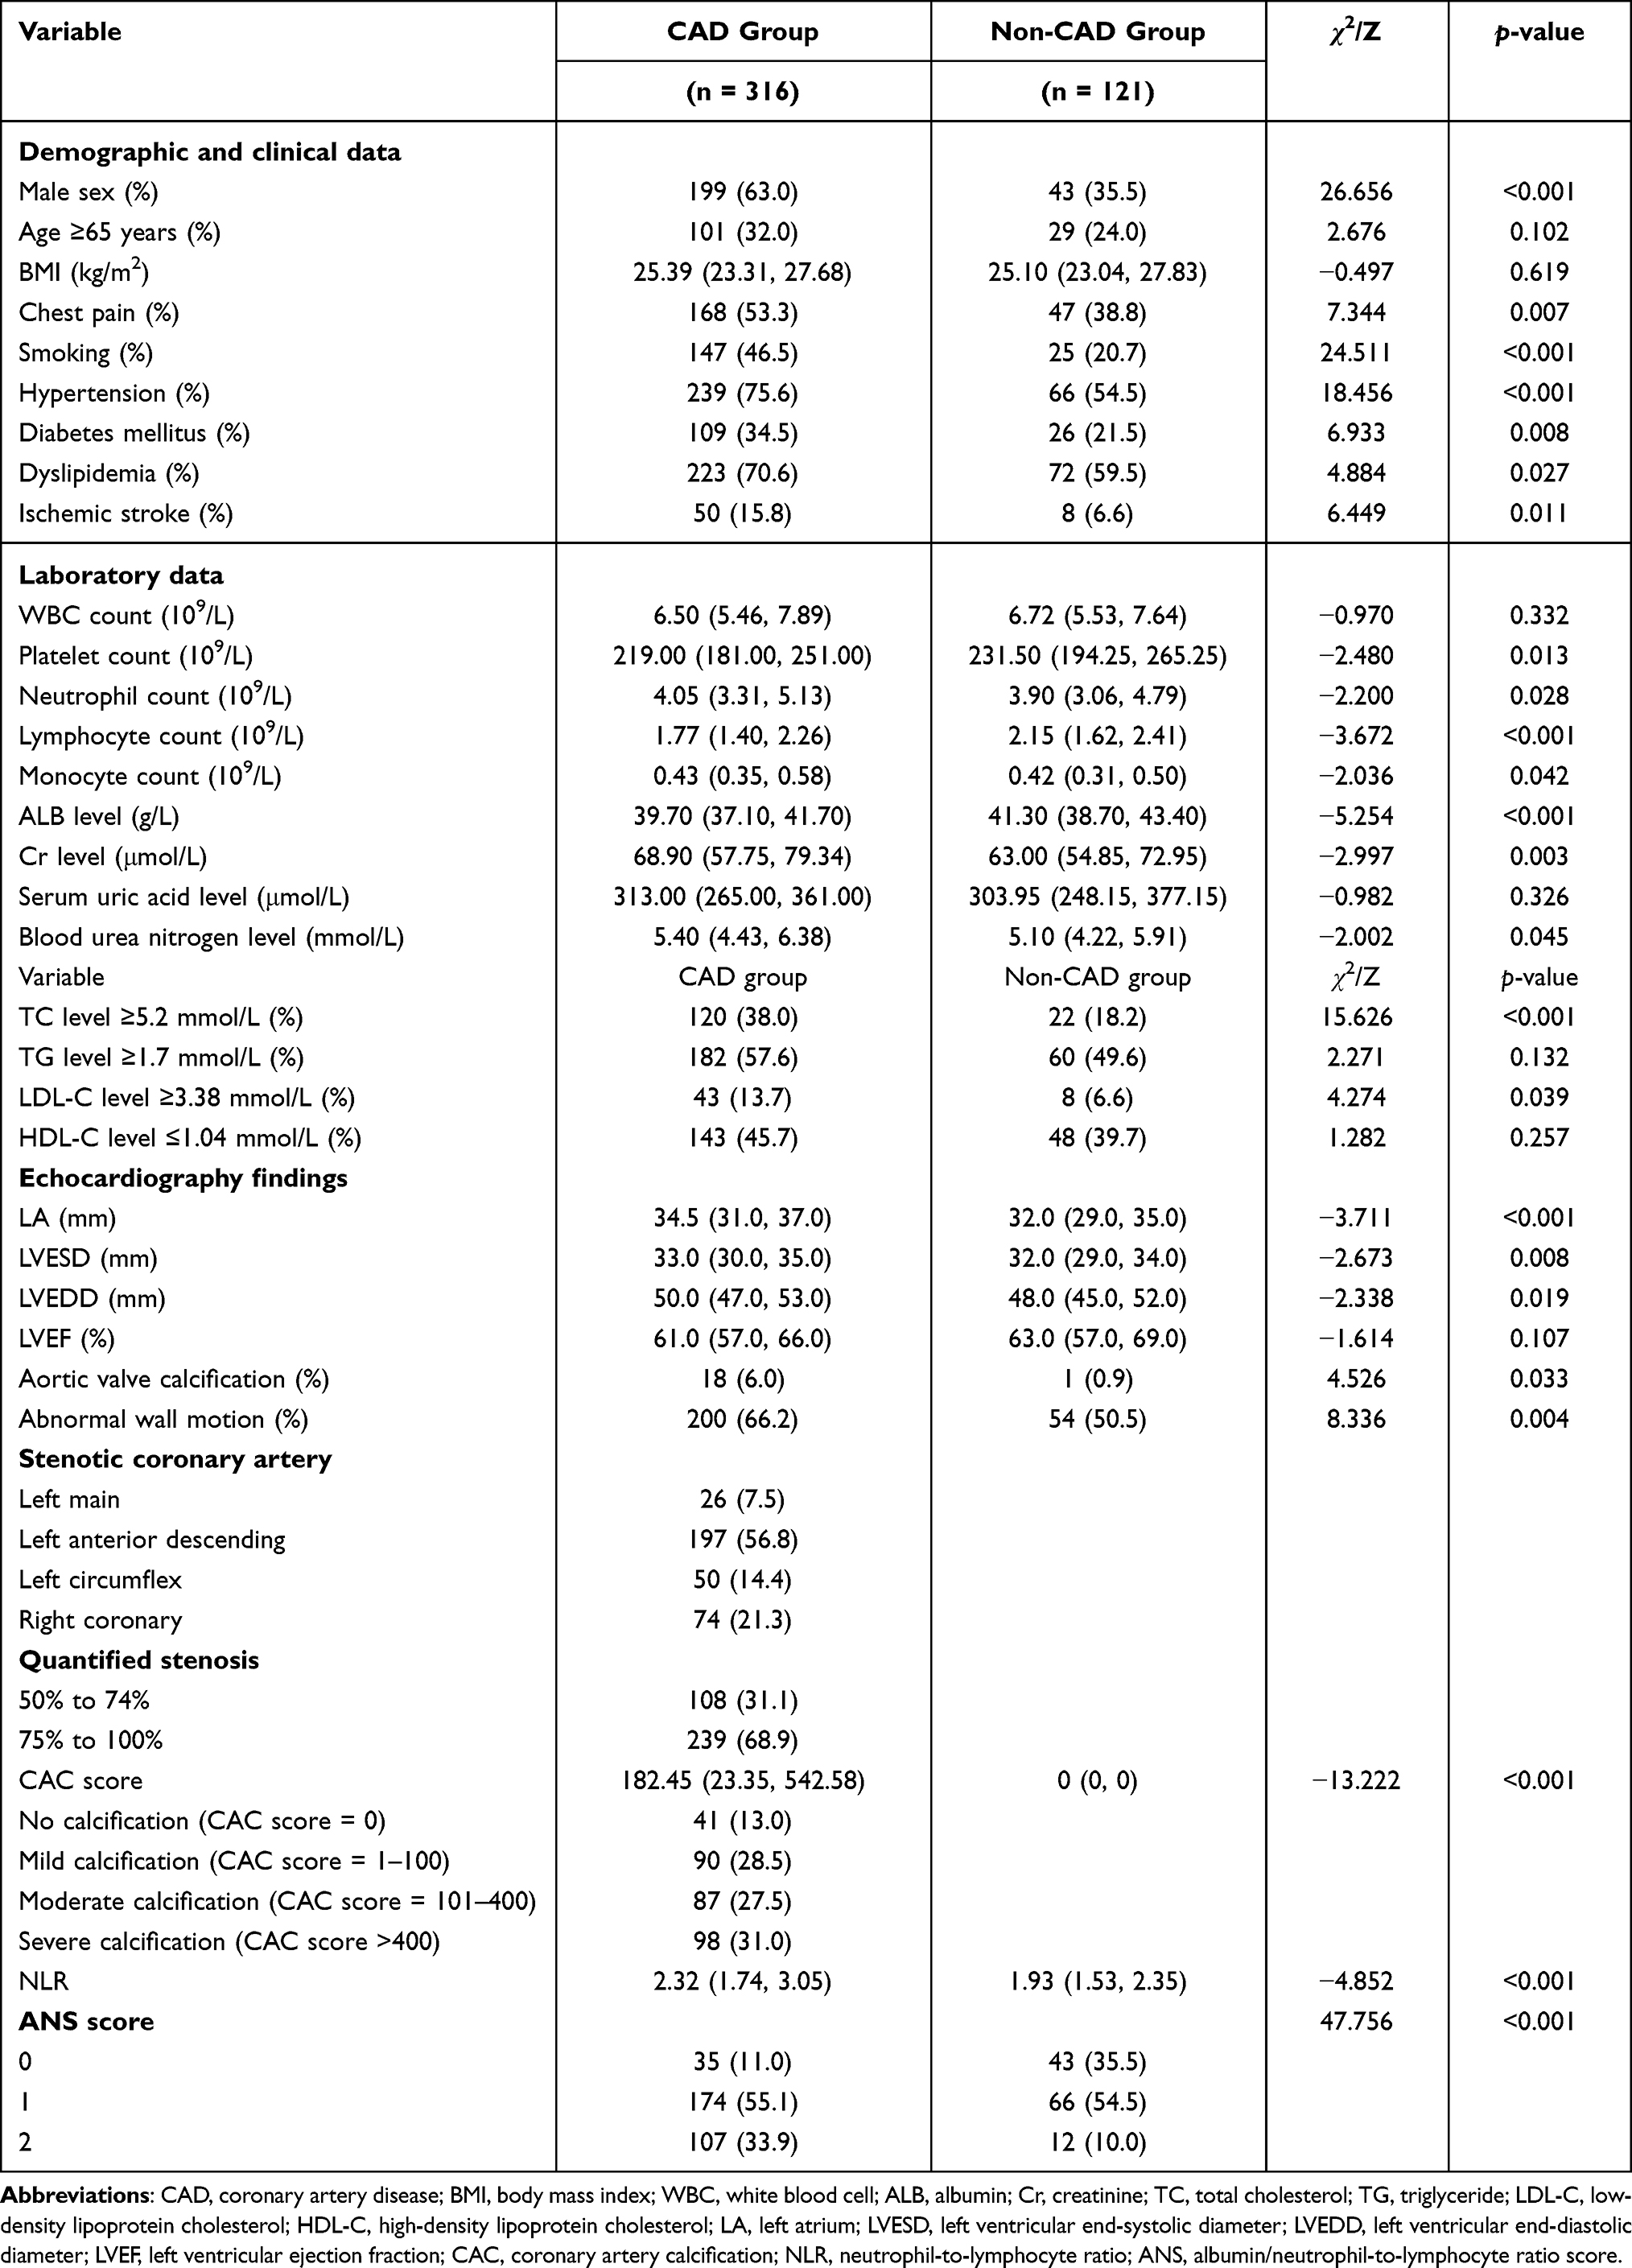 |
Table 1 Baseline Clinical Characteristics of the CAD and Non-CAD Groups |
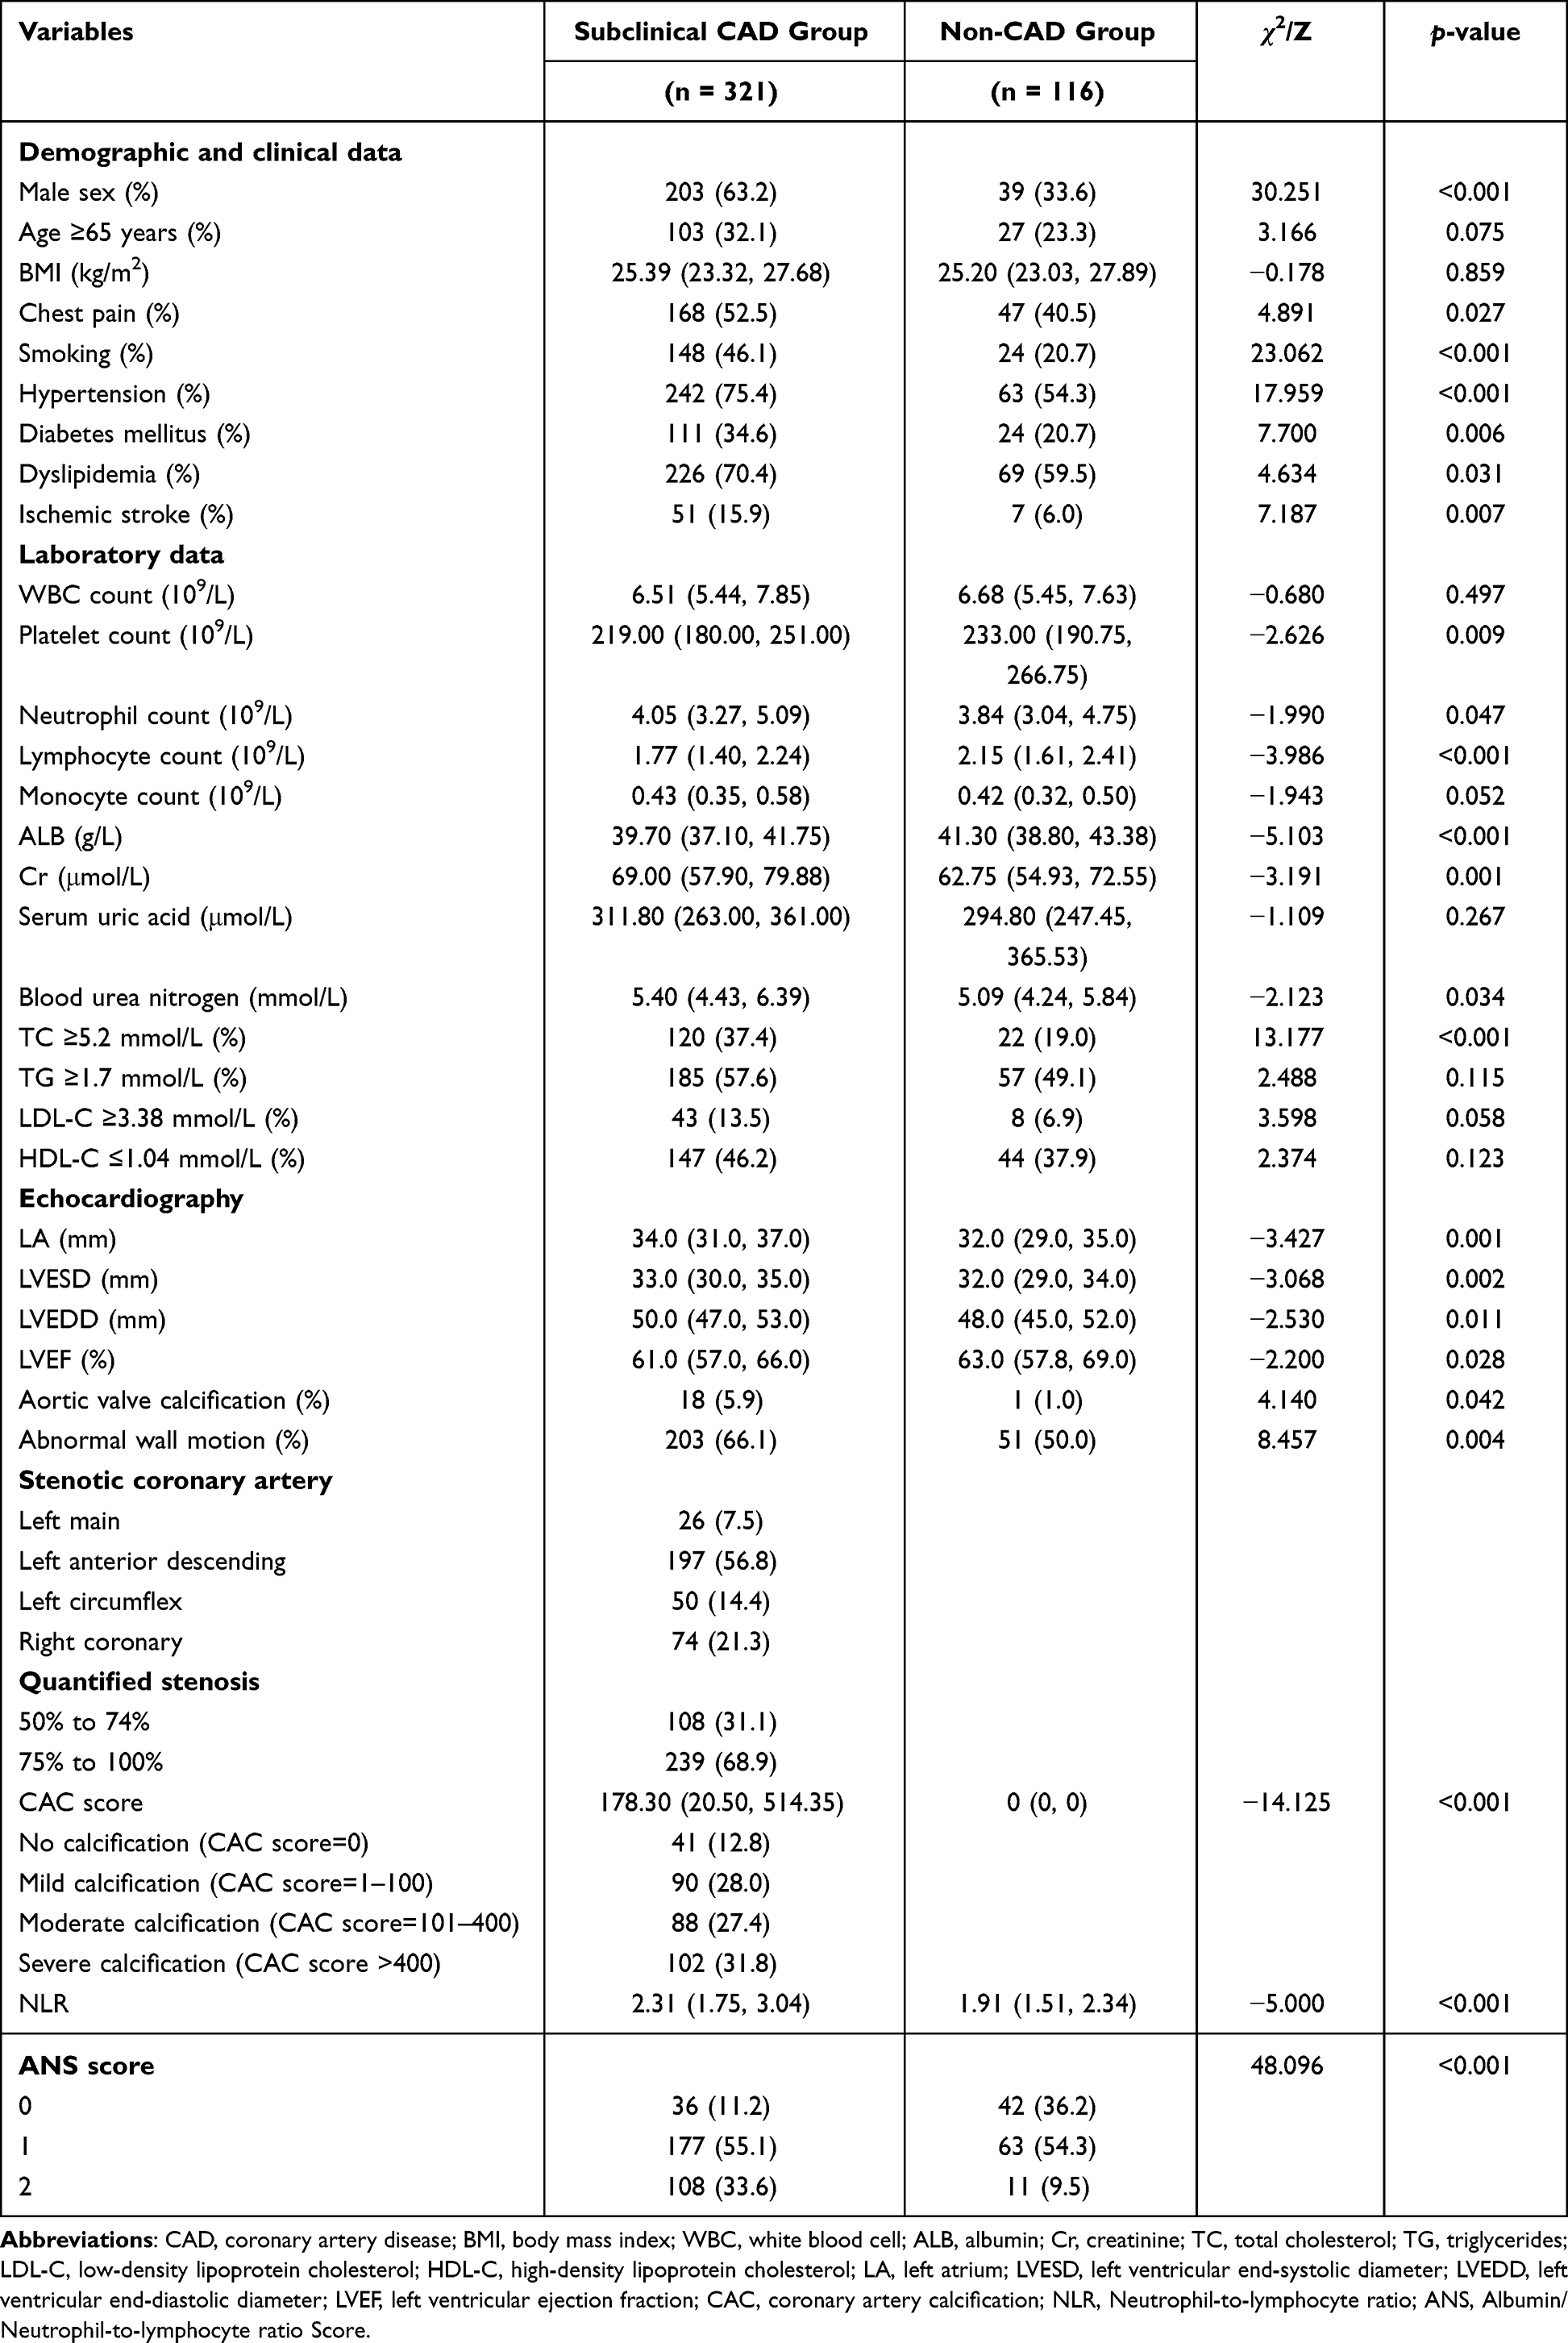 |
Table 2 Baseline Clinical Characteristics of Subclinical CAD and Non-CAD Groups |
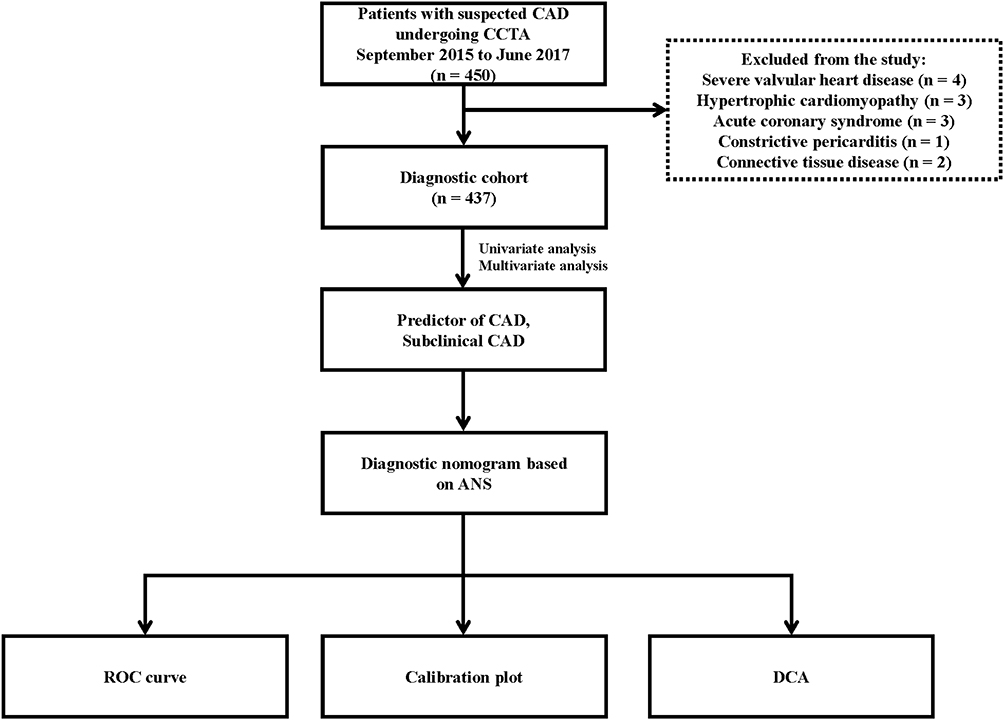 |
Figure 1 Screening flowchart of all patients enrolled in the study. Abbreviations: CAD, coronary artery disease; CCTA, coronary computed tomographic angiography; ANS, albumin/neutrophil-to-lymphocyte ratio score; ROC, receiver operating characteristic; DCA, decision curve analysis. |
Predictor Selection and Nomogram Development
Multivariate analyses were performed using logistic regression models to determine independent predictors for CAD and subclinical CAD; the results of which are presented in Table 3. After adjusting for confounding factors in model 3, we found that the ANS was independently associated with CAD and subclinical CAD. Therefore, we identified male sex, age ≥65 years, smoking, hypertension, diabetes, dyslipidemia, ischemic stroke, and ANS as independent predictors of CAD and subclinical CAD. Models that incorporated these independent predictors were developed and presented as nomograms. For this purpose, each predictor was assigned a point in the graphical interface of the nomogram. There was a total point line at the bottom of the nomogram, and each predictor was summed on a scale from 0 to 100 to give the total points. The total points corresponded to the individual risk of developing CAD and subclinical CAD (Figures 2 and 3).
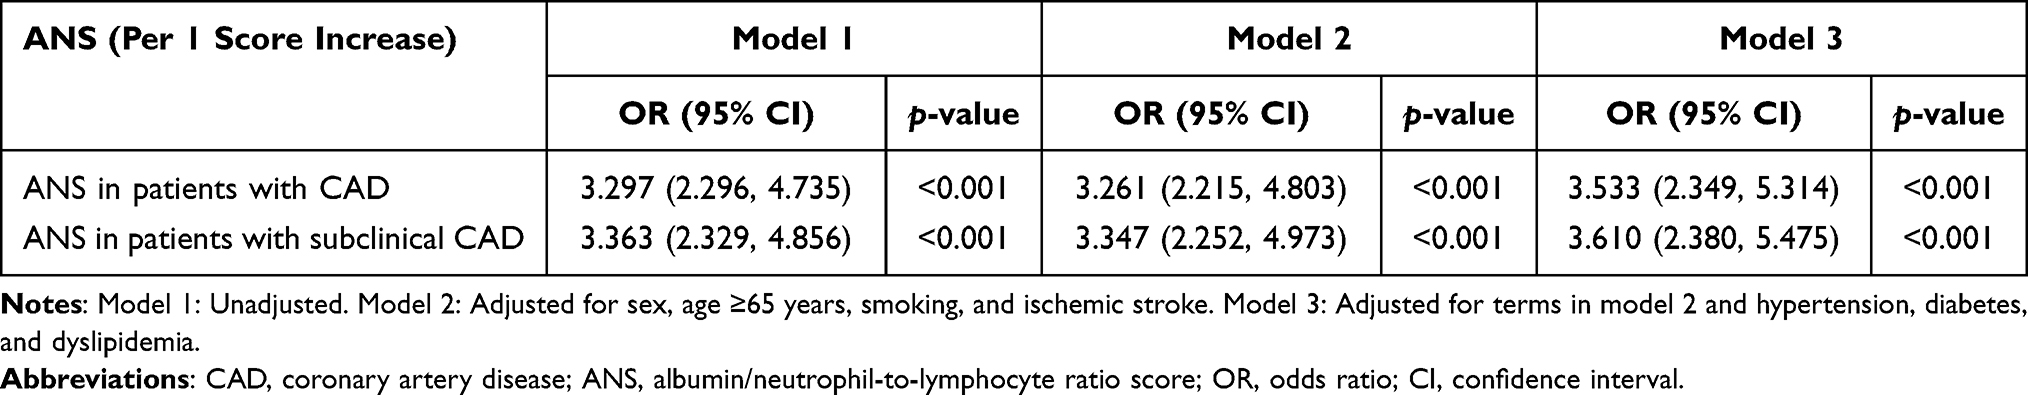 |
Table 3 Logistic Regression Models of the Risks for CAD and Subclinical CAD According to per 1 Score Increase in the ANS |
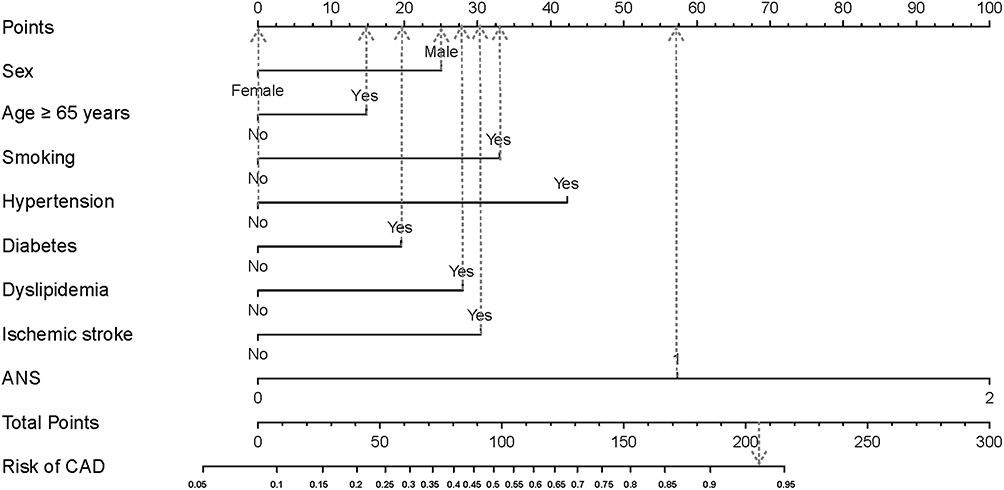 |
Figure 2 Nomogram to estimate the risk of CAD. To estimate the risk of CAD, first identify the value for each axis, and then draw a vertical line upward to the point axis from the axis for each factor. Sum the points for all factors and locate the value on the total point line. Next, draw a vertical line down to the risk of CAD. For example, the factors of male sex (25 points), age ≥65 years (14 points), smoking (33 points), absence of hypertension (0 points), presence of diabetes (19 points), presence of dyslipidemia (28 points), presence of ischemic stroke (31 points), and ANS = 1 (57 points) result in a total of 207 points, which gives an estimated probability of 94% for the occurrence of CAD. Abbreviations: ANS, albumin/neutrophil-to-lymphocyte ratio score; CAD, coronary artery disease. |
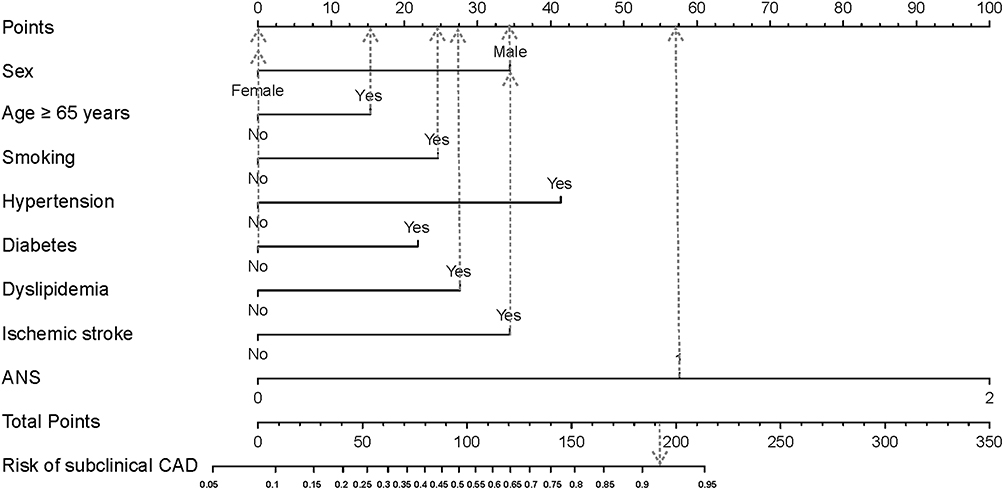 |
Figure 3 Nomogram to estimate the risk of subclinical CAD. To estimate the risk of subclinical CAD, first identify the value for each axis, and then draw a vertical line upward to the point axis from the axis for each factor. Sum the points for all factors and locate the value on the total point line. Next, draw a vertical line down to the risk of subclinical CAD. For example, the factors of male sex (34 points), age ≥65 years (16 points), smoking (24 points), absence of hypertension (0 points), absence of diabetes (0 points), presence of dyslipidemia (27 points), presence of ischemic stroke (34 points), and ANS = 1 (57 points) result in a total of 192 points, which gives an estimated probability of 92% for the occurrence of subclinical CAD. Abbreviations: ANS, albumin/neutrophil-to-lymphocyte ratio score; CAD, coronary artery disease. |
Validation of the Nomograms
For the CAD-predictive nomogram, the AUC was 0.799 (95% CI: 0.752–0.846; Figure 4A). The probabilities predicted by the nomogram matched well with the clinical outcomes (Figure 4B). For the subclinical CAD-predictive nomogram, the AUC for the nomogram was 0.809 (95% CI: 0.762–0.856; Figure 5A), and the calibration curve showed good agreement between the prediction and observation regarding the probability of subclinical CAD (Figure 5B).
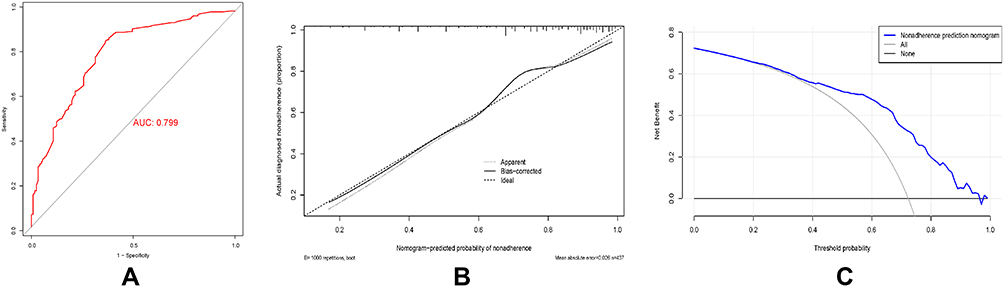 |
Figure 4 Receiver operating characteristic curve (A), calibration curve (B), and decision curve analysis (C) for the CAD nomogram. Abbreviations: AUC, area under the curve; CAD, coronary artery disease. |
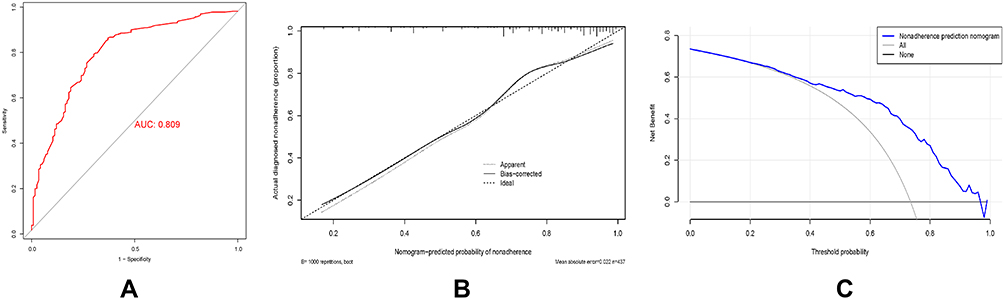 |
Figure 5 Receiver operating characteristic curve (A), calibration curve (B), and decision curve analysis (C) for the subclinical CAD nomogram. Abbreviations: AUC, area under the curve; CAD, coronary artery disease. |
Clinical Benefit Evaluation
To evaluate the improvement of the nomograms in decision-making, DCA was performed for each model. The threshold probability was defined as the probability at which the expected benefit of treatment was deemed to be equal to the expected benefit of avoiding treatment. The decision for treatment was made if the predictive probability was above the threshold probability, whereas a predictive probability under the threshold resulted in a decision to avoid treatment. When the threshold probability was approximately 23–97%, the benefit of using the CAD-predictive nomogram was beyond both the thin gray line (treat-all scheme) and thick gray line (treat-none scheme) (Figure 4C). Furthermore, the threshold probability could be set between 22% and approximately 98% when the benefit of using the subclinical CAD-predictive nomogram was greater than either the treat-all or treat-none scheme (Figure 5C).
Reliability of the ANS in Different Subgroups
The independent association between the ANS and CAD was assessed in various subgroups according to sex (male or female), age (≥65 or <65 years), smoking status (with or without), ischemic stroke status (with or without), hypertension status (with or without), diabetes mellitus status (with or without), and dyslipidemia status (with or without). There was no effect modification by sex, age, and smoking, ischemic stroke, hypertension, diabetes mellitus, and dyslipidemia statuses (all, p for interaction >0.05). Moreover, the prediction of the ANS on subclinical CAD was not modified by sex, age ≥65 years, and smoking, ischemic stroke, hypertension, diabetes mellitus, and dyslipidemia statuses (all, p for interaction >0.05). The specific subgroup analysis results are illustrated in Figures 6A and B, Figure 7A–G and Figure 8A–G. Figure 7A–G shows visualization of the interaction between ANS and CAD subgroup analysis. Figure 8A–G shows visualization of the interaction between ANS and subclinical CAD subgroup analysis.
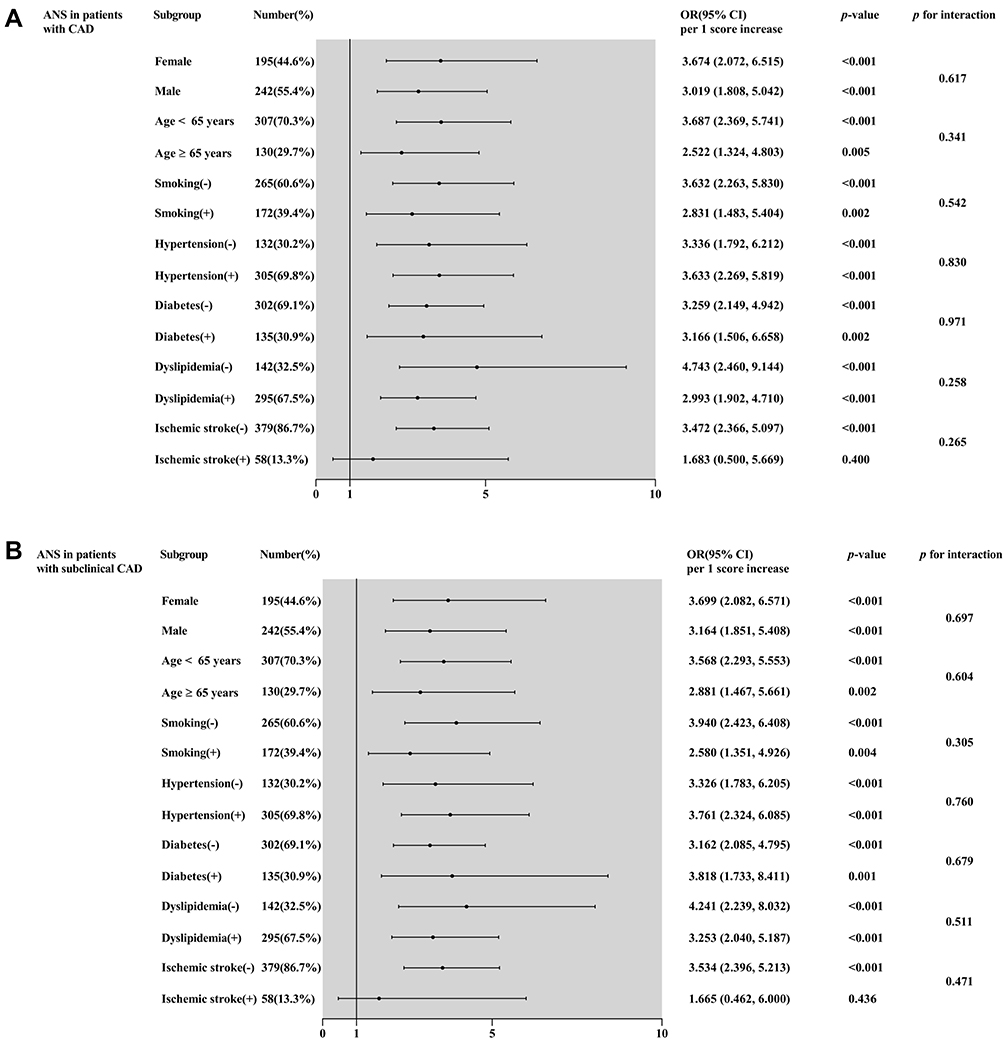 |
Figure 6 Forest graphs based on subgroup analysis for evaluating the prognostic implication of the ANS in various stratifications, including sex, age, smoking, hypertension, diabetes, dyslipidemia, and ischemic stroke. The OR was evaluated based on per 1 score increase in the ANS. (A) Subgroup analysis of the ANS in patients with CAD, (B) subgroup analysis of the ANS in patients with subclinical CAD. Abbreviations: ANS, albumin/neutrophil-to-lymphocyte ratio score; CAD, coronary artery disease; OR, odds ratio; CI, confidence interval. |
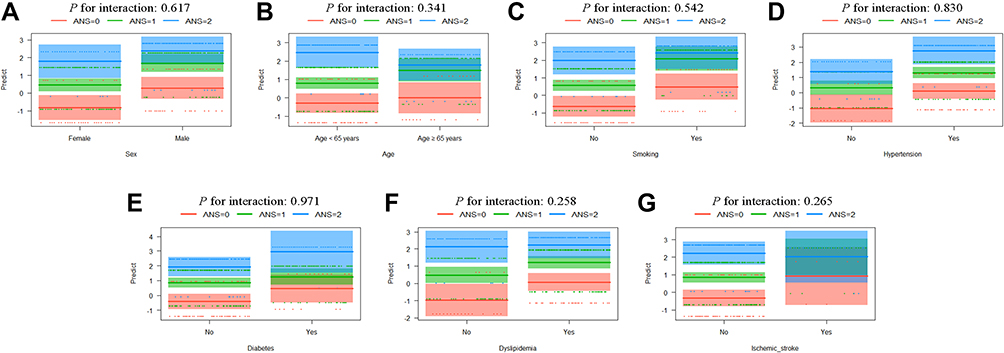 |
Figure 7 Visualization analysis of the interaction between the ANS in patients with CAD and sex (A), age (B), smoking (C), hypertension (D), diabetes (E), dyslipidemia (F), and ischemic stroke (G). Abbreviations: ANS, albumin/neutrophil-to-lymphocyte ratio score; CAD, coronary artery disease. |
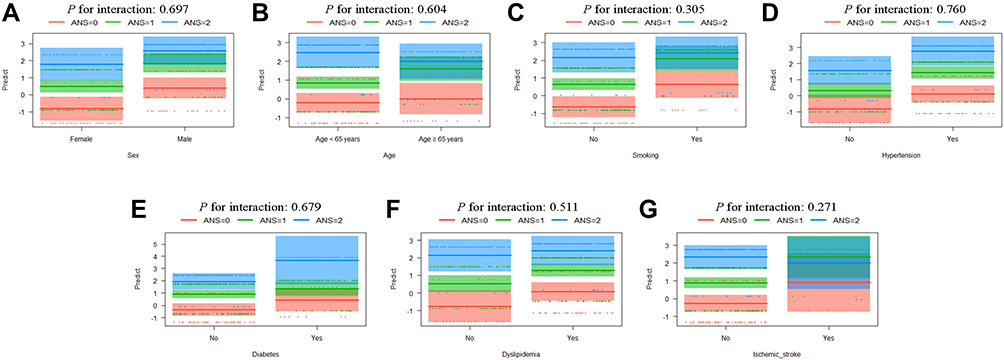 |
Figure 8 Visualization analysis of the interaction between the ANS in patients with subclinical CAD and sex (A), age (B), smoking (C), hypertension (D), diabetes (E), dyslipidemia (F), and ischemic stroke (G). Abbreviations: ANS, albumin/neutrophil-to-lymphocyte ratio score; CAD, coronary artery disease. |
Discussion
In the present study, multivariate logistic regression analysis revealed that the ANS was an independent risk factor for CAD and subclinical CAD. Moreover, our analyses suggested that male sex, age ≥65 years, smoking, hypertension, diabetes, dyslipidemia, ischemic stroke, and ANS were independent predictors of CAD or subclinical CAD. Therefore, we developed and validated diagnostic nomograms incorporating the ANS and other clinical risk factors to predict CAD and subclinical CAD. The AUC values for the nomograms based on these predictors were 0.799 for the CAD nomogram and 0.809 for the subclinical CAD nomogram, each of which exhibited a good diagnostic value (AUC = 0.7). The calibration curve and DCA also indicated good diagnostic performance of the nomograms. Additionally, the association between the ANS and CAD or subclinical CAD was not significantly affected by sex, age ≥65 years, smoking, ischemic stroke, hypertension, diabetes mellitus, and dyslipidemia. To our best knowledge, this is the first clinical diagnostic model to incorporate the ANS to identify the risk of CAD or subclinical CAD. For patients with CAD and subclinical CAD, this nomogram can help clinicians identify high-risk patients early and give proper treatment.
Coronary artery calcification is a well-recognized feature of coronary atherosclerotic disease and is commonly used as a risk-marker for cardiovascular risk prediction.31 Previous studies have shown that CCTA can not only document the presence of coronary atherosclerosis, but it can also provide comprehensive information on CAD, including the location, severity, and plaque characteristics.32–34 Therefore, we can screen for CAD or subclinical CAD according to CAC score guidelines.6,35 In our current study, 87% of patients with CAD had varying degrees of coronary artery calcification (Table 1). Likewise, 87.2% of patients with subclinical CAD had varying degrees of coronary artery calcification (Table 2).
Inflammation has been linked to atherosclerosis and its complications in various experimental investigations.36–38 Previous studies have shown that white blood cell counts are associated with CAD and an increased risk of ischemic disease.12,39 Neutrophils have been shown to play an important role in mediating the inflammatory response.40 Additionally, lymphocytes play an important role in the regulation of the inflammatory response and stages of the atherosclerotic process.41 Cho et al suggested that the NLR can be used for risk stratification in patients with ST-elevation myocardial infarction undergoing primary percutaneous coronary intervention. Moreover, the NLR may be an independent risk factor in CAD.42 Presumably, the mechanism is that neutrophils release inflammatory mediators and cytokines after myocardial damage caused by acute myocardial infarction. They cause a change in the ratio of neutrophils to lymphocytes.9 Notably, we found a statistically significant difference in the NLR between the CAD and non-CAD groups (Table 1). There was also a statistically significant difference in NLR between subclinical CAD and non-CAD groups (Table 2).
Most of the existing evidence suggest that serum albumin reflects the severity of inflammation and illness in acute disease.43–45 Serum albumin can play anti-inflammatory and immunomodulatory roles, and reduced albumin synthesis caused by inflammation may have consequences for immune defense. Albumin levels are also influenced by nutritional status. Thus, inflammation and malnutrition both reduce the albumin concentration by reducing its synthesis rate. Additionally, low serum albumin levels appear to be associated with increased CAD risk.44,46 Plakht et al claimed that low albumin levels on admission were associated with increased all-cause mortality in a follow-up study of patients with acute myocardial infarction.47 In our study, we found a statistically significant difference in albumin between the CAD and non-CAD groups (Table 1). We also found a statistically significant difference in albumin between subclinical CAD and non-CAD groups (Table 2).
The novel inflammation-related marker ANS was first evaluated as a powerful prognostic index for oral cavity squamous cell carcinoma.48 The ANS combines albumin and the NLR; thus, it is clear that the ANS incorporates the factors that play pivotal roles in patients’ immune and systemic inflammation status. The ANS has been reported to be associated with patients with colorectal cancer and patients after mandibulofacial reconstruction with a fibula flap.13,14 Fang et al reported that the ANS was a more powerful prognostic factor of overall survival than modified Glasgow Prognostic Score (mGPS) and systemic inflammation score (SIS) in colorectal cancer patients with radical resection.13 The ANS was defined as follows: the cut-off points for albumin and NLR values were 39.75 and 2.39, respectively, which were derived using ROC analysis. For the ANS assessment, patients with serum albumin levels ≥39.75 g/L and NLR <2.39 were assigned a score of 0; patients with either hypoalbuminemia (albumin level <39.75 g/L) or elevated NLR levels (≥2.39) were scored as 1; and those with both hypoalbuminemia (albumin level <39.75 g/L) and an increase in NLR levels (≥2.39) were scored as 2. With each additional point of the ANS, the OR of overall survival after full adjustment was 2.112 (OR = 2.112; 95% CI: 1.314–3.395).13 In the same way, Zhongqi et al demonstrated that the ANS as an independent risk factor for postoperative complications after mandibulofacial defect reconstruction with a fibula free flap. The ANS was calculated as follows: the cut-off points for albumin and NLR values were 37.150 g/L and 2.723, respectively, according to ROC analysis results. Values below the cut-off value for albumin and over the cut-off value for the NLR were given 1 point each, providing a possible ANS ranging from 0 to 2.14 In addition, Zhongqi et al found that a prognostic nomogram incorporating the ANS and other clinical risk factors demonstrated the pivotal role of systemic inflammation in predicting complications.14 These findings are consistent with our results. Our study reported that the ANS is a good indicator of systemic inflammation. Multivariate logistic regression analysis showed that the OR of the ANS in patients with CAD per 1 score increase was 3.533 (95% CI: 2.349, 5.314), and the OR of the ANS in patients with subclinical CAD per 1 score increase was 3.610 (95% CI: 2.380, 5.475) (model 3, Table 3). Thus, we demonstrated that a higher ANS was significantly associated with an increased risk of CAD or subclinical CAD morbidity. The independent association of circulating biomarkers of inflammation with the risk of future cardiovascular events has been previously demonstrated in clinical studies, such as C-reactive protein (CRP), interleukin-6 (IL-6), and so on.49 However, the ANS is easy to calculate in clinical practice, suggesting that it may be a more useful clinical predictor of CAD and subclinical CAD.
Limitations
This study has some limitations. First, our data were from a single center, and selection bias may have occurred. Thus, the findings should be interpreted with caution, and further validation is needed in a prospective multicenter study. Second, although our nomogram was validated using bootstraps with 1000 resamples, further prospective multicenter studies should be performed to externally validate our nomogram. Third, our sample size was relatively small and the adjustment of risk factors may be relatively limited.
Conclusion
Here, we constructed and validated relatively accurate clinical nomograms incorporating the ANS that demonstrated adequate discrimination and calibration to provide an individualized estimation of the risk for CAD and subclinical CAD.
Acknowledgments
The authors are grateful for the assistance of doctors and nurses of the cardiology research team at the Affiliated Hospital of Chengde Medical University.
Funding
This work was supported by Natural Science Foundation of Hebei Province (Grant numbers H2021406071) to Dr. Lixian Sun.
Disclosure
The authors declare that there is no conflicts of interest.
References
1. Tsao CW, Aday AW, Almarzooq ZI, et al. Heart disease and stroke statistics—2022 update: a report from the American Heart Association. Circulation. 2022;145(8):e153–e639. doi:10.1161/CIR.0000000000001052
2. Vos T, Lim SS, Abbafati C, et al. Global burden of 369 diseases and injuries in 204 countries and territories, 1990–2019: a systematic analysis for the Global Burden of Disease Study 2019. Lancet. 2020;396(10258):1204–1222.
3. Libby P, Buring JE, Badimon L, et al. Atherosclerosis. Nat Rev Dis Primers. 2019;5(1):56. doi:10.1038/s41572-019-0106-z
4. Al Rifai M, Blaha MJ, Nambi V, et al. Determinants of incident atherosclerotic cardiovascular disease events among those with absent coronary artery calcium: multi-ethnic study of atherosclerosis. Circulation. 2022;145(4):259–267. doi:10.1161/CIRCULATIONAHA.121.056705
5. Cao D, Chandiramani R, Capodanno D, et al. Non-cardiac surgery in patients with coronary artery disease: risk evaluation and periprocedural management. Nat Rev Cardiol. 2021;18(1):37–57. doi:10.1038/s41569-020-0410-z
6. Zimarino M, Prati F, Marano R, et al. The value of imaging in subclinical coronary artery disease. Vascul Pharmacol. 2016;82:20–29. doi:10.1016/j.vph.2016.02.001
7. Si Y, Fan W, Han C, et al. Atherogenic index of plasma, triglyceride-glucose index and monocyte-to-lymphocyte ratio for predicting subclinical coronary artery disease. Am J Med Sci. 2021;362(3):285–290. doi:10.1016/j.amjms.2021.05.001
8. Park G-M, Cho Y-R, Won K-B, et al. Triglyceride glucose index is a useful marker for predicting subclinical coronary artery disease in the absence of traditional risk factors. Lipids Health Dis. 2020;19(1):7. doi:10.1186/s12944-020-1187-0
9. Guclu K, Celik M. Prognostic value of inflammation parameters in patients with non-ST elevation acute coronary syndromes. Angiology. 2020;71(9):825–830. doi:10.1177/0003319720936500
10. Fan W, Zhang Y, Liu Y, et al. Nomograms based on the advanced lung cancer inflammation index for the prediction of coronary artery disease and calcification. Clin Appl Thromb Hemost. 2021;27:107602962110604. doi:10.1177/10760296211060455
11. Serrano CV, de Mattos FR, Pitta FG, et al. Association between neutrophil-lymphocyte and platelet-lymphocyte ratios and coronary artery calcification score among asymptomatic patients: data from a cross-sectional study. Mediators Inflamm. 2019;2019:1–8. doi:10.1155/2019/6513847
12. Adamstein NH, MacFadyen JG, Rose LM, et al. The neutrophil–lymphocyte ratio and incident atherosclerotic events: analyses from five contemporary randomized trials. Eur Heart J. 2021;42(9):896–903. doi:10.1093/eurheartj/ehaa1034
13. Wang F, He W, Jiang C, et al. Prognostic value of inflammation-based scores in patients receiving radical resection for colorectal cancer. BMC Cancer. 2018;18(1):1102. doi:10.1186/s12885-018-4842-3
14. Liu Z, Wu H, Liufu N, et al. Development and validation of a nomogram incorporating selected systemic inflammation-based prognostic marker for complication prediction after vascularized fibula flap reconstruction. Oral Oncol. 2019;99:104467. doi:10.1016/j.oraloncology.2019.104467
15. Manolis AA, Manolis TA, Melita H, et al. Low serum albumin: a neglected predictor in patients with cardiovascular disease. Eur J Intern Med. 2022;102:24–39. doi:10.1016/j.ejim.2022.05.004
16. Hirata T, Arai Y, Yuasa S, et al. Associations of cardiovascular biomarkers and plasma albumin with exceptional survival to the highest ages. Nat Comm. 2020;11(1):3820. doi:10.1038/s41467-020-17636-0
17. El Iskandarani M, El Kurdi B, Murtaza G, et al. Prognostic role of albumin level in heart failure: a systematic review and meta-analysis. Medicine. 2021;100(10):e24785. doi:10.1097/MD.0000000000024785
18. Seidu S, Kunutsor SK, Khunti K. Serum albumin, cardiometabolic and other adverse outcomes: systematic review and meta-analyses of 48 published observational cohort studies involving 1,492,237 participants. Scand Cardiovasc J. 2020;54(5):280–293. doi:10.1080/14017431.2020.1762918
19. Yang Y, Yi X, Cai Y, et al. Immune-associated gene signatures and subtypes to predict the progression of atherosclerotic plaques based on machine learning. Front Pharmacol. 2022;13:865624. doi:10.3389/fphar.2022.865624
20. Bo X, Liu Y, Yang M, et al. Development and validation of a nomogram of in-hospital major adverse cardiovascular and cerebrovascular events in patients with acute coronary syndrome. Front Cardiovasc Med. 2021;8:699023. doi:10.3389/fcvm.2021.699023
21. Wang D, Chen X, Wu J, et al. Development and validation of nomogram models for postoperative pneumonia in adult patients undergoing elective cardiac surgery. Front Cardiovasc Med. 2021;8:750828. doi:10.3389/fcvm.2021.750828
22. Knuuti J. 2019 ESC guidelines for the diagnosis and management of chronic coronary syndromes The Task Force for the diagnosis and management of chronic coronary syndromes of the European Society of Cardiology (ESC). Russ J Cardiol. 2020;25(2):119–180. doi:10.15829/1560-4071-2020-2-3757
23. Meeuwsen JAL, de Vries J, Zoet GA, et al. Circulating neutrophils do not predict subclinical coronary artery disease in women with former preeclampsia. Cells. 2020;9(2):468. doi:10.3390/cells9020468
24. Nasir K, Cainzos-Achirica M. Role of coronary artery calcium score in the primary prevention of cardiovascular disease. BMJ. 2021;n776. doi:10.1136/bmj.n776
25. Cheong BYC, Wilson JM, Spann SJ, et al. Coronary artery calcium scoring: an evidence‐based guide for primary care physicians. J Intern Med. 2021;289(3):309–324. doi:10.1111/joim.13176
26. Unger T, Borghi C, Charchar F, et al. 2020 International Society of Hypertension Global Hypertension practice guidelines. Hypertension. 2020;75(6):1334–1357. doi:10.1161/HYPERTENSIONAHA.120.15026
27. Colberg SR, Sigal RJ, Fernhall B, et al. Exercise and type 2 diabetes. Diabetes Care. 2010;33(12):e147–e167. doi:10.2337/dc10-9990
28. Mach F, Baigent C, Catapano AL, et al. 2019 ESC/EAS guidelines for the management of dyslipidaemias: lipid modification to reduce cardiovascular risk. Eur Heart J. 2020;41(1):111–188. doi:10.1093/eurheartj/ehz455
29. Xing L, Jing L, Tian Y, et al. High prevalence of stroke and uncontrolled associated risk factors are major public health challenges in rural northeast China: a population-based study. Int J Stroke. 2020;15(4):399–411. doi:10.1177/1747493019851280
30. Van Velzen SGM, Lessmann N, Velthuis BK, et al. Deep learning for automatic calcium scoring in CT: validation using multiple cardiac CT and chest CT protocols. Radiology. 2020;295(1):66–79. doi:10.1148/radiol.2020191621
31. Jinnouchi H, Sato Y, Sakamoto A, et al. Calcium deposition within coronary atherosclerotic lesion: implications for plaque stability. Atherosclerosis. 2020;306:85–95. doi:10.1016/j.atherosclerosis.2020.05.017
32. Greenland P, Blaha MJ, Budoff MJ, et al. Coronary calcium score and cardiovascular risk. J Am Coll Cardiol. 2018;72(4):434–447. doi:10.1016/j.jacc.2018.05.027
33. Budoff MJ, Li D, Kazerooni EA, et al. Diagnostic accuracy of noninvasive 64-row Computed Tomographic Coronary Angiography (CCTA) compared with Myocardial Perfusion Imaging (MPI). Acad Radiol. 2017;24(1):22–29. doi:10.1016/j.acra.2016.09.008
34. Williams MC, Massera D, Moss AJ, et al. Prevalence and clinical implications of valvular calcification on coronary computed tomography angiography. Eur Heart J Cardiovasc Imaging. 2021;22(3):262–270. doi:10.1093/ehjci/jeaa263
35. Bergström G, Persson M, Adiels M, et al. Prevalence of subclinical coronary artery atherosclerosis in the general population. Circulation. 2021;144(12):916–929. doi:10.1161/CIRCULATIONAHA.121.055340
36. Libby P. Inflammation in atherosclerosis—no longer a theory. Clin Chem. 2021;67(1):131–142. doi:10.1093/clinchem/hvaa275
37. Montarello NJ, Nguyen MT, Wong DTL, et al. Inflammation in coronary atherosclerosis and its therapeutic implications. Cardiovasc Drugs Ther. 2022;36(2):347–362. doi:10.1007/s10557-020-07106-6
38. Libby P. Inflammation during the life cycle of the atherosclerotic plaque. Cardiovasc Res. 2021;cvab303. doi:10.1093/cvr/cvab303
39. Ferro D, Matias M, Neto J, et al. Neutrophil-to-lymphocyte ratio predicts cerebral edema and clinical worsening early after reperfusion therapy in stroke. Stroke. 2021;52(3):859–867. doi:10.1161/STROKEAHA.120.032130
40. Kolaczkowska E, Kubes P. Neutrophil recruitment and function in health and inflammation. Nat Rev Immunol. 2013;13(3):159–175. doi:10.1038/nri3399
41. Nunez J, Minana G, Bodi V, et al. Low lymphocyte count and cardiovascular diseases. Curr Med Chem. 2011;18(21):3226–3233. doi:10.2174/092986711796391633
42. Cho KH, Jeong MH, Ahmed K, et al. Value of early risk stratification using hemoglobin level and neutrophil-to-lymphocyte ratio in patients with ST-elevation myocardial infarction undergoing primary percutaneous coronary intervention. Am J Cardiol. 2011;107(6):849–856. doi:10.1016/j.amjcard.2010.10.067
43. Arroyo V, García-Martinez R, Salvatella X. Human serum albumin, systemic inflammation, and cirrhosis. J Hepatol. 2014;61(2):396–407. doi:10.1016/j.jhep.2014.04.012
44. Eckart A, Struja T, Kutz A, et al. Relationship of nutritional status, inflammation, and serum albumin levels during acute illness: a prospective study. Am J Med. 2020;133(6):713–722.e7. doi:10.1016/j.amjmed.2019.10.031
45. Sheinenzon A, Shehadeh M, Michelis R, et al. Serum albumin levels and inflammation. Int J Biol Macromol. 2021;184:857–862. doi:10.1016/j.ijbiomac.2021.06.140
46. Xiu W-J, Yang H-T, Zheng -Y-Y, et al. ALB-dNLR score predicts mortality in coronary artery disease patients after percutaneous coronary intervention. Front Cardiovasc Med. 2022;9:709868. doi:10.3389/fcvm.2022.709868
47. Plakht Y, Gilutz H, Shiyovich A. Decreased admission serum albumin level is an independent predictor of long-term mortality in hospital survivors of acute myocardial infarction. Soroka Acute Myocardial Infarction II (SAMI-II) project. Int J Cardiol. 2016;219:20–24. doi:10.1016/j.ijcard.2016.05.067
48. Kao H-K, Löfstrand J, Loh C-Y-Y, et al. Nomogram based on albumin and neutrophil-to-lymphocyte ratio for predicting the prognosis of patients with oral cavity squamous cell carcinoma. Sci Rep. 2018;8(1):13081. doi:10.1038/s41598-018-31498-z
49. Antonopoulos AS, Angelopoulos A, Papanikolaou P, et al. Biomarkers of vascular inflammation for cardiovascular risk prognostication: a meta-analysis. JACC Cardiovasc Imaging. 2022;15(3):460–471. doi:10.1016/j.jcmg.2021.09.014
 © 2023 The Author(s). This work is published and licensed by Dove Medical Press Limited. The
full terms of this license are available at https://www.dovepress.com/terms
and incorporate the Creative Commons Attribution
- Non Commercial (unported, 3.0) License.
By accessing the work you hereby accept the Terms. Non-commercial uses of the work are permitted
without any further permission from Dove Medical Press Limited, provided the work is properly
attributed. For permission for commercial use of this work, please see paragraphs 4.2 and 5 of our Terms.
© 2023 The Author(s). This work is published and licensed by Dove Medical Press Limited. The
full terms of this license are available at https://www.dovepress.com/terms
and incorporate the Creative Commons Attribution
- Non Commercial (unported, 3.0) License.
By accessing the work you hereby accept the Terms. Non-commercial uses of the work are permitted
without any further permission from Dove Medical Press Limited, provided the work is properly
attributed. For permission for commercial use of this work, please see paragraphs 4.2 and 5 of our Terms.
Recommended articles
Identification of Immune-Related Genes as Biomarkers for Uremia

Lyu D, He G, Zhou K, Xu J, Zeng H, Li T, Tang N
International Journal of General Medicine 2023, 16:5633-5649
Published Date: 29 November 2023
Development and Validation of a Novel Predictive Model for the Early Differentiation of Cardiac and Non-Cardiac Syncope
Wu S, Chen Z, Gao Y, Shu S, Chen F, Wu Y, Dai Y, Zhang S, Chen K
International Journal of General Medicine 2024, 17:841-853
Published Date: 6 March 2024
Identification of Hub Genes and Immune Infiltration in Coronary Artery Disease: A Risk Prediction Model
Xie W, Liao W, Lin H, He G, Li Z, Li L
Journal of Inflammation Research 2024, 17:8625-8646
Published Date: 11 November 2024