Back to Journals » International Journal of General Medicine » Volume 17
Development and Validation of a Novel Predictive Model for the Early Differentiation of Cardiac and Non-Cardiac Syncope
Authors Wu S, Chen Z, Gao Y, Shu S, Chen F, Wu Y ![]() , Dai Y, Zhang S
, Dai Y, Zhang S ![]() , Chen K
, Chen K
Received 12 December 2023
Accepted for publication 26 February 2024
Published 6 March 2024 Volume 2024:17 Pages 841—853
DOI https://doi.org/10.2147/IJGM.S454521
Checked for plagiarism Yes
Review by Single anonymous peer review
Peer reviewer comments 2
Editor who approved publication: Dr Vinay Kumar
Sijin Wu,1 Zhongli Chen,1 Yuan Gao,1 Songren Shu,2 Feng Chen,1 Ying Wu,1 Yan Dai,1 Shu Zhang,1 Keping Chen1
1Arrhythmia Center, Fuwai Hospital, National Center for Cardiovascular Diseases, Chinese Academy of Medical Sciences & Peking Union Medical College, Beijing, People’s Republic of China; 2Department of Cardiovascular Surgery, Fuwai Hospital, National Center for Cardiovascular Diseases, Chinese Academy of Medical Sciences & Peking Union Medical College, Beijing, People’s Republic of China
Correspondence: Keping Chen, Arrhythmia Center, Fuwai Hospital, National Center for Cardiovascular Diseases, Chinese Academy of Medical Sciences & Peking Union Medical College, 167 Beilishi Road, Xicheng District, Beijing, 100037, People’s Republic of China, Email [email protected]
Background: The diagnosis of cardiac syncope remains a challenge. This study sought to develop and validate a diagnostic model for the early identification of individuals likely to have a cardiac cause.
Methods: 877 syncope patients with a determined cause were retrospectively enrolled at a tertiary heart center. They were randomly divided into the training set and validation set at a 7:3 ratio. We analyzed the demographic information, medical history, laboratory tests, electrocardiogram, and echocardiogram by the least absolute shrinkage and selection operator (LASSO) regression for selection of key features. Then a multivariable logistic regression analysis was performed to identify independent predictors and construct a diagnostic model. The receiver operating characteristic curves, area under the curve (AUC), calibration curves, and decision curve analysis were used to evaluate the predictive accuracy and clinical value of this nomogram.
Results: Five independent predictors for cardiac syncope were selected: BMI (OR 1.088; 95% CI 1.022– 1.158; P =0.008), chest symptoms preceding syncope (OR 5.251; 95% CI 3.326– 8.288; P < 0.001), logarithmic NT-proBNP (OR 1.463; 95% CI 1.240– 1.727; P < 0.001), left ventricular ejection fraction (OR 0.940; 95% CI 0.908– 0.973; P < 0.001), and abnormal electrocardiogram (OR 6.171; 95% CI 3.966– 9.600; P < 0.001). Subsequently, a nomogram based on a multivariate logistic regression model was developed and validated, yielding AUC of 0.873 (95% CI 0.845– 0.902) and 0.856 (95% CI 0.809– 0.903), respectively. The calibration curves showcased the nomogram’s reasonable calibration, and the decision curve analysis demonstrated good clinical utility.
Conclusion: A diagnostic tool providing individualized probability predictions for cardiac syncope was developed and validated, which may potentially serve as an effective tool to facilitate early identification of such patients.
Keywords: cardiac syncope, syncope, diagnosis, nomogram, prediction model
Introduction
Syncope is the form of transient loss of consciousness that is caused by temporary cerebral hypoperfusion.1 This symptom is a frequent reason for emergency department (ED) visits and hospital admissions.2,3 Determining the underlying cause of syncope can be a challenging and time-consuming process due to its varied etiology. There is substantial heterogeneity in the treatment options and prognosis among different types of syncope. Patients with cardiac syncope face a higher risk for mortality or other adverse events compared with those with vasovagal or orthostatic causes.1,4,5 Therefore, it is imperative to pinpoint reliable diagnostic features for cardiac syncope and achieve early identification of such patients.
Over the past two decades, several syncope prediction models have emerged, incorporating individual or combined clinical parameters derived from clinical history, physical examination, serum biomarkers and electrocardiogram (ECG).6–12 For instance, the Evaluation of Guidelines in Syncope Study (EGSYS) score, which relies on readily available historical findings, has demonstrated high sensitivity in discriminating cardiac from non-cardiac syncope.7 These strategies can serve as predictive tools to assist physicians in making clinical judgement. To some degree, they help facilitate early diagnosis, refine risk stratification, and estimate prognosis of patients with syncope. However, owing to their limited reproducibility and remarkable heterogeneity in study design, along with variable definitions across primary studies, none has achieved widespread clinical acceptance and adoption.13,14 Especially for patients with atypical symptoms or more complex etiologies of syncope, their diagnostic value is relatively limited. After initial evaluation, there still remains a large portion with unexplained syncope or syncope with suspected cause which needs further tests for confirmation. For patients with non-cardiac syncope, such as those with orthostatic hypotension or vasovagal syncope, routine exposure to a series of complicated examinations primarily aimed at ruling out cardiac causes significantly escalates healthcare costs and prolongs hospitalization times.
Therefore, the development of an easy-to-use diagnostic model is crucial in the early identification of cardiac syncope, assisting physicians in organizing precise examinations and thereby reducing healthcare expenses and shortening hospital stays. In this study, we focused on exploring the predictive role of a comprehensive array of readily available clinical parameters for distinguishing between cardiac and non-cardiac causes in patients presenting with syncope. Furthermore, we sought to develop a nomogram model to facilitate its adoption in routine clinical practice.
Methods
Study Design and Patients Selection
We conducted a retrospective cohort study that enrolled all patients admitted to hospital for syncope at Fuwai hospital between Jan 2021 and June 2022. As part of our routine protocol, each syncope patient underwent a standard evaluation, including detailed history-taking, physical examination, basic laboratory tests, standard 12-lead electrocardiogram (ECG) procedures. Additional specific tests were initiated depended on the individual patient’s condition and clinical requirements. The etiology of syncope was determined through a comprehensive analysis of all available information by two independent cardiologists. Following the guidelines of European Society of Cardiology (ESC),1 we categorized three primary groups of syncope: cardiac syncope, reflex syncope, and syncope secondary to orthostatic hypotension (OH). Cardiac syncope is defined as syncope associated with cardiac disorders, with impaired hemodynamics commonly in arrhythmic or structural cardiovascular diseases. We also collectively defined reflex syncope and syncope due to OH as non-cardiac syncope.
All enrolled patients were aged 18 to 85 years old and had experienced at least one syncope episode within the 180 days preceding their admission. To provide a more representative description of individual’s syncope event, we meticulously selected the specific syncope episodes that directly led to this hospitalization for detailed analysis. Patients were excluded if they had prolonged loss of consciousness (> 5 minutes), an obvious witnessed seizure, alcohol or illicit drug intoxication, or any traumatic events preceding the syncope. We also excluded patients with a significant amount of missing information. Patients with a determined cause of syncope were included in subsequent model construction and were categorized into two groups based on their underlying cause: cardiac syncope and non-cardiac syncope (including reflex syncope and OH).
This study was approved by the ethics committee of Fuwai Hospital (Approval No. 2022–1775). Given its retrospective and observational design, the written informed consent requirements were waived.
Data Collection and Variables
Clinical data were collected by trained physicians from the electronic medical information recording system of Fuwai Hospital. Inaccuracies were rigorously reviewed by a senior physician. A comprehensive set of 36 variables, including demographics, syncopal event details, comorbidities, laboratory tests, transthoracic echocardiography (TTE) parameters, and electrocardiogram (ECG) findings were methodically selected and compared. The detailed list of these 36 candidate variables was shown on Table S1. All demographic and medical history information was promptly collected within the first 24 hours of admission, and all of the examinations were performed by the auxiliary departments within our hospital.
Definitions of Important Variables
In the section on syncopal event details, the presence of specific triggers referred to the occurrence of factors such as coughing, laughter, pain, prolonged standing, distressful stimulus, or medical environment preceding the syncope episodes. Chest symptoms preceding syncope was defined as the presence of any one of the following symptoms: palpitation, chest pain, or chest tightness that occurred before the syncope episode. In the comorbidities section, heart disease included ischemic or valvular heart disease, cardiomyopathy, congenital heart disease, arrhythmia, and a history of sudden cardiac arrest or resuscitation. Vascular disease included transient ischemic attack, cerebrovascular accident, peripheral vascular disease, or embolism. An abnormal ECG was characterized as the presence of sustained bradycardia (HR<40 bpm), atrioventricular block greater than first degree, bundle branch block, ischemic ST-T changes, supraventricular or ventricular tachycardia, ventricular preexcitation, prolonged or shortened QT intervals, and irregular waveform pattern such as J-point elevation and Brugada patterns.
Statistical Analysis
The entire dataset was randomly divided into a training set and a validation set at a ratio of 7:3. The training set was used to develop the model, while the validation set was used for internal validation. Continuous variables were expressed as mean with standard deviation (normal distribution) or median with interquartile range (skewed distribution), and the Student’s T-test or Mann–Whitney U-test was used for comparisons between groups accordingly. Shapiro–Wilk test was performed to check for normal distribution. Categorical variables were expressed as frequency with percentage, with group comparisons performed using the Pearson’s chi-square test. As N-terminal pro B-type natriuretic peptide (NT-proBNP) was highly skewed, the logarithmically transformed values (Log NT-proBNP) were alternatively used for further analysis to minimize the absolute disparities among the data. Multiple imputation based on five replications was used to fill in the missing data.15 Continuous variables were imputed using linear regression, or predictive mean matching was applied when they exhibited skewed distribution. For categorical variables, imputation was performed using logistic regression.
To promote model simplicity and mitigate the likelihood of overfitting, we performed the least absolute shrinkage and selection operator (LASSO) regression to identify candidate variables essential for discriminating between cardiac syncope and non-cardiac syncope. We determined the optimal value of the tuning parameter λ using 10-fold cross-validation, and set the λ value to “1se” to strike a balance between complexity and predictive power in our prediction model. Subsequently, these potential predictors identified by LASSO regression were further analyzed by multivariable analysis. We retained predictors with a statistically significant P value (<0.05) to construct a nomogram model for predicting the probability of cardiac syncope. Individual scores for each predictor were calculated using the coefficients obtained from the multivariable logistic regression model. Several crucial steps were involved in the assessment of the nomogram. The area under the curve (AUC) of the receiver operator characteristic (ROC) curve analysis was utilized to evaluate the discriminatory capacity of the nomogram. In addition, calibration curves with Hosmer–Lemeshow test were used to measure the alignment between the predicted and actual observed probability. Moreover, decision curve analysis (DCA) was used to evaluate the clinical benefit of the nomogram by quantifying the net benefits at different threshold probabilities. To ensure the robustness of the nomogram model, we employed a bootstrap approach with 1000 replicates within the training set, followed by a comprehensive assessment of the nomogram’s performance within the validation set. Finally, we created an easy-to-use web-based calculator based on the constructed model for predicting the probability of cardiac syncope.
Furthermore, to derive a more practical diagnostic decision rule, a point-score model based on these identified predictors was also constructed. We transformed continuous variables into categorical variables to align with the real clinical scenario, with the cutoff values determined based on their common clinical reference values. The point of each predictor was derived from the relative weighting of the regression coefficients. Each coefficient was divided by the smallest absolute value of the coefficient retained in the model, then rounded to the nearest integer, as has been done for other health-related scores.16 The points were summed and a diagnostic threshold was chosen using receiver operating characteristic analysis. Sensitivity and specificity for each score cutoff were calculated using the exact binomial method.
Statistical analyses were performed using R software (version 4.3.1, www.R-project.org/) and SPSS (version 26.0, IBM). All tests were two-tailed and P <0.05 was considered statistically significant.
Results
Patient Characteristics
A total of 919 hospitalized patients with syncope were enrolled in this study. According to the ESC classification, the underlying cause of syncope was reflex in 313 patients (34.1%), orthostatic hypotension in 42 (4.6%), primary arrhythmic in 321 (34.9%, with sinus node dysfunction in 62 (6.7%), atrioventricular conduction disorder in 116 (12.6%), supraventricular tachycardia in 51 (5.5%), ventricular tachycardia in 83 (9.0%), and inherited arrhythmia syndrome in 9 (1.0%), including 7 cases of Long QT syndrome and 2 cases of catecholaminergic polymorphic ventricular tachycardia), structural cardiac diseases in 174 (18.9%: acute myocardial infarction/ischemia in 85 patients (9.2%), aortic stenosis in 17 (1.8%), hypertrophic cardiomyopathy in 48 (5.2%), congenital heart disease in 15 (1.6%), etc.), cardiopulmonary and great vessels diseases in 27 (2.9%) and unknown in 42 (4.6%) (Table 1).
 |
Table 1 Underlying Causes of Syncope in the Entire Cohort |
877 syncope patients with a determined cause were incorporated into the development of predictive model. Among these patients, the mean age was 57.2 ± 15.0 years and 40.8% were female. On average, each patient had experienced two syncope episodes. They were subsequently randomly divided into the training set (n =616) and the validation set (n =261), with a ratio of 7:3. The baseline characteristics of both sets are presented in Table 2. There are no statistical differences in most predictive variables between the two sets.
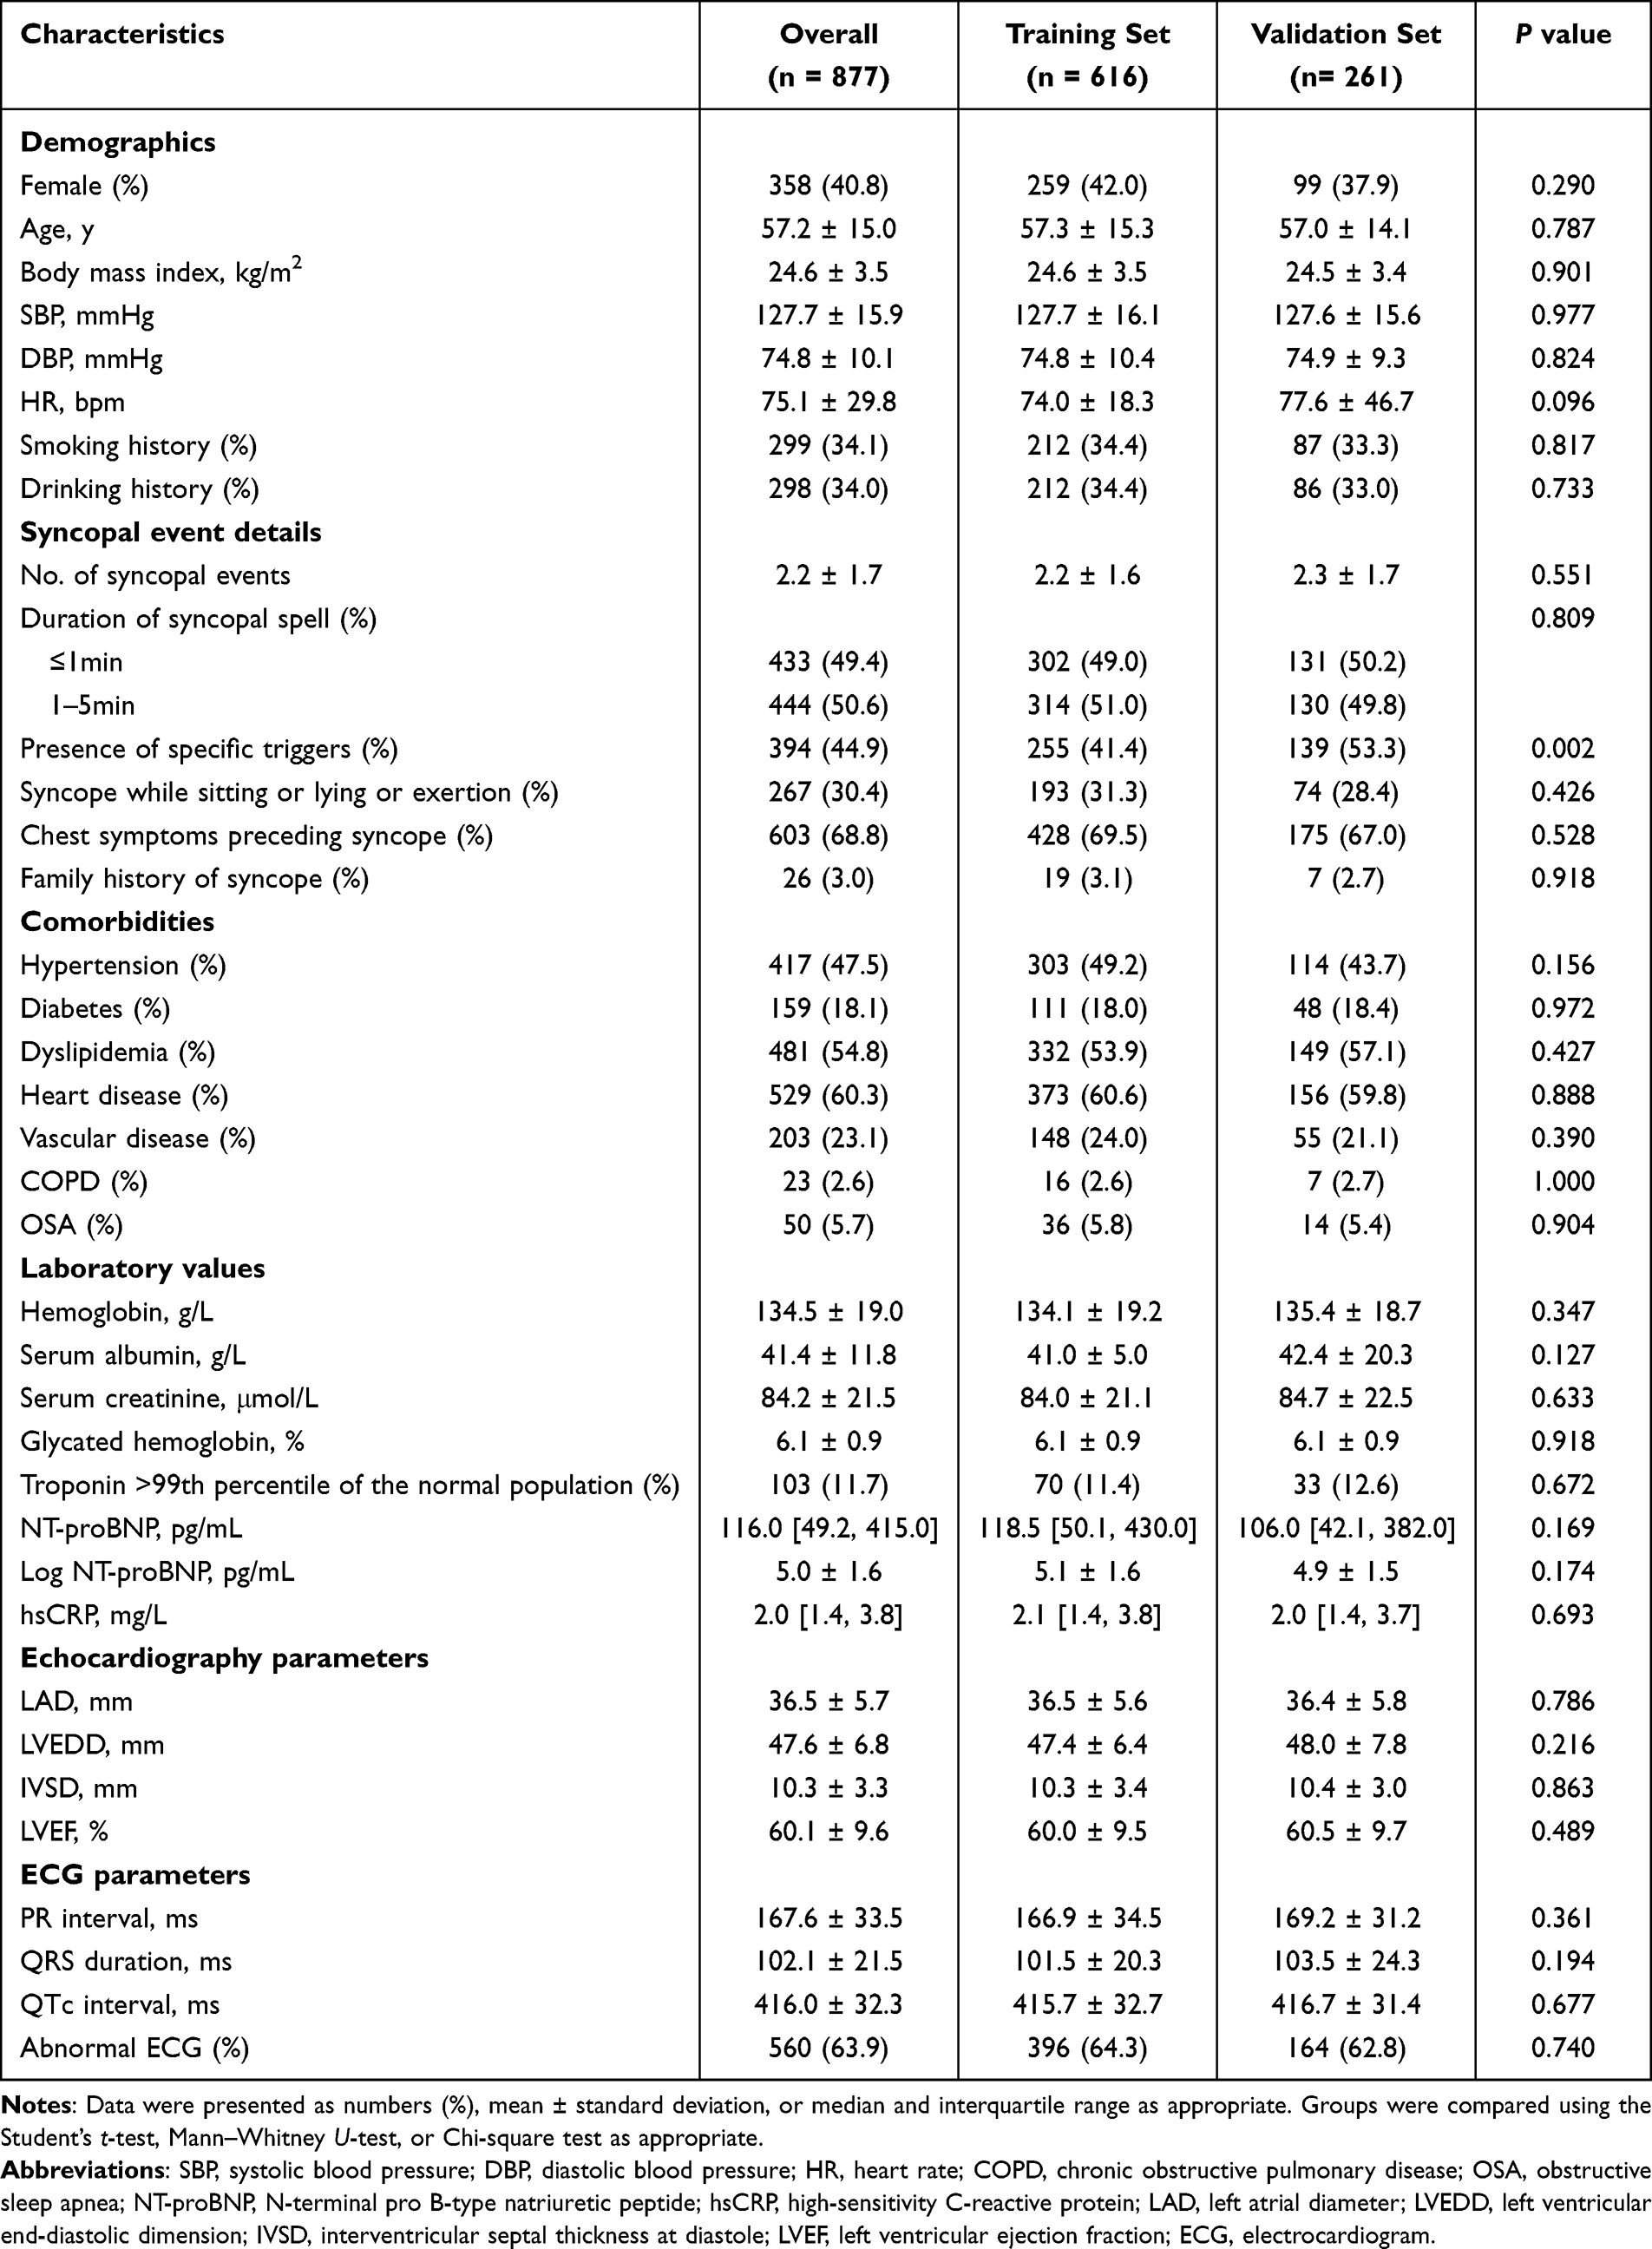 |
Table 2 Baseline Characteristics of the Training Set and Validation Set |
Within the overall cohort, 521 patients were diagnosed with cardiac syncope and 356 patients were diagnosed with non-cardiac syncope. The summary of demographic and clinical characteristics of patients in both categories was provided in Table S2. Notably, the comparisons between patients with cardiac syncope and non-cardiac syncope have yielded statistical significance in the majority of features in syncopal event details, laboratory test values, as well as TTE and ECG parameters.
Predictors Selection and Summarization
As shown in Figure 1, 36 variables were screened by the LASSO regression with the 10-fold cross-validation. When ln(λ) was set at −3.442 (λ = 0.032), the residual sum of squares was under the 1-SE criteria and 10 predictive factors were preliminarily identified, including age, body mass index (BMI), No. of syncopal events, presence of specific triggers, syncope while sitting or lying or exertion, chest symptoms preceding syncope, family history of syncope, Log NT-proBNP, left ventricular ejection fraction (LVEF), and abnormal ECG. These variables were further included in multivariable analysis, only five predictors demonstrated as independent risk factors of cardiac syncope: BMI, chest symptoms preceding syncope, Log NT-proBNP, LVEF, abnormal ECG. Finally, we selected these five predictors to construct the predictive model.
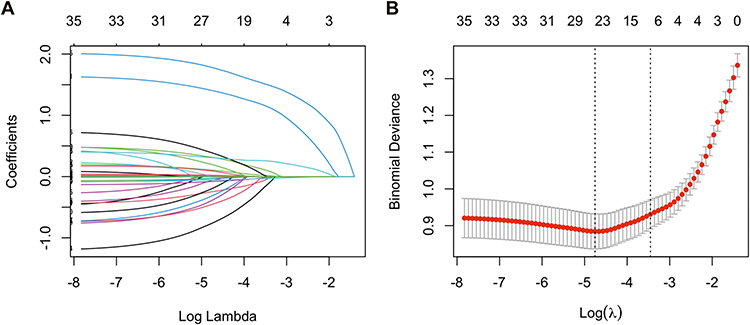 |
Figure 1 Selection of key features related to cardiac syncope by the least absolute shrinkage and selection operator (LASSO) regression. (A) The LASSO regression coefficient trendlines of the 36 candidate features. (B) Determination of the tuning parameter λ by 10-fold cross-validation. Two vertical lines were drawn, representing a more concise model within one standard error. The tuning parameter λ = 0.032 was selected under the 1-SE criteria with 10 non-zero coefficients included. |
Nomogram Construction and Performance
We further incorporated the five independent predictors mentioned above into a multivariable logistic regression model, which showed that BMI (OR 1.088; 95% CI 1.022–1.158; P =0.008), chest symptoms preceding syncope (OR 5.251; 95% CI 3.326–8.288; P <0.001), Log NT-proBNP (OR 1.463; 95% CI 1.240–1.727; P <0.001), LVEF (OR 0.940; 95% CI 0.908–0.973; P <0.001), abnormal ECG (OR 6.171; 95% CI 3.966–9.600; P <0.001) were significantly associated with the diagnosis of cardiac syncope (Table 3). A nomogram based on this multivariable logistic regression model was subsequently constructed to predict the probability of cardiac syncope (Figure 2). Regression coefficients of the five included factors were combined to generate a score ranging from 0 to 100 depending on their relative importance. To illustrate the usage of the nomogram, an example was provided. Specifically, an individual with unexplained syncope, without chest symptom preceding syncope, together with an abnormal ECG, a BMI of 26 kg/m2, a Log NT-proBNP level of 7pg/mL, and an LVEF of 55%, had a total points of 158. The predictive probability for cardiac syncope was 80.7%. The AUC of this nomogram model was 0.873 (95% CI 0.845–0.902), indicating good predictive accuracy (Figure 3).
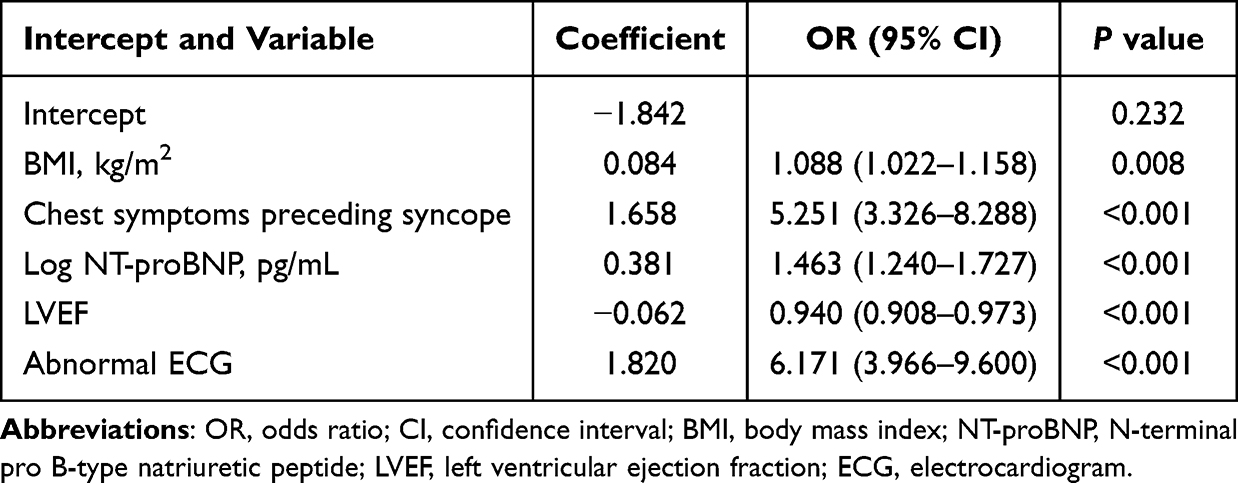 |
Table 3 Final Model of the Multivariable Logistic Regression Analysis for Cardiac Syncope |
 |
Figure 2 The nomogram for predicting the probability of cardiac syncope. Notes: A specific case is presented to show the usage of the nomogram. This was a patient with unexplained syncope, without chest symptom preceding syncope, together with an abnormal ECG, a BMI of 26 kg/m2, a Log NT-proBNP level of 7pg/mL, and an LVEF of 55%, had a total points of 158. Based on the nomogram model, the predictive probability for cardiac syncope was 80.7%. |
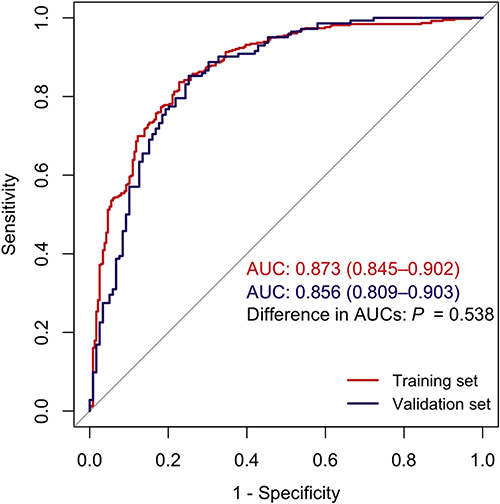 |
Figure 3 The ROC curves of the nomogram in both the training and validation sets. Abbreviations: ROC, receiver operating characteristic; AUC, area under the curve. |
Nomogram Validation and Assessment
This nomogram model also demonstrated robust discriminatory capacity in the validation set, with an AUC of 0.856 (95% CI 0.809–0.903) (Figure 3). Comparing the ROC curves of the two sets, no significant difference was observed (P =0.538). The calibration curve plots indicated a concordance between predicted and observed probabilities, with a Hosmer-Lemeshow chi-square statistic of 6.610 (P =0.579, Figure 4A) in the training set and 9.042 (P =0.339, Figure 4B) in the validation set. To further evaluate the practical clinical utility of this prediction model, we performed decision curve analysis. As shown in Figure 4C and D, DCA curves for both training set and validation set demonstrated good clinical utility in model practice.
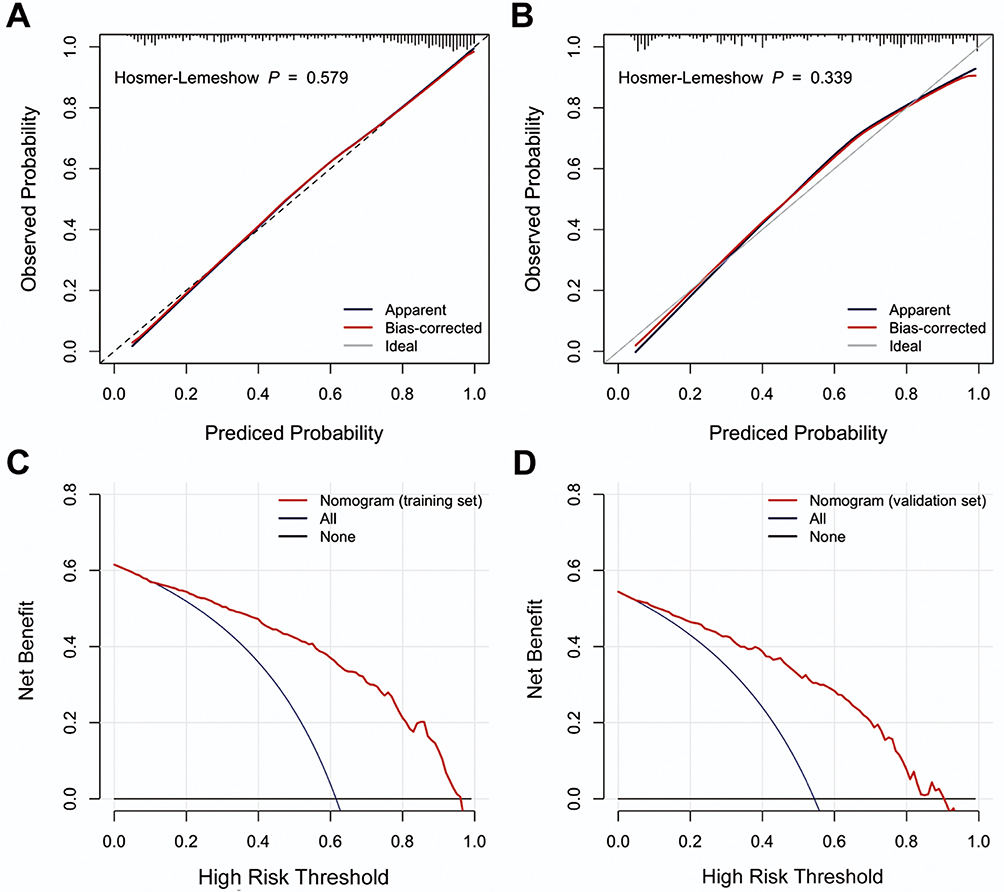 |
Figure 4 Assessment of the nomogram model for diagnosing cardiac syncope. Calibration plots in the training set (A) and the validation set (B), decision curves in the training set (C) and the validation set (D). |
Establishment of the Web-Based Dynamic Nomogram
To enhance the accessibility of the nomogram for physician, we further established a web-based calculator of the nomogram (cardiac syncope nomogram: https://cardiacsyncope.shinyapps.io/DynNomapp/), which was freely available online. This user-friendly tool allowed easy calculation of the estimated probabilities of cardiac syncope by inputting the five independent predictive factors on the website (the screen shot of this tool was displayed in Figure 5).
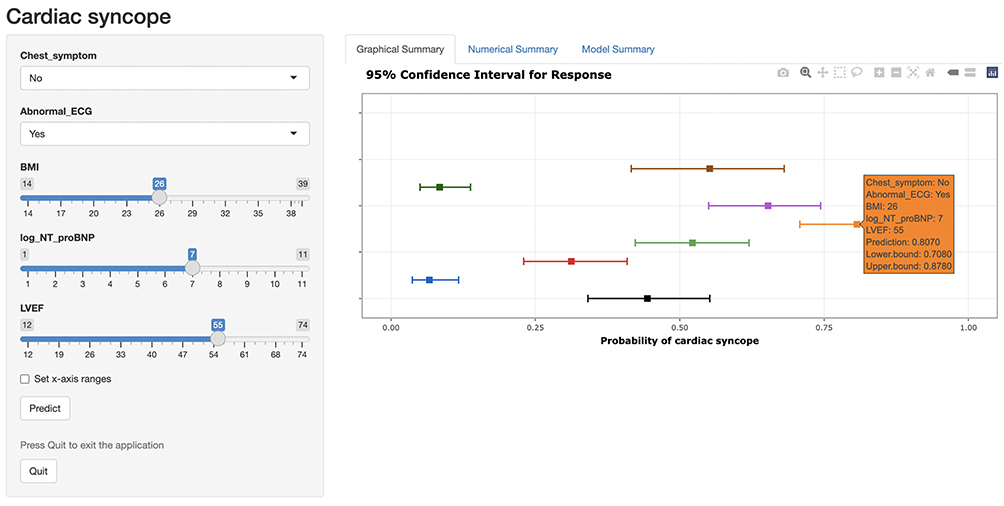 |
Figure 5 The screen shot of the dynamic web-based nomogram established to predict the probability cardiac syncope (https://cardiacsyncope.shinyapps.io/DynNomapp/). |
Development of a Diagnostic Point-Score Model
A point-score model incorporating the five selected predictors was further developed (Table 4). Notably, three continuous variables, including BMI, NT-proBNP, and LVEF, were all converted into categorical variables based on their widely recognized clinical reference ranges. The diagnostic score achieved an AUC of 0.850 (95% CI 0.819–0.881) (Figure S1). The corresponding sensitivity and specificity for each score cutoff were detailed in Table S3. A point score ≥ 9 was considered the optimal discriminator for a diagnosis of cardiac syncope, boasting a sensitivity of 80.5% and specificity of 79.7%.
 |
Table 4 Point Scores Derived from the Multivariable Logistic Regression Model for the Diagnosis of Cardiac Syncope |
Discussion
Syncope due to cardiac disease presents a greater mortality risk compared to those with non-cardiac causes. Thus, a critical focus in syncope management must be the early identification of these patients. To our knowledge, this study has for the first time developed a predictive nomogram model based on readily available clinical parameters for diagnosing cardiac syncope in hospitalized patients. The LASSO logistic regression model selected the following five independent predictors: BMI, chest symptoms preceding syncope, Log NT-proBNP, LVEF, and abnormal ECG. The nomogram application demonstrated good discrimination in distinguishing patients with cardiac syncope from those with non-cardiac syncope. The calibration curves showcased the nomogram’s strong calibration, and DCA curves revealed its potential as a highly effective tool in clinical practice.
Previous studies have pointed out that certain clinical variables are predictive of cardiac syncope, of which some have reported single diagnostic variable,17–19 while others have developed diagnostic prediction models by combining multiple variables.7,11,12 Del Rosso et al identified several predictors of cardiac syncope, including abnormal ECG and/or heart disease, palpitations before syncope, syncope during effort or in supine position, absence of autonomic prodromes and absence of predisposing and/or precipitating factors, and subsequently established a point scoring system based on these predictors (the EGSY score) for the triage and management of ED-syncope patients.7 Additionally, the early standardized clinical judgement (ESCJ) prediction tool, which included a standardized syncope-specific case report form, demonstrated high diagnostic accuracy (AUC 0.87).11 The diagnostic accuracy significantly improved when ESCJ was combined with cardiac biomarkers such as troponin or BNP, either alone or in combination.11 In a different manner, Zimmermann et al developed an ECG-based diagnostic criterion with high accuracy (AUC 0.80) for diagnosing cardiac causes of syncope.12 These diagnostic criteria could serve as valuable clinical decision aids for the early exclusion or confirmation of a cardiac cause of syncope in the ED. Moreover, several emerging tools like the San Francisco Syncope Rule (SFSR), Canadian Syncope Risk Score, and FAINT score have focused on the prediction of serious outcome after ED disposition.6,9,10 These diagnostic and prognostic models have effectively promoted the management of cardiac syncope.
Similar to the aforementioned predictive models, our model has integrated multiple parameters obtained from patient history, laboratory tests, and generally available examinations like ECG. Apart from that, we have introduced echocardiographic parameters into the model construction for the first time. Notably, we focused on the hospitalized syncope patients, which differs from previous models that primarily targeted ED patients.7,11,12 These patients typically undergo echocardiographic examinations to confirm or exclude cardiac causes. In addition, three diagnostic predictors, consistently confirmed in literature and included in our model, are chest symptoms preceding syncope, abnormal ECG, and NT-proBNP.
Accordingly, both abnormal ECG and sudden onset palpitation preceding syncope are recommended as “suggestive” for cardiac syncope and classified as “high risk” requiring intensive evaluation in the recent ESC guidelines.1 In this study, we have meticulously defined the criteria for abnormal ECG and appropriately expanded the description “palpitations preceding syncope” to “chest symptoms preceding syncope”. Both of the two selected clinical features encompassed relatively broad scopes. Consequently, a majority of our patients fulfilled one of both criteria, and furthermore, we confirmed both criteria as independent predictors for cardiac syncope. However, because of their broad range, they can easily lead to misdiagnosis. It is recommended that they should be used in conjunction with other indicators in practice.
Our results add to the increasing body of literature supporting the value of NT-proBNP as a diagnostic predictor for cardiac syncope.18–21 NT-proBNP is an important serum marker in the assessment of diagnosis and prognosis of heart failure.22 It reflects the presence of structural heart disease and is also elevated in distinct cardiac arrhythmias.23,24 As cardiac syncope is frequently caused by reduced cardiac output associated with impaired hemodynamics in arrhythmic or structural cardiac conditions, natriuretic peptides hold promise as diagnostic tools for diagnosis of cardiac syncope. Prior studies have established NT-proBNP concentration cut-offs at approximately 156–210 pg/mL to determine the cardiac origin of syncope.18,21 Our study revealed that an elevated logarithmic NT-proBNP level had an odds ratio of 1.46, independent of other clinical variables. This suggests that an NT-proBNP assay should be strongly considered in the evaluation of hospitalized patients with unexplained syncope. Furthermore, the NT-proBNP laboratory test is convenient, rapid, and reasonable priced. Assessing NT-proBNP concentration before performing additional examinations can aid in the initial classification of syncope, which significantly facilitates final diagnosis.
Of note, our predictive model incorporated novel clinical features, specifically BMI and LVEF, as discriminative factors for distinguishing between cardiac and non-cardiac syncope. Accumulated evidence has indicated that a higher BMI is associated with an elevated risk of cardiovascular diseases,25 potentially increasing the likelihood of cardiac syncope. Conversely, BMI appears to be a modifier of orthostatic responses and may influence the propensity for non-cardiac syncope. Individuals with lower BMI have greater predisposition to vasovagal syncope and orthostatic hypotension, often accompanied by dysregulated autonomic nervous system activity.26–28
LVEF is a valuable indicator for the diagnosis and monitoring of heart conditions such as heart failure and cardiomyopathy. Our findings have demonstrated that LVEF was an independent predictor to discriminate cardiac syncope from non-cardiac syncope. In practice, echocardiography emerges as a safe, non-invasive, and easy-to-perform examination. The routine echocardiogram use in unselected patients with syncope is common,29,30 particularly in hospitalized patients whose conditions are often more intricate. Following a comprehensive initial evaluation, which includes history taking, physical examination, or ECG, echocardiogram is frequently necessary to either confirm or rule out a cardiac cause of syncope. In this study, we have incorporated LVEF as a pivotal variable to develop a novel prediction model, thereby enhancing predictive accuracy. Nevertheless, given the fact that echocardiogram use may extend hospital stays and incur additional costs, therefore, physicians should weigh the patient’s condition, length of hospitalization, and associated costs when scheduling an echocardiogram examination.
In summary, we used a large dataset of patients with syncope to derive a diagnostic model for the early identification of cardiac syncope cases. It is crucial to highlight that our model has not yet been validated by an independent cohort, necessitating external validation before clinical implementation should be considered. In addition, this predictive model does not provide clear aid in the prognosis of cardiac syncope. Other emerging tools such as the Canadian Syncope Risk Score, which focuses on the prediction of serious events after discharge, should be considered as further assistance to physicians.9,31 Moreover, to maximize diagnostic accuracy and ensure patient safety, the predictive model should always be employed in conjunction with all available diagnostic information available rather than be used in isolation.
Limitations
Several limitations of this study merit consideration. First, this study exclusively enrolled hospitalized patients. It is uncertain whether and to what extent our findings can be extrapolated to patients in primary care. Second, the patient cohort was drawn from a specialized cardiac hospital, which could potentially lead to overestimation of the actual proportion of cardiac syncope cases. While cardiac cause is typically the second most common reason for syncope, our study found that cardiac syncope accounted for the majority of cases, possibly due to this selection bias. This bias might also influence the performance of the pre-defined variables. However, according to the ESC guideline,1 high-risk syncope patients are more likely to have cardiac syncope and thus require hospitalization more frequently. Hence, our findings may have certain generalizability and representativeness in hospitalized patients. Third, the relevant clinical parameters in this study were not timely connected with syncope episodes, since they were all measured and collected during patients’ hospitalization, not near the occurrence of syncope events. Actually, syncope episodes are often sudden and transient, making it difficult to measure the parameters just at the time of occurrence. However, based on our practical experience, in stable patient conditions, most clinical parameters generally do not undergo significant changes over short periods. Finally, this was a single-center retrospective study with missing information for some variables. Although the diagnostic model has been internally validated by cross-validation and bootstrap validation, further large-scale multicenter prospective clinical trial is required for external validation.
Conclusions
This study has successfully developed and internally validated a novel diagnostic model for distinguishing between cardiac and non-cardiac syncope. The model application demonstrated excellent discrimination and calibration, rendering it a promising and highly effective tool for clinical practice. Future large-scale prospective studies are required to externally validated these findings.
Ethic Approval and Consent to Participate
This study was approved by the ethics committee of Fuwai Hospital (Approval No. 2022-1775). As this study is retrospective and presents no risk of harm to participants, the written informed consent requirements were waived. All patient data was anonymized or maintained with confidentiality. All procedures adhered to the ethical standards and the Helsinki Declaration (as revised in 2013).
Author Contributions
All authors made a significant contribution to the work reported, whether that is in the conception, study design, execution, acquisition of data, analysis and interpretation, or in all these areas; took part in drafting, revising or critically reviewing the article; gave final approval of the version to be published; have agreed on the journal to which the article has been submitted; and agree to be accountable for all aspects of the work.
Funding
This study was funded by the National High-Level Hospital Clinical Research Funding (Grant Number: 2022-GSP-GG-31) of China.
Disclosure
The authors report no conflicts of interest in this work.
References
1. Brignole M, Moya A, de Lange FJ, et al.; Group ESCSD. 2018 esc guidelines for the diagnosis and management of syncope. Eur Heart J. 2018;39:1883–1948. doi:10.1093/eurheartj/ehy037
2. Anderson TS, Thombley R, Dudley RA, Lin GA. Trends in hospitalization, readmission, and diagnostic testing of patients presenting to the emergency department with syncope. Ann Emerg Med. 2018;72:523–532. doi:10.1016/j.annemergmed.2018.08.430
3. Probst MA, Kanzaria HK, Gbedemah M, Richardson LD, Sun BC. National trends in resource utilization associated with ed visits for syncope. Am J Emerg Med. 2015;33:998–1001. doi:10.1016/j.ajem.2015.04.030
4. Soteriades ES, Evans JC, Larson MG, et al. Incidence and prognosis of syncope. N Engl J Med. 2002;347:878–885. doi:10.1056/NEJMoa012407
5. Koene RJ, Adkisson WO, Benditt DG. Syncope and the risk of sudden cardiac death: evaluation, management, and prevention. J Arrhythm. 2017;33:533–544. doi:10.1016/j.joa.2017.07.005
6. Quinn J, McDermott D, Stiell I, Kohn M, Wells G. Prospective validation of the San Francisco syncope rule to predict patients with serious outcomes. Ann Emerg Med. 2006;47:448–454. doi:10.1016/j.annemergmed.2005.11.019
7. Del Rosso A, Ungar A, Maggi R, et al. Clinical predictors of cardiac syncope at initial evaluation in patients referred urgently to a general hospital: the egsys score. Heart. 2008;94:1620–1626. doi:10.1136/hrt.2008.143123
8. Reed MJ, Newby DE, Coull AJ, Prescott RJ, Jacques KG, Gray AJ. The rose (risk stratification of syncope in the emergency department) study. J Am Coll Cardiol. 2010;55:713–721. doi:10.1016/j.jacc.2009.09.049
9. Thiruganasambandamoorthy V, Kwong K, Wells GA, et al. Development of the Canadian syncope risk score to predict serious adverse events after emergency department assessment of syncope. CMAJ. 2016;188:E289–E298. doi:10.1503/cmaj.151469
10. Probst MA, Gibson T, Weiss RE, et al. Risk stratification of older adults who present to the emergency department with syncope: the faint score. Ann Emerg Med. 2020;75:147–158. doi:10.1016/j.annemergmed.2019.08.429
11. du Fay de Lavallaz J, Badertscher P, Zimmermann T, et al. Early standardized clinical judgement for syncope diagnosis in the emergency department. J Intern Med. 2021;290:728–739. doi:10.1111/joim.13269
12. Zimmermann T, du Fay de Lavallaz J, Walter JE, et al; Investigators SRS. Development of an electrocardiogram-based risk calculator for a cardiac cause of syncope. Heart. 2021;107:1796–1804. doi:10.1136/heartjnl-2020-318430
13. Costantino G, Casazza G, Reed M, et al. Syncope risk stratification tools vs clinical judgment: an individual patient data meta-analysis. Am J Med. 2014;127:1126 e1113–1126 e1125. doi:10.1016/j.amjmed.2014.05.022
14. Sutton R, Ricci F, Fedorowski A. Risk stratification of syncope: current syncope guidelines and beyond. Auton Neurosci. 2021;238:102929. doi:10.1016/j.autneu.2021.102929
15. Jakobsen JC, Gluud C, Wetterslev J, Winkel P. When and how should multiple imputation be used for handling missing data in randomised clinical trials - A practical guide with flowcharts. BMC Med Res Methodol. 2017;17:162. doi:10.1186/s12874-017-0442-1
16. Sullivan LM, Massaro JM, D’Agostino RB Sr. Presentation of multivariate data for clinical use: the Framingham study risk score functions. Stat Med. 2004;23:1631–1660. doi:10.1002/sim.1742
17. Alboni P, Brignole M, Menozzi C, et al. Diagnostic value of history in patients with syncope with or without heart disease. J Am Coll Cardiol. 2001;37:1921–1928. doi:10.1016/S0735-1097(01)01241-4
18. Pfister R, Hagemeister J, Esser S, Hellmich M, Erdmann E, Schneider CA. NT-pro-BNP for diagnostic and prognostic evaluation in patients hospitalized for syncope. Int J Cardiol. 2012;155:268–272. doi:10.1016/j.ijcard.2010.10.013
19. Pfister R, Diedrichs H, Larbig R, Erdmann E, Schneider CA. NT-pro-BNP for differential diagnosis in patients with syncope. Int J Cardiol. 2009;133:51–54. doi:10.1016/j.ijcard.2007.11.082
20. Tanimoto K, Yukiiri K, Mizushige K, et al. Usefulness of brain natriuretic peptide as a marker for separating cardiac and noncardiac causes of syncope. Am J Cardiol. 2004;93:228–230. doi:10.1016/j.amjcard.2003.09.048
21. Stryjewski PJ, Nessler B, Kuczaj A, et al. The role of nt-probnp in the diagnostics and differentiation of cardiac and reflex syncope in adults: relative importance to clinical presentation and medical examinations. J Interv Card Electrophysiol. 2014;41:1–8. doi:10.1007/s10840-014-9923-x
22. Hill SA, Booth RA, Santaguida PL, et al. Use of BNP and nt-probnp for the diagnosis of heart failure in the emergency department: a systematic review of the evidence. Heart Fail Rev. 2014;19:421–438. doi:10.1007/s10741-014-9447-6
23. Werhahn SM, Becker C, Mende M, et al. Nt-probnp as a marker for atrial fibrillation and heart failure in four observational outpatient trials. ESC Heart Fail. 2022;9:100–109. doi:10.1002/ehf2.13703
24. Garg PK, Norby FL, Wang W, et al. Association of longitudinal changes in cardiac biomarkers with atrial and ventricular arrhythmias (from the atherosclerosis risk in communities [ARIC] study). Am J Cardiol. 2021;158:45–52. doi:10.1016/j.amjcard.2021.07.043
25. Piche ME, Poirier P, Lemieux I, Despres JP. Overview of epidemiology and contribution of obesity and body fat distribution to cardiovascular disease: an update. Prog Cardiovasc Dis. 2018;61:103–113. doi:10.1016/j.pcad.2018.06.004
26. Luiz Luz Leiria T, Barcellos SR, Moraes MA, Lima GG, Kus T, Barbisan JN. Low body mass index is associated with a positive response during a head-up tilt test. Pacing Clin Electrophysiol. 2013;36:37–41. doi:10.1111/pace.12006
27. Christou GA, Kiortsis DN. The effects of body weight status on orthostatic intolerance and predisposition to noncardiac syncope. Obes Rev. 2017;18:370–379. doi:10.1111/obr.12501
28. George SA, Bivens TB, Howden EJ, et al. The international pots registry: evaluating the efficacy of an exercise training intervention in a community setting. Heart Rhythm. 2016;13:943–950. doi:10.1016/j.hrthm.2015.12.012
29. Recchia D, Barzilai B. Echocardiography in the evaluation of patients with syncope. J Gen Intern Med. 1995;10:649–655. doi:10.1007/BF02602755
30. Chang NL, Shah P, Bajaj S, Virk H, Bikkina M, Shamoon F. Diagnostic yield of echocardiography in syncope patients with normal ECG. Cardiol Res Pract. 2016;2016:1251637. doi:10.1155/2016/1251637
31. Thiruganasambandamoorthy V, Sivilotti MLA, Le Sage N, et al. Multicenter emergency department validation of the Canadian syncope risk score. JAMA Intern Med. 2020;180:737–744. doi:10.1001/jamainternmed.2020.0288
 © 2024 The Author(s). This work is published and licensed by Dove Medical Press Limited. The
full terms of this license are available at https://www.dovepress.com/terms
and incorporate the Creative Commons Attribution
- Non Commercial (unported, 3.0) License.
By accessing the work you hereby accept the Terms. Non-commercial uses of the work are permitted
without any further permission from Dove Medical Press Limited, provided the work is properly
attributed. For permission for commercial use of this work, please see paragraphs 4.2 and 5 of our Terms.
© 2024 The Author(s). This work is published and licensed by Dove Medical Press Limited. The
full terms of this license are available at https://www.dovepress.com/terms
and incorporate the Creative Commons Attribution
- Non Commercial (unported, 3.0) License.
By accessing the work you hereby accept the Terms. Non-commercial uses of the work are permitted
without any further permission from Dove Medical Press Limited, provided the work is properly
attributed. For permission for commercial use of this work, please see paragraphs 4.2 and 5 of our Terms.
Recommended articles
Predicting the Risk of Unplanned Readmission at 30 Days After PCI: Development and Validation of a New Predictive Nomogram
Xu W, Tu H, Xiong X, Peng Y, Cheng T
Clinical Interventions in Aging 2022, 17:1013-1023
Published Date: 5 July 2022
Development and Validation of a Nomogram for Predicting 28-Day Mortality on Admission in Elderly Patients with Severe Community-Acquired Pneumonia
Song Y, Wang X, Lang K, Wei T, Luo J, Song Y, Yang D
Journal of Inflammation Research 2022, 15:4149-4158
Published Date: 21 July 2022
Clinical Prediction Score for Early Diagnosis of Acute Pancreatitis in Emergency Departments
Liengswangwong W, Preechakul P, Yuksen C, Jenpanitpong C, Tienpratarn W, Watcharakitpaisan S
Open Access Emergency Medicine 2022, 14:355-366
Published Date: 26 July 2022
Development and Validation of a Multivariable Prediction Model to Identify Acute Exacerbation of COPD and Its Severity for COPD Management in China (DETECT Study): A Multicenter, Observational, Cross-Sectional Study
Yin Y, Xu J, Cai S, Chen Y, Chen Y, Li M, Zhang Z, Kang J
International Journal of Chronic Obstructive Pulmonary Disease 2022, 17:2093-2106
Published Date: 5 September 2022
Development and Validation of a Prediction Model for Chronic Post-Surgical Pain After Thoracic Surgery in Elderly Patients: A Retrospective Cohort Study
Wu XD, Zeng FF, Yu XX, Yang PP, Wu JP, Xv P, Wang HT, Pei YM
Journal of Pain Research 2022, 15:3079-3091
Published Date: 29 September 2022