Back to Journals » Journal of Pain Research » Volume 19
Negative Emotional Influences on Pressure Pain Thresholds: Findings from a Quasi-Randomized Controlled Trial
Authors Gunnarsson H ![]() , Safipour J, Lindqvist G
, Safipour J, Lindqvist G
Received 28 November 2025
Accepted for publication 24 February 2026
Published 1 April 2026 Volume 2026:19 585219
DOI https://doi.org/10.2147/JPR.S585219
Checked for plagiarism Yes
Review by Single anonymous peer review
Peer reviewer comments 2
Editor who approved publication: Dr Rocío de la Vega
Helena Gunnarsson,1 Jalal Safipour,2 Gunilla Lindqvist2
1Department of Psychology, Linnaeus University, Växjö, Sweden; 2Department of Health and Caring Sciences, Linnaeus University, Växjö, Sweden
Correspondence: Helena Gunnarsson, Email [email protected]
Objective: Human emotions could affect pain perception, but knowledge from well-powered experiments about how different emotions affect pressure pain thresholds (PPTs) in pain-free individuals are missing. The aim of this quasi-randomized control trial was to investigate the effect of different emotional states on PPTs in four different body locations (upper, right m. trapezius; upper, left m. trapezius; right m. tibialis anterior; left m. tibialis anterior).
Methods: Pain-free participants (n = 152) were assigned to four different emotional states (negative n = 38; positive n = 38; distraction control n = 38; control n = 38). Baseline PPTs in each group were measured after a neutral video clip following emotional state induction with video clips (negative; positive; distraction control; control). PPTs were again measured after emotion induction.
Results: The main finding was that negative emotion induction significantly lowered PPTs in the m. trapezius and m. tibialis anterior on the left side of the body after correction for multiple comparisons. PPTs were also significantly lower in the left m. tibialis anterior in the distraction control group. No other significant differences in PPT levels were found.
Conclusion: Negative emotions, but not positive emotions, could significantly lower PPTs in the left m. trapezius and the left m. tibialis anterior in healthy individuals. A practical implication may be that negative emotions might negatively affect pain states through descending pain modulation.
Keywords: pain, emotion, pressure pain thresholds, pain thresholds
Introduction
From a psychophysiology perspective, pain and negative emotions are intertwined, and negative emotions accompany painful experiences,1,2 and the brain dynamically reflects clinical pain states, where emotional networks are related to the central mechanisms in chronic pain states.3 The descending pathway from the brain to the spinal dorsal horn reflects the ability of higher brain centers to inhibit ascending pain signals. Thereby, the activity in the descending system could affect the perception of ascending nociceptive information by inhibiting less ascending pain signals, thereby increasing the ascending flow of painful signals.4,5 The more anticipated anxiety for experimental pain, the higher the pain intensity ratings and the more activation in brain stem areas.6 Negative emotions decreased pain tolerance and increased pain intensity ratings in pain-free individuals.7 The nociceptive flexion reflex was significantly increased during negative emotions but inhibited during positive emotions, where pain ratings were also significantly decreased.8,9 The nociceptive flexion reflex is a physiological, reliable and objective measure of pain perception.10,11 Pain ratings (pain intensity, pain tolerance) were lower in response to positive emotions in some studies12,13 but affected perceived unpleasantness but not pain intensity in another study.14 Pain ratings were higher during a negative emotion condition compared to a positive emotion condition15 Other studies reported that negative associations between depression, psychological distress variables and sensitized PPTs have been reported both in pain-free individuals and in individuals with chronic pain.16,17 Concluding the above-mentioned studies, there is some support that emotions influence pain perception. In a meta-analysis it was concluded that positive emotions attenuated pain perception, while the link between negative emotions and pain exacerbation was less clear.12,13 To the best of our knowledge, no earlier study has examined the effect of emotions on PPTs in a well-powered experimental setting. In an experimental setting, causation could be established and the reflection of sensory modulation from higher brain centers could be investigated when measuring PPTs.4 We aimed to examine the effect of emotions on PPTs in a well-powered, experimental setting with two different control conditions (distraction control and control). We hypothesized that positive emotions would elevate PPTs to specific body locations m. trapezius and m. tibialis anterior within subjects (pre-post measure), and negative emotions would lower PPTs at specific body locations m. trapezius and m. tibialis anterior within-subjects (pre-post measure) in pain-free participants.
Materials and Methods
Participants
This study with a quasi-randomized trial (RCT) design targeted healthy individuals. Participants were university students and staff from a University in Southern Sweden. Inclusion criteria were above 18 years of age and fluency in Swedish. Exclusion criteria were pain anywhere in the body during the test session and known self-reported neurological disease. In total, 152 participants (128 students and 24 staff members) participated in this study. The majority 60.1% (n = 105) were female and 30.9% (n = 47) were male. The mean age was 27.7 (SD = 11.27, min-max 18–71 years). Participants were successively recruited from September 2023 to May 2024. They were informed that the study was about different emotional states and sensitivity to pressure in different body parts and inclusion and exclusion criteria were checked. If inclusion and exclusion criteria were met, a test session was scheduled. Each participant was assigned to the next condition in turn for their test session in a pre-fixed order. Conditions were in the following order: condition 1 negative emotion induction (n = 38); condition 2 positive emotion induction (n = 38); condition 3 distraction control (n = 38); condition 4 mind-wandering control (n = 38). The participants did not know that different conditions existed and therefore did not know to which condition they were assigned. The main author (female) of this article was the principal investigator and guided the test procedure. The principal investigator knew to which condition each participant was assigned. Therefore, the study was single blinded since the participants knew only that they would be watching short videos during the test session. They did not know that different videos existed or that different participants were assigned to watch different videos. Participants were recruited through digital and paper advertisements at a university in Southern Sweden. All scheduled participants completed the experimental session.
The study was approved by the Swedish Ethical Review Authority (code: 2023–03968-01). The study was registered in clinicaltrials.gov (ID: NCT06074575).
Experimental Protocol
At the test session, the participant was comfortably seated in a quiet laboratory setting, received written information about the study and signed the informed consent form. Information about age, gender and education/work title were collected. The algometer functions with the handheld signal button were demonstrated with instructions to press the signal button when the pressure turned into an uncomfortable sensation (clarified with a written sign on the table in front of the participant). Practice PPT measurements on the participants left hand between os metacarpale 2 and os metacarpale 3 were conducted until the participant had grasped the pain threshold sensation and the signal button function. Usually, 1–3 pressure trials were needed. To ensure a neutral mood in all participants at the baseline PPT measurement, a neutral one-minute video was presented to all participants. Immediately after, three consecutive PPT measurements were conducted in the following order: left m. trapezius, right m. trapezius, left m. tibialis anterior and right m. tibialis anterior. Directly after this, valence and arousal regarding the one-minute video-clip were estimated on the Self-Assessment Manikin Scale. The difference between valence and arousal was explained in text and writing to each participant to ensure a valid measurement. Following this, one of the videos matching each condition (condition 1 negative emotion; condition 2 positive emotion; condition 3 distraction control) was presented for 2.20 minutes. In the control condition, the participants were instructed to wait in silence for 2.20 minutes, without any instructions about how to engage their thoughts. Immediately following the presented video or waiting time, three consecutive PPT-values were again conducted in the body location order described above. Directly after this, another estimation of the valence and arousal level regarding the 2.20 minutes video-clip on the self-assessment manikin scale was conducted. A short debriefing where the participant received a movie ticket for participating ended the session (Figure 1).
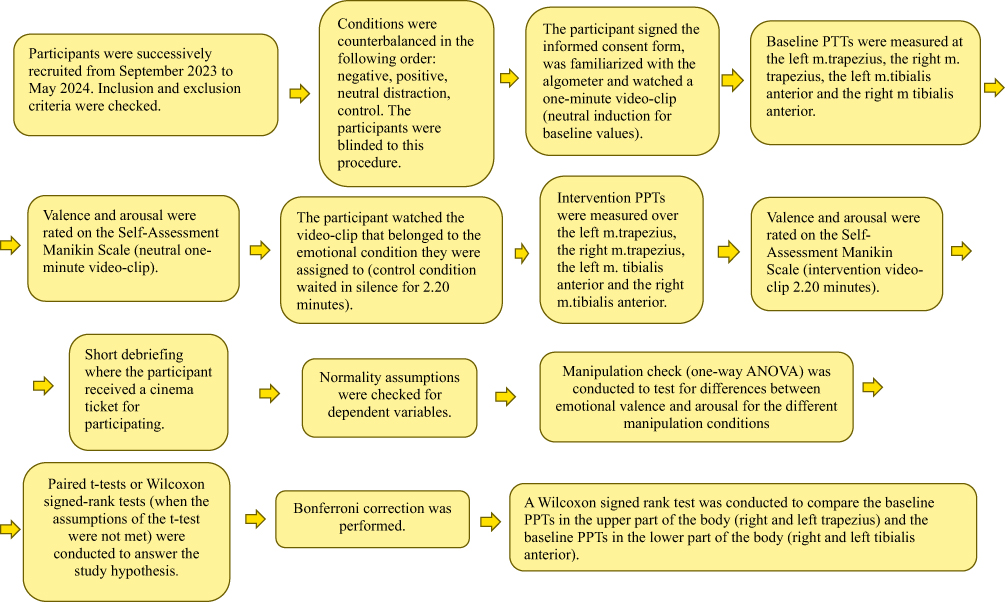 |
Figure 1 Flowchart of study design, procedure and data analysis. |
Pressure Algometry
A manual Somedic algometer (Somedic AB, Sweden), with a tip size area of 1 cm2 and an application rate of 30 kPa/s was used to measure the Pressure Pain Thresholds (PPTs). The application rate and tip size area were chosen from an earlier study.18 For every PPT measurement, three consecutive values were measured, and the mean of the three values was used in statistical analysis. Directly after the baseline and the induction video, the first of the three consecutive PPT values was measured in the left m. trapezius and the PPT value was written down in the protocol, then the second PPT of the consecutive values was measured in the left m. trapezius and the PPT value was written down in the protocol, and then the last PPT value for that location was measured and written down in the protocol. Then, the experimenter started to measure the three consecutive measurements at the right m. trapezius following the same routine; then the three consecutive measures were conducted on the left m. tibialis anterior following the same routine, and then the three consecutive measures were conducted on the right m. tibialis anterior following the same routine. The PPT measurements were conducted over the upper part of the left and right m. trapezius on the location of costae 1 where the m. trapezius muscle is thickest and in the medially thickest part of the left and right m. tibialis anterior. In total, six PPT measurements were conducted at each location (three after baseline and three after induction). The algometer tip was placed at the highest spot on m. trapezius over costa 1 location, and the three consecutive measures were placed beside the first one in a clock-wise circle spaced for 6 measures leaving a space of 1 cm in between the algometer tips. This could easily be done since the algometer tip leaves a light mark on the skin after the exerted pressure. The PPT measures were conducted on the left and right m. tibialis anterior by starting with the tip at the uppermost location over the thickest part of the m. tibialis anterior at the three consecutive baseline measurements. The tip was then moved downward for the next consecutive measure while leaving a place of 1 cm in between for the induction PPT measurement. The same procedure was conducted when measuring the last consecutive measure. In this way, it was possible to make sure that the algometer was not placed on exactly the same spot twice, but as close as possible. The experimenter had earlier experience in performing pressure pain threshold measurements with a handheld algometer in research experiments with standardized written and oral instructions,18 and hand-held algometer testing has shown good validity and reliability measures (r = 0.83 −0.86) for different muscle sites.19
If the pressure exerted by the algometer exceeded 1500 kPa, it was interrupted by the principal investigator to avoid tissue damage. All participants interrupted the pressure before this limit value. From clinical practice it is known that a common pain location is the upper part of the m. trapezius, and a location that is seldom connected with pain is the middle part of the m. tibialis anterior. Therefore, it was considered important to examine PPTs over these regions. Both locations have been used to examine PPTs in several earlier studies.18,20–22
Induction of Emotional States
The participants emotional states were manipulated through videos (2.20 minutes). Negative emotions (condition 1) were induced through a video containing violence. Positive emotions (condition 2) were induced through a humorous video. Neutral emotion induction (condition 3, distraction) was attained through an instructional video about how to paint a house. The mind-wandering control group did not watch any video but was instructed to wait in silence (mind-wandering).
To ensure a neutral mood before all baseline PPT-measurements, an instructional video was shown for 1 minute. The videos were chosen since they matched films used in an earlier study.15 All videos were tested and adjusted at the beginning of the study (pilot part) with a handful of participants. In this adjustment procedure the neutral video was changed from a video containing Swedish nature to an instructional video about how to paint a house. The videos had not been used in any earlier study. The videos could be available upon request from the corresponding author.
Manipulation Check
A manipulation check was conducted. Emotional experience has been described as an interaction between valence (pleasant–unpleasant) and arousal (calm–excited).22 The Self-Assessment Manikin Scale has been extensively used in earlier research, and enables a fast and easy measurement.8,9,23 It has been considered a valid scale to measure picture valence (r = 0.97) in comparison with the semantic differential pleasure score, and (r = 0.94) in comparison with the semantic differential arousal factor.22 It is a 9-value scale consisting of 5 pictures, with each picture and the spaces between the pictures resembling a number from 1–9.22,24
Statistics
An a priori power calculation using G*Power with a power level of 85%, a moderate effect size (dz = 0.5), p < 0.05, in a repeated-measures paired t-test required a sample size of 38 participants in each group (in total, 152 participants). The repeated t-test was selected since we had two repeated measures and no comparisons between groups.
Descriptive statistics were (mean and standard deviation) performed to report the central tendency and distribution of the data. A one-way ANOVA was used to test for differences between emotional valence and arousal for the different manipulation conditions (manipulation check) with significance level p < 0.05. The Wilcoxon signed-rank test was conducted to check for differences in valence and arousal between the baseline condition and the intervention conditions 1, 2 and 3. The Kruskal–Wallis test was used to explore the descriptive variables age and gender between the four different groups (condition 1, condition 2, condition 3, condition 4).
Prior to the data analysis, tests of normality were performed using Kolmogorov–Smirnov and Shapiro–Wilk tests (p > 0.05).
To test the study hypothesis, paired t-tests or Wilcoxon signed-rank tests were conducted. The Wilcoxon signed-rank tests were conducted when the assumptions of the t-test were not met. These tests compared the baseline measurements with the post-induction measurements for each muscle (right m. trapezius, left m. trapezius, right m. tibialis anterior, left m. tibialis anterior) across different conditions (condition 1 negative emotion; condition 2 positive emotion; condition 3 distraction control; condition 4 control). To adjust probability (p) values for minimizing type I error due to multiple comparisons, Bonferroni correction was performed with significance level 0.0125 to control for the family-wise error rate and to ensure the robustness of the study finding. The result is marked with ** if the values are still significant after Bonferroni correction.
Additionally, since it is known from clinical experience that pain is more prevalent over m. trapezius compared to m. tibialis anterior, a Wilcoxon signed-rank test was conducted to compare the baseline PPTs in the upper part of the body (right and left m. trapezius) and the baseline PPTs in the lower part of the body (right and left m. trapezius). Stastical analyses were conducted using SPSS statistics version 30.
Results
Sociodemographic Characteristics
Sociodemographic characteristics (gender and age) for each condition are displayed in Table 1. No significant difference in age H (3) = 4.495, p < 0.213 or gender H (3) = 2.295, p < 0.514 was detected between the four different conditions.
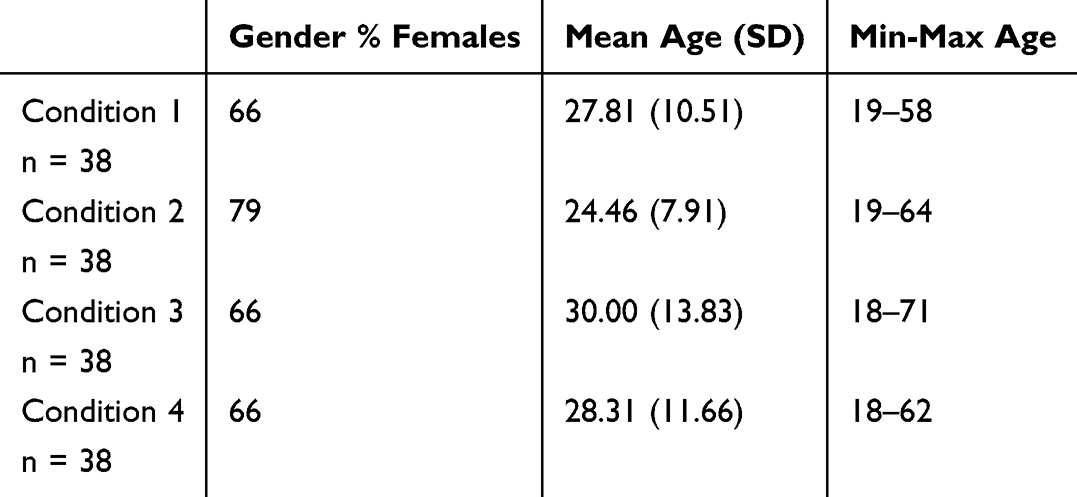 |
Table 1 Gender and Age for Each Condition |
Manipulation Check
Analysis revealed no significant difference between the different groups (baseline) (condition 1 negative emotion; condition 2 positive emotion; condition 3 distraction control; condition 4 mind-wandering control) in the estimated valence F (3) = 0.132, p < 0.941 and the estimated arousal F (3) = 0.602, p < 0.615.
Analysis revealed significant differences between the different groups (intervention) (condition 1, condition 2, and condition 3) in estimated valence F (2) = 73.73, p < 0.001 and arousal F (2) = 53.76, p < 0.001. Pairwise comparisons showed a significant difference between the baseline condition and the intervention condition regarding valence and arousal in condition 1 (negative emotion), z=−4.949, p < .001; z = −5.040 p < 0.001, and between the baseline condition and the intervention condition regarding valence in condition 2 (positive emotion), z=−4.880, p < .001; z=−5.253, p < 0.001. No significant difference was found between the baseline condition and the intervention condition regarding valence in condition 3 (distraction control), z = −.108 p < 0.914; z = −.240 p <0.810 (see Tables 2 and 3 for mean and SD).
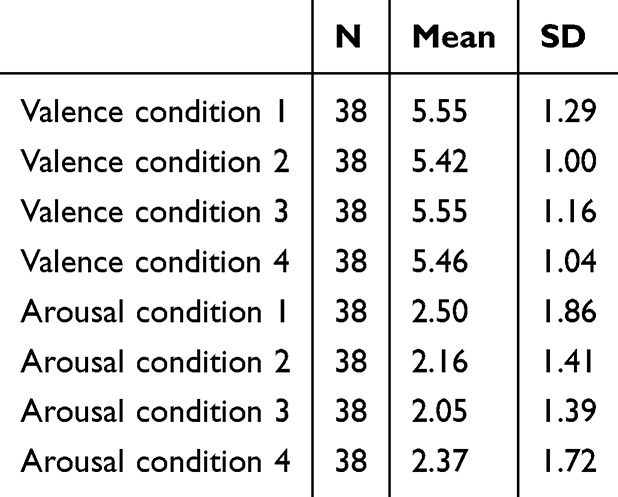 |
Table 2 Mean and SD Manikin Scale Valence and Arousal Baseline for All Four Groups (Condition 1, Condition 2, Condition 3 and Condition 4) |
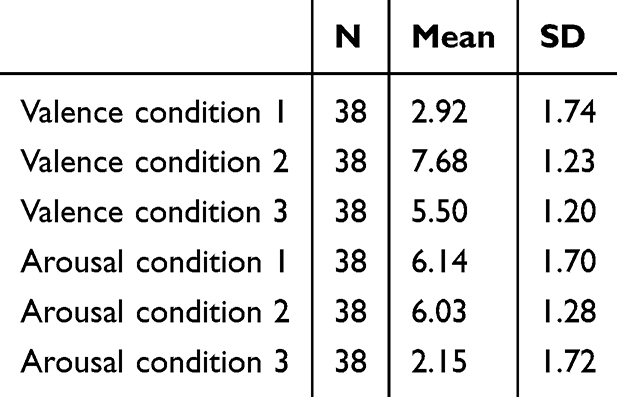 |
Table 3 Mean and SD Manikin Scale Valence and Arousal Induction for All Three Video Induction Groups (Condition 1, Condition 2 and Condition 3) |
Inferential Statistics
In condition 1, Wilcoxon signed-rank test showed significantly lower PPTs after negative emotion induction in the right m. trapezius, z = −342, p = 0.019, rrb = −0.436, the left m. trapezius, z = −2.952, p < 0.003**rrb = −0.549, and the left m. tibialis anterior, z = −4.257, p < 0.001**rrb = −0.549 compared to before the negative emotion induction, but after Bonferroni correction only the PPT values in the left m. trapezius and the left m. tibialis anterior remained significant. A paired t-test showed significant lower PPTs after negative emotion induction in the right m. tibialis anterior, t (37) = 2.55, p < 0.015, Cohen’s d = 0.414, compared to before the negative emotion induction, but after Bonferroni correction the result was no longer significant (Table 4 and Figure 2). Thus, the PPTs after the negative emotion induction were significantly reduced compared to the PPTs before the negative emotion induction in the left m. trapezius and the left m. tibialis anterior. According to the mentioned effect sizes, 54.9% and 54.9% of the ranked data support that the PPTs were lower over the two body locations (left m. trapezius and left m. tibialis anterior) after negative emotion induction. In total, the negative emotion induction lowered the PPTs with large effect sizes in the left m. trapezius and the left m. tibialis anterior.
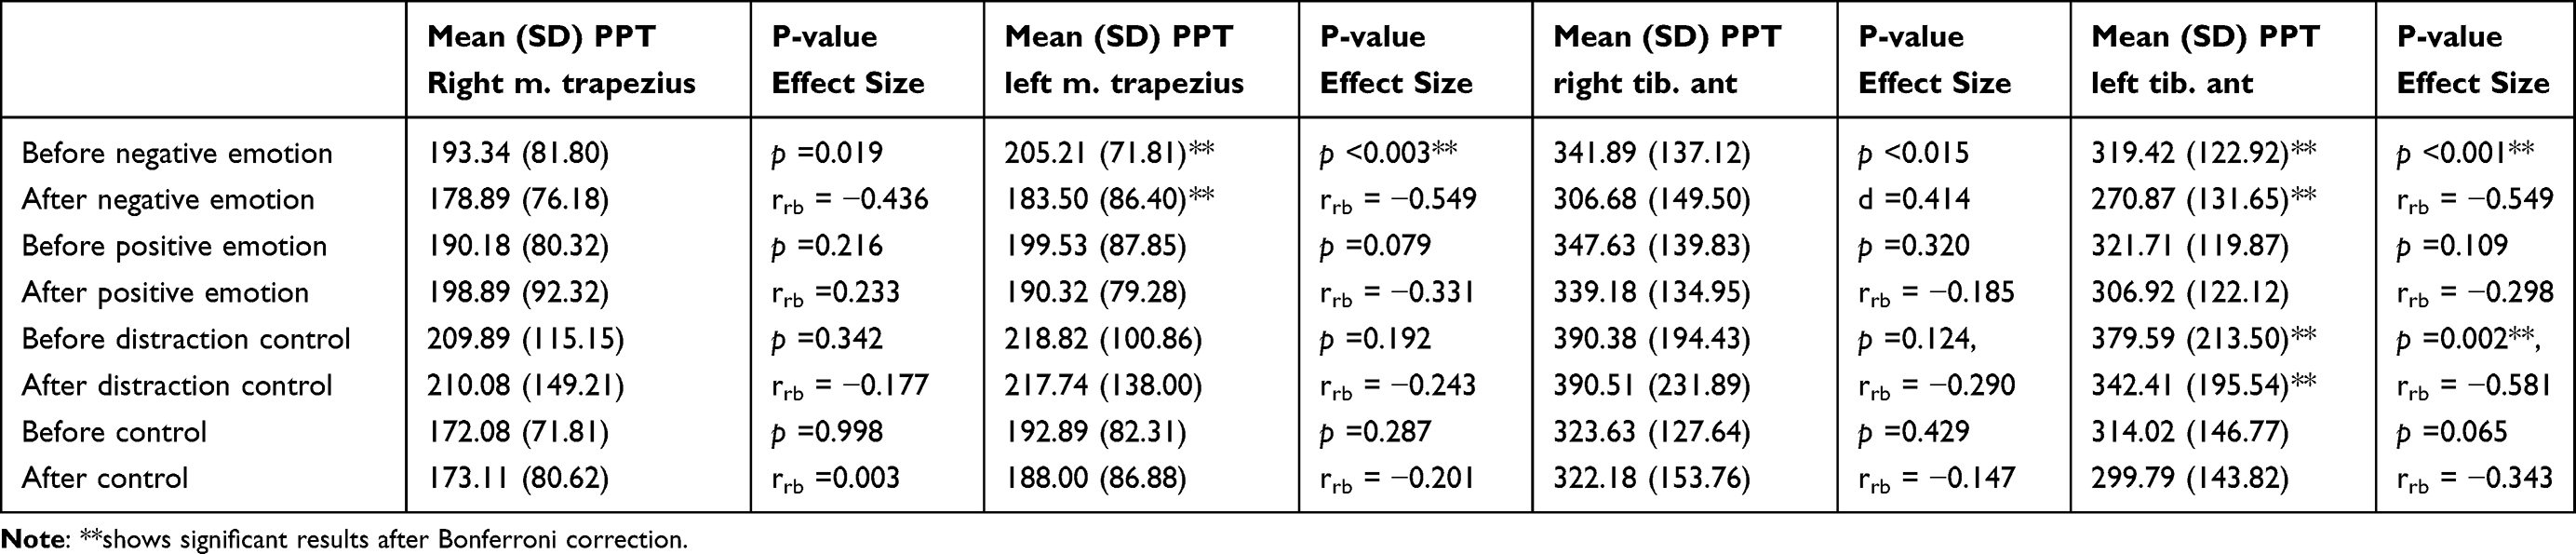 |
Table 4 Means, SD, p-values and Effect Sizes for the Four Different Body Locations (Left Trapezius, Right Trapezius, Left Tibialis Anterior, Right Tibialis Anterior) and Different Conditions (Negative Emotion Induction; Positive Emotion Induction; Distraction Control and Control) |
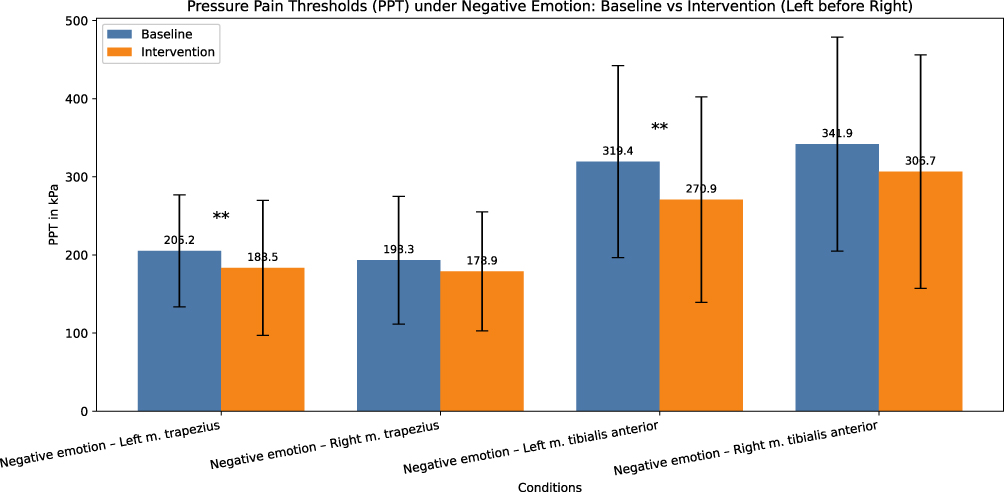 |
Figure 2 Mean PPT values with standard deviations (error bars) from condition 1 (negative emotion). Baseline PPT values left m.trapezius and intervention left m. trapezius, baseline PPT values right m.trapezius and intervention right m. trapezius, baseline PPT values left m. tibialis anterior and intervention left m. tibialis anterior, baseline PPT values right m. tibialis anterior. ** marks the significant differences (p <0.003 left m. trapezius and p <0.001 left m. tibialis anterior). |
In condition 2, Wilcoxon signed rank test showed no significant difference between the PPTs over the right m. trapezius, z = −1237, p = 0.216, rrb = 0.233, left m. trapezius, z = −1748, p = 0.079, rrb = −0.331, right m. tibialis anterior, z = −0.994, p = 0.320, rrb = −0.185 and left m. tibialis anterior, z = −1.603, p = 0.109, rrb = −0.298 was found when comparing before and after the positive emotion induction (Table 4). Thus, no difference in PPT values was detected after inducing positive emotions (mean difference range from 8 to 15).
The Wilcoxon signed-rank test showed no significant difference between the PPTs in the right m. trapezius, z = −0.950, p = 0.342, rrb = −0.177, left m. trapezius, z = −1.305, p = 0.192, rrb = −0.243, the right m. tibialis anterior, z = −1.539, p = 0.124, rrb = −0.290) in condition 3 (mean differences range from 1 to 11). A significant difference was detected between before distraction control and after the distraction control over the left m. tibialis anterior, z = −3.041, p = 0.002**rrb = −0.581) (Table 4 and Figure 3). Thus, the PPTs over the left m. tibialis anterior were significantly reduced after the distraction control induction (mean difference = 37), with 58,1% of ranking data supporting the lower PPTs after distraction induction, but no other body locations showed any difference in PPTs after distraction control induction.
 |
Figure 3 Mean PPT values with standard deviations (error bars) from condition 3 (distraction control). Baseline PPT values left m.trapezius and intervention left m. trapezius, baseline PPT values right m.trapezius and intervention right m. trapezius, baseline PPT values left m. tibialis anterior and intervention left m. tibialis anterior, baseline PPT values right m. tibialis anterior. ** marks the significant difference (p =0.002 left m. tibialis anterior). |
In condition 4, Wilcoxon signed-rank test showed no significant difference between the PPTs in the right m. trapezius, z = −0.015, p = 0.998, rrb = 0.003, the left m. trapezius, z = −1.064, p = 0.287, rrb = −0.201, right m. tibialis anterior, z = −0.790, p = 0.429, rrb = −0.147, and left m. tibialis anterior, z = −1.842, p = 0.065, rrb = −0.343 when comparing before and after the mind-wandering time (Table 4). Thus, no difference in PPTs was detected after waiting for 2 minutes and 20 seconds in silence (mean differences ranged from 1 to 15).
In the baseline measurement, the PPTs in the upper part of the body (right and left m.trapezius) were significantly lower (mean = 395.48, SD = 170.97) compared to the lower part of the body (right and left m.tibialis anterior) (mean = 684,01 SD = 298.37) within participants (n = 152), z = −10.586, p < 0.001.
Discussion
In this experimental study, the effect of negative and positive emotions on PPTs was examined in pain-free individuals. Based on the findings of pain perception from previous studies, we hypothesized that positive emotions would elevate PPTs, and negative emotions would lower PPTs. We found that negative emotions significantly lowered PPTs on the left side of the body (body locations m. trapezius and m. tibialis anterior) with large effect sizes. Positive emotions did not significantly affect PPTs. We found one significant lowered PPT body location (left m. tibialis anterior) in the distraction control condition. It could be speculated that lateralization of pain towards the left side of the body depended on right hemispheric amygdala processing negative emotionally laden content, while the left hemispheric amygdala was less prominent in nociceptive processing and negative emotionally laden content or even active in processing positive emotions.25–27 Perhaps, this could explain the lateralization of negative emotions sensitizing the PPTs in this study, even though it must be mentioned that the literature is inconclusive, with studies also supporting a left side hemispheric processing of pain-related content.28 Negative emotions, such as pain-related fear, have been associated with increased pain intensity in clinical pain states in previous studies.2,29,30 Descending pain modulation from the endogenous opioid system regulates the neurotransmission in the spinal cord, thereby facilitating sensitization of PPTs.31 If fluctuating emotional states affected by everyday living continuously alters pain thresholds, it could be speculated that the transition from acute to chronic pain could be facilitated in cases where negative emotional states persist over time in individuals experiencing acute pain. As a practical implication, some exposure to negative emotional engaging events might be possible to avoid when experiencing acute pain. It could be important knowledge for caregivers within the health care system to provide an emotionally positive experience during examinations and treatments of patients with pain. Another practical implication could be to encourage patients to watch pleasant emotional content when a short-lasting painful treatment must be endured.
According to the manipulation check, participants in the distraction control condition seem to have experienced the distraction control video as neutral in valence and low in arousal. That means it was regarded as a quite weak emotional arousing external stimulus. Even though this was an experimental setting with a controlled environment with induction and measurements, we could never control internal brain processes that could vary, both in response to external stimuli and internal stimuli (for example, memory processes and unconscious processes). Perhaps, such internal processes could influence descending pain modulatory systems when the external stimuli were too boring in character to give an emotionally aroused state, since unconscious processes have been shown to impact our thoughts and emotions.32,33 Since we found no PPT sensitization in the mind-wandering control condition, it seemed better to engage in free mind-wandering than enduring a somewhat boring, low arousal external stimulus.
The sensitivity to pressure was significantly lower over the m. trapezius region compared to the m. anterior tibialis region, which is consistent with the clinical picture pain is more commonly experienced over the m. trapezius region in the population compared to the m. tibialis anterior region. Despite this, we observed the largest effect size over the left m. tibialis anterior. It was unexpected that the largest effect size would be found in a clinically less sensitive body part.
The results that negative emotions sensitized PPTs are in line with some earlier studies, where negative emotions significantly decreased pain tolerance and increased pain intensity in pain-free individuals,7,13,15 the nociceptive flexion reflex was significantly increased,9,23 and significant negative associations were found between psychological distress and lower mechanical pain thresholds.16 The results of our study were somewhat inconclusive compared to another study,26 where they found that participants with induced depressed moods showed significantly lower pain tolerance and higher pain catastrophizing scores compared to participants in neutral moods, but pain thresholds measured in a cold pressor apparatus were not affected. The inconclusiveness between this study and the other study26 could perhaps be explained by the different measurement procedures. The cold pressor apparatus has been used to test both pain threshold and pain tolerance and has shown good reliability34 but to the best of our knowledge, the cold pressor apparatus has not been validated to measure pain thresholds, while pressure algometry has been validated to test pain thresholds.35
We found no effect of induced positive mood on PPTs. This is to some extent in line with earlier studies, where one study reported that a positive mood decreased the perceived unpleasantness of induced heat pain, but the pain intensity rating was not affected.14 It could be argued that perceived pain intensity when experiencing positive emotions could be represented more in cortical networks (for example the ACC) while pain thresholds more reflect descending modulatory processes affecting the spinal dorsal horn.5,36 In the former study, the mood states were induced by different odors, compared to videos in our study and this could affect the brain differently. Rhudy et al,8,9 reported that a positive emotional state induced from picture viewing significantly decreased pain ratings and inhibited the nociceptive flexion reflex in healthy participants. Roy et al,13 also reported lower pain ratings in positive mood induction compared to neutral mood induced with different picture content. Perhaps, the participants in our study did not find the video with positive content humorous enough to affect the descending pain modulatory system and thereby the PPTs. Although the manipulation check showed that the videos were rated significantly different regarding negative, positive and neutral valence and they were chosen from the description of film fragments used in an earlier study,15 the positive valence was rated as differing slightly less from the neutral baseline state compared to the negative valence rating (2.18 and 2.58 steps, respectively). The Self-Assessment Manikin Scale was used as the manipulation check to rate the valence and arousal in the presented videos. Although, this scale is well validated it could be new to a participant to understand the difference between emotional valence and arousal. The difference was clearly described to each participant, but perhaps these new terms could have influenced some participant’s estimations. A strength of our study was the power level of 85%, and the experimental design with two control groups, to control for the distraction elicited from the videos and the spontaneous shifts in the brain’s continuous dynamic processing of internal and external events. Due to the nature of the quasi-randomized trial conducted among specific populations, the study results cannot be generalized to a larger population. This limitation arises also from the lack of control over all confounding variables that may influence the pressure pain threshold. For example, a clear limitation in our study was the uneven gender distribution with more women than men. We also had an uneven gender distribution between the groups, with more women than men in condition 2 (positive emotion condition). This is important to consider since emotional processes (activation patterns in the brain, expression of emotions) differ between women and men,37 and females show more sensitivity to pain than males.38,39 In this study, data was not analyzed separately for males and females, since the power would be too low to allow any meaningful conclusion from the results.40 In future studies it is advisable to stratify samples based on socio-demographic characteristics, which can impact both negative and positive emotional induction as well as pressure pain thresholds. Another limitation in our study is that we did not control factors such as exercise before the test session, current sleep quality, caffeine/nicotine use before the test or previous experienced anxiety or depression41–44 These factors could influence mood, but in a within-subjects design these factors matter less than in a between-subjects design. To ensure a baseline mood state at the test session, all participants watched a baseline video before the baseline PPT measurement. Another limitation is that the PPT measurement order was not balanced between participants, but instead the fixed order (left m. trapezius, right m. trapezius, left m. tibialis anterior, right m. tibialis anterior) was conducted in all participants. This could produce systematic effects that would affect the PPT measurements due to the time factor from watching the video. Strengthening the fact that this did not happen in this study is the result that only the PPTs on the left side of the body were affected by negative emotions. Another future advice is to double blind studies investigating PPTs to reduce any risk of impact from the experimenter or the participants. Our study was only single blinded, and this must be considered as a strong limitation. Another future improvement could be to have both male and female experimenters to minimize experimenter bias connected to gender. Earlier studies have reported a significant effect on pain intensity and pain tolerance measures in relation to experimenter gender.45,46 Most participants were students at the university, but since the laboratory was situated in the middle of the campus, the students came from different departments of the university and did not know the test leader as a teacher.
The self-assessment manikin scale was used to measure the accuracy of the induced emotions in our study. A self-assessment tool offers limited psychometric information, and therefore an improvement in future studies could be to use a physiological measure, such as skin conductance or variations in heart rate, as well. Due to non-normal data distribution, non-parametric tests were used in this study. Future studies should consider Linear Mixed-Effects Models or Repeated Measures ANOVA, if assumptions are met, for more robust analysis accounting for within-subject variability and covariates. We also recommend considering less conservative correction methods than the Bonferroni correction in future studies, such as the Holm-Bonferroni and Benjamini–Hochberg procedures, to better balance type I and type II errors.
Conclusion
The result of this study could verify our hypothesis that negative emotional states would lower PPTs in pain-free individuals in the specific body locations, left m. trapezius and left m. tibialis anterior, with large effect sizes. The large effect sizes found in relation to the perceived negative emotions could be interpreted as meaningful differences for everyday living.
Data Sharing Statement
The deidentified data material is shared in Open Science Foundation repository https://doi.org/10.17605/OSF.IO/2ZY7H. The data will be public with no end date. The videos used in the study will be available upon request to the corresponding author.
Ethical Committee Approval
All participants signed an informed consent form, and the study was approved by the Swedish Ethical Review Authority (code: 2023-03968-01). This study was conducted in compliance with the Declaration of Helsinki.
Funding
This study received funding from Värkstadsstiftelsen.
Disclosure
The authors declare that they have no conflict of interest in this work.
References
1. Gunnarsson H, Safipour J, Elmqvist C, Lindqvist G. Different pain variables could independently predict anxiety and depression in subjects with chronic musculoskeletal pain. Scandinavian J Pain. 2021;21:274–12. doi:10.1515/sjpain-2020-0129
2. Rogers AH, Farris SG. A meta-analysis of the associations of elements of the fear-avoidance model of chronic pain with negative affect, depression, anxiety, pain-related disability and pain intensity. Eur J Pain. 2022;26:1611–1635. doi:10.1002/ejp.1994
3. Farmer M, Baliki MN, Apkarian AV. A dynamic network perspective of chronic pain. Neurosci Lett. 2012;29:197–203. doi:10.1016/j.neulet.2012.05.001
4. De Ridder D, Adhia D, Vanneste D. The anatomy of pain and suffering in the brain and its clinical implications. Neurosci Biobehav Rev. 2021;130:125–146.
5. Yao D, Chen Y, Chen G. The role of pain modulation pathway and related brain region in pain. Rev Neurosci. 2023;34(8):899–914. doi:10.1515/revneuro-2023-0037
6. Fairhurst M, Wiech K, Dunckley P, Tracey I. Anticipatory brainstem activity predicts neural processing of pain in humans. Pain. 2007;128:101–110. doi:10.1016/j.pain.2006.09.001
7. Carter LE, McNeil DW, Vowles KE, et al. Effects of emotion on pain reports, tolerance and physiology. Pain Res Manage. 2002;7:21–30. doi:10.1155/2002/426193
8. Rhudy JL, Williams AE, McCabe KM, Rambo PL, Russel JL. Emotional modulation of spinal nociception and pain: the impact of predictable noxious stimulation. Pain. 2006;126:221–233. doi:10.1016/j.pain.2006.06.027
9. Rhudy JL, Williams AE, McCabe KM, Russel JL, Russel JL, Maynard LJ. Emotional control of nociceptive reactions (ECON): do affective valence and arousal play a role? Pain. 2008;136:250–261. doi:10.1016/j.pain.2007.06.031
10. Amiri M, Esmaili H, Hamad AH, Alavinia M, Masani K, Kumbhare D. Nociceptive flexion reflex threshold in chronic pain patients: a needed update for the current evidence. Am J Phys Med Rehabil. 2021;100:750–759. doi:10.1097/PHM.0000000000001626
11. Skiljarevsky V, Ramadan NM. The nociceptive flexion reflex in humans – review article. Pain. 2002;96:3–8. doi:10.1016/S0304-3959(02)00018-0
12. Bjornskov Mikkelsen M, Neumann H, Rask Buskbjerg C, et al. The effect of experimental emotion induction on experimental pain: a systematic review and meta-analysis. Pain. 2024;164:e17–e38. doi:10.1097/j.pain.0000000000003073
13. Roy M, Lebuis A, Peretz I, Rainville P. The modulation of pain by attention and emotion: a dissociation of perceptual and spinal nociceptive processes. Eur. J. Pain. 2011;15:641.e1–641.e10. doi:10.1016/j.ejpain.2010.11.013
14. Villemure C, Slotnick BM, Bushnell MC. Effects of odors on pain perception: deciphering the roles of emotion and attention. Pain. 2003;106:101–108. doi:10.1016/S0304-3959(03)00297-5
15. van Laarhoven AIM, Walker AL, Wilder-Smith OH, et al. Role of induced negative and positive emotions in sensitivity to itch and pain in women. Br J Dermatol. 2012;167:262–269. doi:10.1111/j.1365-2133.2012.10933.x
16. Grundström H, Larsson B, Arendt-Nielsen L, Gerdle B, Kjölhede P. Pain catastrophizing is associated with pain thresholds for heat, cold, and pressure in women with chronic pelvic pain. Scand J Pain. 2020;20:635–646. doi:10.1515/sjpain-2020-0015
17. Martinez-Calderon J, Meeus M, Struyf F, et al. Psychological factors are associated with local and generalized pressure pain hypersensitivity, pain intensity, and function in people with chronic shoulder pain: a cross-sectional study. Musculoskeletal Sci Pract. 2019;44:102064. doi:10.1016/j.msksp.2019.102064
18. Gunnarsson H, Grahn B, Agerström J. Increased deep pain sensitivity in persistent musculoskeletal pain but not in other musculoskeletal pain states. Scandinavian J Pain. 2016;13:1–5. doi:10.1016/j.sjpain.2016.05.032
19. Jørgensen R, Ris I, Falla D, Juul-Kristensen B. Reliability, construct and discriminative validity of clinical testing in subjects with and without chronic neck pain. BMC Musculoskeletal Disord. 2014;15:408. doi:10.1186/1471-2474-15-408
20. O’Neill S, Manniche C, Graven-Nielsen T, Arendt-Nielsen L. Generalized deep-tissue hyperalgesia in patients with chronic low-back pain. Eur J Pain. 2007;11:415–420. doi:10.1016/j.ejpain.2006.05.009
21. O’Neill S, Kjær P, Graven-Nielsen T, Manniche C, Arendt-Nielsen L. Low pressure pain thresholds are associated with, but does not predispose for, low back pain. Eur Spine J. 2011;20:2120–2125. doi:10.1007/s00586-011-1796-4
22. Bradley MM, Lang PJ. Measuring emotion: the self-assessment manikin and the semantic differential. J Behav Ther Exp Psychiatry. 1994;25:49–59. doi:10.1016/0005-7916(94)90063-9
23. Rhudy JL, Bartley E, Williams AE. Habituation, sensitization, and emotional valence modulation of pain responses. Pain. 2010;148:320–327. doi:10.1016/j.pain.2009.11.018
24. Liu P, Wang Y, Hu J, Qing L, Zhao K. Development and validation of a highly dynamic and reusable picture-based scale: a new affective measurement tool. Front Psychol. 2023;13:1078691. doi:10.3389/fpsyg.2022.1078691
25. Heather NA, Bobnar HJ, Kolber BJ. Left and right hemispheric lateralization of the amygdala in pain. Prog Neurobiol. 2021;196:101891. doi:10.1016/j.pneurobio.2020.101891
26. Willoughby SG, Hailey BJ, Mulkana S, Rowe J. The effect of laboratory-induced depressed mood state on responses to pain. Behav Med. 2002;28:23–31. doi:10.1080/08964280209596395
27. Wyczesanya M, Capotostob P, Zappasodib F, Preted G. Hemispheric asymmetries and emotions: evidence from effective connectivity. Neuropsychologica. 2018;121:98–105. doi:10.1016/j.neuropsychologia.2018.10.007
28. Toutain TGLO, Alba G, Miranda JGV, Silva Do Rosario R, Munoz M, Ponde de Sena E. Brain assymetry in pain affective modulation. Pain Med. 2022;23(4):686–696. doi:10.1093/pm/pnab232
29. Vlaeyen JW, Linton SJ. Fear-avoidance and its consequences in chronic musculoskeletal pain: a state of the art. Pain. 2000;85:317–332. doi:10.1016/S0304-3959(99)00242-0
30. Vlaeyen JW, Linton SJ. Fear-avoidance model of chronic musculoskeletal pain: 12 years on. Pain. 2012;153:1144–1147. doi:10.1016/j.pain.2011.12.009
31. Francois A, Low SA, Sypek EI, et al. A brainstem-spinal cord inhibitory circuit for mechanical pain modulation by GABA and enkephalins. Neuron. 2017;93:822–839. doi:10.1016/j.neuron.2017.01.008
32. Gazzaniga MS, Ivry RB, Mangun GR. Cognitive Neuroscience: The Biology of the Mind.
33. Pelaez I, Ferrera D, Barjola P, Fernandez R, Mercado F. Subliminal emotional pictures are capable of modulating early cerebral responses to pain in fibromyalgia. PLoS One. 2019;14:e0217909. doi:10.1371/journal.pone.0217909
34. Kinser AM, Sands WA, Stone MH. Reliability and validity of a pressure algometer. J Strength Cond Res. 2009;23:312–314. doi:10.1519/jsc.0b013e31818f051c
35. Koenig J, Jarczok MN, Ellis RJ, Bach C, Thayer JF, Hilleke TK. Two-week test–retest stability of the cold pressor task procedure at two different temperatures as a measure of pain threshold and tolerance. Pain Pract. 2014;14:E126–E135. doi:10.1111/papr.12142
36. Butler RK, Finn DP. Stress-induced analgesia. Prog Neurobiol. 2009;88:184–202. doi:10.1016/j.pneurobio.2009.04.003
37. Kret ME, De Gelder B. A review on sex differences in processing emotional signals. Neuropsychologia. 2012;50:1211–1221. doi:10.1016/j.neuropsychologia.2011.12.022
38. Apkhazava M, Kvachadze I, Tsagareli M, Chakhnashvili M. Sex differences in response to experimentally induced pain. Georgian Med News. 2019;287:119–124.
39. Pieretti S, Di Giannuario A, Di Giovannandrea R, et al. Gender differences in pain and its relief. Ann Ist Super Sanità. 2016;52:184–189. doi:10.4415/ANN_16_02_09
40. Button K, Ioannidis J, Mokrysz C, et al. Power failure: why small sample size undermines the reliability of neuroscience. Nat Rev Neurosci. 2013;14:365–376. doi:10.1038/nrn3475
41. Hoffman MD, Shepanski MA, Ruble SB, Valic Z, Buckwalter JB, Clifford PS. Intensity and duration threshold for aerobic exercise–induced analgesia to pressure pain. Arch Phys Med Rehabil. 2004;85:1183–1187. doi:10.1016/j.apmr.2003.09.010
42. Overstreet DS, Penn TM, Cable ST, Aroke EN, Goodin BR. Higher habitual dietary caffeine consumption is related to lower experimental pain sensitivity in a community-based sample. Psychopharmacology. 2018;235:3167–3176. doi:10.1007/s00213-018-5016-3
43. Girdler SS, Maixner W, Naftel HA, Stewart PV, Moretza RL, Light KC. Cigarette smoking, stress-induced analgesia and pain perception in men and women. Pain. 2005;114:372–385. doi:10.1016/j.pain.2004.12.035
44. Liao C, Tan Y, Wang K, et al. The impact and correlation of anxiety and depression on pressure pain threshold of acupoints in patients with chronic pelvic inflammatory disease. Pain Res Manag. 2023;21:3315090.
45. Aslaksen PM, Myrbakk IN, Høifødt RS, Flaten MA. The effect of experimenter gender on autonomic and subjective responses to pain stimuli. Pain. 2007;129:260–268. doi:10.1016/j.pain.2006.10.011
46. Kallai I, Barke A, Voss U. The effects of experimenter characteristics on pain reports in women and men. Pain. 2004;112:142–147. doi:10.1016/j.pain.2004.08.008
 © 2026 The Author(s). This work is published and licensed by Dove Medical Press Limited. The
full terms of this license are available at https://www.dovepress.com/terms
and incorporate the Creative Commons Attribution
- Non Commercial (unported, 4.0) License.
By accessing the work you hereby accept the Terms. Non-commercial uses of the work are permitted
without any further permission from Dove Medical Press Limited, provided the work is properly
attributed. For permission for commercial use of this work, please see paragraphs 4.2 and 5 of our Terms.
© 2026 The Author(s). This work is published and licensed by Dove Medical Press Limited. The
full terms of this license are available at https://www.dovepress.com/terms
and incorporate the Creative Commons Attribution
- Non Commercial (unported, 4.0) License.
By accessing the work you hereby accept the Terms. Non-commercial uses of the work are permitted
without any further permission from Dove Medical Press Limited, provided the work is properly
attributed. For permission for commercial use of this work, please see paragraphs 4.2 and 5 of our Terms.
Recommended articles
Pain Empathy and Its Association with the Clinical Pain in Knee Osteoarthritis Patients
Zhao R, Ji Y, Li J, Li X, Wu T, Wu H, Liu C
Journal of Pain Research 2022, 15:4017-4027
Published Date: 19 December 2022
Opioid Receptor Mu 1 Gene (OPRM1) A118G Polymorphism and Emotional Modulation of Pain
Trimble EA, Kell PA, Avella MA, France CR, Rhudy JL
Journal of Pain Research 2024, 17:489-500
Published Date: 1 February 2024