
Back to Journals » International Journal of Nanomedicine » Volume 21
MRI Monitored Mn-THPPmPEG12-Guided Phototherapy Elicits Abscopal Immunity and Synergizes with PD-1 Blockade in Triple-Negative Breast Cancer in Mice Model
Authors Bai L  , Ma M, Yuan W, Bo S, Xiao Z , Zhang D , Zhong X, Zeng J, Shi C, Luo L
Received 22 March 2026
Accepted for publication 23 June 2026
Published 8 July 2026 Volume 2026:21 608363
DOI https://doi.org/10.2147/IJN.S608363
Checked for plagiarism Yes
Review by Single anonymous peer review
Peer reviewer comments 2
Editor who approved publication: Professor Farooq A. Shiekh
Le Bai,1,* Mengjie Ma,2,* Wenxia Yuan,1,* Shaowei Bo,3 Zeyu Xiao,1 Dong Zhang,1 Xing Zhong,1 Junjie Zeng,4 Changzheng Shi,1 Liangping Luo1,4
1Department of Medical Imaging Center, The First Affiliated Hospital of Jinan University, Guangzhou, Guangdong, People’s Republic of China; 2Department of Minimally Invasive Interventional Radiology, State Key Laboratory of Oncology in South China, Guangdong Provincial Clinical Research Center for Cancer, Collaborative Innovation Center for Cancer Medicine, Sun Yat-Sen University Cancer Center, Guangzhou, Guangdong, People’s Republic of China; 3Department of Nuclear Medicine, The Affiliated Guangdong Second Provincial General Hospital of Jinan University, Guangzhou, Guangdong, People’s Republic of China; 4Department of Medical Imaging Center, The Fifth Affiliated Hospital of Jinan University, Heyuan, Guangdong, People’s Republic of China
*These authors contributed equally to this work
Correspondence: Liangping Luo, Department of Medical Imaging Center, The Fifth Affiliated Hospital of Jinan University, Heyuan, Guangdong Province, People’s Republic of China, Email [email protected] Changzheng Shi, Department of Medical Imaging Center, the First Affiliated Hospital of Jinan University, No. 613 West Huangpu Road, Guangzhou, Guangdong Province, People’s Republic of China, Email [email protected]
Purpose: The study was to develop a clinical-translational theranostic photosensitizer, Mn-THPPmPEG12, for multiparametric MRI-monitored photodynamic therapy (PDT) of triple-negative breast cancer (TNBC), and to evaluate its potential to elicit abscopal immunity and synergize with PD-1 blockade.
Methods: Mn-THPPmPEG12 was synthesized and characterized, and its MRI contrast capability was evaluated. A primary TNBC mouse model was established, and the PDT efficacy of Mn‑THPPmPEG12 was evaluated using intravoxel incoherent motion‑diffusion weighted imaging (IVIM‑DWI) and blood oxygen level‑dependent MRI (BOLD‑MRI), with final pathological analyses performed for validation. Subsequently, a bilateral TNBC mouse model was established to investigate the abscopal immune response in distant tumors following PDT of primary tumors, as well as the synergistic efficacy of combining PDT with anti‑PD‑1 blockade. Throughout the treatment, MRI served as a non-invasive method for real-time monitoring of therapeutic response.
Results: Mn-THPPmPEG12 exhibited excellent water solubility and high T1 relaxivity (r1 = 4.47 mM− 1·s− 1). Mn-THPPmPEG12-mediated PDT significantly inhibited primary TNBC growth, with MRI parameters (D, D*, f, and R2*) correlating strongly with pathological findings. Notably, PDT triggered an abscopal effect in a bilateral TNBC mouse model, increasing CD8⁺ T cell infiltration and PD-1 expression in distant tumors. Combined with anti-PD-1 blockade, the therapy showed superior efficacy against both primary and distant tumors, with parameter D enabling early detection of treatment response.
Conclusion: Mn-THPPmPEG12 serves as a potent theranostic platform that enables precise MRI-monitored PDT. The PDT mediated by Mn-THPPmPEG12 elicits an abscopal immune effect and synergizes with PD-1 blockade to enhance TNBC treatment.
Keywords: Mn-THPPmPEG12, photodynamic therapy, immune checkpoint inhibitors, magnetic resonance imaging, triple-negative breast cancer
Introduction
Triple-negative breast cancer (TNBC) is a distinct subtype of breast cancer characterized by the absence of estrogen receptor (ER), progesterone receptor (PR), and human epidermal growth factor receptor 2 (HER2) expression. It accounts for approximately 15–20% of all breast cancer cases.1,2 Due to its unique biological features, TNBC does not benefit from endocrine therapy or conventional targeted treatments such as trastuzumab.3 Therefore, patients with TNBC experience worse overall and cause-specific survival outcomes than those with non-triple-negative breast cancer. Notably, the median overall survival (OS) for patients with metastatic TNBC is about 12–18 months.4 Owing to its high aggressiveness, TNBC is more prone to brain and lung metastases and locoregional recurrence (with a higher risk within two years post-diagnosis), making it the breast cancer subtype with the poorest prognosis.5–7 Thus, there is an urgent need to develop novel therapeutic strategies for TNBC.
Photodynamic therapy (PDT) has emerged as a rapidly developing anticancer modality in recent years, offering advantages such as minimal invasiveness, rapid response, high selectivity, low systemic toxicity, and absence of cumulative side effects.8,9 As one of the essential components of PDT, photosensitizers play a critical role in determining its treatment efficacy. Porphyrin derivatives are among the most widely used clinical photosensitizers.10,11 Porphyrins exhibit inherent tumor-targeting properties, which are attributed to mechanisms such as the enhanced permeability and retention (EPR) effect.12,13 However, most existing photosensitizers tend to aggregate in aqueous environments and suffer from poor water solubility.14 Furthermore, the high selectivity of PDT and limited tissue penetration of light restrict its efficacy in treating multifocal and deep-seated metastatic lesions. Therefore, developing porphyrin-based photosensitizers that are hydrophilic and have minimal side effects holds significant importance for their clinical translation. Specifically, polyethylene glycol (PEG) conjugated porphyrin derivatives, such as the novel agent Mn-THPPmPEG12, exhibit enhanced water solubility and prolong blood circulation time, leading to superior tumor accumulation via the EPR effect. Additionally, the incorporation of manganese (Mn) ions not only influences the photochemical properties of the porphyrin core but also provides T1 enhancement, allowing for the non-invasive monitoring of photosensitizer accumulation.15 Beyond monotherapy, combination strategies with non-overlapping toxicity profiles are being actively explored to enhance the therapeutic efficacy of PDT.
Studies have shown that local PDT for tumor treatment can elicit broad systemic immune responses, including the induction of acute-phase proteins, release of pro-inflammatory cytokines, and systemic neutrophilia, among other inflammatory reactions.16–18 Under light irradiation, photosensitizers generate reactive oxygen species (ROS) that not only directly eradicate tumor cells but also trigger endoplasmic reticulum stress (ERS), promoting calreticulin (CRT) surface exposure to elicit immunogenic cell death (ICD).19 As one of the major mechanisms underlying PDT-induced antitumor immunity, ICD is characterized by the active release of damage-associated molecular patterns (DAMPs) (eg, CRT translocation and HMGB1 release) from dying cells.20,21 By being released into the extracellular space or exposed on the surface of dying cells, these DAMPs efficiently recruit and mature dendritic cells (DCs), thereby promoting subsequent tumor antigen presentation. DCs capture tumor-associated antigens, migrate to tumor-draining lymph nodes, and present tumor antigens to T cells. This process stimulates T cell proliferation and activation, triggering the secretion of a diverse array of cytokines that ultimately culminate in a tumor-specific immune response.22–24 Ultimately, the expanded tumor-specific CD8+ T cells circulate systemically and infiltrate non-irradiated sites, exerting an abscopal effect against distant metastases.25 This process reshapes the tumor microenvironment (TME) by activating DCs, expanding antitumor T cells, and elevating cytokine levels, thereby converting an immunologically “cold” and suppressive milieu into a “hot” and responsive one to potentially enhance immunotherapy efficacy.26,27 Therefore, the local and systemic immune activation induced by PDT provides a favorable foundation for combination with ICIs, which can further relieve T-cell inhibition and sustain antitumor immunity.28,29 This strategy is especially promising for immunologically “cold” TNBC, where PDT-induced immune activation creates a therapeutic window for ICIs to sustain and amplify anti-tumor immunity.Although morphological imaging remains the mainstay of tumor staging and treatment response assessment, morphological alterations typically lag behind functional changes. Biopsy remains the most accurate method for evaluating therapeutic response.30 However, its invasive nature precludes its use for real-time and longitudinal monitoring of therapeutic responses. Among non-invasive imaging modalities, computed tomography (CT) and positron emission tomography/computed tomography (PET/CT) involve ionizing radiation, which limits their applicability for repeated and longitudinal assessments. Although ultrasonography is free of ionizing radiation, its limited sensitivity to alterations in the TME restricts its utility for the early and quantitative assessment of tumor treatment response. As a non-ionizing and non-invasive modality, magnetic resonance imaging (MRI) is instrumental in real-time tracking of TME dynamics, assessing therapeutic efficacy, and predicting prognosis.31,32 MRI-guided photothermal/photodynamic immunotherapy combined with PD-1 blockade has been reported to enable real-time monitoring of treatment response and enhance therapeutic efficacy in melanoma and metastatic models.33 Among current MRI techniques, intravoxel incoherent motion diffusion-weighted imaging (IVIM-DWI) employs a bi-exponential model to decouple pure molecular diffusion from microvascular perfusion fraction, thereby enabling quantitative assessment of tumor cellularity and microvascular perfusion.34–36 Meanwhile, contrast agent-free blood oxygen level-dependent MRI (BOLD-MRI) reflects tissue deoxyhemoglobin content and serves as a valuable tool for detecting tumor hypoxia, a key factor influencing PDT efficiency and immune cell activity.37–39 Herein, we utilized IVIM-DWI and BOLD-MRI to noninvasively monitor the therapeutic efficacy of PDT, either alone or in combination with anti-PD-1 blockade, as well as the dynamic changes in the TME in a TNBC mouse model, with the aim of providing noninvasive imaging tools for personalized treatment management.
Materials and Methods
Synthesis of Mn-THPPmPEG12
The synthetic route is illustrated in Figure S1. Compound 3-TosO (CH2CH2O)12CH3 was synthesized according to the method reported in literature.40 Compound 4 (0.47 g, 0.7 mmol) and anhydrous K2CO3 (0.77 g, 5.6 mmol) were added to a reaction flask, followed by DMF (30 mL), the a solution of compound 3 (3.0 g, 4.2 mmol) in DMF (10 mL) was added. The reaction mixture was heated at 60°C for 24 hours. After completion, 100 mL of deionized water was added, and the mixture was extracted with DCM (100 mL × 3). The combined organic layers were dried over anhydrous Na2SO4, filtered, and purified by column chromatography (CH2Cl2/MeOH = 20:1) to afford compound 5 (1.43 g, yield:72%). Finally, compound 5 (711 mg, 0.25 mmol) and MnCl2·4H2O (490 mg, 5.0 mmol) were dissolved in a mixed solvent of CH3OH and water (40 mL). The mixture was heated to a gentle reflux, and the reaction progress was monitored by UV-Vis. Upon completion, the reaction was cooled to room temperature, extracted with DCM (100 mL × 3), and the combined organic layers were dried over anhydrous Na2SO4. After filtration and concentration under reduced pressure, the residue was dried in vacuo to yield the Mn-THPPmPEG12 as a brown viscous liquid (590 mg, 82% yield). Subsequently, the structure and composition of the synthesized compound were characterized.
The Tissue Culture Studies Using 4T1 Cells and Mouse
4T1 murine mammary carcinoma cells (Cat# CL-0007) were purchased from Procell Life Science & Technology Co., Ltd. (Wuhan, China). The cells were cultured in IMDM medium supplemented with 10% fetal bovine serum (FBS) at 37°C in a 5% CO2 incubator and passaged using a trypsin-EDTA mixture.
All animal studies were conducted in accordance with the guidelines approved by the Animal Experimentation Ethics Committee of Jinan University (NO. IACUC-20220622-04). Female BALB/c mice and BALB/c nude mice (aged 4–5 weeks) were purchased from Vitalriver Inc. (Beijing, China) and maintained under specific pathogen-free conditions.
The in vitro Studies Using 4T1 Cells
4T1 cells in the logarithmic growth phase were seeded into 96-well plates at a density of 2×10⁵ cells/mL (100 μL) and cultured for 24 h. Different concentrations of Mn-THPPmPEG12 solution (1000, 500, 250, 125, 62.5 and 31.25 μg/mL) were added to the 96-well plates as experimental groups (light group and dark group). And, a control group (cells cultured with only blank medium) was set up. The irradiated condition was 650 nm, 600 mW, 5 min. After 24 h, the medium was replaced with 100 μL of MTT, and the cells were incubated for another 4 h. Then, the MTT solution was removed and 200 μL of dimethyl sulfoxide (DMSO) was added. The absorbance at 570 nm (OD570) was measured using a microplate reader. Percent cell viability = (OD570 of experimental group / OD570 of control group) × 100%. For the subcellular localization assay, 4T1 cells were with stained DAPI (blue) and co‑incubated for 30 min. Then, Mn-THPPmPEG12 solution (200 μg/mL) was added and co‑incubated. The intracellular distribution of Mn-THPPmPEG12 was captured using LSCM at 0, 2, and 4 h. For the intracellular reactive oxygen species (ROS) assay, 4T1 cells were seeded into confocal culture dishes at a density of 2×10⁵ cells/mL and divided into light‑only, Mn-THPPmPEG12, and Mn-THPPmPEG12 with light group. The latter two groups were incubated with Mn-THPPmPEG12 (200 μg/mL) at 37°C for 12 h. After washing three times with PBS, all groups was incubated with the ROS probe DCFH‑DA (25 μM) for 30 min. The light-treated groups were then irradiated at 650 nm (600 mW) for 5 min. The production of intracellular ROS was observed by LSCM.
The in vivo Studies Using Animal Model
The primary TNBC model was established by inoculating 100 μL of a 4T1 cell suspension (5 × 10⁶ cells/mL) into the left third mammary fat pad of BALB/c nude mice. Tumor growth was monitored regularly, and subsequent experiments were initiated when the tumors reached an appropriate volume.
For the bilateral tumor model, 100 μL of 4T1 cell suspension (5 × 10⁶ cells/mL) was inoculated into the left third mammary fat pad of BALB/c mice, while 100 μL of 4T1 cell suspension (1 × 10⁶ cells/mL) was injected subcutaneously into the contralateral side. Tumor growth was monitored regularly, and further experiments were conducted when the primary tumor reached a longitudinal diameter of approximately 6–8 mm and the distant tumor measured 3–5 mm.
Mice that failed to develop tumors or died during the experiment were excluded from the final analysis.
In vivo PDT in Primary TNBC Mouse Model
In the primary TNBC model, when the tumor volume in 4T1 tumor-bearing BALB/c nude mice reached approximately 150–200 mm3, the mice were randomly divided into four groups (n = 5): PBS group, Laser group, Mn-THPPmPEG12 group, Mn-THPPmPEG12 + Laser group. For Mn-THPPmPEG12 group and Mn-THPPmPEG12 + Laser group, Mn-THPPmPEG12 solution (5 mg/mL,100 μL) was administered via tail vein injection. Thirty minutes after injection, the tumor regions of the Mn-THPPmPEG12 + Laser group were irradiated (650 nm, 500 mW, 8 min, distance 20 cm). At the same time point, the PBS group received saline injection, and the Laser group was irradiated under the same condition at the tumor area. MR scans were performed one day before the experiment and on days 1, 4, 7, 10, 14 during the experiment. Corresponding treatments were administered to each group on days 0, 2, 5, 8, and 11, one day after an MR scan (Figure S2). At the end of the study, blood samples were collected for liver and kidney function tests, and organs and tumors were harvested for pathological analysis. H&E staining was performed on various organs for histopathological analysis to evaluate the potential toxic side effects of PDT. Ki‑67 and CD31 immunohistochemistry, as well as TUNEL immunofluorescence, were used to detect tumor cell proliferation, microvessel density, and apoptosis, respectively.
In vivo PDT Combined with anti‑PD‑1 in Bilateral Tumor Mouse Model
In the bilateral tumor mouse model, when the primary tumor reached a longitudinal diameter of approximately 6–8 mm and the distant tumor measured 3–5 mm in 4T1 tumor-bearing BALB/c mice, the mice were randomly divided into four groups (n = 5): PBS group, Mn-THPPmPEG12 + Laser group, anti-PD-1 group, Mn-THPPmPEG12 + Laser + anti-PD-1 group. Mn-THPPmPEG12 solution (5 mg/mL, 100 μL) was administered via tail vein injection. Thirty minutes after injection, the primary tumor regions of the Mn-THPPmPEG12 + Laser group and combined group were irradiated (650 nm, 500 mW, 8 min, distance 20 cm). At the same time point, the PBS group received a saline injection. In the combined group, anti‑mouse PD‑1 (BioXcell, USA) was administered via intraperitoneal injection at a dose of 5 mg/kg after each PDT session. The anti-PD-1 group received the same injection at the same time points. MR scans were performed one day before the experiment and on days 1, 4, 7, 10, 14 during the experiment. Corresponding treatments were administered to each group on days 0, 2, 5, 8, and 11, one day after MR scan (Figure S3). At the end of the study, primary and distant tumors were excised for further analysis. H&E staining, TUNEL assay, and CD8 and PD-1 immunofluorescence were performed to evaluate necrosis, apoptosis, CD8⁺ T cells infiltration and, PD-1 expression in distant tumors.
Magnetic Resonance Scanning
MR scanning was performed on a 3.0T scanner (Signa Premier, GE Healthcare), using a dedicated 8-channel mouse coil. The main sequences included axial T2WI, coronal T2WI, IVIM-DWI, BOLD-MRI and MAGIC. Axial T2WI was scanned with TE 36.5 ms; TR 2000 ms; slice thickness/gap 2.0 mm/0.2 mm; FOV 4 cm × 4 cm; Matrix 200×160. Coronal T2WI was scanned with TE 59.8 ms; TR 2000 ms; slice thickness/gap 2.0 mm/0.2 mm; FOV6 cm × 6 cm; Matrix 128×128. IVIM-DWI was scanned with TI 148.0 ms; TE 59.7 ms; TR 3000 ms; slice thickness/gap 2.0 mm/0.2 mm; FOV 9 cm × 9 cm; Matrix 64 × 64; b values10, 30, 50, 80, 100, 120, 160, 200, 400, 600, 800, 1000 s/mm2. BOLD-MRI was scanned with TE 4.4, 8.5, 12.6, 16.8, 20.9, 25.0, 29.1, 33.3, 37.4, 41.5 ms; TR 400 ms; slice thickness/gap 2.0 mm/0.2 mm; FOV 9 cm × 9 cm; Matrix 160×160. Magic Sequence was scanned with TI 11.3 ms; TE 12.8 and 76.9 ms; TR 4813 ms; slice thickness/gap 2.0 mm/0.2 mm; FOV 9 cm × 9 cm; Matrix 160×160.
Tumors were observed on coronal T2WI and axial T2WI, and the longest and shortest diameter were measured. Tumor volume was calculated using the formula: Volume = (longest diameter × shortest diameter2) × 1/2. Functional sequences, including BOLD-MRI and IVIM-DWI were processed using the Functool software package on a workstation (GE ADW 4.5) to measure R2*, D, D*, and f values. The MAGIC sequence was analyzed using a dedicated software package on the 3.0T MRI system (Signa Premier, GE Healthcare). Three central tumor slices were selected, and ROIs were placed and averaged.
Histopathological Analysis
The excised tissues were fixed in 4% paraformaldehyde, embedded in paraffin, sectioned at a thickness of 4 μm, and stained with H&E according to standard procedures. Antigen retrieval was conducted with citrate buffer (pH 6.0; G1201) in a pressure cooker for 2 min. For immunohistochemical assay and immunofluorescence, the 4 μm paraffin sections were incubated at 4°C overnight with primary antibodies against CD31 (1:1000; GB120005), Ki‑67 (1:300; GB121141), CD8 (1:500; GB15068) and PD-1 (1:200; GB153744). TUNEL staining was performed to assess apoptotic cells using the CF488 TUNEL Cell Apoptosis Detection Kit (G1504-50T) according to the manufacturer’s instructions. All the above antibodies and kits were supplied by Servicebio (Wuhan, China).
Pathological tissue analysis was performed according to the hotspot method described by Weidner et al41 Briefly, the entire tissue section was first scanned under low magnification (× 100) to identify three regions with high expression. The microscope was then switched to high magnification (× 200), and positively stained cells within selected fields were counted. The average value from the three regions was taken as the final result.
ImageJ software was used to count cells in TUNEL immunofluorescence and Ki-67 immunohistochemistry images of tumor samples collected at the experimental endpoint. Microvessels were quantified based on CD31 immunohistochemical staining. For microvessel density (MVD) assessment in tumor tissue, any clearly stained endothelial cell or cell cluster distinguishable from surrounding tissues was counted as a single vessel, regardless of the presence of a lumen. Vessels with thick muscular walls or a lumen diameter larger than that of eight red blood cells were excluded. The positive rates for TUNEL and Ki-67 were calculated as the ratio of positively cells to the total number of cells within a × 200 field of view.
Statistical Analysis
Data analysis was performed using SPSS software (version 23.0), and graphs were generated with GraphPad Prism 8 software. The normal distribution of the acquired data was evaluated using the Kolmogorov–Smirnov test. Comparisons of imaging parameters or pathological data among different groups were conducted using one-way ANOVA, followed by LSD post hoc pairwise comparisons. Homogeneity of variance was assessed using Levene’s test. Comparisons between two time points within the same group were analyzed using paired t-tests. Statistical results are expressed as mean ± standard deviation ( ). Correlations between pathological indicators and imaging parameters were assessed using Pearson correlation analysis. P < 0.05 (*), P < 0.01 (**) or P < 0.001 (***) was considered statistically significant.
Results and Discussion
The synthesized THPPmPEG12 sample exhibited well-defined peaks in both 1H NMR and 13C NMR spectra (Figure 1a and b). The mass spectra and high-performance liquid chromatography (HPLC) chromatograms of THPPmPEG12 and Mn-THPPmPEG12 are presented in Figures S4 and S5, confirming the successful synthesis. Electron microscopy revealed that the particles were uniformly distributed, exhibiting a regular spherical morphology with a smooth surface and an average diameter of approximately 100 nm (Figure 1c). The aqueous solution of Mn-THPPmPEG12 appeared dark brown and exhibited a distinct Tyndall effect when illuminated by a laser beam, indicating homogeneous dispersion and good colloidal stability (Figure 1d). UV-Vis absorption spectroscopy revealed that the porphyrin ligand before metal chelation exhibited two main absorption regions, a strong Soret band in the visible region and four weaker Q bands at longer wavelengths. Upon metal chelation to form Mn-THPPmPEG12, the Soret band exhibited a distinct red shift, accompanied by a significant increase in absorption intensity, with multiple well-resolved absorption peaks appearing in the Q-band region. These observations confirm the successful coordination of Mn ions at the center of the porphyrin ring (Figure 1e).
 |
Figure 1 Characterization of Mn-THPPmPEG12. (a) 1H Nuclear Magnetic Resonance (1H NMR) of THPPmPEG12. (b) 13C Nuclear Magnetic Resonance (13C NMR) of THPPmPEG12 (c) TEM image reveals that Mn-THPPmPEG12 exhibits a regular spherical morphology with smooth surfaces and an approximate size of 100 nm. (d) The THPPmPEG12 solution appears light brown, while the Mn-THPPmPEG12 solution exhibits dark brown. Both solutions display the Tyndall effect upon laser irradiated. (e) UV-Vis absorbance spectra of THPPmPEG12 and Mn-THPPmPEG12. |
Cytotoxicity assays demonstrated that Mn-THPPmPEG12 exhibited no toxicity toward 4T1 cells in the absence of laser irradiation (Figure 2a). However, under laser irradiation (650 nm, 600 mW, 5 min), cell viability decreased with increasing concentrations of Mn-THPPmPEG12, confirming its ability to kill 4T1 cells upon light activation (Figure 2b). Subcellular localization analysis revealed that Mn-THPPmPEG12 was taken up by 4T1 cells and localized to the cytoplasm (Figure 2c). The subcellular localization of a photosensitizer upon irradiation largely determines the site of oxidative damage. Unlike conventional hydrophobic photosensitizers that tend to accumulate in organelle membranes, Mn-THPPmPEG12 exhibits high water solubility, leading to enhanced cytotoxic effects against cancer cells. No detectable ROS generation was observed in either the Mn-THPPmPEG12 or the light-only control group. However, intense ROS production was induced upon treatment with both Mn-THPPmPEG12 and laser irradiation (650 nm, 600 mW, 5 min) (Figure 2d). These results indicate that Mn-THPPmPEG12 can be activated by laser light to generate ROS, which is attributed to its efficient catalytic decomposition of H2O2, thereby demonstrating its cellular-level PDT capability. Moreover, this process not only promotes PDT-induced apoptosis but also enhances the release of tumor-associated antigens, thereby inducing ICD. Consequently, ICD primes the host immune system to initiate a systemic antitumor response targeting both primary lesions and distant metastases. ROS targets a range of biomolecules—including proteins, lipids, and DNA bases and sugar moieties—ultimately triggering apoptosis, necrosis, or autophagy in tumor cells.20,42 Collectively, these findings validate the favorable photodynamic performance of Mn-THPPmPEG12 at the cellular level.
 |
Figure 2 MTT, subcellular localization, and intracellular ROS generation of Mn-THPPmPEG12. (a and b) MTT assay of 4T1 cell viability after incubation with various concentrations of Mn-THPPmPEG12 in the absence (a) and presence (b) of laser irradiation (650 nm, 600 mW, 5 min). Statistical significance was determined by paired-samples t-test. * and *** indicate statistical significance compared to the control group at P < 0.05 and 0.001 levels, respectively. (c) Mn-THPPmPEG12 could be effectively internalized by 4T1 cells and specifically accumulated in the cytoplasm. (d) ROS (green fluorescence) generation was observed in 4T1 cells after incubation with Mn-THPPmPEG12 and subsequent light irradiation (650 nm, 600 mW, 5 min). Scale bars represent 200 μm. |
Unlike conventional photosensitizers, many naturally derived counterparts exhibit poor water solubility, which impedes systemic clearance, causes prolonged tissue retention, and induces undesirable phototoxicity upon light exposure, thereby limiting clinical applications.43 While second-generation photosensitizers (eg, chlorins and phthalocyanines) offer superior photophysical properties, their rapid renal clearance shortens circulation time and reduces bioavailability, compromising therapeutic efficacy.44 Conversely, the PEGylated structure of Mn-THPPmPEG12 significantly improves aqueous solubility and biocompatibility, facilitating efficient systemic elimination and enhancing its overall therapeutic potential.
Mn-THPPmPEG12 was dissolved in deionized water to prepare solutions with Mn ion concentrations of 0.125, 0.25, 0.5, 1.0, and 2.0 mg/mL. MRI scans were performed using the Magic sequence on a 3.0T MRI scanner (Signa Premier, GE Healthcare). The results showed that the T1 signal intensity increased with increasing concentration of Mn-THPPmPEG12 (Figure 3a). The longitudinal relaxivity (r1) of Mn-THPPmPEG12, which was calculated from the fitting curve of 1/T1 versus concentration, was found to be 4.47 mM−1·s−1 (Figure 3b). This value is comparable to those of clinically approved gadolinium-based contrast agents such as Gd-DTPA, Gd-DOTA, and Gadobutrol, which typically exhibit r1 values of 4–5 mM−1·s−1.45 These results demonstrate that the Mn-THPPmPEG12 solution exhibits excellent T1-weighted imaging performance. Dynamic contrast-enhanced MRI was performed on 4T1 tumor-bearing nude mice (tumor volume 250–300 mm3) following intravenous injection of Mn-THPPmPEG12 (5 mg/mL, 100 μL) via the tail vein. As shown in Figure 3c, significant signal enhancement was observed in the liver and kidneys, indicating a dual-pathway clearance that potentially reduces long-term systemic retention. The tumor region also exhibited higher signal intensity than the contralateral normal muscle (Figure 3d). Collectively, these findings confirm the in vivo T1-weighted contrast capability of Mn-THPPmPEG12, establishing a foundation for theranostic applications. The pronounced enhancement within the tumor suggests effective accumulation of the agent, which is attributed to the passive targeting property of porphyrin and the enhanced permeability and retention (EPR) effect.46,47
 |
Figure 3 Magnetic resonance (MR) performance of Mn-THPPmPEG12. (a) T1-mapping pseudocolor images of Mn-THPPmPEG12 solution at various Mn concentrations acquired on a 3.0 T MR scanner (Signa Premier, GE healthcare). (b) Longitudinal relaxivity (r1) of Mn-THPPmPEG12, plotted as 1/T1 versus Mn concentration. (c) Contrast enhancement in major organs and tumors in mice. (d and e) T1-mapping pseudocolor images (d) and corresponding relative T1 value change curves (e) for tumor and muscle tissues at various time points after intravenous injection of Mn-THPPmPEG12 (5 mg/mL, 100 μL) solution via the tail vein. Statistical comparisons of relative T1 values between tumor and muscle at each time point were performed using paired-samples t-tests (n = 3), *P < 0.05 and **P < 0.01. |
To investigate the in vivo distribution of Mn-THPPmPEG12, MRI scans were performed at different time points after intravenous injection of Mn-THPPmPEG12 (5 mg/mL, 100 μL) into 4T1 tumor-bearing nude mice (tumor volume 250–300 mm3). The results showed that the maximal reduction in tumor T1 values occurred at 30 min post-injection, accompanied by the greatest difference in T1 values between the tumor and muscle tissues (t = −11.8, P = 0.007) (Figure 3e). These findings indicate that the highest accumulation of Mn-THPPmPEG12 in the tumor region occurred at 30 min post-injection, showing marked contrast with the surrounding muscle tissue. This suggests that the optimal time for light irradiation is 30 min after intravenous administration of Mn-THPPmPEG12.
The relative changes in tumor volume over time are illustrated in Figure 4a. Significant differences in tumor volume among the groups began to emerge on day 7 (F = 4.57, P = 0.018). Further analysis revealed that the tumor volume in the treatment group was larger than that in the PBS group (P = 0.004), while no statistically significant differences were observed compared with the Mn-THPPmPEG12 group or the Laser group (P = 0.032 and 0.165, respectively). However, on day 10 and 14, the tumor volume in the treatment group was significantly larger than that of the other groups (all P < 0.001). At the end of the treatment period, the tumor volume in the Mn-THPPmPEG12 +Laser group showed no significant change from baseline (t = −1.86, P = 0.136). In contrast, the PBS, Mn-THPPmPEG12, and Laser group exhibited substantial volume increases of 849.41 ± 118.13%, 824.62 ± 135.84%, and 749.51 ± 149.85%, respectively. Excised tumors on day 14 are presented in Figure 4b. These results demonstrate that Mn-THPPmPEG12-mediated PDT effectively inhibits TNBC growth in the mouse model.
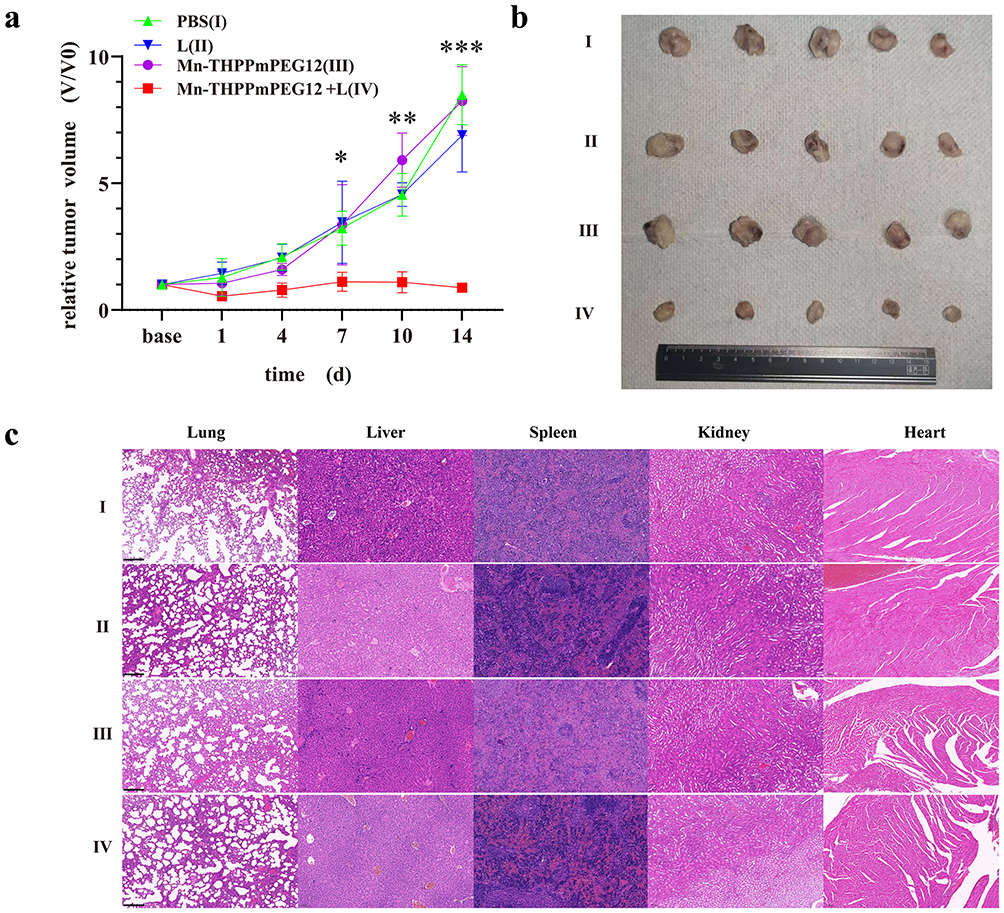 |
Figure 4 Antitumor effect of Mn-THPPmPEG12 ‑mediated photodynamic therapy in 4T1 tumor-bearing nude mice. (a) Time-dependent relative tumor volumes across treatment groups. Statistical comparisons among groups at each time point were performed using one-way ANOVA (n = 5), *P < 0.05, **P < 0.01, ***P < 0.001. Post-hoc multiple comparison results are presented in the main text. (b) The size and morphology of excised tumors from each group at the end of the study. (c) Histopathological analysis of the organs obtained from each group of 4T1 tumor-bearing nude mice at the end of the study (H &E stain, × 100). Scale bars represent 200 μm. |
Histopathological analysis of the lung, liver, spleen, kidney, and heart in all four groups at the end of the study revealed no toxic damage to parenchymal organs following Mn-THPPmPEG12-mediated PDT (Figure 4c). Consistently, serological analysis revealed no signs of hepatic or renal dysfunction (Figure S6). These findings demonstrate its favorable biosafety profile.
Figure 5a and b present representative T2WI, IVIM-DWI and BOLD-MR pseudocolor maps of the Mn-THPPmPEG12 and Mn-THPPmPEG12 + Laser groups, respectively. The temporal changes in R2*, D, D*, and f values across different time points are illustrated in Figure 5c–f. BOLD-MRI revealed a gradual increase of the R2* values within the tumors of the treatment group over time (Figure 5c). On day 4 post-treatment, the R2* value in the treatment group increase from42.43 ± 5.24 HZ to 49.97 ± 5.89 HZ, which was higher than other control groups (all P < 0.001). By the end of the treatment period, the R2* value in the Mn-THPPmPEG12 + Laser group reached 74.71 ± 13.7 Hz, remaining significantly higher than that of the control groups at the same time point (all P < 0.001). This elevation can be attributed to light-induced oxygen consumption mediated by PDT. The subsequent rise in deoxyhemoglobin content following oxygen depletion significantly shortens the T2* relaxation time of the tumor tissue, leading to an elevated transverse relaxation rate R2* (R2* = 1/T2*).48 Additionally, PDT-induced vascular damage may result in reduced tissue perfusion, which could also contribute to the increase in R2*.49 Correlation analysis demonstrated that R2* was associated with Ki-67, TUNEL, and MVD (r = - 0.84, 0.86 and - 0.72; P = 0.001, 0.000 and 0.008, respectively) (Table 1). Specifically, Ki-67 is a well-established marker for tumor proliferation, MVD serves as a valuable indicator of tumor angiogenesis, and TUNEL staining is primarily used to assess tumor cell apoptosis. R2* exhibited a significant negative correlation with both Ki-67 and MVD, while presenting a significant positive correlation with TUNEL. These findings suggest that R2* can reliably reflect the pathological state of the TNBC microenvironment.
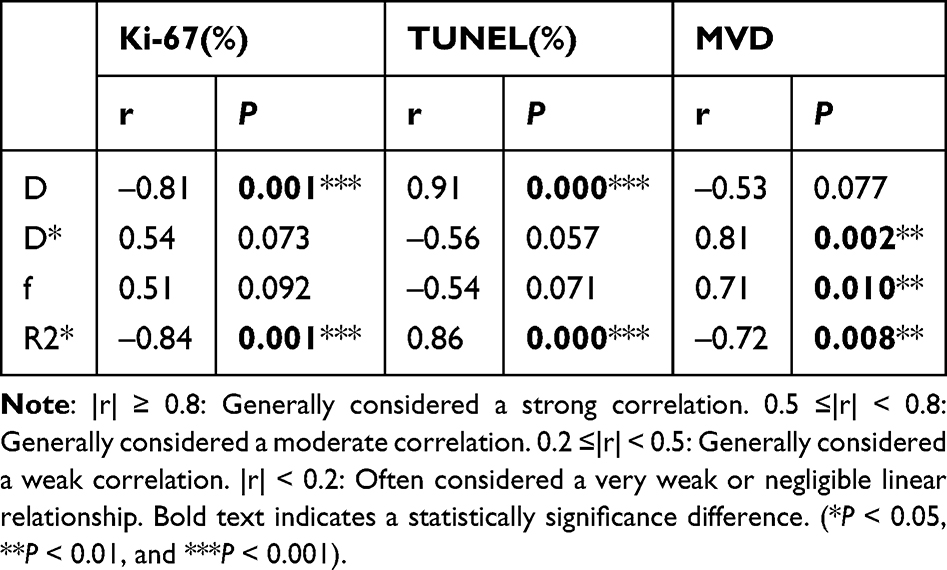 |
Table 1 Correlation Analysis Between MR Parameters and Pathological Indicators |
 |
Figure 5 Multiparametric MRI monitors the antitumor efficacy of Mn-THPPmPEG12‑mediated photodynamic therapy in 4T1 tumor-bearing nude mice. (a and b) Representative T2WI and MR parameter pseudocolor maps (D, D*, f, R2*) presented for the Mn-THPPmPEG12 group (a) and the Mn-THPPmPEG12 + Laser group (b). (c~f) Time-dependent changes in tumor R2* (c), D (d), D* (e) and f (f) value across different groups. Statistical comparisons of MRI parameters among groups at each time point were performed using one-way ANOVA tests (n = 5), *P < 0.05, **P < 0.01, ***P < 0.001. Post-hoc multiple comparison results are presented in the main text. |
The D value in the Mn-THPPmPEG12 + Laser group increased following the initiation of therapy, reaching 0.78 ± 0.13 (× 10−3 mm2/s) at day 4, when significant differences in D values emerged among the groups (F = 5.43, P = 0.009) (Figure 5d). Further pairwise comparisons revealed that the D values in the Mn-THPPmPEG12 + Laser group were higher than those in the PBS, Laser, and Mn-THPPmPEG12 groups (P = 0.002, 0.012 and 0.007, respectively). By the end of the experiment, the D value in the treatment group further increased to 0.90 ± 0.13 (× 10−3 mm2/s), significantly exceeding those of the control groups (all P < 0.001). The D value from IVIM-DWI reflects pure water molecular diffusion in the tissue extracellular space.50 The increase in the D value following treatment occurred earlier than changes in tumor volume, suggesting internal alterations within the tumor. This elevation may result from ROS-generated cytotoxicity during PDT, which induces tumor cell necrosis and apoptosis, thereby reducing cellular density and interstitial pressure and subsequently enhanced water diffusion. With repeated PDT sessions, cumulative ROS-induced toxicity amplified tumor cell death, further promoting water molecule diffusion and leading to a continuous increase in the D value. Consistent with these observations, histopathological examination at the endpoint revealed extensive necrosis and apoptosis within the tumors of the treatment group. Compared with the control groups, the treatment group exhibited a decreased Ki-67 and increased apoptosis, corroborating the reduction in tumor cellularity after PDT (Figure 6). Furthermore, D value was negatively correlated with Ki-67 (r = −0.81, P = 0.001) and strongly positive correlation with TUNEL (r = 0.91, P < 0.001), which is consistent with previous studies.51,52 These findings suggest that the D value can quantitatively reflect the reduction in cellular density within tumors following Mn-THPPmPEG12-mediated PDT.
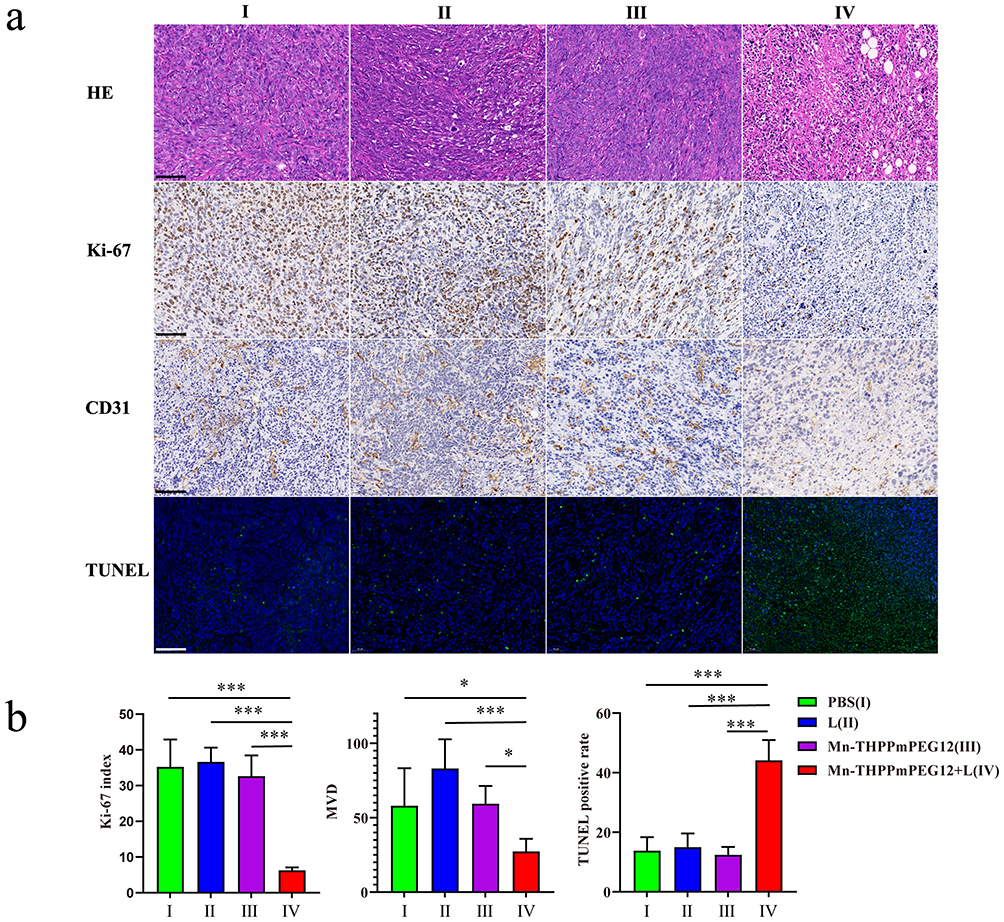 |
Figure 6 Histopathological examination of tumors from each group. (a) Representative H&E, Ki-67, CD31 and TUNEL images (× 200) of tumor tissues at the study endpoint. Cell proliferation (brown spots), microvascular density (brown spots) and apoptosis (green fluorescence) were assessed by anti-Ki-67 antibody, anti-CD31 antibody and TUNEL assay, respectively. Scale bars represent 100 μm. (b) Semiquantitative analysis of the percentages of the Ki-67-, CD31- and TUNEL-positive cells in tumor tissues following different treatments using Image J software. Statistical comparisons among groups were performed using one-way ANOVA tests, followed by LSD post hoc tests (n = 3), *P < 0.05, ***P < 0.001. |
Similarly, significant differences in D* values emerged among the groups on day 4 (F = 3.32, P = 0.047) (Figure 5e). The D* value in the Mn-THPPmPEG12 + Laser group decreased from a baseline of 6.43 ± 1.32 (× 10−3 mm2/s) to 5.14 ± 0.53 (× 10−3 mm2/s) on day 4, which was significantly lower than those in the PBS, Laser, and Mn-THPPmPEG12 group (P = 0.037, 0.016, and 0.017, respectively). By the endpoint, it further declined to 4.38 ± 0.43 (× 10−3 mm2/s), remaining significantly lower than that of the control groups (all P < 0.01). Regarding the f value, significant differences among the groups emerged on day 7 (F = 4.71, P = 0.017) (Figure 5f). The f value in the treatment group dropped to 8.64 ± 0.36% at the endpoint, which was significantly lower than those in the other groups (all P < 0.01). The D* and f values reflect microcirculatory perfusion and capillary density within tissues, respectively.50 The earlier decrease in the D* value compared to the f value implies that D* is more sensitive to microenvironmental changes. The decline in both parameters may be attributed to ROS-induced vascular damage, lumen occlusion, congestion, and reduced perfusion during PDT.53 Consistent with this, final histopathological evaluation revealed significant microvascular destruction in the tumor tissue of the treatment group (Figure 6). Correlation analysis demonstrated a significant positive correlation of both D* and f values with MVD (r = 0.81 and 0.71, P = 0.002 and 0.010, respectively). These results suggest that the disruptions in the tumor microvasculature can be reflected by the D* and f values.
Results from the previous section demonstrated that PDT can inhibit but not eliminate tumor growth, highlighting the need to explore combination treatment strategies. Previous studies have indicated that PDT not only directly kills tumor tissue through ROS generation but also significantly remodels the TME (eg, by increasing effector T-cell infiltration and reducing regulatory T-cells), thereby creating favorable conditions for ICIs.54–56 Therefore, we hypothesize that combining PDT with immunotherapy may achieve more complete tumor eradication. To investigate the alterations in the TME, immunocompetent syngeneic BALB/c mice were employed in the combination therapy regimen.
BALB/c mice were randomly divided into PBS, Mn-THPPmPEG12 + Laser, anti-PD-1, and Mn-THPPmPEG12 + Laser + anti-PD-1 group, and subjected to respective treatments. At the experimental endpoint, the primary tumor volume in the combination therapy group was significantly reduced compared to baseline (V14/V0 = 0.50 ± 0.35, P = 0.033; Figure 7a), and primary tumors were nearly eradicated in two mice (Figure 7b). Further analysis revealed that the tumor volume in the combination therapy group was smaller than that in the Mn-THPPmPEG12 + Laser, anti-PD-1 and PBS groups (P = 0.026, 0.001 and 0.000, respectively). The Mn-THPPmPEG12 + Laser group showed no significant change in primary tumor volume compared to baseline (V14/V0 = 2.06 ± 0.45, P = 0.197), while the anti-PD-1 group exhibited an increased tumor volume (V14/V0 = 9.51 ± 0.54, P = 0.001) and the PBS group showed the most significant increased tumor volume (V14/V0 = 15.56 ± 3.91, P < 0.001). These results demonstrate that Mn-THPPmPEG12-mediated PDT combined with anti-PD-1 exerts superior antitumor effects against primary TNBC in mice compared to either monotherapy, indicating a synergistic therapeutic benefit of the combination regimen.
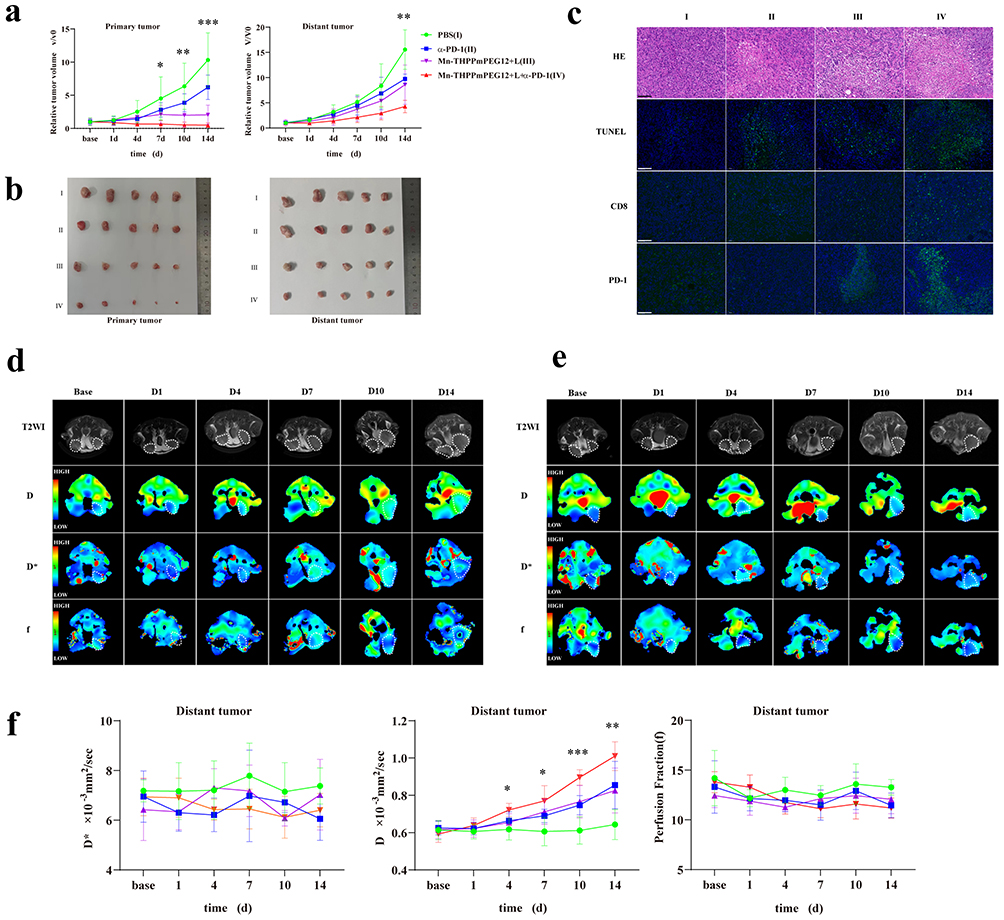 |
Figure 7 Antitumor effect of Mn-THPPmPEG12‑mediated photodynamic therapy combined with anti‑PD‑1 in a 4T1 bilateral tumor model. (a) Time-dependent relative tumor volumes for primary tumors and distant tumors in the different groups. (b) The size and morphology of excised primary and distant tumors from each group at the end of the study. (c) Histopathological analysis of distant tumors at the study endpoint, including H&E staining, TUNEL assay, and immunofluorescence staining for CD8 and PD-1 (green fluorescence; ×200). Scale bars represent 100 μm. (d and e) Representative T2WI and IVIM-derived pseudocolor (D, D*, f) images presented for the Mn-THPPmPEG12 + Laser group (d) and Mn-THPPmPEG12+Laser+anti-PD-1 group (e). (f) Time-dependent changes in IVIM parameters (D, D*, f) of distant tumors across different groups. P-values were calculated based on one-way ANOVA tests (n = 5), *P < 0.05, **P < 0.01, ***P < 0.001. |
The phenomenon where treatment of a primary tumor leads to regression of distant lesions is known as the “abscopal effect”.57 At the end of the treatment period, the combination therapy group exhibited a significantly smaller distant tumor volume compared to the Mn-THPPmPEG12 + Laser, anti-PD-1, and PBS group (P = 0.032, 0.010 and 0.000, respectively; Figure 7a and b). No statistically significant difference was observed between the PDT-only and anti-PD-1 monotherapy groups (P = 0.054). These findings indicate that Mn-THPPmPEG12-mediated PDT of the primary tumor can elicit a systemic immune response. Furthermore, when combined with anti-PD-1 antibody therapy, it effectively inhibits the growth of distant tumors, highlighting a synergistic effect of the combined treatment. Consistent with these observations, terminal histopathology demonstrated pronounced apoptosis and necrosis in the combination therapy group (Figure 7c). Moreover, compared to the PBS and anti-PD-1 groups, both the Mn-THPPmPEG12-mediated PDT group and the combination therapy group exhibited a notable infiltration of CD8+ T lymphocytes and elevated PD-1 expression in distant tumors (Figure 7c). These findings suggest that Mn-THPPmPEG12-mediated PDT induces systemic immune responses, thereby altering the tumor microenvironment of distant lesions. Furthermore, anti-PD-1 antibody therapy demonstrates a synergistic effect with PDT in suppressing distant tumor growth by blocking the PD-1/PD-L1 pathway. Therefore, this combined strategy of PDT and PD-1 checkpoint inhibition represents a highly promising therapeutic strategy for both primary and metastatic TNBC.
Representative T2WI and IVIM-DWI images of distant tumors in the Mn-THPPmPEG12 + Laser group and combination group are shown in Figure 7d and e. The changes in D, D*and f values of distant tumors across groups at various time points are shown in Figure 7f. Following treatment, the D values in the anti-PD-1 group, Mn-THPPmPEG12 + Laser group, and combination therapy group gradually increased after treatment, while no significant changes were observed in the PBS group across time points. The D value in the combination therapy group was significantly higher than that in the PBS group from day 4 post-treatment (P = 0.003), and exceeded those in both the anti-PD-1 and the Mn-THPPmPEG12 + Laser group from day 10 (P = 0.005 and 0.007, respectively). No significant differences in D values were detected between the anti-PD-1 and the Mn-THPPmPEG12 + Laser group at any time point (all P > 0.05), and both groups showed higher D values than the PBS group from day 10 (P = 0.008 and 0.002, respectively). In contrast, no consistent differential trends were observed in D* or f values among the groups.
The D value reflects the pure water molecular diffusion within tissues.58 An increase in tumor necrosis leads to enhanced water molecule diffusion, resulting in an elevated D value. At the endpoint of this study, the D values in descending order were as follows: the combination therapy group, the anti-PD-1 group and the Mn-THPPmPEG12 + Laser group, the PBS group. This order aligns with the degree of necrosis and apoptosis observed in histopathological analysis (Figure 7c). These findings indicate that the D value derived from IVIM-DWI can serve as an early biomarker for assessing necrosis and apoptosis within distant tumors, even before volumetric changes become apparent.
Several limitations of this study should be acknowledged. First, the sample size was relatively small, and the experiments were restricted to mouse models. Additionally, validation in large animals and the exploration of clinically relevant dosages were not performed. Moreover, the long-term biosafety and toxicity profiles of Mn-THPPmPEG12 require further investigation. Future studies focusing on large-animal models, dose optimization, and long-term safety assessment are warranted to facilitate clinical translation.
Conclusion
In summary, we developed a manganese porphyrin-based theranostic platform with high water solubility, favorable biocompatibility, and combined therapeutic and MRI diagnostic capabilities. By integrating PDT and immune checkpoint blockade, Mn-THPPmPEG12 effectively suppressed both primary and abscopal TNBC tumors while promoting the conversion of the tumor microenvironment from a “cold” to “hot” state. Together with IVIM-DWI and BOLD-MRI–based treatment monitoring, this strategy provides a promising approach for precision immunotherapy of TNBC.
Ethics Approval and Patient Consent
All animal experiments were approved by the Animal Experimentation Ethics Committee of Jinan University (Approval No. IACUC-20220622-04) and conducted in accordance with institutional guidelines and the ARRIVE guidelines.
BALB/c nude mice and BALB/c mice were used in this study. All animals were obtained from an accredited animal facility and housed under standard laboratory conditions. Anesthesia was induced by intraperitoneal injection of 2% pentobarbital sodium at a dose of 5μL/g body weight. Adequate depth of anesthesia was confirmed by the absence of reflex responses. At the experimental endpoint, animals were euthanized by cervical dislocation under deep anesthesia. The procedure was performed by trained personnel in accordance with the American Veterinary Medical Association (AVMA) Guidelines for the Euthanasia of Animals. All efforts were made to minimize animal suffering and distress.
Funding
This work was supported by the National Natural Science Foundation of China (82503771), Guangdong Basic and Applied Basic Research Foundation(2022A1515110630), the Engineering Research Center of Medical Imaging Artificial Intelligence for Precision Diagnosis and Treatment, Guangdong Province, Science and Technology Projects in Guangzhou (No.2023A03J1037, No.2023A03J1039, NO.2024A03J1073, NO. 2024A03J0231, NO.2025A03J4332), the Guangzhou Key Laboratory of Molecular and Functional Imaging for Clinical Translation (201905010003). Guangdong Medical Association Clinical Research Fund(2025YX-A1006).
Disclosure
The authors report no conflicts of interest in this work.
References
1. Foulkes WD, Smith IE, Reis-Filho JS. Triple-negative breast cancer. N Engl J Med. 2010;363(20):1938–17. doi:10.1056/NEJMra1001389
2. Morris GJ, Naidu S, Topham AK, et al. Differences in breast carcinoma characteristics in newly diagnosed African-American and Caucasian patients: a single-institution compilation compared with the national cancer institute’s surveillance, epidemiology, and end results database. Cancer. 2007;110(4):876–884. doi:10.1002/cncr.22836
3. Bianchini G, De Angelis C, Licata L, Gianni L. Treatment landscape of triple-negative breast cancer - expanded options, evolving needs. Nat Rev Clin Oncol. 2022;19(2):91–113. doi:10.1038/s41571-021-00565-2
4. Huppert LA, Gumusay O, Rugo HS. Emerging treatment strategies for metastatic triple-negative breast cancer. Ther Adv Med Oncol. 2022;14:17588359221086916. doi:10.1177/17588359221086916
5. Almansour NM. Triple-negative breast cancer: a brief review about epidemiology, risk factors, signaling pathways, treatment and role of artificial intelligence. Front Mol Biosci. 2022;9:836417. doi:10.3389/fmolb.2022.836417
6. Li Y, Zhang H, Merkher Y, et al. Recent advances in therapeutic strategies for triple-negative breast cancer. J Hematol Oncol. 2022;15(1):121. doi:10.1186/s13045-022-01341-0
7. Lin NU, Vanderplas A, Hughes ME, et al. Clinicopathologic features, patterns of recurrence, and survival among women with triple-negative breast cancer in the national comprehensive cancer network. Cancer. 2012;118(22):5463–5472. doi:10.1002/cncr.27581
8. Juzeniene A, Moan J. The history of PDT in Norway part one: identification of basic mechanisms of general PDT. Photodiagnosis Photodyn Ther. 2007;4(1):3–11. doi:10.1016/j.pdpdt.2006.11.002
9. Krysko DV, Balalaeva IV, Mishchenko TA. Photodynamic Therapy in Cancer: principles, State of the Art, and Future Directions. Pharmaceutics. 2024;16(12):1564. doi:10.3390/pharmaceutics16121564
10. Abrahamse H, Hamblin MR. New photosensitizers for photodynamic therapy. Biochem J. 2016;473(4):347–364. doi:10.1042/BJ20150942
11. Li X, Lovell JF, Yoon J, Chen X. Clinical development and potential of photothermal and photodynamic therapies for cancer. Nat Rev Clin Oncol. 2020;17(11):657–674. doi:10.1038/s41571-020-0410-2
12. Hamblin MR, Newman EL. On the mechanism of the tumour-localising effect in photodynamic therapy. J Photochem Photobiol B. 1994;23(1):3–8. doi:10.1016/s1011-1344(94)80018-9
13. Iyer AK, Greish K, Seki T, et al. Polymeric micelles of zinc protoporphyrin for tumor targeted delivery based on EPR effect and singlet oxygen generation. J Drug Target. 2007;15(7–8):496–506. doi:10.1080/10611860701498252
14. Zhao YY, Lu L, Jeong H, et al. Enhancing biosafety in photodynamic therapy: progress and perspectives. Chem Soc Rev. 2025;54(17):7749–7768. doi:10.1039/d5cs00054h
15. Wahsner J, Gale EM, Rodríguez-Rodríguez A, Caravan P. Chemistry of MRI contrast agents: current challenges and new frontiers. Chem Rev. 2019;119(2):957–1057. doi:10.1021/acs.chemrev.8b00363
16. Ji B, Wei M, Yang B. Recent advances in nanomedicines for photodynamic therapy (PDT)-driven cancer immunotherapy. Theranostics. 2022;12(1):434–458. doi:10.7150/thno.67300
17. Cecic I, Stott B, Korbelik M. Acute phase response-associated systemic neutrophil mobilization in mice bearing tumors treated by photodynamic therapy. Int Immunopharmacol. 2006;6(8):1259–1266. doi:10.1016/j.intimp.2006.03.008
18. Liu Y, Wang L, Kong F, Liu T, Liu H. An immunomodulatory photosensitizer-mediated photodynamic therapy synergizes with PD-L1 blockade against metastatic triple-negative breast cancer. Front Pharmacol. 2025;16:1651165. doi:10.3389/fphar.2025.1651165
19. Mishchenko T, Balalaeva I, Gorokhova A, Vedunova M, Krysko DV. Which cell death modality wins the contest for photodynamic therapy of cancer. Cell Death Dis. 2022;13(5):455. doi:10.1038/s41419-022-04851-4
20. Donohoe C, Senge MO, Arnaut LG, Gomes-da-Silva LC. Cell death in photodynamic therapy: from oxidative stress to anti-tumor immunity. Biochim Biophys Acta Rev Cancer. 2019;1872(2):188308. doi:10.1016/j.bbcan.2019.07.003
21. Li W, Yang J, Luo L, et al. Targeting photodynamic and photothermal therapy to the endoplasmic reticulum enhances immunogenic cancer cell death. Nat Commun. 2019;10(1):3349. doi:10.1038/s41467-019-11269-8
22. Gellén E, Fidrus E, Péter M, Szegedi A, Emri G, Remenyik É. Immunological effects of photodynamic therapy in the treatment of actinic keratosis and squamous cell carcinoma. Photodiagnosis Photodyn Ther. 2018;24:342–348. doi:10.1016/j.pdpdt.2018.10.018
23. Alzeibak R, Mishchenko TA, Shilyagina NY, Balalaeva IV, Vedunova MV, Krysko DV. Targeting immunogenic cancer cell death by photodynamic therapy: past, present and future. J Immunother Cancer. 2021;9(1):e001926. doi:10.1136/jitc-2020-001926
24. Li Z, Lai X, Fu S, et al. Immunogenic cell death activates the tumor immune microenvironment to boost the immunotherapy efficiency. Adv Sci. 2022;9(22):e2201734. doi:10.1002/advs.202201734
25. Zhu X, Zheng W, Wang X, et al. Enhanced photodynamic therapy synergizing with inhibition of tumor neutrophil ferroptosis boosts Anti-PD-1 therapy of gastric cancer. Adv Sci. 2024;11(12):e2307870. doi:10.1002/advs.202307870
26. Ji S, Li J, Duan X, et al. Targeted enrichment of enzyme-instructed assemblies in cancer cell lysosomes turns immunologically cold tumors hot. Angew Chem Int Ed Engl. 2021;60(52):26994–27004. doi:10.1002/anie.202110512
27. Jin L, Shen S, Huang Y, Li D, Yang X. Corn-like Au/Ag nanorod-mediated NIR-II photothermal/photodynamic therapy potentiates immune checkpoint antibody efficacy by reprogramming the cold tumor microenvironment. Biomaterials. 2021;268:120582. doi:10.1016/j.biomaterials.2020.120582
28. Thiruppathi J, Vijayan V, Park IK, Lee SE, Rhee JH. Enhancing cancer immunotherapy with photodynamic therapy and nanoparticle: making tumor microenvironment hotter to make immunotherapeutic work better. Front Immunol. 2024;15:1375767. doi:10.3389/fimmu.2024.1375767
29. Xie Q, Li Z, Liu Y, et al. Translocator protein-targeted photodynamic therapy for direct and abscopal immunogenic cell death in colorectal cancer. Acta Biomater. 2021;134:716–729. doi:10.1016/j.actbio.2021.07.052
30. Kilgour E, Rothwell DG, Brady G, Dive C. Liquid biopsy-based biomarkers of treatment response and resistance. Cancer Cell. 2020;37(4):485–495. doi:10.1016/j.ccell.2020.03.012
31. Vladimirov N, Perlman O. Molecular MRI-based monitoring of cancer immunotherapy treatment response. Int J Mol Sci. 2023;24(4):3151. doi:10.3390/ijms24043151
32. Hoffmann E, Masthoff M, Kunz WG, et al. Multiparametric MRI for characterization of the tumour microenvironment. Nat Rev Clin Oncol. 2024;21(6):428–448. doi:10.1038/s41571-024-00891-1
33. Wu C, Chen W, Yan S, et al. MRI-guided photothermal/photodynamic immune activation combined with PD-1 inhibitor for the multimodal combination therapy of melanoma and metastases. Regen Biomater. 2024:11:rbae019. doi:10.1093/rb/rbae019
34. Kang KM, Lee JM, Yoon JH, Kiefer B, Han JK, Choi BI. Intravoxel incoherent motion diffusion-weighted MR imaging for characterization of focal pancreatic lesions. Radiology. 2014;270(2):444–453. doi:10.1148/radiol.13122712
35. Joo I, Lee JM, Han JK, Choi BI. Intravoxel incoherent motion diffusion-weighted MR imaging for monitoring the therapeutic efficacy of the vascular disrupting agent CKD-516 in rabbit VX2 liver tumors. Radiology. 2014;272(2):417–426. doi:10.1148/radiol.14131165
36. Woo S, Lee JM, Yoon JH, Joo I, Han JK, Choi BI. Intravoxel incoherent motion diffusion-weighted MR imaging of hepatocellular carcinoma: correlation with enhancement degree and histologic grade. Radiology. 2014;270(3):758–767. doi:10.1148/radiol.13130444
37. Fusco R, Granata V, Pariante P, et al. Blood oxygenation level dependent magnetic resonance imaging and diffusion weighted MRI imaging for benign and malignant breast cancer discrimination. Magn Reson Imaging. 2021;75:51–59. doi:10.1016/j.mri.2020.10.008
38. Kim CH, Lee JH, Lee JW, Kim E, Choi SH. Introducing a new biomarker named R2*-BOLD-MRI parameter to assess treatment response in osteosarcoma. J Magn Reson Imaging. 2022;56(2):538–546. doi:10.1002/jmri.28023
39. Lee J, Kim CK, Gu KW, Park W. Value of blood oxygenation level-dependent MRI for predicting clinical outcomes in uterine cervical cancer treated with concurrent chemoradiotherapy. Eur Radiol. 2019;29(11):6256–6265. doi:10.1007/s00330-019-06198-5
40. Bo S, Song C, Li Y, et al. Design and synthesis of fluorinated amphiphile as (19)F MRI/Fluorescence dual-imaging agent by tuning the self-assembly. J Org Chem. 2015;80(12):6360–6366. doi:10.1021/acs.joc.5b00810
41. Weidner N, Semple JP, Welch WR, Folkman J. Tumor angiogenesis and metastasis--correlation in invasive breast carcinoma. N Engl J Med. 1991;324(1):1–8. doi:10.1056/NEJM199101033240101
42. Ayan S, Gunaydin G, Yesilgul-Mehmetcik N, Gedik ME, Seven O, Akkaya EU. Proof-of-principle for two-stage photodynamic therapy: hypoxia triggered release of singlet oxygen. Chem Commun. 2020;56(94):14793–14796. doi:10.1039/d0cc06031c
43. Siewert B, Stuppner H. The photoactivity of natural products - An overlooked potential of phytomedicines. Phytomedicine. 2019;60:152985. doi:10.1016/j.phymed.2019.152985
44. Gupta M, Sahu A, Mukherjee T, et al. Divulging the potency of naturally derived photosensitizers in green PDT: an inclusive review of mechanisms, advantages, and future prospects. Photochem Photobiol Sci. 2025;24(1):191–214. doi:10.1007/s43630-024-00669-5
45. Diaferia C, Gianolio E, Accardo A. Peptide-based building blocks as structural elements for supramolecular Gd-containing MRI contrast agents. J Pept Sci. 2019;25(5):e3157. doi:10.1002/psc.3157
46. Maeda H. The enhanced permeability and retention (EPR) effect in tumor vasculature: the key role of tumor-selective macromolecular drug targeting. Adv Enzyme Regul. 2001;41:189–207. doi:10.1016/s0065-2571(00)00013-3
47. Maeda H, Fang J, Inutsuka T, Kitamoto Y. Vascular permeability enhancement in solid tumor: various factors, mechanisms involved and its implications. Int Immunopharmacol. 2003;3(3):319–328. doi:10.1016/S1567-5769(02)00271-0
48. Padhani AR, Krohn KA, Lewis JS, Alber M. Imaging oxygenation of human tumours. Eur Radiol. 2007;17(4):861–872. doi:10.1007/s00330-006-0431-y
49. Lee J, Han S, Thapa Magar TB, et al. Efficient assessment of tumor vascular shutdown by photodynamic therapy on orthotopic pancreatic cancer using high-speed wide-field waterproof galvanometer scanner photoacoustic microscopy. Int J Mol Sci. 2024;25(6). doi:10.3390/ijms25063457
50. Shi C, Liu D, Xiao Z, et al. Monitoring tumor response to antivascular therapy using non-contrast intravoxel incoherent motion diffusion-weighted MRI. Cancer Res. 2017;77(13):3491–3501. doi:10.1158/0008-5472.CAN-16-2499
51. Yuan Y, Zeng D, Liu Y, et al. DWI and IVIM are predictors of Ki67 proliferation index: direct comparison of MRI images and pathological slices in a murine model of rhabdomyosarcoma. Eur Radiol. 2020;30(3):1334–1341. doi:10.1007/s00330-019-06509-w
52. Ye YJ, Huang XJ, Luo BC, Wang XY, Cai XR. Application of multiparametric magnetic resonance imaging to monitor the early antitumor effect of CuS@GOD nanoparticles in a 4 T1 breast cancer xenograft model. J Magn Reson Imaging. 2022;55(1):301–310. doi:10.1002/jmri.27867
53. Dolmans DE, Kadambi A, Hill JS, et al. Vascular accumulation of a novel photosensitizer, MV6401, causes selective thrombosis in tumor vessels after photodynamic therapy. Cancer Res. 2002;62(7):2151–2156. PMID: 11929837.
54. Guo J, Zhao W, Xiao X, et al. Reprogramming exosomes for immunity-remodeled photodynamic therapy against non-small cell lung cancer. Bioact Mater. 2024;39:206–223. doi:10.1016/j.bioactmat.2024.05.030
55. McMorrow R, de Bruijn HS, Farina S, et al. Combination of bremachlorin PDT and immune checkpoint inhibitor Anti-PD-1 shows response in murine immunological T-cell-high and T-cell-low PDAC models. Mol Cancer Ther. 2025;24(4):605–617. doi:10.1158/1535-7163.MCT-23-0733
56. Zhou Z, Zhang L, Zhang Z, Liu Z. Advances in photosensitizer-related design for photodynamic therapy. Asian J Pharm Sci. 2021;16(6):668–686. doi:10.1016/j.ajps.2020.12.003
57. Lippert TP, Greenberg RA. The abscopal effect: a sense of DNA damage is in the air. J Clin Invest. 2021;131(9). doi:10.1172/JCI148274
58. Le Bihan D. What can we see with IVIM MRI. Neuroimage. 2019;187:56–67. doi:10.1016/j.neuroimage.2017.12.062
 © 2026 The Author(s). This work is published and licensed by Dove Medical Press Limited. The
full terms of this license are available at https://www.dovepress.com/terms
and incorporate the Creative Commons Attribution
- Non Commercial (unported, 4.0) License.
By accessing the work you hereby accept the Terms. Non-commercial uses of the work are permitted
without any further permission from Dove Medical Press Limited, provided the work is properly
attributed. For permission for commercial use of this work, please see paragraphs 4.2 and 5 of our Terms.
© 2026 The Author(s). This work is published and licensed by Dove Medical Press Limited. The
full terms of this license are available at https://www.dovepress.com/terms
and incorporate the Creative Commons Attribution
- Non Commercial (unported, 4.0) License.
By accessing the work you hereby accept the Terms. Non-commercial uses of the work are permitted
without any further permission from Dove Medical Press Limited, provided the work is properly
attributed. For permission for commercial use of this work, please see paragraphs 4.2 and 5 of our Terms.
Recommended articles
An Experimental Study into the Photodynamic/Sonodynamic Therapy of Triple-Negative Breast Cancer Mediated by the Novel Nano-Photonic Sensitizer NBDPBr Nanoparticles
Huang Q, Wang L, Zhang Y, Zhao L, Zhang T
International Journal of Nanomedicine 2026, 21:576927
Published Date: 28 March 2026
Discrimination of Triple-Negative Breast Cancer: A Robust Clinical Baseline versus Multimodal Magnetic Resonance Imaging Integrated Models with Assessment of Generalizability
Liao X, Wu X, Zheng J, Lin G, Lin D
Breast Cancer: Targets and Therapy 2026, 18:594356
Published Date: 2 April 2026
Clinical Outcomes and Treatment-Related Complications in Triple-Negative Breast Cancer: A Review of 24 Case Reports from 2020 to 2025
Febriyanti RM, Hakim MLN, Rofiidatul I, Islami MS, Utami PS, Qurrotuaini SP, Halimah E, Mohd Hashim N, Diantini A
Therapeutics and Clinical Risk Management 2026, 22:619823
Published Date: 30 June 2026