Back to Journals » Blood and Lymphatic Cancer: Targets and Therapy » Volume 16
Metabolic Subtypes Predict Treatment Response in Acute Myeloid Leukemia: A Pilot Study
Authors Yan C ![]() , Huang Y, Cai Q, Li X, Yang Q, Feng G, Yang H, Chen Y, Hu J
, Huang Y, Cai Q, Li X, Yang Q, Feng G, Yang H, Chen Y, Hu J
Received 5 April 2026
Accepted for publication 8 June 2026
Published 16 June 2026 Volume 2026:16 612305
DOI https://doi.org/10.2147/BLCTT.S612305
Checked for plagiarism Yes
Review by Single anonymous peer review
Peer reviewer comments 2
Editor who approved publication: Dr Wilson Gonsalves
Changjian Yan,1,2,* Yan Huang,3,* Qing Cai,1,2,* Xiang Li,1,2 Qinwen Yang,1 Gang Feng,1,2 Huilin Yang,1,2 Yanxin Chen,4 Jianda Hu1,2,4
1Department of Hematology, The Second Affiliated Hospital of Fujian Medical University, Quanzhou, Fujian, People’s Republic of China; 2Institute of Precision Medicine, Fujian Medical University, Fuzhou, Fujian, People’s Republic of China; 3Phase I Clinical Trial Unit, Fujian Medical University Union Hospital, Fuzhou, Fujian, People’s Republic of China; 4Department of Hematology, Fujian Medical University Union Hospital, Fuzhou, Fujian, People’s Republic of China
*These authors contributed equally to this work
Correspondence: Jianda Hu, Department of Hematology, The Second Affiliated Hospital of Fujian Medical University, No. 950 Donghai Road, Quanzhou, Fujian, 362000, People’s Republic of China, Email [email protected] Yanxin Chen, Department of Hematology, Fujian Medical University Union Hospital, No. 29 Xinquan Road, Fuzhou, Fujian, 350001, People’s Republic of China, Email [email protected]
Introduction: To establish a dynamic metabolic subtyping system for acute myeloid leukemia (AML) based on longitudinal metabolomics and multi-omics integration, and to evaluate its ability to predict treatment response.
Methods: We enrolled 29 AML patients and performed untargeted metabolomics on pre‑ and post-treatment serum samples. Based on finite cyclic combinations of metabolic pathways, pre-treatment patients were classified into G1 (glycolysis/gluconeogenesis/TCA cycle) and G2 (fatty acid/folate biosynthesis). Post‑treatment patients were categorized into TG1 (α-linolenic acid metabolism, pantothenate/CoA biosynthesis) and TG2 (purine metabolism, cysteine/methionine metabolism). Baseline transcriptome data were integrated and validated in three external cohorts (Beat2, GSE6891, GSE37642; total n=994). Single cell and spatial transcriptomics were used to investigate cellular heterogeneity and resistance mechanisms.
Results: The complete remission (CR) rate was significantly higher in G2 (71%) than in G1 (29%). After treatment, TG2 showed an 83% CR rate versus 17% in TG1. All patients transitioning from G2 to TG2 achieved CR (100%), whereas those from G1 to TG2 maintained poor response. Baseline metabolic subtype was an independent predictor of treatment response (p< 0.05). To explore candidate cellular niches linking G1 metabolic features to chemotherapy resistance, we further integrated single-cell and spatial transcriptomic analyses. The results revealed co-localization of CA2-high immature erythrocytes and neutrophils in non-CR patients.
Discussion: Dynamic metabolic subtyping (G1/G2, TG1/TG2) strongly correlates with AML treatment response. The co-localization of CA2-high immature erythrocytes and neutrophils in the bone marrow microenvironment of non-CR patients provides a candidate cellular and microenvironmental correlate of the G1 metabolic phenotype, suggesting a mechanistic link between systemic metabolic reprogramming and chemotherapy resistance. Collectively, these findings highlight the potential of combining dynamic metabolic subtyping with identified microenvironmental features to guide precision therapy.
Keywords: acute myeloid leukemia, metabolic reprogramming, subtyping, treatment response, metabolomics
Background
Acute Myeloid Leukemia (AML) is a highly heterogeneous and poor-prognosis hematologic malignancy. Nearly half of the patients fail to achieve complete remission (CR) after initial treatment and progress to drug resistance, highlighting the urgent need for accurate subtyping to guide personalized treatment.1 Traditional FAB morphological classification is limited by subjectivity, and genetic classifications (eg, the ELN guidelines) still leave certain populations unclassified. Metabolic reprogramming, a core driving mechanism in AML, has been confirmed, but its potential in clinical classification and treatment guidance is yet to be fully realized.2 Studies on the metabolic features of AML have revealed significant alterations in glycolysis, glycerophospholipid metabolism, the tricarboxylic acid (TCA) cycle, gluconeogenesis, fatty acid metabolism, and glutamine metabolism in FLT3-ITD AML cells treated with arsenic trioxide (ATO) or all-trans retinoic acid (ATRA).3 Inhibition of oxidative phosphorylation, glycolysis, or glutamine metabolism can suppress AML cell proliferation and enhance the efficacy of cytarabine chemotherapy, reducing resistance.4,5 Research by Chen and others has shown that under glucose-restricted conditions, AML cells use the GLUT5 transporter, encoded by the SLC2A5 gene, to import fructose.6 The expression level of GLUT5 is negatively correlated with patient prognosis, suggesting that GLUT5 could become a new therapeutic target for AML.
Despite the growing recognition of metabolic reprogramming in AML, previous metabolomics studies have several critical limitations that have hindered their clinical translation. First, most studies adopted a static, single-time-point sampling design,3 which fails to capture the dynamic metabolic evolution during the course of treatment. Second, the majority of investigations remained at a single-omics level, lacking integration with genomics, transcriptomics, or the tumor microenvironment. Third, they often focused on a single metabolic pathway or a single molecular target,6 without establishing a classification system that could stratify patients to guide clinical decision-making. Consequently, the findings from earlier metabolomics studies have rarely been translated into clinical practice. Addressing these gaps, the present study aims to develop a dynamic metabolic subtyping framework based on multi-omics integration, and pathway-based classification, with the goal of predicting treatment response in AML.
This study aimed to define pre-treatment (G1 and G2) and post-treatment (TG1 and TG2) metabolic subtypes of AML based on metabolomic data from 29 AML patients, demonstrating significant correlations with treatment responses and prognosis. Additionally, spatial transcriptomics identified a co-localization of immature erythrocytes (Ery_CA2high) and neutrophils in the bone marrow microenvironment of G1 subtype patients, providing insights into potential mechanisms of drug resistance in non-CR patients. This classification system not only provides a metabolic dimension for precise AML diagnosis but also directly translates into treatment strategies.
Methods
Patients and Study Design
This study included 29 patients with non-M3 AML diagnosed and treated at the Affiliated Xiehe Hospital of Fujian Medical University between June and December 2021. All AML patients were diagnosed based on the 2016 World Health Organization (WHO) classification of hematologic and lymphoid malignancies. Patients were risk-stratified according to the 2022 European Leukemia Net (ELN) adult AML prognosis guidelines.7 Detailed clinical characteristics are summarized in Table 1. Of the 29 patients, 18 received the standard IA chemotherapy regimen (idarubicin plus cytarabine), while the other 11 were treated with targeted agents (Venetoclax, Gilteritinib, or Afatinib), either as monotherapy or in combination with IA chemotherapy and/or azacytidine. The last follow-up date was December 2024.
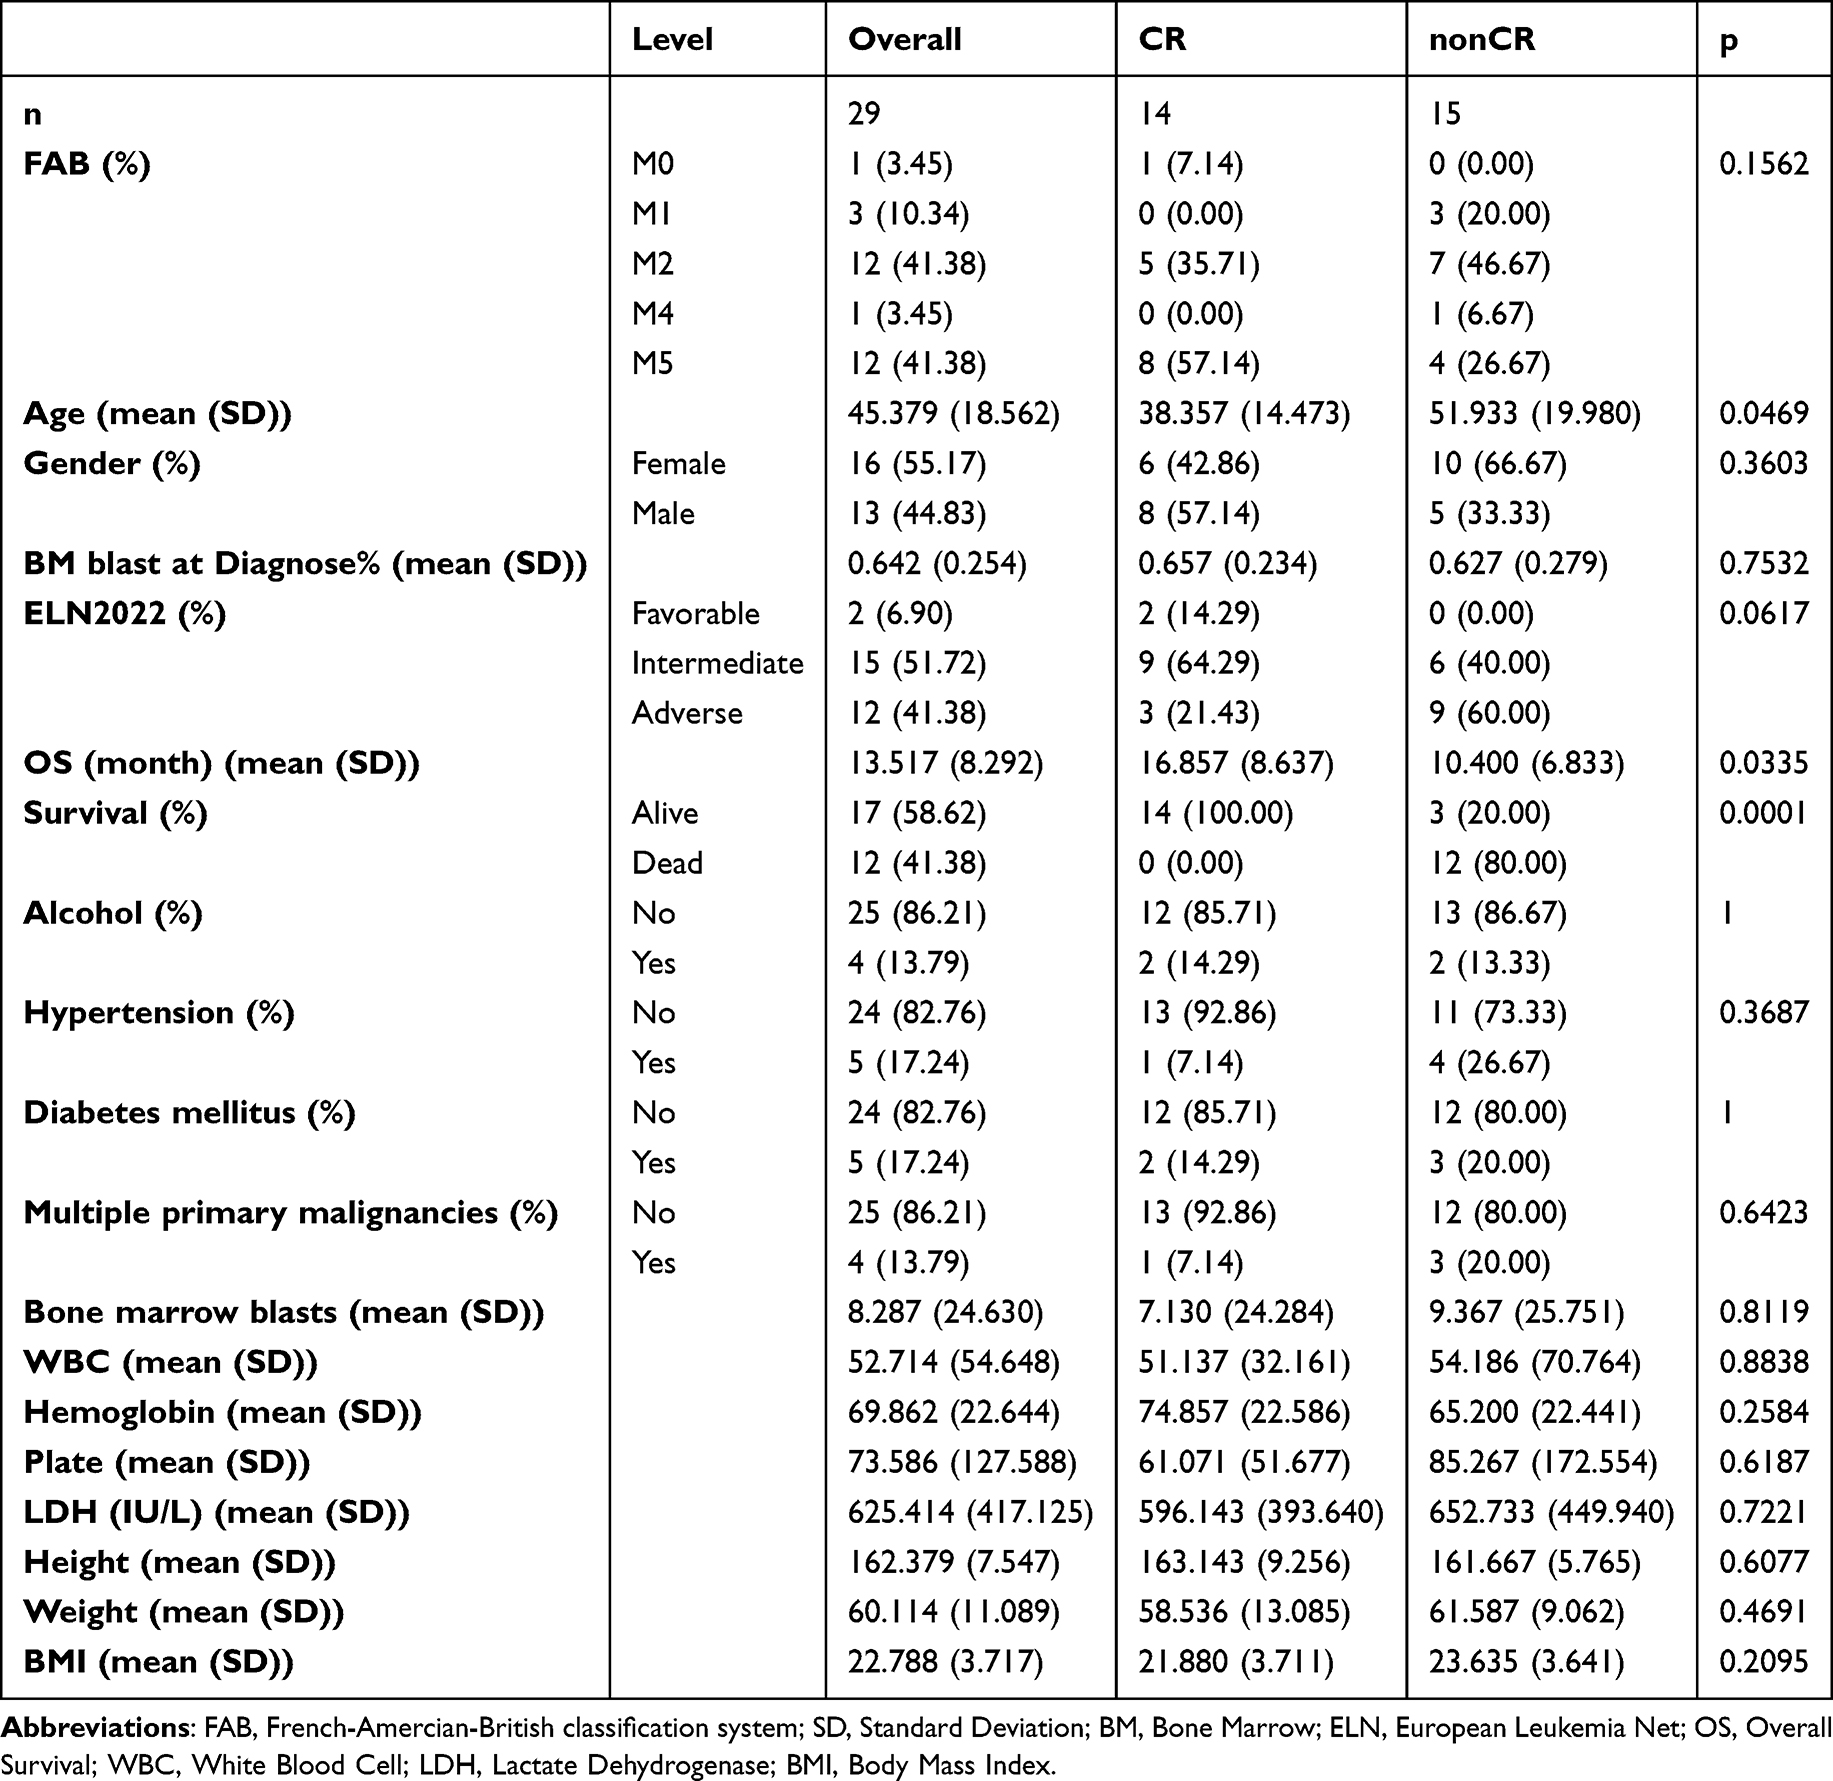 |
Table 1 Baseline Characteristics of AML Patients with Different Treatment Responses |
Serum Sample Collection
Serum samples were collected from 29 AML patients at different treatment stages. A total of 50 serum samples were collected, including 29 pre-treatment baseline samples and 21 post-induction treatment samples (usually taken between day 29 and before the next treatment cycle). After overnight fasting, blood samples were collected, and serum was separated following the procedure: the blood was allowed to stand at room temperature for 60 minutes and then centrifuged at 3000 rpm for 10 minutes at 4°C. The supernatant was collected, aliquoted into appropriately labeled tubes, and rapidly frozen in liquid nitrogen for 10 minutes. Serum samples were stored at −80°C until metabolite extraction.
Metabolite Extraction
The samples stored at −80°C were thawed on ice and gently vortexed for 10 seconds. A 200 μL sample was mixed with 200 μL of extraction solution containing internal standards (ACN: methanol = 1:4, V/V). The mixture was vortexed for 3 minutes, followed by centrifugation at 12,000 rpm for 10 minutes at 4°C. 350 μL of the supernatant was collected and concentrated to dryness. The residue was re-dissolved in 150 μL of solution (methanol: water = 7:3, V/V), vortexed for 3 minutes, and subjected to sonication for 10 minutes in an ice water bath. The solution was then centrifuged at 12,000 rpm for 3 minutes, and 120 μL of the supernatant was transferred for LC-MS analysis.
QTOF-MS/MS Analysis
A Triple TOF mass spectrometer was chosen for this study because it can acquire MS/MS spectra in Information Dependent Acquisition (IDA) mode for LC/MS experiments. Data collection was performed using the TripleTOF 6600 AB SCIEX system, where the system continuously evaluates full scan MS data and triggers MS/MS spectra collection based on preset criteria. In each cycle, 12 precursor ions with intensities greater than 100 were selected for fragmentation at a collision energy of 30 eV (resulting in 12 MS/MS events, each with a product ion accumulation time of 50 ms). Source parameters were optimized for ionization and detection conditions to provide optimal results for comprehensive metabolomics analysis.
Metabolomics Data Preprocessing
Compound Discovery (CD) software (Thermo, USA) was used to process LC-MS ion data, performing peak extraction, peak alignment, unknown compound detection, and database matching. The software also provided final ion feature information. After quality control correction using the QC-RLSC (Quality Control-Robust LOESS Signal Correction) model, the ion data were normalized and log2-transformed. Human endogenous metabolites were identified based on analysis of the HMDB database. Subsequent analyses were conducted using R programming language.
KEGG Metabolic Pathway Gene Set Variation Analysis (GSVA)
We collected AML-related KEGG metabolic pathways from the literature (including “amino acid metabolism”, “carbohydrate metabolism”, “energy metabolism”, “lipid metabolism”, “cofactor and vitamin metabolism”, and “nucleotide metabolism”) for further analysis.8 GSVA was performed using the GSVA package, and pathway enrichment scores were calculated for each sample using the ssgsea method. Gaussian kernel functions were used to process the data distribution. GSVA results were further analyzed for significant differences between treatment response groups. This method was applied to both pre-treatment and post-treatment serum and urine metabolomics data.
Combination of KEGG Metabolic Pathways for Finite Loop Analysis
We compared the GSVA results for the CR and non-CR groups before treatment and selected metabolic pathways with p-value <0.1 for further combination. After fixing the top two pathways, additional metabolic pathways were randomly combined, ensuring that each combination contained at least five metabolic pathways.9 cNMF clustering was applied, considering metabolic subtype differences between non-CR and CR groups and the p-values of combination profiles. This approach was also applied to metabolic pathway combination screening for post-treatment data.
Analysis of Differential Metabolic Pathways and Compounds Between Subtypes
Differential analysis between two groups was conducted using the t-test function from the “stats” package, identifying differential metabolic pathways and metabolites between groups. Heatmaps were generated using the “ComplexHeatmap” package, and box plots were drawn using the “ggplot2” package to visualize the differences. This method was applied to both pre-treatment and post-treatment blood and urine samples for analysis and visualization.
Correlation Between Pre- and Post-Treatment Metabolic Subtypes
Sankey diagrams were constructed using the “ggalluvial” package to illustrate the conversion between different metabolic subtypes before and after treatment. The data in the Sankey diagram represent the number of changes (ie, weight) for each metabolic subtype before and after treatment. Visualizations were also generated using “ggplot2” to show the proportions of metabolic subtype combinations before and after treatment across different treatment stages. Venn diagrams were drawn using the “eulerr” package to show the overlap of pathways and metabolic compounds between different subtypes.
Differential Gene Expression Visualization
Transcriptome sequencing was performed on peripheral blood samples from 29 AML patients before treatment. Using Total RNA extracted from the samples, mRNA was specifically enriched using Oligo dT magnetic beads, reverse-transcribed into cDNA, and sequencing libraries were constructed for transcript sequencing. Differences between non-CR and CR groups in specific metabolic pathways were analyzed, and box plots were generated to display the differences using the “ggplot2” package.
Mutation and Fusion Gene Differences Between Metabolic Subtypes
Pre-treatment bone marrow/peripheral blood samples from 29 patients were collected for detection of common mutations and fusion genes, including 17 common mutation genes (eg, FLT3, NPM1, CEBPA, DNMT3A, IDH1, IDH2, TET2, ASXL1, TP53, WT1, RUNX1, KIT, PHF6, NRAS, KRAS, SRSF2, SF3B1) and 43 common fusion genes (eg, MLL/AF4, MLL/AF17, MLL/ELL, AML1/ETO, PML/RARa, NuMA1/RARa, ETV6/RUNX1, ETV6/ABL1, ETV6/PDGFR). We used multiplex PCR amplification to detect 17 mutations and NextSeq550 sequencing for gene fusion detection using Illumina platforms. FLT3-ITD was detected by PCR, and gene fusion was detected by multiplex nested RT-PCR. Bar plots were created using the “ggplot2” package to show the correlation between pre-treatment metabolic subtypes and fusion genes and mutations.
Correlation Between Different Metabolic Subtypes and Clinical Features and Prognosis
We visualized the clinical feature differences between different metabolic subtypes using the “ggplot2” package. Survival curves were fitted using the “survfit” function in the survival package. Kaplan-Meier survival curves were plotted using the “survminer” package, and the statistical significance of survival differences between groups was assessed using the Log rank test (via the “survdiff” function).
Univariate and Multivariate Regression Analysis
Univariate regression analysis was performed on pre-treatment metabolic subtypes and clinical information using a logistic regression model (glm function in the “stats” package), selecting significant variables. The “autoReg” package was used for variable selection and model optimization. Variables with p-value <0.05 were retained for multivariate regression modeling to identify key factors related to clinical treatment response.
AML Single-Cell and Spatial Data Collection and Analysis
We collected scRNA data from 20 pre-treatment AML samples from the GSE130756 and GSE198681 datasets. Standard downstream analysis was performed using Scanpy v1.11.1, and cells were filtered using the following criteria: mitochondrial gene expression <15%, total count >1000, and gene count >500. Scrublet was used to pre-predict doublets. A total of 93,873 high-quality cells were analyzed, with batch correction using the Harmony method. Cluster resolution was set to 2, and UMAP was used for visualization.
Spatial Transcriptomics Data Collection and Analysis
One non-CR AML patient’s spatial transcriptomics sample was collected from GSE255217. Given that only one sample was available, independent validation using larger cohorts is needed to confirm these findings. Downstream analysis was performed using spacexr V2.2.1 software, and spatial transcriptomics deconvolution was conducted using RCTD. SpaCET V1.3.0 was used to compute spatial co-localization of cell types.
Summary Diagram Creation
The summary diagram was created using BioRender (https://BioRender.com).
Statistical Analysis
Statistical analysis and software development were performed using R 4.4.1. Data following normal distribution were expressed as mean ± standard deviation (SD). For paired comparisons, independent sample t-tests were used; for multiple group comparisons, ANOVA was employed. Data not following normal distribution were expressed as median and interquartile range [P25, P75], with group comparisons performed using the Mann–Whitney U-test (for two groups) and Kruskal–Wallis test (for multiple groups). Categorical data were presented as frequencies and percentages (%) and compared using the chi-square test (χ2). A p-value of <0.05 was considered statistically significant.
Results
Construction and Characterization of Pre-Treatment Metabolic Subtypes (G1/G2)
To explore the distribution of metabolic subtypes in pre-treatment AML patients, we analyzed the proportion of metabolites to understand the relative abundance differences of various metabolites in the serum of AML patients (Figure 1A). Through quantitative detection and comparison, we identified significantly differentially expressed metabolites in the serum of AML patients (Supplementary Tables 1 and 2). Next, we analyzed the metabolic pathways involved in these differential metabolites (Supplementary Table 3). We collected 289 KEGG metabolic pathways, of which 55 were closely related to AML (Figure 1B). Upon further analysis of the differential metabolic pathways between the CR and non-CR groups, we found distinct pathway characteristics in different treatment response groups (Supplementary Table 4). In the non-CR group, the differential metabolic pathways were mainly related to pyrimidine metabolism, phenylalanine metabolism, glycolysis, gluconeogenesis, and the TCA cycle. In the CR group, the differential metabolic pathways mainly included fatty acid biosynthesis, folate metabolism, and purine metabolism (Figure 1C). Pre-treatment, we used a limited cycle metabolic pathway combination to generate 99 different metabolic subtype combinations and selected the optimal combination (p=0.005, si=1) to classify the pre-treatment population into G1 and G2 subtypes (Figure 1D–F). Correlation and differential heatmaps further confirmed the reliability of the G1 and G2 classification based on metabolic pathways. Glycolysis, gluconeogenesis, pyrimidine metabolism, phenylalanine metabolism, and the TCA cycle were upregulated in non-CR and G1 groups, while fatty acid biosynthesis, folate biosynthesis, and purine metabolism were upregulated in CR and G2 groups (Figure 1G and H). Statistically significant differences were observed in the TCA cycle, glycolysis, gluconeogenesis, fatty acid biosynthesis, and folate metabolism between G1 and G2 (t-test, p<0.05, Figure 1I and L). These differences provide a foundation for personalized treatment of AML patients.
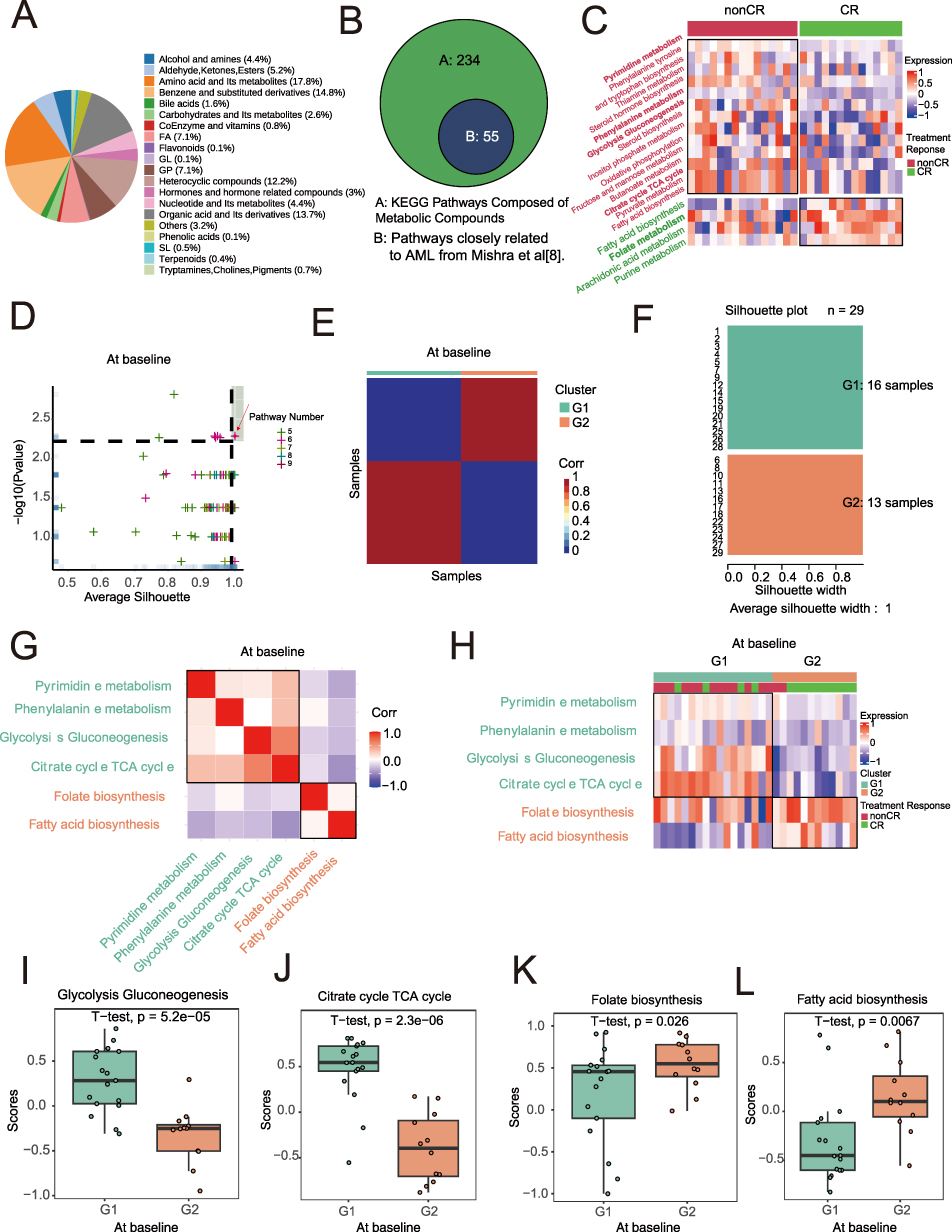 |
Figure 1 Metabolic Subtypes of Baseline AML Samples. (A) serum metabolite classification. (B) 55 metabolic pathways closely associated with Acute Myeloid Leukemia (AML) as identified in Mishra’s study. (C) Heatmap of differential metabolic pathways associated with treatment response, with annotated metabolic pathways. (D) Metabolic subtyping based on different combinations of metabolic pathways, with the optimal subtype selected using average silhouette coefficient and treatment response proportion within subgroups. The red arrow points to the spot corresponding to the pre-treatment combination of metabolic pathways that we ultimately selected. (E) Heatmap of sample similarity matrix for the optimal metabolic subtype at baseline and treatment response. (F) Silhouette width analysis for the optimal metabolic subtype at baseline. (G) Correlation heatmap of treatment response-related pathways. (H) Heatmap of metabolic pathways associated with metabolic subtypes. (I–L) Significant differential metabolic pathways between G1 and G2 subtypes at baseline in AML samples. |
Construction and Characterization of Post-Treatment Metabolic Subtypes (TG1/TG2)
To explore the construction and characteristics of post-treatment metabolic subtypes, we first performed gene set variation analysis (GSVA) on the post-treatment samples. The results showed that compared with CR patients, non-CR patients mainly enriched in pathways related to amino acid metabolism (such as arginine and proline), coenzyme metabolism (such as coenzyme A (CoA), short-chain fatty acid (propionate, butyrate metabolism)) (Figure 2A and Supplementary Table 5). We then applied a limited cycle metabolic pathway classification method to post-treatment samples. From 99 pathway combinations, we selected the optimal combination (p=0.002, average silhouette width=0.95) to classify the post-treatment samples into TG1 and TG2 (Figure 2B–D). Clustering and heatmap results showed that non-CR and TG1 were mainly enriched in α-linolenic acid metabolism, biotin metabolism, and pantothenate, CoA biosynthesis, while CR and TG2 mainly upregulated cysteine and methionine metabolism, glycerophospholipid metabolism, and purine metabolism (Figure 2E and F). Statistically significant differences were found between TG1 and TG2 in pantothenate and CoA biosynthesis, biotin metabolism, cysteine and methionine metabolism, and glycerophospholipid metabolism (t-test, p<0.05, Figure 2G–J).
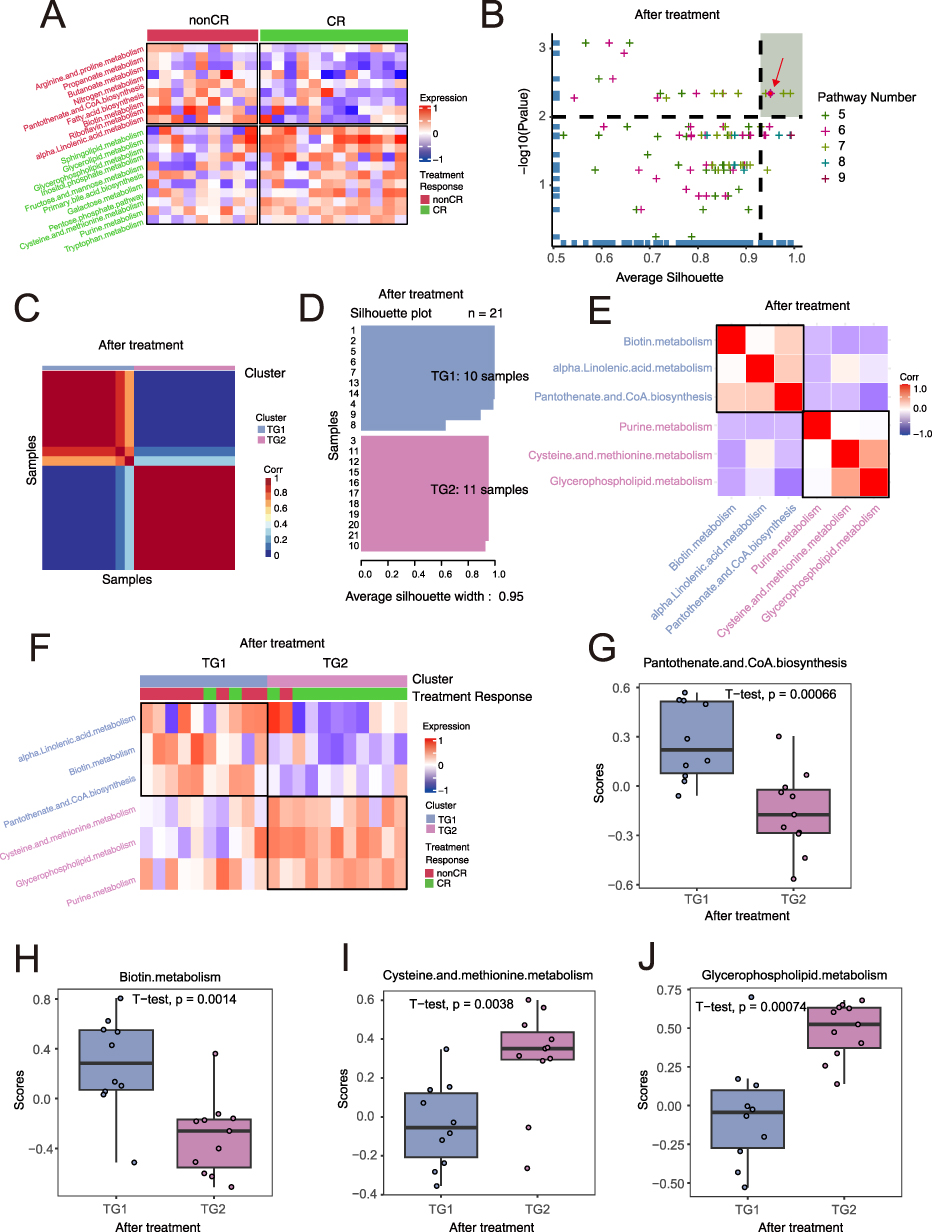 |
Figure 2 Metabolic Subtypes of Post-treatment AML Samples. (A) Heatmap of differential serum metabolites between non-CR (complete remission) and CR (complete remission). (B) Metabolic subtyping based on different combinations of metabolites, with the optimal subtype selected using average silhouette coefficient and treatment response proportion within subgroups. (C) Heatmap of sample similarity matrix for the optimal metabolic subtype and treatment response. (D) Silhouette width analysis for the optimal metabolic subtype post-treatment. (E) Correlation heatmap of metabolic pathways related to the optimal metabolic subtype after treatment. The spot indicated by the red arrow represents the pre-treatment metabolic pathway combination we ultimately selected. (F) Heatmap of differential metabolic pathways related to metabolic subtypes, with annotated metabolic pathways. (G–J) Significant differential metabolic pathways between TG1 and TG2 subtypes post-treatment in AML samples. A t-test was used to compare metabolite differences between the pre-treatment and post-treatment groups, and the p-values are presented in the figure. |
We displayed the main differential metabolites in G1 and G2 in a heatmap (Figure 3A). We then further detailed the distribution of these differential metabolites across different groups (Supplementary Table 6), observing that succinic acid, organic acids and derivatives, uridine triphosphate (UTP), and N-acetyl-L-phenylalanine were highly expressed in G1, while FFA (18:0) and 2-hydroxyphenylacetic acid were highly expressed in G2 (t-test, p<0.05, Figure 3B). Differential metabolites in TG1 and TG2 post-treatment are shown in Figure 3C (Supplementary Table 7). 1-Acyl-sn-glycerol 3-phosphate and phosphatidate were highly expressed in TG1, while biotin, 5,6-dihydrouracil, pimelate, and L-glutamine were highly expressed in TG2 (t-test, p<0.05, Figure 3D).
 |
Figure 3 Dynamic Association of Metabolic Subtypes at Baseline and After Treatment. (A) Heatmap of differential metabolites related to metabolic subtypes at baseline, with annotated metabolites. (B) Six significant differential metabolites between G1 and G2 subtypes at baseline AML samples. For the statistical comparison of metabolites between the pre-treatment and post-treatment groups, a t-test was used, and the p-values are shown in the figure. (C) Heatmap of differential metabolites related to metabolic subtypes post-treatment, with annotated metabolites. (D) Six significant differential metabolites between TG1 and TG2 subtypes post-treatment in AML samples. A t-test was used to compare metabolite differences between the pre-treatment and post-treatment groups, and the p-values are presented in the figure. (E) Evolution of metabolic subtypes at Baseline and After Treatment (paired analysis of the same patient). (F) Treatment response proportion within metabolic subtype combinations. (G–J) Venn diagram analysis of subtype-specific metabolites across different metabolic subtypes. |
Dynamic Conversion of Metabolic Subtypes Before and After Treatment
To further explore the dynamic relationships between metabolic subtypes before and after treatment, we compared the baseline and post-treatment metabolic classifications. The analysis showed that 67% of samples in the baseline G1 subtype transitioned to the TG1 subtype after treatment, while 33% transitioned to TG2. In contrast, 22% of samples in the baseline G2 subtype transitioned to TG1, and 78% transitioned to TG2 (Figure 3E). Combining pre- and post-treatment metabolic classifications with treatment response as an outcome, we found that the G1+TG1 group had the worst treatment response, with a non-CR rate of 88%. The G2+TG2 group showed the best treatment response, with a 100% CR rate (Fisher test, p=0.00171, Figure 3F). However, given the relatively small post-treatment cohort (n = 21) and the limited sample sizes within each transitional subgroup, the observed extreme proportions may be susceptible to Type I error and require validation in larger prospective cohorts. Moreover, we found no common metabolic pathways between G1 and TG1 or between G2 and TG2 (Figure 3G and H). Additionally, we discovered some overlapping metabolites between the best and worst treatment responses. The results showed that there were no common metabolites between G1 and TG1, but two metabolites were common between G2 and TG2 (Figure 3I and J).
Dynamic Metabolic Subtypes are Closely Related to Molecular Genetic Features and Clinical Characteristics
Based on the key signaling pathways enriched with differential metabolites from G1 and G2, we combined transcriptomic data to analyze gene expression changes in metabolic pathways between the two subtypes (Figure 4A–F and Supplementary Figure 1A–D). In glycolysis and gluconeogenesis metabolism, we observed upregulation of ADH7, HK1, GALM, HKDC1, ADH6, ALDH3A1, ENO3, GAPDH, LDHC, PFKL, GPI, and AKR1A1 in G1 compared to G2 (Figure 4A and Supplementary Table 8). In TCA cycle metabolism, the expression of OGDHL, IDH3B, MDH2, ACO2, and ACLY was higher in G1 than in G2 (Figure 4B). In pyrimidine metabolism, CTPS1, ENTPD5, CMPK1, ENTPD4, UPP2, UCK1, NUDT2, DTYMK, and NT5C3A were higher in G1 (Figure 4C). We also observed similar metabolic features in the non-CR group as in G1 (Supplementary Table 9). In phenylalanine metabolism, AOC3, ALDH3A1, and DDC were higher in G1 (Figure 4D). In fatty acid biosynthesis, FABP5P14 expression was higher in G2 (Figure 4E). In folate metabolism, FTMT expression was higher in G2 (Figure 4F). Mutation rates were higher in G1, with STAG2, SF3B1, RUNX1, and BCOR occurring only in G1, and EZH2 mutations occurring only in G2 (Figure 4G). Additionally, compared to G1, the G2 group had a higher incidence of fusion genes, with TLS/ERG and MLL/AF17 occurring exclusively in G2 (Figure 4H). Comparing the clinical characteristics between G1 and G2 (Supplementary Table 1), we found significant differences in CR rate, blast cell percentage, BMI, hemoglobin levels, and overall survival (Figures 4I–M). Detailed clinical features for non-CR and CR groups before treatment are listed in Table 1. Univariate and multivariate logistic regression analyses showed that pre-treatment metabolic classification is a strong independent risk factor for treatment response (OR = 0.05, 95% CI: 0.00–0.54, p=0.013, Table 2). In the post-treatment group, only CR rate, age, and risk stratification showed significant differences between TG1 and TG2 (Figure 4N–P).
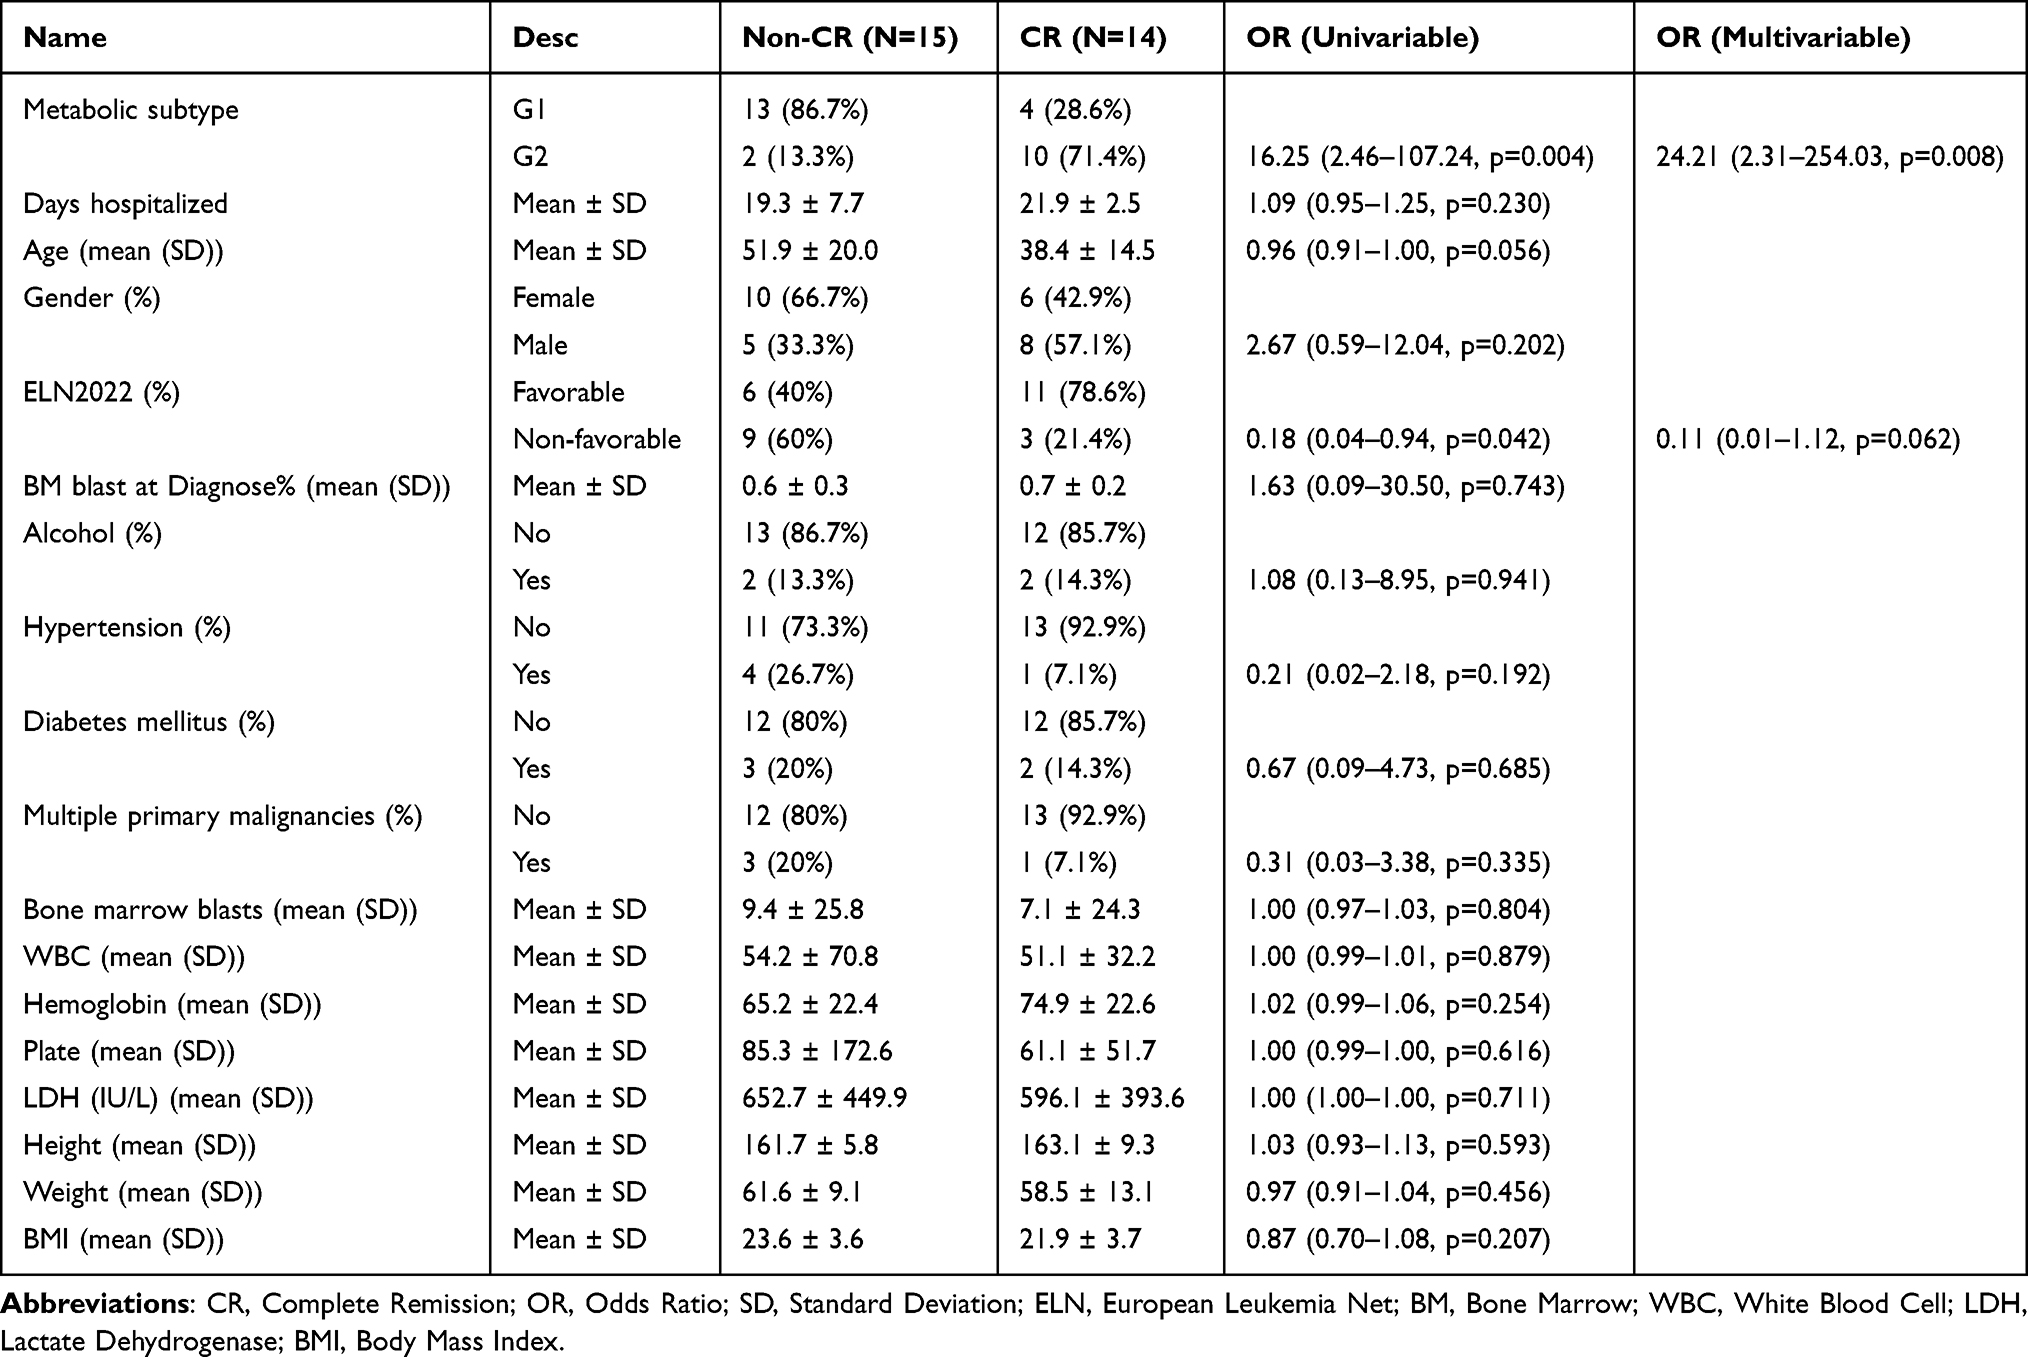 |
Table 2 Univariate and Multivariate Logistic Regression Results for AML Treatment Response at Baseline |
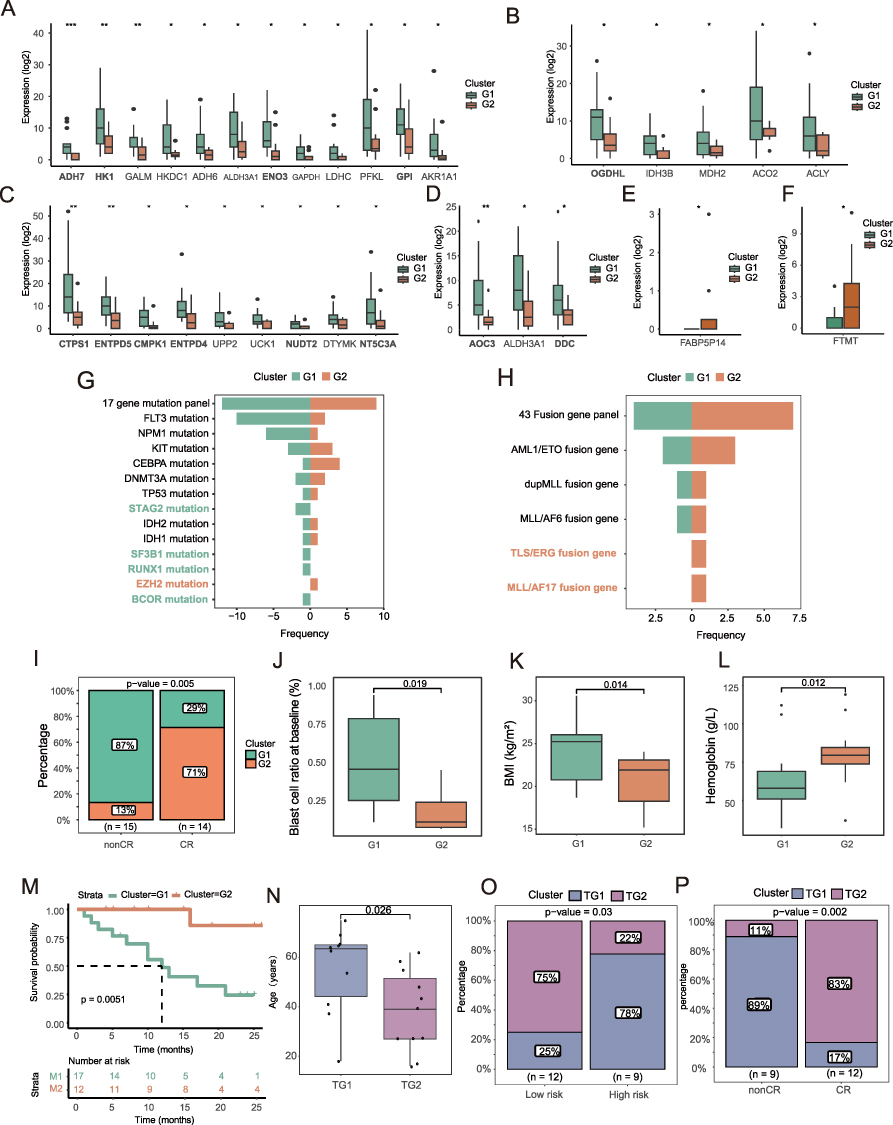 |
Figure 4 Association of Metabolic Subtypes with Clinical Features. (A) Expression differences of glycolysis and gluconeogenesis-related genes between G1 and G2 subtypes (Statistical significance was determined by t-test. ***p < 0.001, **p < 0.01, *p < 0.05). (B) Expression differences of TCA cycle-related genes between G1 and G2 subtypes (Statistical significance was determined by t-test. *p < 0.05). (C) Expression differences of pyrimidine metabolism-related genes between G1 and G2 subtypes (Statistical significance was determined by t-test. **p < 0.01, *p < 0.05). (D) Expression differences of phenylalanine metabolism-related genes between G1 and G2 subtypes (Statistical significance was determined by t-test. **p < 0.01, *p < 0.05). (E) Expression differences of fatty acid metabolism-related genes between G1 and G2 subtypes (Statistical significance was determined by t-test. *p < 0.05). (F) Expression differences of folate metabolism-related genes between G1 and G2 subtypes (Statistical significance was determined by t-test. *p < 0.05). (G) Frequency distribution of 17 AML-related gene mutations in G1 and G2 groups. (H) Frequency distribution of 43 leukemia-related fusion genes in G1 and G2 groups. (I) Treatment response proportion within metabolic subgroups at baseline. Statistical significance was assessed using ANOVA; the exact p-values are presented in the figure. (J–L) Correlation between clinical features and G1/G2 metabolic subtypes. Statistical significance was determined by t-test, and the specific p-values are shown in the figure. (M) Overall survival (OS) curve of baseline metabolic subtypes (OS time in months). (N) Treatment response proportion post-treatment based on metabolic subtypes. Statistical significance was determined by t-test, and the specific p-values are shown in the figure. (O) Differences in risk stratification between TG1 and TG2 subtypes. Statistical significance was assessed using ANOVA; the exact p-values are presented in the figure. (P) Correlation between post-treatment metabolic subtypes and treatment response. Statistical significance was assessed using ANOVA; the exact p-values are presented in the figure. |
External Validation with 994 Samples Confirmed the Relationship Between Pre-Treatment Metabolic Subtypes and Treatment Response and Prognosis
To further explore transcriptional-level pathway differences in pre-treatment metabolic subtypes, we displayed upregulated genes in G1 and G2 from transcriptome sequencing using volcano plots, with pathway enrichment analysis showing significant enrichment in sphingolipid metabolism, phospholipid biosynthesis, and cell cycle regulation pathways (Figure 5A and B). Venn diagrams showed significant gene co-expression between G1 and non-CR (103 genes), and between G2 and CR (25 genes) (Figure 5C and D). To verify the universality of metabolic subtypes, we used three external independent datasets: Beat2 (n=353), GSE6891 (n=505), and GSE37642 (n=136). Compared to G2, patients with the G1 metabolic subtype had significantly shorter overall survival (p-values <0.05), and in the Beat2 dataset, the non-CR rate for G1 was 62% (p=0.0366), consistent with the study’s conclusions. The metabolic subtypes demonstrated robust predictive ability for treatment response and prognosis in external validation (Figure 5E–L).
 |
Figure 5 Biological Features, Treatment Response, and Prognosis Validation for Baseline Metabolic Subtypes (G1/G2). (A) Volcano plot of genes upregulated in G1 and G2 subtypes at baseline. (B) Pathway enrichment analysis of differentially expressed genes for baseline metabolic subtypes. (C and D) Venn diagram analysis of differential genes related to metabolic subtypes and treatment response at baseline. (E–H) Correlation and prognostic differences of metabolic subtypes with treatment response and peripheral blood blast cell proportions in the Beat2 cohort. Statistical significance was determined by ANOVA and t-test, respectively, and the specific p-values are shown in the figure. (I and J) Prognostic validation of baseline metabolic subtypes using the GSE6891 dataset. (K and L) Prognostic validation of baseline metabolic subtypes using the GSE37642 cohort. |
Co-Localization of Neutrophils and Immature Erythrocytes (Ery_CA2high) in Non-CR AML Patients
Although serum metabolomics identified G1 as a subtype associated with poor treatment response, serum metabolites reflect systemic metabolic changes and cannot directly resolve which bone marrow cell components drive the chemoresistant phenotype in G1 patients. To bridge this gap and identify the cellular and molecular determinants of the G1/non-CR phenotype, we integrated publicly available single-cell RNA-seq data from 20 pre-treatment AML bone marrow samples (Supplementary Table 10) along with spatial transcriptomics data from one non-CR AML patient (GSE255217). By cross-referencing G1-specific differentially expressed genes in non-CR patients with cell-type-specific upregulated genes, we aimed to identify candidate cell populations and biomarkers that link metabolism to clinical outcomes. By intersecting the differentially expressed genes between G1 and G2 subtypes with the upregulated genes in each cell type from the single-cell data (non-CR vs. CR), we ultimately identified a key candidate molecule, CA2. The following results present the validation and mechanistic exploration of this molecule based on single-cell and spatial transcriptomic analyses. After quality control of the scRNA-seq data (Supplementary Figure 2), a total of 93,873 cells were included. Using surface markers, we classified the cells into eight types (Figure 6A), including T cells (12,899), B cells (2114), NK cells (9359), hematopoietic stem and progenitor cells (13,611), dendritic cells (14,053), immature erythrocytes (4647), monocytes (29,611), and neutrophils (7579) (Supplementary Table 11). UMAP visualization revealed a significant clustering difference between the CR and non-CR groups (Figure 6B). We identified two co-expressed genes, CA2 and PRSS57, by intersecting the top 15 upregulated genes in each cell type from G1 and non-CR groups (Figure 6C). In the AML bone marrow single-cell transcriptome, CA2 was specifically upregulated in the non-CR group (Figure 6D and E). Correlation analysis of cell type proportions revealed a significant positive correlation between CA2+ erythrocytes (Ery_CA2high) and neutrophils (Supplementary Table 12), and Single-cell spatial transcriptomics suggested a potential co-localization of CA2-high immature erythrocytes and neutrophils (Figure 6F–J). A summary diagram of the four metabolic phenotypes of AML is presented in Figure 7.
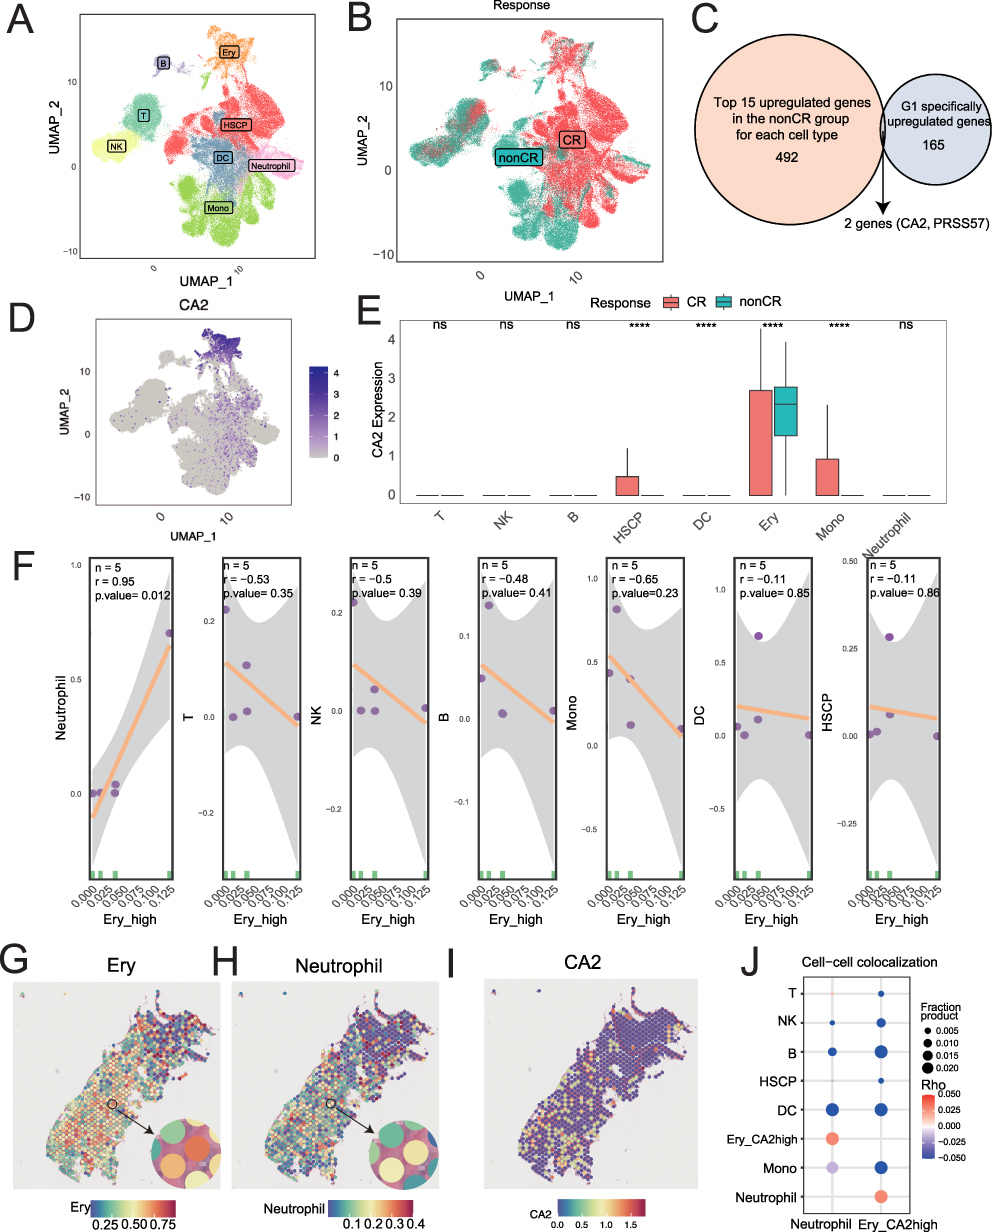 |
Figure 6 UMAP Visualization of Bone Marrow Cells in AML Patients. (A) UMAP visualization of various cell types in bone marrow from 20 AML patients. (B) UMAP visualization of bone marrow cells from AML patients with different treatment responses. (C) Intersection of the top 15 upregulated genes in each cell type from non-CR patients and 165 genes specifically upregulated in the G1 subtype. (D) UMAP visualization of CA2 gene expression across various bone marrow cells. (E) Expression differences of CA2 in different cell types from non-CR and CR groups (Statistical significance was determined by t-test. ****p < 0.0001; ns indicates no significant difference). (F) Correlation between the proportion of immature red blood cells with high CA2 expression and the proportions of other cell types. (G–I) Expression of CA2 gene in immature red blood cells, neutrophils, and other cells in spatial transcriptomics data from one non-CR AML patient’s bone marrow. (J) Exploration of spatial co-localization of neutrophils and immature red blood cells with high CA2 expression in spatial transcriptomics data. |
 |
Figure 7 Dynamic Metabolic Subtype Prediction for AML Treatment. Summary diagram of dynamic metabolic subtypes in predicting treatment response in AML patients. |
Discussion
AML is a malignant clonal disease originating from myeloid hematopoietic stem cells. Its typical symptoms include anemia, infections, bleeding, and signs of normal hematopoiesis suppression, as well as splenomegaly, lymphadenopathy, and leukemia cell infiltration. AML is highly heterogeneous, and despite continuous updates in treatment methods and drugs, its relapse and mortality rates remain high. Metabolomics, as an omics technology that directly reflects clinical phenotypes, offers advantages over genomics and epigenetics in providing disease susceptibility markers. It has been widely used in disease diagnosis, prognosis assessment, and the development of personalized treatment strategies. Our previous study revealed significant metabolic reprogramming in AML patients, with four metabolites—pseudouridine, O-phospho-L-serine, L-aspartate, and 2-deoxy-D-ribose 1-phosphat—being significantly elevated, mechanistically linking dysregulated nucleotide biosynthesis and adaptive amino acid metabolic reprogramming to leukemogenic proliferation. Building upon these findings, the present study further performed dynamic metabolic subtyping in AML patients by integrating metabolomic data collected before and after treatment, combined with transcriptomic, single-cell, and spatial transcriptomic analyses, to establish a metabolic subtype system that can guide precision therapy.10 Given that the metabolic heterogeneity in AML is closely associated with treatment resistance, identifying specific metabolic pathway abnormalities through metabolomics can provide crucial insights for the development of new therapeutic targets and overcoming resistance, highlighting its importance in AML research and clinical applications.
In this study, we collected paired pre- and post-treatment serum samples from 29 AML patients (50 samples total) and integrated transcriptomic analyses. Despite the limited sample size, we not only conducted untargeted serum metabolomic profiling to reveal AML-specific metabolic features, but also combined bulk transcriptome sequencing, single-cell RNA sequencing (scRNA-seq), and spatial transcriptomics to perform a comprehensive multi-omics investigation. Using this multi-omics integration strategy, we systematically analyzed the dynamic evolution of metabolic heterogeneity in AML during treatment, explored its association with gene expression, cell subpopulation composition, and microenvironment spatial distribution, and ultimately established a metabolic subtyping system highly correlated with clinical treatment response. Below, we discuss the relationship between metabolic features and clinical phenotypes, as well as potential mechanisms and therapeutic targets from four perspectives. Nevertheless, given that the post-treatment cohort consisted of only 21 patients, these findings still require validation in larger samples. The limited sample size reduces statistical power and increases the risk of Type I error, especially for the dynamic subtype transition results, where some subgroups contain very few patients. Therefore, the observed extreme remission rates should be considered exploratory and require validation in larger prospective multi-center cohorts.
Baseline metabolic analysis revealed that the G1 subtype patients were significantly enriched in pyrimidine metabolism and glycolysis pathways, with key metabolites such as uridine triphosphate (UTP) and succinic acid being upregulated. UTP, a form of pyrimidine uridine, can be converted into other pyrimidines, such as cytidine triphosphate (CTP). Through alternative pathways, cells can use UTP to synthesize uridine diphosphate (UDP)-glucose, an essential component in glycogen synthesis and other biochemical processes.11 A research team found that the expression of the genes UPP1 and UPP2 significantly promoted cell growth in glucose-deprived media, as these genes encode uridine phosphorylase that helps break down uridine. When uridine is the only food source for the cell, cells expressing UPP1 and UPP2 grow. In a knockout model of UPP1 in two homologous mouse pancreatic cancer cell lines, tumor growth was significantly reduced, metabolic changes occurred, blood vessel density was lower, and more anti-tumor T cells (CD8 T cells) were infiltrated.12 This suggests that UPP1 knockout inhibits PDA tumor growth. We observed similar metabolic remodeling features in the serum of AML patients. Succinic acid is generated from succinyl-CoA under the catalysis of succinyl-CoA synthetase, which is the only substrate-level phosphorylation reaction in the TCA cycle, generating ATP or GTP along with the hydrolysis of succinic acid.13 The signaling function of succinic acid mainly involves the stabilization of hypoxia-inducible factor-1α (HIF-1α) and protein succinylation.14 HIF-1α, as a crucial transcription factor under hypoxic conditions, promotes angiogenesis, the shift from oxidative respiration to glycolysis, as well as apoptosis and autophagy, and regulates multiple signaling pathways to promote tumor proliferation and metastasis.15 Recent studies have found that cancer cells release succinate to activate the succinate receptor (SUCNR1) signaling pathway, further promoting tumor migration, invasion, and distant metastasis via the phosphoinositide 3-kinase (PI3K)-HIF-1α axis.16,17 Additionally, succinylation is a significant post-translational modification that modulates enzyme activity and gene expression, participating in various life activities such as glycolysis, amino acid metabolism, fatty acid metabolism, ketogenesis, and reactive oxygen species (ROS) scavenging. Furthermore, the sustained activation of the TCA cycle (with upregulated expression of citrate synthase OGDHL in G1) suggests the potential role of mitochondrial metabolism in maintaining AML stemness, consistent with previous research.18 Certain cancer cell types enhance their dependence on mitochondrial oxidative metabolism during tumorigenesis to sustain their invasive proliferation capacity. This metabolic mode allows cancer cells to adapt to multiple carbon sources and maintain vigorous proliferation.19 Therefore, targeting mitochondrial function has become a research hotspot for oxidative metabolism-active cancers.
After treatment, the TG1 subtype showed significant activation of α-linolenic acid metabolism, biotin metabolism, and pantothenate-CoA biosynthesis pathways, suggesting that these mechanisms may lead to treatment resistance through pro-survival signal activation and metabolic adaptive reprogramming. Biotin, an essential vitamin in cellular energy metabolism, is highly demanded during tumor progression.20 Studies have shown that cancer cells overexpress biotin receptors on their surfaces to enhance biotin uptake, indicating that biotin could be a promising tumor-targeting ligand. Coenzyme A participates in numerous critical metabolic pathways such as the TCA cycle, fatty acid biosynthesis, and oxidation. Due to the rapid proliferation and high metabolic demands of tumor cells, they require large amounts of energy and biosynthetic materials. Pantothenate, converted into Coenzyme A, promotes the TCA cycle, allowing tumor cells to more effectively utilize glucose and other nutrients for energy production while providing raw materials for the synthesis of fatty acids, proteins, and other macromolecules to support tumor cell growth and proliferation. Activation of the pantothenate-CoA pathway can shift the metabolic state of tumor cells from relying on oxidative phosphorylation to a more glycolytic tumor metabolic mode (Warburg effect).21 This metabolic reprogramming helps tumor cells survive and proliferate in hypoxic or harsh environments. Studies have shown that in breast cancer PDX models with strong MYC transcriptional features, pantothenate levels are significantly elevated. Furthermore, tumor microsatellite instability (MSI) testing clearly shows that MYC high-expression areas within tumors exhibit elevated pantothenate levels.21 Further dietary control of systemic pantothenate levels in breast cancer mice, where mice were fed either a no-PA diet or a normal control diet, showed that tumor cells with the MYC-ER structure maintained vigorous proliferation in the normal control group. However, in the absence of PA, this growth advantage was lost, even increasing tumor cell death. In contrast, the TG2 subtype showed dominant activation of cysteine and methionine metabolism, glycerophospholipid metabolism, and purine metabolism.
Survival analysis further confirmed that patients with the G1 subtype had significantly shorter overall survival (p=0.0067). To confirm the universality of the metabolic subtypes, we performed validation in multiple external datasets, which consistently showed that G1 was associated with significantly shorter overall survival. The treatment efficacy of G2 and TG2 was superior to that of G1 and TG1, with patients transitioning from G2 to TG2 post-treatment having a 100% CR rate. In contrast, those who transitioned from G1 to TG1 had a lower CR rate, indicating that the metabolic microenvironment is dynamically changing during treatment and significantly affects treatment outcomes. Therefore, during treatment, evaluating the patient’s treatment response not only through imaging assessments but also by re-assessing their blood metabolome will provide a clearer understanding of the metabolic changes in the tumor microenvironment, allowing for more precise and personalized treatment adjustments.
By integrating single-cell transcriptomics and spatial analysis, we identified a highly specific and strong spatial correlation between immature erythrocytes (Ery_CA2high) and neutrophils in the tumor microenvironment of non-CR patients. Erythrocytes, the most abundant cell type in the blood, not only transport oxygen but also play roles in blood clotting and inflammation.22,23 Research suggests that erythrocytes interact with tumor cells via surface proteins such as galectin-4, which may affect tumor cell survival and metastasis.24,25 Neutrophils, which comprise about 70% of human circulating white blood cells, are among the most common immune cells in the tumor microenvironment.26 Historically, their role in chronic diseases like cancer has been underestimated due to their “short-lived” nature (traditionally thought to last only 8 hours, but modern research shows they can last up to 3 days) and low transcriptional activity.27 Neutrophils exhibit significant heterogeneity and functional plasticity, capable of both promoting tumor growth and being reprogrammed into anti-tumor phenotypes.28–30 Most tumor-associated neutrophils (TANs) show pro-tumor properties, promoting tumor progression by ROS, which induce DNA damage and mutations; secreting neutrophil elastase (NE) to activate the PI3K pathway in cancer cells, accelerating cell proliferation; and releasing matrix metalloproteinases (MMP9) and BV8 to promote angiogenesis, providing “blood supply” to tumors.31 Importantly, neutrophils also suppress immune responses by consuming arginine through arginase-1 (ARG1), helping tumors evade immune detection. CA2, a key molecule regulating the tumor microenvironment’s pH and metabolism, may influence the surrounding neutrophils’ pro-tumor phenotype (such as N2 polarization or NETs release) through local acidification (CA2 catalyzes H+ production) or metabolic reprogramming, thereby contributing to an immunosuppressive niche and ultimately leading to treatment failure. While further validation is needed, these findings based on specific cell subpopulations and spatial relationships offer deeper mechanistic insights, surpassing traditional bulk analysis or simple cell abundance comparisons.
Limitation
This is a single-center, retrospective, exploratory study. Although it included only 29 AML patients (21 with paired post-treatment samples), and the small subgroup sizes after dynamic stratification limit statistical power and increase the risk of Type I error for extreme remission rates in transition subgroups, it represents the first attempt to establish a dynamic pre- and post-treatment metabolic subtyping framework in AML. Methodologically, peak-area-based serum metabolomics provides only relative quantification without intracellular metabolite data, and the transcriptomic, single-cell, and spatial transcriptomic data were not perfectly matched with metabolomics at the individual level. Nevertheless, this multi-omics integration successfully identified metabolic subtypes significantly associated with treatment response and revealed a novel co-localization of CA2⁺cells. The spatial transcriptomics finding, although derived from a single non-CR patient and hypothesis-generating, provides the first link between a metabolic subtype and a specific cellular interaction in the bone marrow microenvironment, offering a testable hypothesis for future mechanistic studies. In summary, despite these limitations, the dynamic metabolic subtyping framework, external validation, and spatial clues established in this study provide a new metabolism-based dimension for precision therapy in AML, with clear exploratory value and clinical translational potential.
Conclusion
In conclusion, this study systematically analyzed the metabolic changes in AML patients before and after treatment, revealing metabolic feature differences between subtypes, and providing important scientific evidence for further understanding the pathogenesis of AML and developing new treatment strategies. In the future, multi-level combination therapy strategies, such as simultaneously blocking multiple metabolic pathways or combining metabolic targeting with chemotherapy, could better overcome resistance and treatment challenges. We hope these findings provide valuable reference for future research and clinical practice.
Data Sharing Statement
All data and material have been provided in the manuscript and Supplement Materials.
Ethics Approval and Consent to Participate
Ethical approval for this study was obtained from the Institutional Review Board of Fujian Medical University Union Hospital (2021KJCX033). All participants provided written informed consent. All procedures were conducted in compliance with the ethical principles of the Declaration of Helsinki.
Author Contributions
All authors contributed significantly to the work reported, including in one or more of the following areas: conception, study design, execution, data acquisition, analysis, and interpretation. All authors took part in drafting, revising, or critically reviewing the article; gave final approval of the version for publication; agreed on the target journal; and accept accountability for all aspects of the work.
Funding
This work was supported by the National Natural Science Foundation of China (82470173), the Provincial Subsidy Projects for Health (CZBZ202501), the Program for Introducing High-Level Talent Teams of Quanzhou (2025CT011), the Guiding Science and Technology Program Project in Medical and Health Care of Quanzhou (20250ZNYZ013), Joint Funds for the innovation of science and Technology, Fujian province (Grant No. 2023Y9153), Fujian Provincial Natural ScienceFoundation of China (Grant No.2024J01583), Fujian provincial health technology project (Grant No.2025GGA027), the Outstanding Young Doctorates Scientific Research Project of Fujian Medical University Union Hospital (2025XH055).
Disclosure
Dr Yan Huang reports Support for the manuscript from Application of statistical, mathematical, computational, or other formal techniques to analyse data, during the conduct of the study, outside the submitted work. The authors have no conflicts of interest to declare that are relevant to the content of this article.
References
1. Thol F, F SR, Heuser M, et al. How I treat refractory and early relapsed acute myeloid leukemia. Blood. 2015;126(3):319–20. doi:10.1182/blood-2014-10-551911
2. Stuani L, Sabatier M, E SJ. Exploiting metabolic vulnerabilities for personalized therapy in acute myeloid leukemia. BMC Biol. 2019;17(1):57. doi:10.1186/s12915-019-0670-4
3. J PC, Fan Z, S LJ, et al. The potential transcriptomic and metabolomic mechanisms of ATO and ATRA in Treatment of FLT3-ITD acute myeloid leukemia. Technol Cancer Res Treat. 2024;23:2071002328.
4. Zhao J, Wu S, Wang D, et al. Panobinostat sensitizes AraC-resistant AML cells to the combination of azacitidine and venetoclax. Biochem Pharmacol. 2024;228:116065. doi:10.1016/j.bcp.2024.116065
5. Rodriguez-Zabala M, Ramakrishnan R, Reinbach K, et al. Combined GLUT1 and OXPHOS inhibition eliminates acute myeloid leukemia cells by restraining their metabolic plasticity. Blood Adv. 2023;7(18):5382–5395. doi:10.1182/bloodadvances.2023009967
6. L CW, Y WY, Zhao A, et al. Enhanced fructose utilization mediated by SLC2A5 is a unique metabolic feature of acute myeloid leukemia with therapeutic potential. Cancer Cell. 2016;30(5):779–791. doi:10.1016/j.ccell.2016.09.006
7. Dohner H, H WA, R AF, et al. Diagnosis and management of AML in adults: 2022 recommendations from an international expert panel on behalf of the ELN. Blood. 2022;140(12):1345–1377. doi:10.1182/blood.2022016867
8. Mishra SK, Millman SE, Zhang L. Metabolism in acute myeloid leukemia: mechanistic insights and therapeutic targets. Blood. 2023;141(10):1119–1135. doi:10.1182/blood.2022018092
9. Jin H, Yang Y, Yan C, et al. The landscape of dynamic tumor immunophenotyping on neoadjuvant chemotherapy combined with trastuzumab for the treatment of HER2-positive breast cancer. Mol Cancer. 2025;24(1):287. doi:10.1186/s12943-025-02483-8
10. Cai Q, Liu W, Yan C, et al. Longitudinal serum metabolomics predicts therapeutic outcome in acute myeloid leukemia. Transl Oncol. 2025;62:102567. doi:10.1016/j.tranon.2025.102567
11. Nam M, Xia W, H MA, et al. Glucose limitation protects cancer cells from apoptosis induced by pyrimidine restriction and replication inhibition. Nat Metab. 2024;6(12):2338–2353. doi:10.1038/s42255-024-01166-w
12. C NZ, H WM, Sajjakulnukit P, et al. Uridine-derived ribose fuels glucose-restricted pancreatic cancer. Nature. 2023;618(7963):151–158. doi:10.1038/s41586-023-06073-w
13. Mills E, A OL. Succinate: a metabolic signal in inflammation. Trends Cell Biol. 2014;24(5):313–320. doi:10.1016/j.tcb.2013.11.008
14. A SM, M AS, D ME, et al. Succinate links TCA cycle dysfunction to oncogenesis by inhibiting HIF-alpha prolyl hydroxylase. Cancer Cell. 2005;7(1):77–85. doi:10.1016/j.ccr.2004.11.022
15. Infantino V, Santarsiero A, Convertini P, et al. Cancer cell metabolism in hypoxia: role of HIF-1 as key regulator and therapeutic target. Int J Mol Sci. 2021;22(11):5703. doi:10.3390/ijms22115703
16. Y WJ, W HT, T HY, et al. Cancer-derived succinate promotes macrophage polarization and cancer metastasis via succinate receptor. Mol Cell. 2020;77(2):213–227. doi:10.1016/j.molcel.2019.10.023
17. Lu S, Li J, Li Y, et al. Succinate-loaded tumor cell-derived microparticles reprogram tumor-associated macrophage metabolism. Sci Transl Med. 2025;17(793):eadr4458. doi:10.1126/scitranslmed.adr4458
18. Peng M, Huang Y, Zhang L, et al. Targeting mitochondrial oxidative phosphorylation eradicates acute myeloid leukemic stem cells. Front Oncol. 2022;12:899502.
19. Sainero-Alcolado L, Liano-Pons J, V R-PM, et al. Targeting mitochondrial metabolism for precision medicine in cancer. Cell Death Differ. 2022;29(7):1304–1317. doi:10.1038/s41418-022-01022-y
20. Wang C, Xiu Y, Zhang Y, et al. Recent advances in biotin-based therapeutic agents for cancer therapy. Nanoscale. 2025;17(4):1812–1873. doi:10.1039/D4NR03729D
21. V LM, W LJ. The warburg effect: how does it benefit cancer cells?. Trends Biochem Sci. 2016;41(3):211–218. doi:10.1016/j.tibs.2015.12.001
22. Sender R, Fuchs S, Milo R. Revised estimates for the number of human and bacteria cells in the body. PLoS Biol. 2016;14(8):e1002533. doi:10.1371/journal.pbio.1002533
23. A AA. The role of red blood cells in hemostasis. Semin Thromb Hemost. 2021;47(1):26–31. doi:10.1055/s-0040-1718889
24. M AM, Helwa R. Galectins dysregulation: a way for cancer cells to invade and pervade. Oncol Res. 2022;30(3):129–135. doi:10.32604/or.2022.026838
25. Helwa R, Heller A, Knappskog S, et al. Tumor cells interact with red blood cells via galectin-4 - a short report. Cell Oncol. 2017;40(4):401–409. doi:10.1007/s13402-017-0317-9
26. W KJ, M HA. Targeting neutrophils for cancer therapy. Nat Rev Drug Discov. 2025;24(9):666–684. doi:10.1038/s41573-025-01210-8
27. C HC, Malanchi I. Neutrophils in cancer: heterogeneous and multifaceted. Nat Rev Immunol. 2022;22(3):173–187. doi:10.1038/s41577-021-00571-6
28. Ng M, Kwok I, Tan L, et al. Deterministic reprogramming of neutrophils within tumors. Science. 2024;383(6679):eadf6493. doi:10.1126/science.adf6493
29. Liu S, Wu W, Du Y, et al. The evolution and heterogeneity of neutrophils in cancers: origins, subsets, functions, orchestrations and clinical applications. Mol Cancer. 2023;22(1):148. doi:10.1186/s12943-023-01843-6
30. Furumaya C, Martinez-Sanz P, Bouti P, et al. Plasticity in pro- and anti-tumor activity of neutrophils: shifting the balance. Front Immunol. 2020;11:2100. doi:10.3389/fimmu.2020.02100
31. Awasthi D, Sarode A. Neutrophils at the crossroads: unraveling the multifaceted role in the tumor microenvironment. Int J Mol Sci. 2024;25(5):2929. doi:10.3390/ijms25052929
 © 2026 The Author(s). This work is published and licensed by Dove Medical Press Limited. The
full terms of this license are available at https://www.dovepress.com/terms
and incorporate the Creative Commons Attribution
- Non Commercial (unported, 4.0) License.
By accessing the work you hereby accept the Terms. Non-commercial uses of the work are permitted
without any further permission from Dove Medical Press Limited, provided the work is properly
attributed. For permission for commercial use of this work, please see paragraphs 4.2 and 5 of our Terms.
© 2026 The Author(s). This work is published and licensed by Dove Medical Press Limited. The
full terms of this license are available at https://www.dovepress.com/terms
and incorporate the Creative Commons Attribution
- Non Commercial (unported, 4.0) License.
By accessing the work you hereby accept the Terms. Non-commercial uses of the work are permitted
without any further permission from Dove Medical Press Limited, provided the work is properly
attributed. For permission for commercial use of this work, please see paragraphs 4.2 and 5 of our Terms.
Recommended articles
Integrated Proteomic and Metabolomic Profiling in Acute Promyelocytic Leukemia: Current Status and Perspectives
Liu T, Qu M, Wang N, Xing X
International Journal of General Medicine 2025, 18:7823-7838
Published Date: 25 December 2025