Back to Journals » Journal of Inflammation Research » Volume 14
LncRNAs Associated with Chemoradiotherapy Response and Prognosis in Locally Advanced Rectal Cancer
Authors Zhang Y, Guan B ![]() , WU Y, Du F, Zhuang J
, WU Y, Du F, Zhuang J ![]() , Yang Y, Guan G
, Yang Y, Guan G ![]() , Liu X
, Liu X
Received 21 August 2021
Accepted for publication 5 November 2021
Published 27 November 2021 Volume 2021:14 Pages 6275—6292
DOI https://doi.org/10.2147/JIR.S334096
Checked for plagiarism Yes
Review by Single anonymous peer review
Peer reviewer comments 3
Editor who approved publication: Professor Ning Quan
Yiyi Zhang,1,* Bingjie Guan,2,* Yong WU,1,* Fan Du,3,* Jinfu Zhuang,1 Yuanfeng Yang,1 Guoxian Guan,1 Xing Liu1
1Department of Colorectal Surgery, The First Affiliated Hospital of Fujian Medical University, Fuzhou, People’s Republic of China; 2Department of Radiation Oncology, Fujian Medical University Union Hospital, Fuzhou, People’s Republic of China; 3Department of Gastroenterology, The First Affiliated Hospital of Nanchang University, Nanchang, Jiangxi, 330006, People’s Republic of China
*These authors contributed equally to this work
Correspondence: Xing Liu; Guoxian Guan
Department of Colorectal Surgery, The First Affiliated Hospital of Fujian Medical University, 20 Chazhong Road, Fuzhou City, 350001, Fujian, People’s Republic of China
Email [email protected]; [email protected]
Background: There are only limited studies on the long non-coding RNAs (lncRNAs) associated with neoadjuvant chemoradiotherapy (NCRT) response and prognosis of locally advanced rectal cancer (LARC) patients. This study identified lncRNAs associated with NCRT response and prognosis in CRC patients and explored their potential predictive mechanisms.
Methods: The study subjected the LncRNA expression profiles from our previous gene chip data to LASSO and identified a four-lncRNA signature that predicted NCRT response and prognosis. A Cox regression model was subsequently performed to identify the prognostic risk factors. The function of LINC00909, the lncRNA with the most powerful predictive ability, was finally identified in vivo and in vitro using CRC cell lines.
Results: A comparison of the relative lncRNA expression of NCRT-responsive and non-responsive patients revealed four hub lncRNAs: DBET, LINC00909, FLJ33534, and HSD52 with AUC = 0.68, 0.73, 0.73, and 0.70, respectively (all p < 0.05). COX regression analysis further demonstrated that DBET, LINC00909 and FLJ33534 were associated with the DFS in CRC patients. The expression of the four lncRNAs was also significant in LARC patients who had not undergone NCRT (all p < 0.05). A risk score model was subsequently constructed based on the results of the multivariate COX analysis and used to predict NCRT response and prognosis in the CRC and LARC patients. The expression and prognosis of DBET, LINC00909 and FLJ33534 in the CRC tissues were further validated in the R2 platform and Oncomine database. Notably, overexpression of the LINC00909 increased the cell line resistance to the 5-FU and radiotherapy in vivo and in vitro.
Conclusion: DBET, LINC00909, and FLJ33534 are potential novel biomarkers for predicting NCRT response and prognosis in CRC patients. In particular, LINC00909 is an effective oncogene in CRC that could be used as a novel therapeutic target to enhance NCRT response.
Keywords: rectal cancer, chemoradiotherapy, lncRNA, prognosis
Background
Preoperative neoadjuvant chemoradiotherapy (NCRT) and radical surgery have become the standard treatment methods for locally advanced rectal cancer (LARC).1 The benefits of this multimodality therapy include tumor downsizing and downstaging, increased radical resection rate, and reduced local recurrence.2–4 However, rectal cancer patients exhibit heterogeneous treatment responses to NCRT. Up to 45% of rectal cancer patients develop resistance to NCRT, thus becoming exposed to NCRT-related toxicities without oncological benefits.5 It is thus imperative to identify valid biomarkers associated with NCRT resistance.
Long non-coding RNAs (lncRNAs) are transcripts longer than 200 nucleotides (nt) in length, lacking protein-coding ability.6 They play crucial roles in many biological processes through transcriptional modulations, regulation of splicing, and post-transcriptional process.7–9 They are also involved in the proliferation, invasion, progression, and metastasis of various cancers, including CRC.10–13 Recently, lncRNAs have been reported as diagnostic and prognostic biomarkers for several cancers,14–19 including CRC. Several studies postulate that they also act as effective biomarkers to chemotherapy resistance in mCRC patients.20,21 Yokoyama et al22 suggest the lncRNA H19 and UAC1 were associated with the 5-FU resistance in the rectal cancer. Similarly, Li et al23 report that mRNAs and lncRNAs biomarkers can effectively predict NCRT response in LARC patients. For instance, Ferrando et al24 screened three effective lncRNAs to predict NCRT response in LARC patients. Benitez et al25 identified the Lincp21-RNA to be associated with NCRT response in LARC patients. However, there are only limited studies on lncRNAs associated with NCRT resistance. Multiple expression of lncRNAs should also be incorporated to improve the prediction accuracy of NCRT response and prognosis of LARC patients.
This study screened lncRNAs associated with NCRT response using gene expression profiles generated previously. The lncRNAs were subsequently verified using internal and external datasets containing patient tissue samples. A risk factor model based on the Cox regression analysis was built to predict disease-free survival for LARC patients. The function of the powerful lncRNA, LINC00909, was finally identified using in vivo and in vitro assays.
Materials and Methods
Data Preprocessing and Definitions
This study comprised 31 LARC patients who received preoperative NCRT and radical surgery between March and December 2016 in Fujian Medical University Union Hospital, China. The inclusion criteria, exclusion criteria, treatment protocols, and follow-up protocols were described in our previous study.26 The raw data can be obtained from the Gene Expression Omnibus (GEO) database (https://www.ncbi.nlm.nih.gov/geo/, GSE145037) and used as an internal data set for screening effective lncRNAs. Another138 CRC patients who did not undergo preoperative therapy between January and December 2017 were used to build the risk score model and validate the expression of lncRNAsin cancer and adjuvant cancer tissues, named as the risk score training dataset, and the samples were collected after surgery. In addition, 58 LARC patients who received NCRT between 2017 and 2017 were included for external validation of the predictive efficiency of NCRT, named as the external validation dataset, and the samples were collected at diagnosis by the colonoscopy. All patients provided written informed consent. The protocol was approved by committee of the Fujian Medical University Union Hospital (2013051). The study’s workflow is shown in Figure 1.
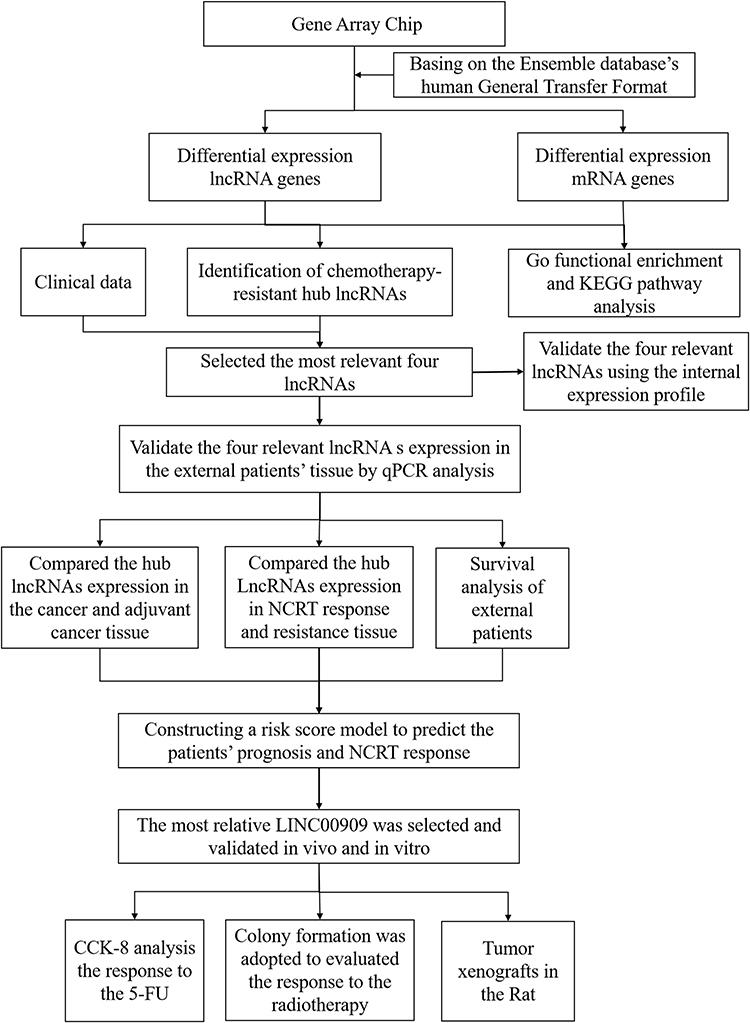 |
Figure 1 Work flow diagram of data preparation, processing, analysis, and validation in this study. |
Tumor response to NCRT was graded according to the American Joint Committee on Cancer pathological tumor regression grade (AJCC TRG);27 that is, TRG 0, no residual tumor cells; TRG 1, single cells or small groups of cells; TRG 2, residual cancer with the desmoplastic response; and TRG 3, minimal evidence of tumor response. Pathological complete response (pCR) was defined as the absence of viable tumor cells in the resected specimen, either at the primary site or in the lymph nodes. Venous blood samples were obtained within one week before NCRT.
Screening the Hub lncRNAs, Gene Ontology (GO) Enrichment, and Kyoto Encyclopedia of Genes and Genomes (KEGG) Pathway Analyses
The human annotation file was first downloaded from the Ensemble database28 to distinguish and annotate the gene functions in the microarray. The genes were then categorized into the non-coding RNAs and the protein coding RNAs. A total of 241 lncRNAs were found in the microarray. The differential expressions of the lncRNAs were screened out by P < 0.05. Finally, basing on the FDR, P value and LASSO analysis, we selected the most relevant four lncRNAs including, DBET, LINC00909, FLJ33534, and HSD52. Moreover, based on the differential expression protein-coding genes and the hypothesis that lncRNAs directly interact with mRNA and regulate the activity of mRNAs by acting as miRNA sponges, a lncRNA–miRNA–mRNA ceRNA competing endogenous RNA (ceRNA) network of the above lncRNAs was constructed. First, the differential expression lncRNAs and mRNAs were selected from the microarray. Then, the lncRNA–miRNA and miRNA–mRNA interactions were predicted. Based on the miRcode online tool (http://www.mircode.org), the MiRDB (http://www.mirdb.org/), miRTarBase (http://miRTarBase.cuhk.edu.cn/), and Targetscan (http://www.targetscan.org//), the miRNAs negatively regulated by lncRNAs and mRNAs were selected to construct the ceRNA network. The differentially expressed mRNAs (DEmRNAs) from the ceRNA network were selected for KEGG and GO analysis.
Real-Time Quantitative Polymerase Chain Reaction (RT-qPCR)
Total RNA from the patients’ tissues was isolated using the TRIzol reagent (Invitrogen) following the manufacturer’s instructions. And 1μg total RNA was used for reverse transcription reaction using M-MLV Reverse Transcriptase Product (Promega). RT-qPCR was performed using an ABI 7500 real-time PCR system (Applied Biosystems; Thermo Fisher Scientific, Inc., Foster City, CA, USA). LncRNA levels were assessed by RT-qPCR with GAPDH used as an internal control. PCR amplification was performed by denaturation at 94°C for 5 seconds, annealing and extension at 62°C for 40 seconds for 40 cycles. The relative expression level of the lncRNAs was then calculated using the ΔCt method in which. In brief, the difference value between the GAPDH Ct value and lncRNA Ct value was defined as the ΔCt value, and the A high ΔCt value was recognized as they denoted a relatively low expression of the lncRNA in each sample. All PCR amplification was performed in triplicate and repeated in three independent experiments. The RT-qPCR analysis was performed using primers in Supplementary Table 1.
Internal and External Validation for the Hub lncRNAs
We first verified the expression of the hub lncRNAs expression between the NCRT-resistant and -sensitive groups in the microarray data was first verified, followed by theirs. Then, we evaluated the hub lncRNAs expression between the cancerous tissues and adjacent non-cancerous tissues in the external data. Additionally, tThe expressions of the hub lncRNAs were analyzed in patients receiving NCRT was also analyzed to enrich the comparisons. The A receiver operating characteristic (ROC) curve was then plotted, and the area under the ROC curve (AUC) was was subsequently calculated to evaluate the predictive ability of the hub genes.
Cell Culture and Reagents
Human colorectal cancer SW620, DLD cell lines were purchased from the Shanghai Genechem Co. Ltd (China). SW620 and DLD cell lines were cultured in Roswell Park Memorial Institute (RPMI) 1640 (Invitrogen; Thermo Fisher Scientific, Inc., Carlsbad, CA, USA) supplemented with 10% fetal bovine serum (FBS; Hangzhou Sijiqing Bio-Engineering Material Ltd. Co, Hangzhou, China), 100 U/mL penicillin, and 100 mg/mL streptomycin (Invitrogen; Thermo Fisher Scientific, Inc., Carlsbad, CA, USA) at 37°C in 5% CO2 atmosphere.
Overexpression of the LINC00909 with the Lentivirus
The LINC00909 sequences were: and control (CON) were as follows, LINC00909, F: CTTTTTTGTTAGACGGATCCGAAGGACTTCCGGTGGCTTCCAAGG and; R: AAAGATATTTTATTACCGGTTTAC. Lentiviral virions were produced by co‑transfection of HEK293T cells with 5 μg pLKO.1-puro vector and 5 μg packaging and envelope vectors using Lipofectamine 2000 (Invitrogen) following the manufacturer’s protocol. The lentivirus virions were then harvested 48 h after transfection. SW620 and DLD cells were separately infected with lentivirus containing ov-LINC00909 and OV-CON for 24 h. Two days later, The virus-infected cells were then selected usingby 4 μg/mL puromycin (Sigma-Aldrich; Merck KGaA, Darmstadt, Germany) after 48 h for 48 h and subjected to required subsequent assays.
Colony Formation Assay
Colony formation assay was carried out as described previously.29 Briefly, cells were plated in 6-well plates (500 cells per plate) cultured for 14 days for 24 h before the addition of 4Gy radiotherapy cultured for 14 days, fixed with 4% paraformaldehyde for 15 min, stained with 1% crystal violet for 10 min before counting the number of colonies. The number of colonies with diameters of more than 1.5 mm was counted.
Cell Resistance to the 5-FU
Anchorage-dependent cell growth was evaluated by a CCK-8 Kit (Dojindo Laboratories, Japan) according to the manufacturer’s instructions. Cells were plated in 96-well plates at 3×10³ cells per well. When cells reached 60% confluence, the medium was removed and replaced with fresh medium containing varying concentrations of 5-FU, and then incubated for 48 h. The optical density was detected at 450 nm using a microplate reader, and the cell viability was calculated.
Tumor Xenografts in the Rat
A total of the 10 male athymic nude mice (15–20g, 6–8 weeks of age) were purchased from SHANGHAI SLAC LABORATORY ANIMAL CO. LTD (China). Care and treatment of all experimental mice were carried out in accordance with institutional guidelines (No. 2019-0023). Tumor xenografts were established by subcutaneous injection of a 100 ul cells (DLD ov-LINC00909 groups VS DLD con-LIN00909 group; SW620 ov-LINC00909 groups VS SW620 con-LIN00909 group) suspension (1×10⁷ /mL), in each foreleg of nude mice. We then measured the long diameter as the tumor size each week and performed for 4 weeks. The protocol was approved by committee of the Fujian Medical University (2019-0023).
Statistical Analysis
All statistical analyses were performed using the SPSS (version 23, SPSS Inc, Chicago, IL) and R software (version 3.4.1). The optimal cut-off values for lncRNAs expression were determined using the X-tile program (http://www.tissuearray.org/rimmlab/). The survival outcomes were assessed using the Kaplan–Meier method and the Log rank test. A Cox proportional hazards model was performed to identify risk factors for disease-free survival (DFS).30 LASSO Cox regression model was applied to determine the ideal coefficient for each prognostic feature and estimate the likelihood deviance.31–34 The corresponding risk scores for the samples from validation datasets were calculated using a risk score system. Based on cut-off values determined by ROC analysis, patients were divided into high-risk and low-risk groups. The entire patient cohort was divided into two subgroups according to patient outcomes (dead or alive). Then, ROC curves were plotted based on the risk scores and survival status. The risk score was selected as the cut-off value when the AUC reached its maximum. Kaplan-Meier and Cox regression analyses were performed to compare DFS risk between high-risk and low-risk groups. The performance of the model was evaluated by time-dependent ROC analysis. Decision curve analysis (DCA) was performed to evaluate the clinical utility of the model for disease recurrence. DCA is a method for evaluation and comparison of the predictive value between different prediction models;35,36 therefore, this method was used to evaluate the clinical utility of the model for disease recurrence. The x-axis of the DCA represents the percentage of threshold probability, and the y-axis represents the net benefit of the predictive model. The net benefit was calculated according to the following formula: Net benefit = (true positives/n) − (false positives/n) * (pt/(1 − pt)). The significance threshold was set at P < 0.05.
Results
Cluster Analysis, GO Enrichment and KEGG Analysis
The gene microarray was used to examine the gene expression profiles in the primary tumor cells revealing18419 genes, including 241 lncRNAs. A clustering trend between the two groups was obtained through supervised hierarchical cluster analysis of the lncRNA expression profile data (Figure 2A and B). Moreover, Notably, there were 16 differentially expressed lncRNAs (DElncRNAs, Supplementary Table 5) between the groups, with a higher expression in the NCRT-resistant group (P < 0.05).
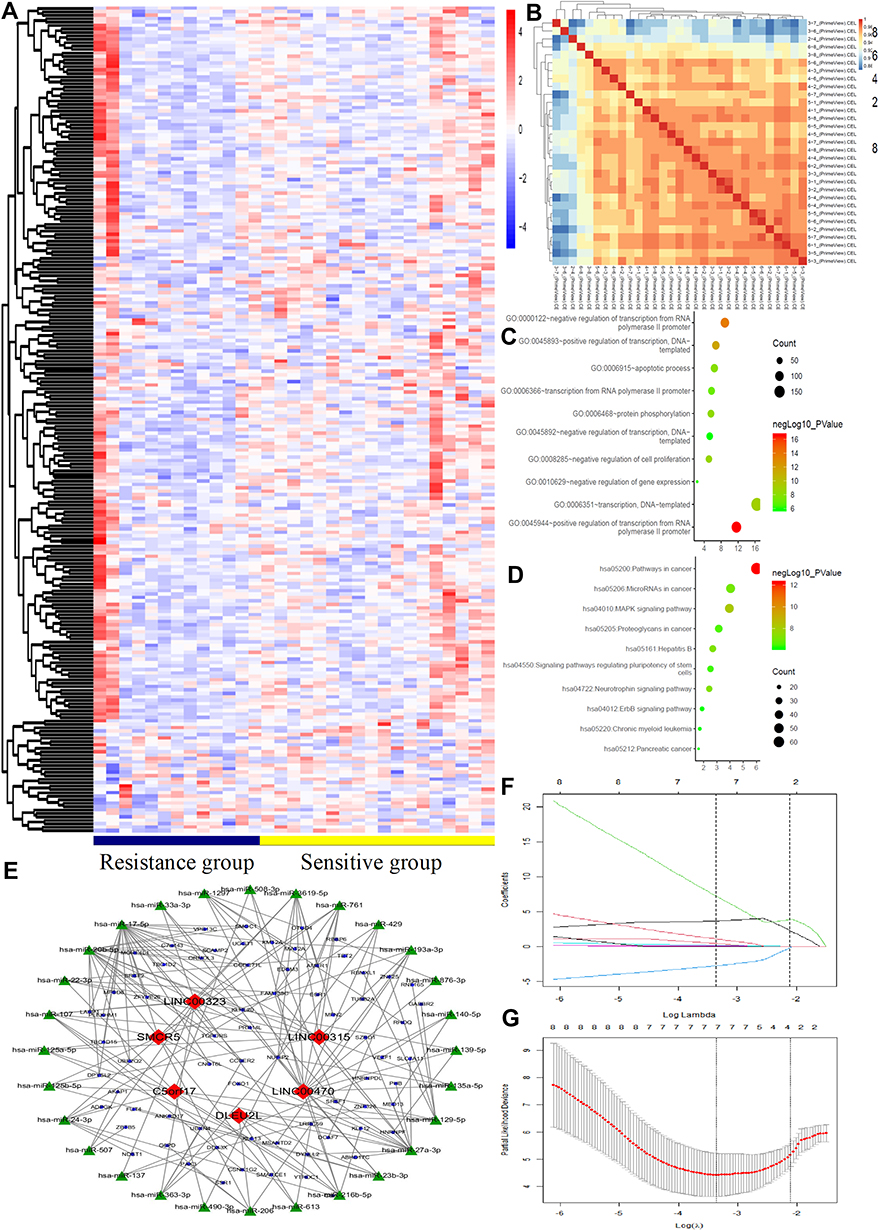 |
Figure 2 LncRNAs expression comparison between NCRT-resistant and NCRT-sensitivity groups. Gene Ontology (GO) functional and Kyoto encyclopedia of genes and genomes (KEGG) pathway analysis of the differentially expressed lncRNAs. (A) The hierarchical clustering of all targets values of differentially lncRNA expression among samples. (B) The heat map of the principal component analysis in each sample. (C) GO functional analysis in the differentially lncRNA revealed the top ten functional classifications. (D) KEGG pathway analysis in the differentially lncRNA revealed the top ten significant pathways. (E) The ceRNA network was constructed basing on the differential lncRNAs between NCRT resistance and NCRT response. (F) LASSO coefficient profiles of the 29 factors, (G) The AUC was estimated with cross-validation technique and the largest lambda value was chosen when the cross-validation error was within one standard error of the minimum. |
The top three significant GO terms of the DElncRNAs involved in NCRT response in LARC patients were related to the positive regulation of transcription from RNA polymerase II promoter, negative regulation of transcription from RNA polymerase II promoter and positive regulation of transcription, DNA-templated (Figure 2C). In the same line, KEGG pathway analysis of the DElncRNAs involved in NCRT response in LARC patients demonstrated that the top three KEGG pathways were pathways in revealed cancer, MAPK signaling, pathway, and neurotrophin signaling pathways as the top three KEGG pathways (Figure 2D). Moreover, we selected the top 6 lncRNAs to construct a ceRNA network that was subsequently constructed using the top six lncRNAs based on the differential expression of the mRNAs in the gene chip (Figure 2E). Moreover, the LASSO analysis was performed to explore the significant disease predictors for disease. The result demonstrated that the further revealed DBET, LINC00909, FLJ33534, and HSD52 were to be the significant disease factors (Figure 2F and G).
Validation of the Four lncRNAs (Significant Disease Predictors) Validation in Using Internal Data
The expression of DBET, LINC00909, FLJ33534, and HSD52 in rectal cancer tissues between NCRT-resistant and -sensitive cases in the microarray datasets was examined to validate their expression using the internal data. The four lncRNAs were significantly expressed in the NCRT-resistant tissues than in the NCRT-sensitive tissues (3.75 ± 0.27 vs.4.03 ± 0.47, P = 0.04; 1.62 ± 0.15 vs 1.83 ± 0.0.28, P = 0.01; 1.56 ± 0.20 vs 1.77 ± 0.35, P = 0.03; 1.07 ± 0.17 vs 1.29 ± 0.43, P = 0.04;, respectively, Figure 3A). ROC curves further demonstrated that LINC00909 (AUC = 0.73, P = 0.03) and FLJ33534 (AUC = 0.73, P = 0.03), could effectively differentiate NCRT-resistant from NCRT-sensitive rectal cancer cases (Figure 3B and E). DBET (AUC = 0.68, P = 0.09) and HSD52 (AUC = 0.70, P = 0.06) also displayed some level of effectiveness in NCRT response (Figure 3C and D). The top three significant GO terms of the four hub lncRNAs were related to transcriptional activator activity, RNA polymerase II transcription factor binding, basolateral plasma membrane and integral membrane component. Similarly, the top three KEGG pathways of the four hub lncRNAs were related to vasopressin-regulated water reabsorption, RAS signaling, and glioma signaling pathway (Figure 3F). Figure 3G shows the ceRNA network of the four lncRNAs constructed based on the differential expression of mRNAs in the gene chip. GSEA results further demonstrated that the four LncRNA were associated with protein export (Supplementary Figure 2).
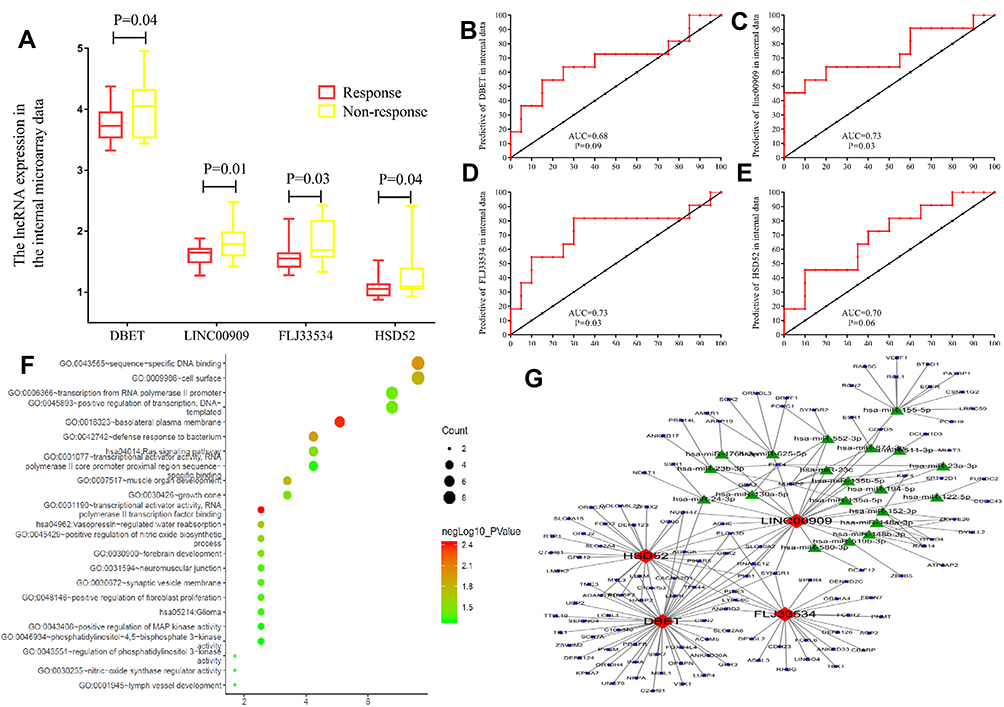 |
Figure 3 The hub lncRNAs validation and GO functional and KEGG pathway analysis in the 31 LARC patients’ gene microarray. (A) In the 31 LARC patients’ gene microarray the hub lncRNAs expression (all P<0.01). (B–E) ROC curves and AUC analysis to evaluate the predictive efficiency of the hub LncRNAs in 31 LARC patients’ gene microarray data. (F) GO functional analysis and KEGG pathway analysis (G) The network was constructed basing on the differential lncRNAs and mRNAs. |
Validation of the Hub Genes Validation in Thein Cancerous and Adjacent Non-Cancerous Tissues External without Preoperative Therapy Data
RT-qPCR analysis of the expression level of the hub genes in the cancerous and adjacent non-cancerous tissues was done to independently validate them (Figure 4A and B). The expression of DBET, LINC00909, FLJ33534, and HSD52 was higher in the cancerous tissues than in the adjacent non-cancerous tissues based on the ΔCTs value (DBET, 9.26 ± 2.59 vs 11.91 ± 2.16, P < 0.001; LINC00909, 8.83 ± 2.21 vs 10.47 ± 1.74, P < 0.001; FLJ33534, 12.36 ± 1.83 vs 13.61 ± 2.04, P < 0.001; HSD52, 12.45 ± 2.08 vs 13.05 ± 2.42, P = 0.04).
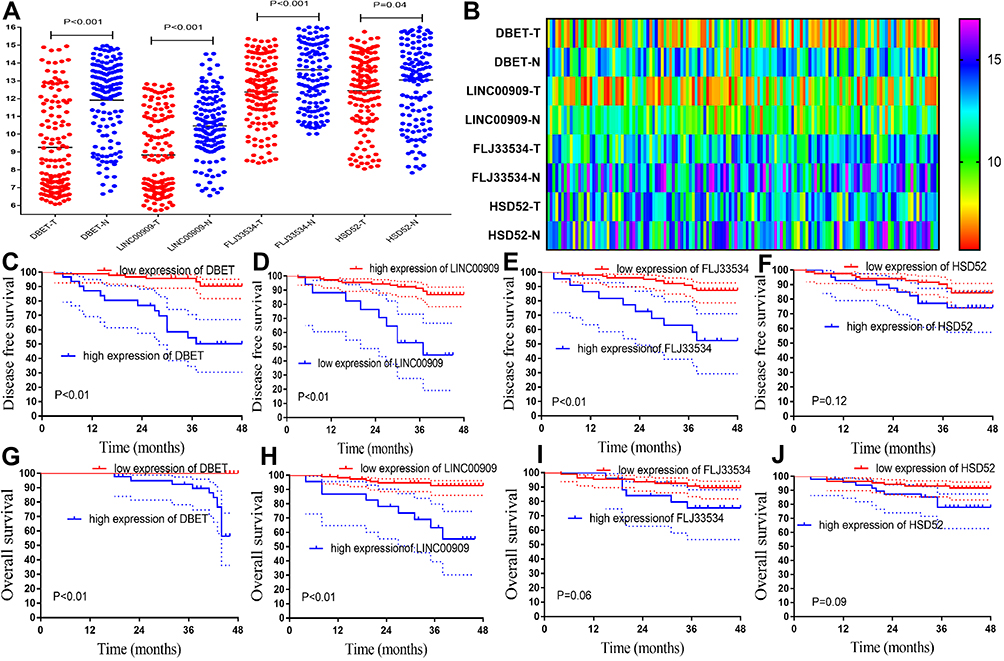 |
Figure 4 External validation of hub lncRNAs in cancer and adjuvant cancer tissue, and survival analysis. (A) The hub lncRNAs ΔCt values in the cancerous and adjacent non-cancer tissue in 138 CRC patients by qPCR (all P<0.01). (B) The heatmap of the ΔCt values. (C–F) The K-M analysis of the hub lncRNAs for the DFS in the 138 CRC patients. (G–J) The K-M analysis of the hub lncRNAs for the OS in the 138 CRC patients. |
The clinicopathological characteristics of the 138 CRC patients included in the validation set are summarized in Supplementary Table 3. The cut-off values for DBET, LINC00909, FLJ33534, and HSD52 based on the X-tile plots were 7.4, 10.6, 11.8, and 6.7, respectively (Supplementary Figure 1). The cohort was subsequently categorized into low and high subgroups in DFS based on the cut-off points. Low expression of DBET and LINC00909 were associated with a better DFS and overall survival (OS) in CRC patients (both P < 0.01, Figure 4C, D, G, and H). High expression of the FLJ33534 was associated with a worse DFS (P < 0.01, Figure 4E) and overall survival (OS) (P = 0.06, Figure 4I) in CRC patients. HSD52 had the highest expression and was associated with a worse prognosis. However, it had no significant effect on DFS (P = 0.12, Figure 4F) and overall survival (OS) (P = 0.09, Figure 4J) of the CRC patients.
Hub Genes Validation in the External LARC Patients
The expression of the hub lncRNAs was further validated in NCRT-resistant and -sensitive patients who received NCRT before surgery. Supplementary Table 4 highlights the clinicopathological characteristics of the 58 LARC patients. The expression of DBET, LINC00909, FLJ33534, and HSD52 were higher in the NCRT-resistance group than in the responsive group based on the ΔCT value (DBET, 8.96 ± 2.41 vs 0.47 ± 2.79, P = 0.07; LINC00909, 10.70 ± 1.52 vs 12.50 ± 1.51, P < 0.01; FLJ33534, 7.97 ± 2.15 vs 9.31 ± 2.34, P = 0.04; HSD52, 11.09 ± 1.91 vs 11.98 ± 1.90, P = 0.18; Figure 5A). An analysis of the predictive ability of each hub lncRNA in patients receiving NCRT before surgery. LINC00909 as the lncRNA having the biggest predictive power (AUC = 0.82, P < 0.01, Figure 5C). Figure 5B, D, and E show the predictive ability of DBET (AUC = 0.65, P = 0.07), FLJ33534 (AUC = 0.67, P = 0.04), and HSD52 (AUC = 0.66, P = 0.06). An analysis of the relationship between the four lncRNAs and prognosis in LARC patients further revealed that the high expression of DBET, LINC00909, FLJ33534, and HSD52 was associated with worse DFS (P = 0.02, P < 0.02, P = 0.02, and P = 0.06, respectively; Figure 5F–M). However, our expression had insignificant association with the OS of the patients (P = 0.77, P = 0.33, P = 0.06, and P = 0.71, respectively).
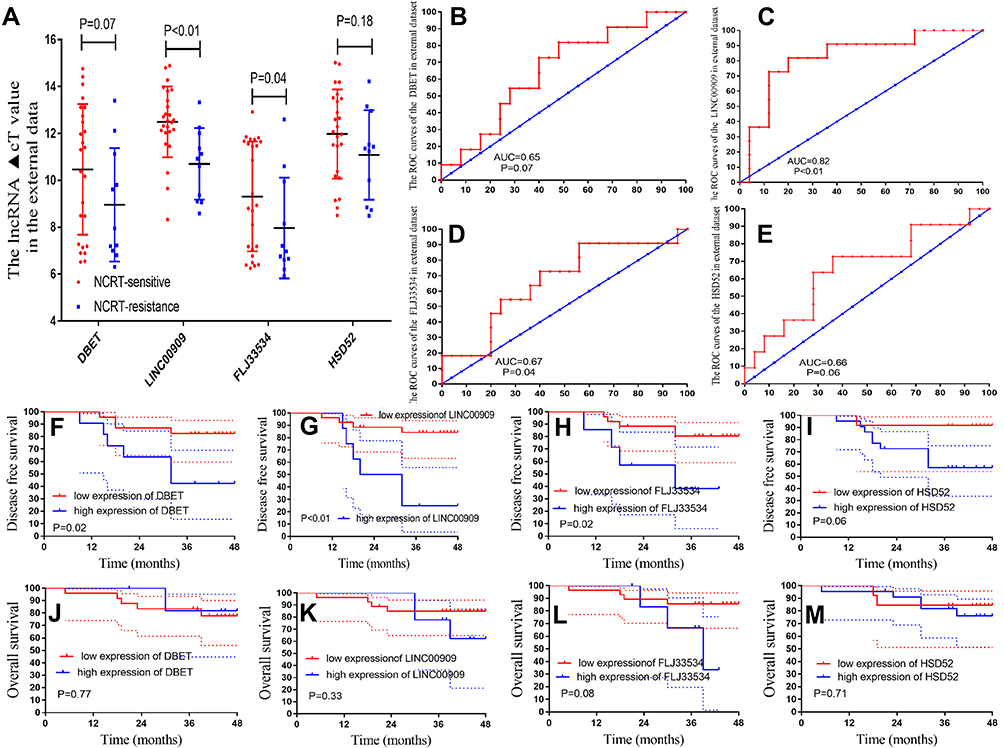 |
Figure 5 The hub lncRNAs validation in the 58 LARC patients following NCRT. (A) The hub lncRNAs expression values in the 58 LARC patients following NCRT. (B–E) ROC curves and AUC analysis to evaluate the predictive efficiency of the hub LncRNAs in the 58LARC patients following NCRT. (F–I) The K-M analysis of the hub lncRNAs for the DFS in the58LARC patients following NCRT. (J–M) The K-M analysis of the hub lncRNAs for the OS in the 58 LARC patients following NCRT. |
Construction of a Risk Factor Model and Validation
A Cox regression analysis performed to explore the prognostic impact of the hub lncRNAs on the DFS in CRC patients demonstrated that the ΔCT values DBET (HR = 0.676, 95% CI: 0.573–0.796, P < 0.001), LINC00909 (HR = 0.681, 95% CI: 0.543–0.854, P < 0.001) and FLJ33534 (HR = 0.759, 95% CI: 0.636–0.906, P = 0.002) were significantly associated with DFS in CRC patients (Supplementary Table 2). The risk score of the hub lncRNAs was calculated using the formula: risk score = (0.39) × (ΔCt value of DBET) + (0.38) × (ΔCt value of LINC00909) + (0.28) × (ΔCt value of FLJ33534), based on the COX regression analysis. The patients were subsequently divided into the high and low-risk groups using a cutoff value of 0.89 for risk scores generated from the ROC curves (Figure 6A). Notably, patients in the low-risk group had an improved DFS and OS than those in the high-risk group (both log-rank P < 0.001, Figure 6B and C). The risk score of the LARC patients also predicted their prognosis, DFS (P<0.01, Figure 6E) and OS (P=0.08, Figure 6D).
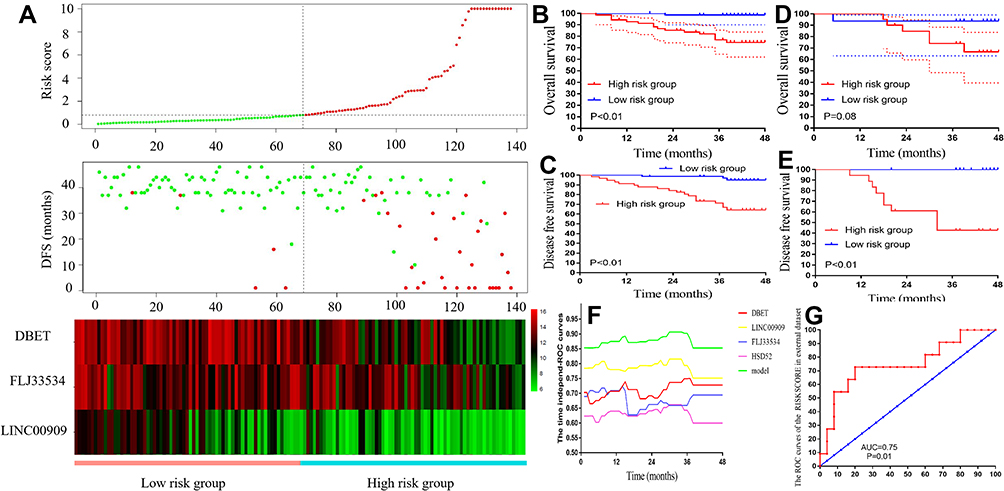 |
Figure 6 Risk factor model construction and verified in the prognosis and NCRT response. (A) The risk factor model of the hub lncRNAs in the 138 CRC patients. (Upper) LncRNA risk score distribution of 138 CRC patients. (Middle) Status of every patient in the external dataset (N=138). (Lower) Expression heatmap of the hub lncRNAs corresponding to each sample above. Red: high expression; Blue: low expression. (B) The OS analysis of the risk score in the 138 CRC patients. (C) The DFS analysis of the risk score in the 138 CRC patients. (D) The OS analysis of the risk score in the 58 LARC following NCRT patients. (E) The DFS analysis of the risk score in the 58 LARC following NCRT patients. (F) Time-dependent AUC curves of the hub lncRNAs and risk factor models for the prediction of DFS in the 138 CRC patients. (G) ROC curves and AUC analysis to evaluate the predictive efficiency of the risk score in the 58 LARC following NCRT patients. |
Time-dependent AUC curves showed that LINC00909 had the most powerful predictive ability among the hub lncRNAs (Figure 6F). The Cox model revealed that LINC00909 exhibited a stronger predictive ability to predict the DFS of CRC patients than the other hub lncRNA. ROC curve analysis further revealed that the risk score of LINC00909 had better predictive power than that of the other hub genes among the LARC patients (AUC = 0.75; P = 0.01; Figure 6G).
Association of Risk Score with Patient Characteristics Patients and Prognosis in CRC
The 138 CRC patients were equally divided into the low- (n = 68) and the high-risk score groups (n = 68). Notably, there were no significant differences in gender, age, American Society of Anaesthesiology (ASA) grade, tumor location, histopathology, tumor differentiation pathology T stage, pathology N stage, postoperative hospital stay (days), lymph nodes retrieved, metastatic lymph nodes, and tumor size between the groups (Supplementary Table 3). However, the high-risk group had a significantly higher pathology M stage (P = 0.017) and nerval invasion (P = 0.040) than the low-risk group.
COX regression analysis was subsequently performed to determine the prognostic factors in CRC patients further. Univariate analysis Cox regression analysis revealed that higher pathological M stage (HR = 13.670, P < 0.001), and a higher risk score (HR = 2.549, P < 0.001) were independently associated with the OS in CRC patients. A higher pathological M stage (HR = 4.441, P = 0.006), and higher risk score (HR = 2.110, P < 0.001) remained significantly associated with the OS of CRC patients in the multivariate COX regression analysis (Table 1).
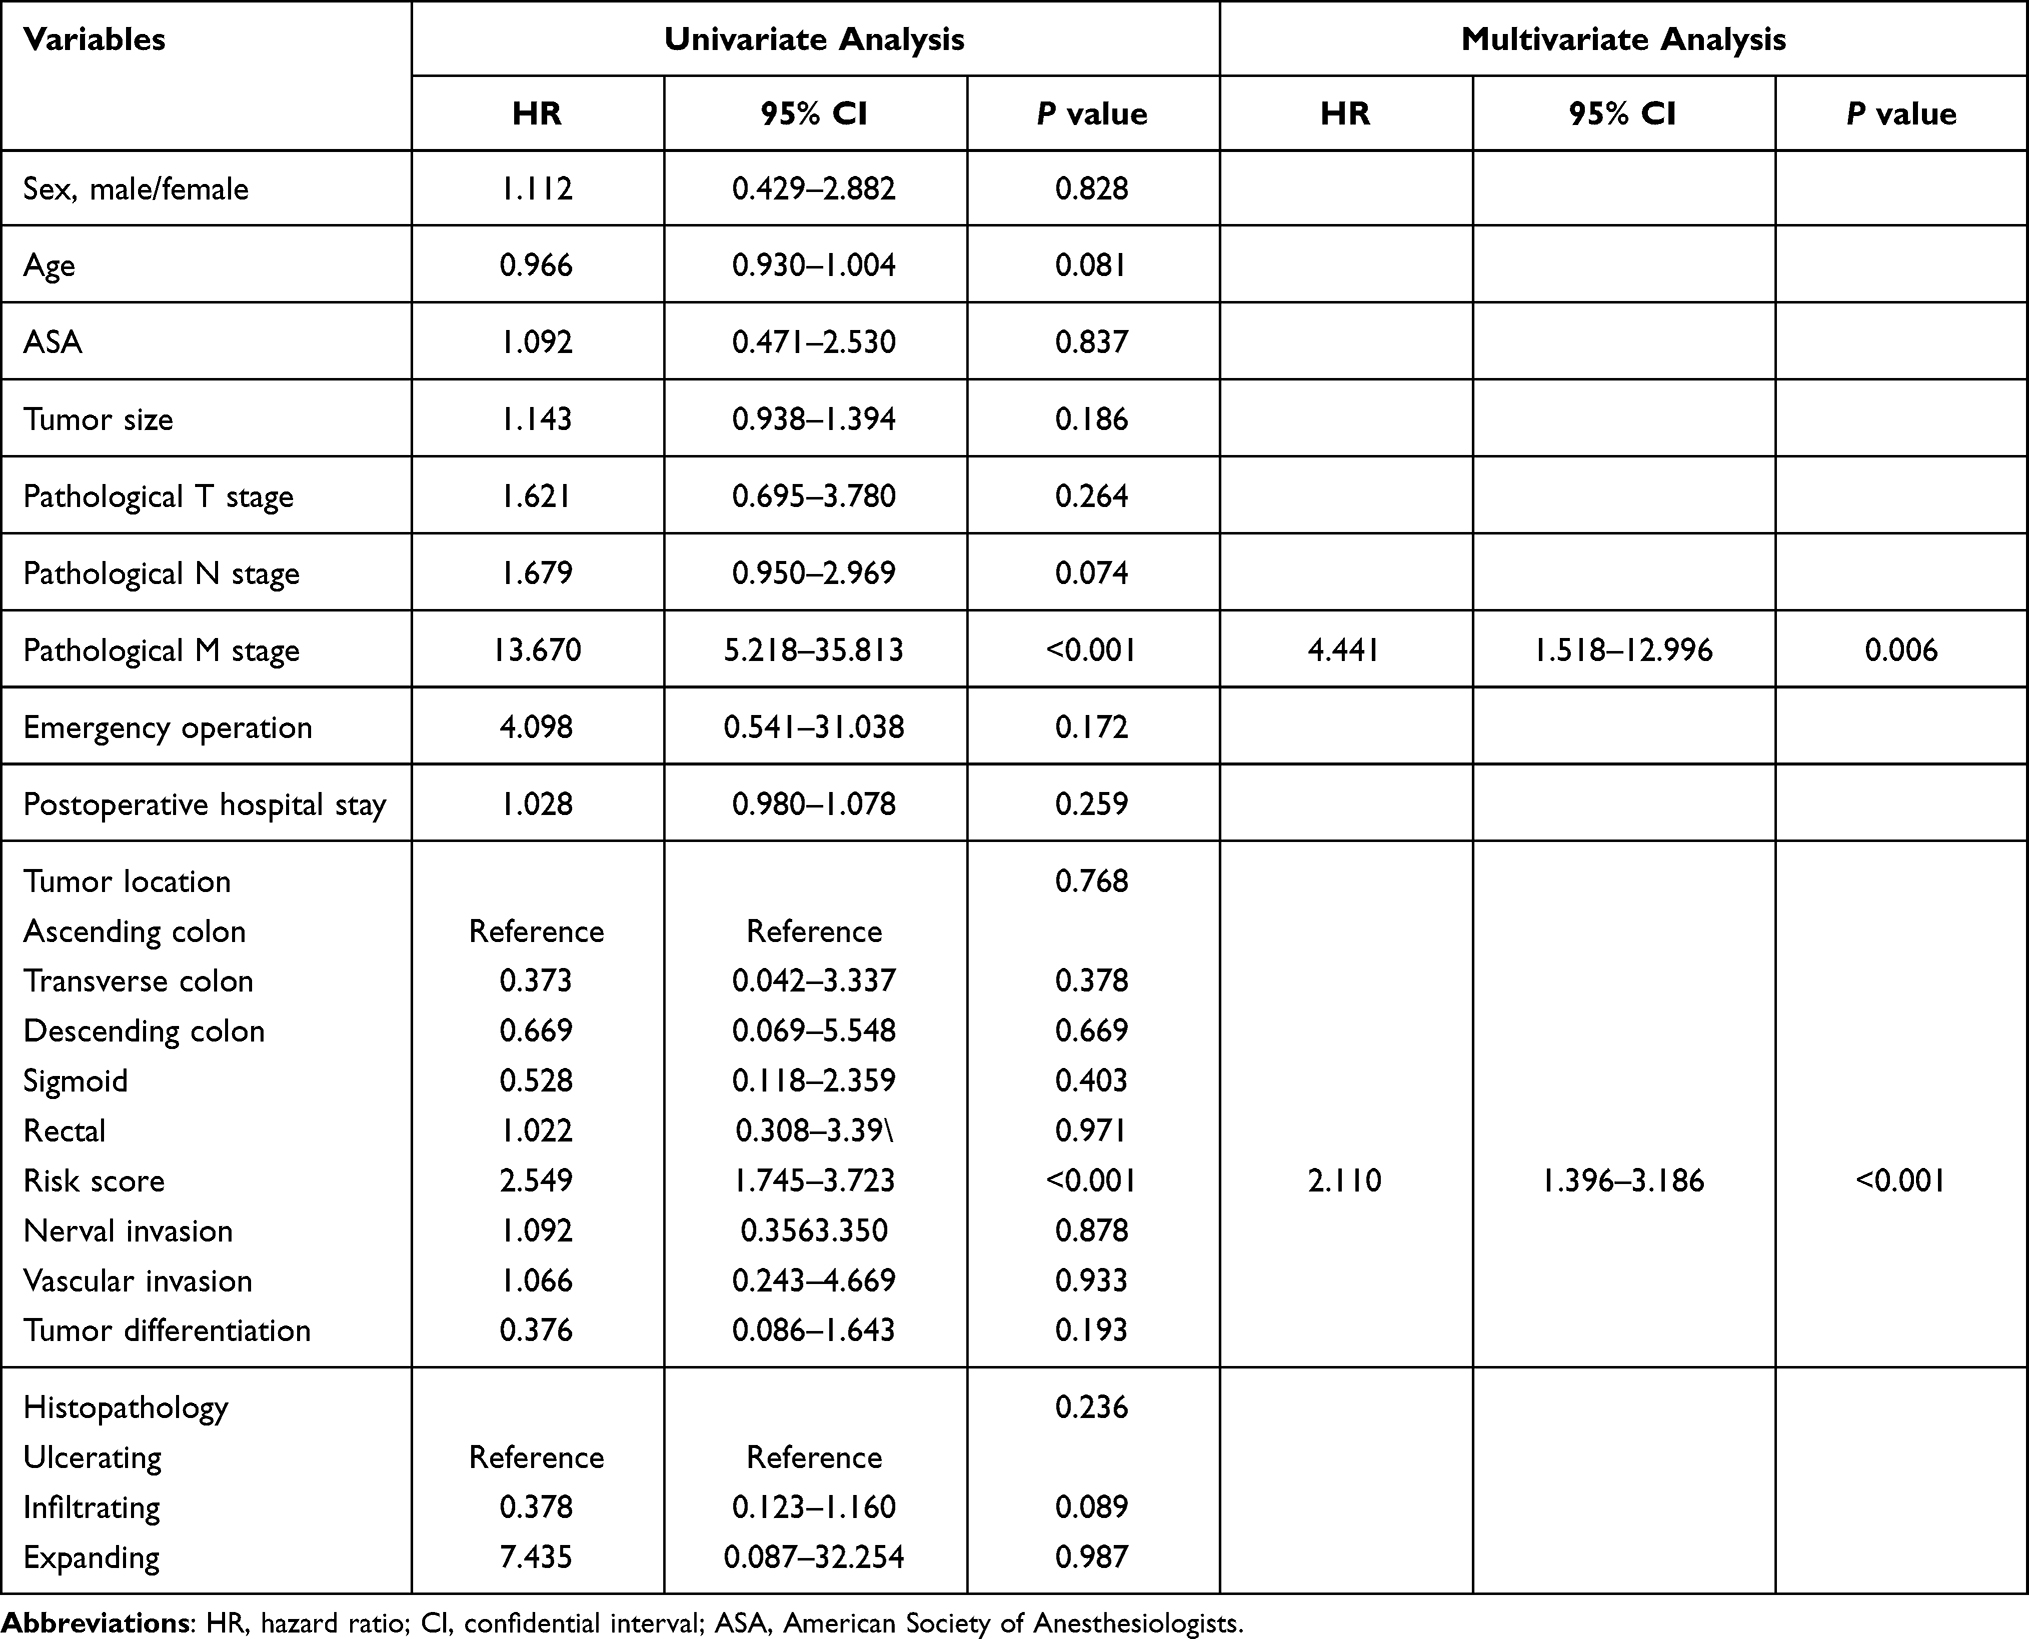 |
Table 1 Cox Regression Analysis of Predictive Factors for Overall Survival in CRC Patients (n = 138) |
COX univariate analysis further revealed that a higher pathological N stage (HR = 2.465, P < 0.001), vascular invasion (HR = 2.387, P = 0.040), a higher pathological T stage (HR = 2.348, P = 0.008), and a higher risk score (HR = 2.625, P < 0.001) were independently associated with the DFS of CRC patients. A higher risk score (HR = 1.224, P < 0.001) and higher pathological N stage (HR = 2.128, P = 0.001), remained significantly associated with increased risk of local recurrence in CRC patients in the multivariate COX regression analysis (Table 2).
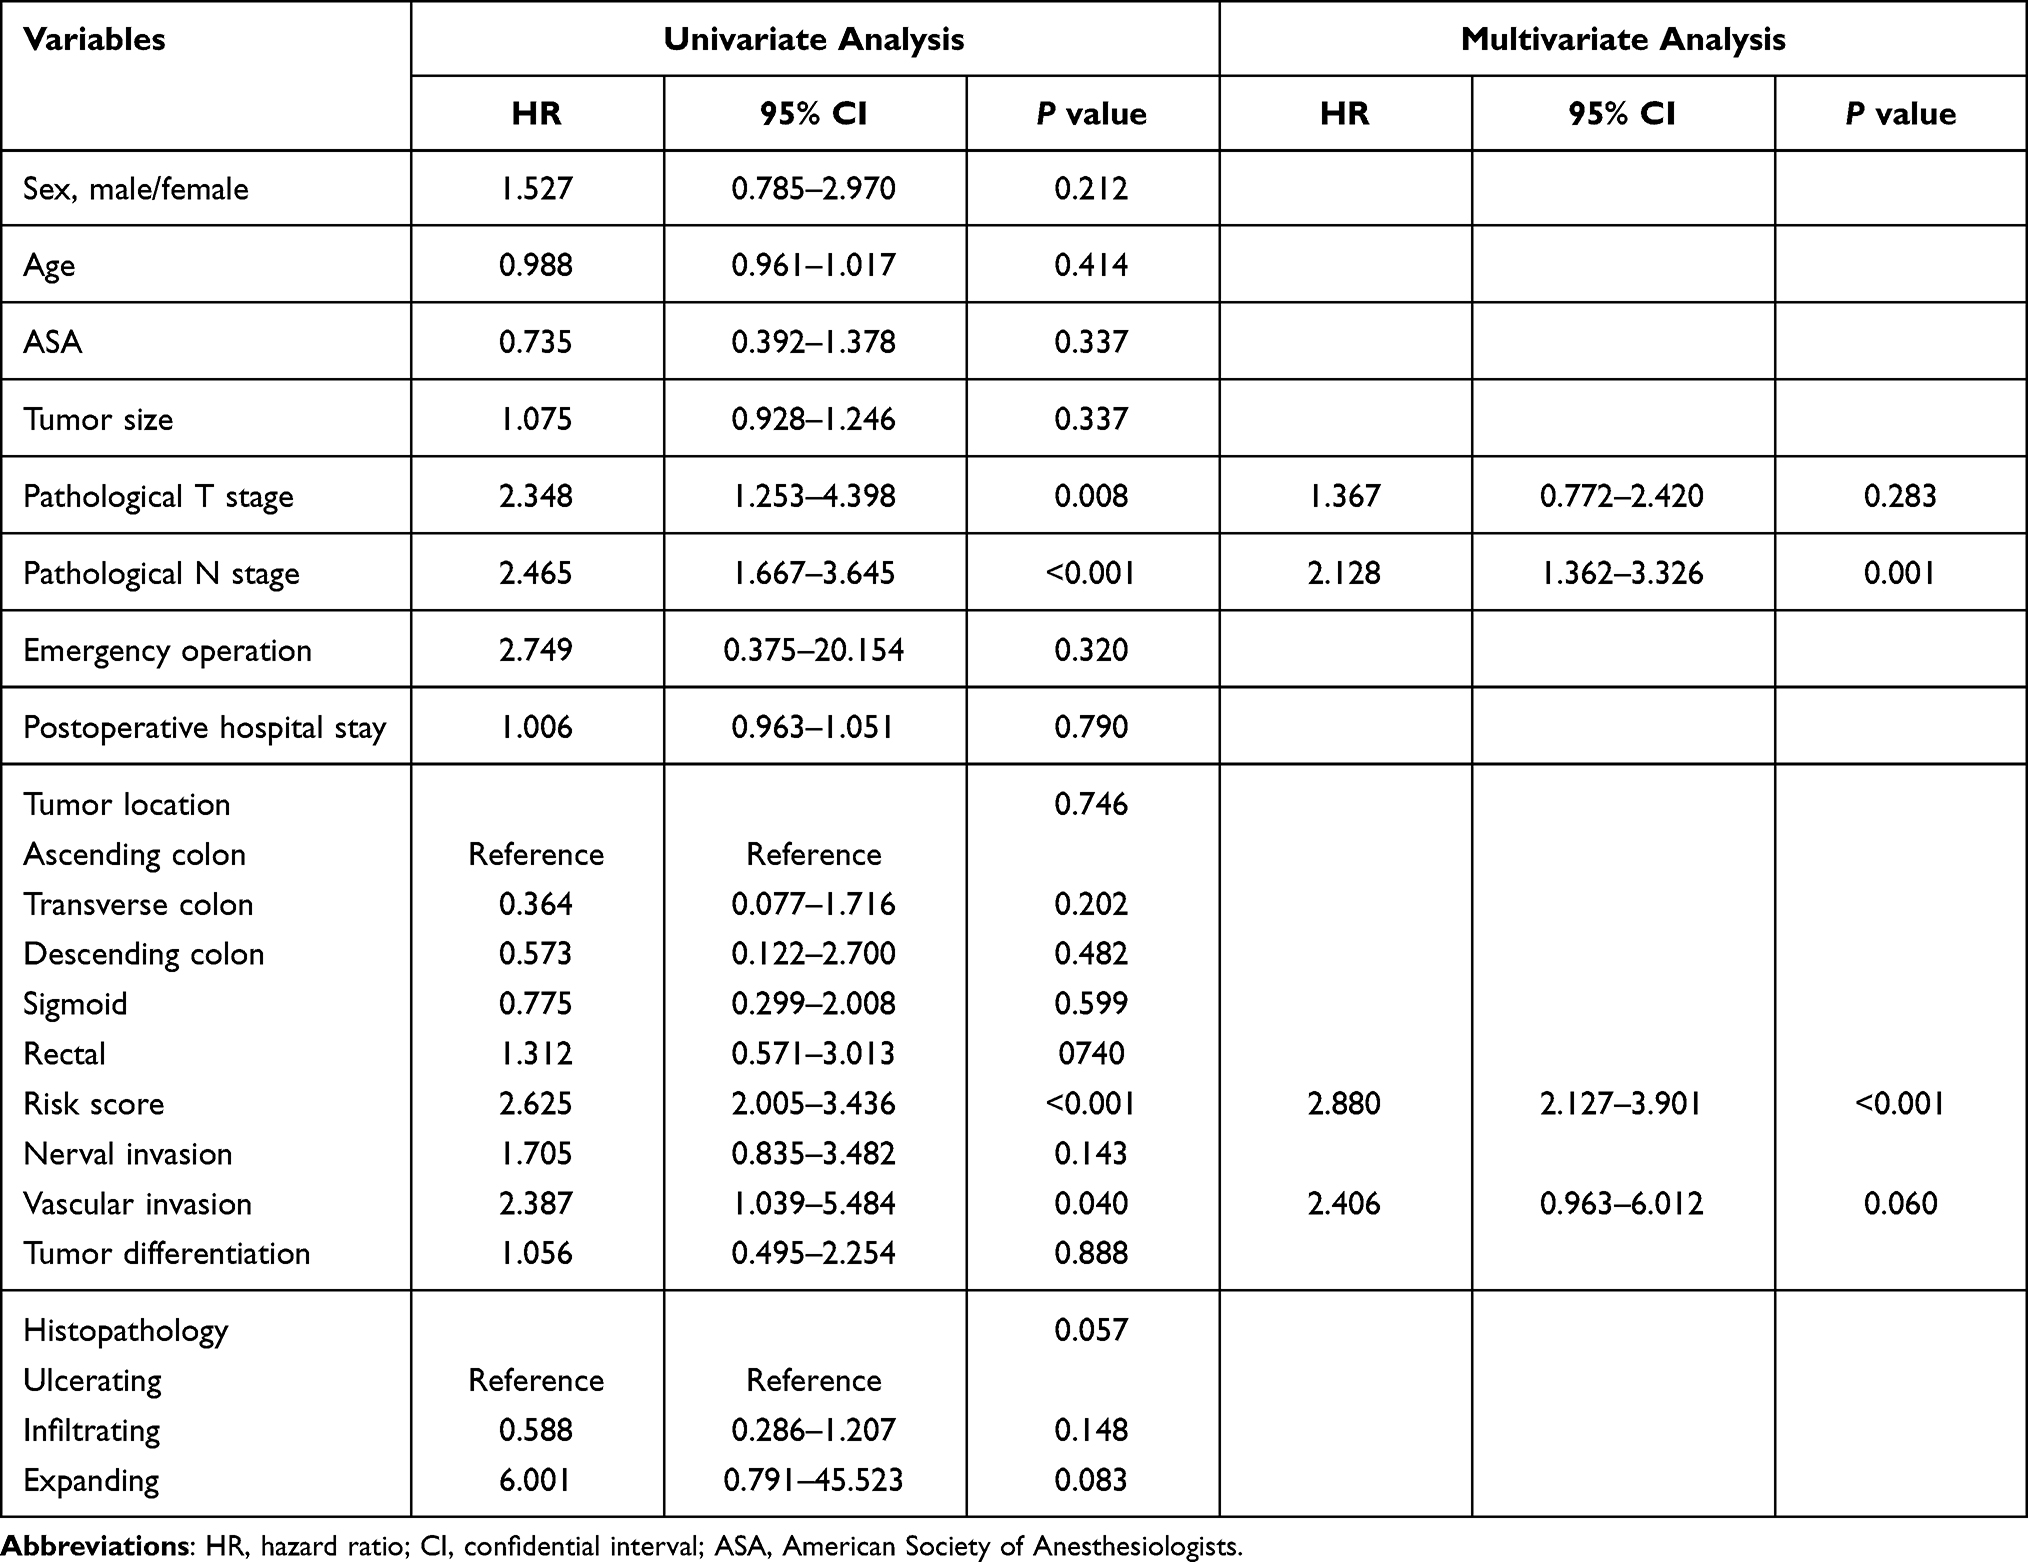 |
Table 2 Cox Regression Analysis of Predictive Factors for Disease-Free Survival in CRC Patients (n = 138) |
The Clinical Application of the Risk Score
An analysis of the association between the risk score and clinicopathological parameters revealed that the low-risk score group had a significantly better DFS and OS than the high-risk score group in the early pathological stages (stage 0-II) (P < 0.01; Figure 7A and B). Similarly, the low-risk group had a significantly better prognosis than the high-risk group in the advanced pathological stages (stage III–IV) (all P = 0.01; Figure 7C and D). DCA was used to evaluate the performance of the risk score, which provided more benefit than either lncRNAs in the disease-free scheme or the disease recurrence scheme (Figure 7E). The clinical impact curve (Figure 7F) predicted the risk stratification of 1000 patients using a resampling bootstrap method. “Number high risk” denoted the number of patients classified as positive (high risk) by the risk score, while the “number high risk with the event” was the true positive patient number based on various threshold probabilities.
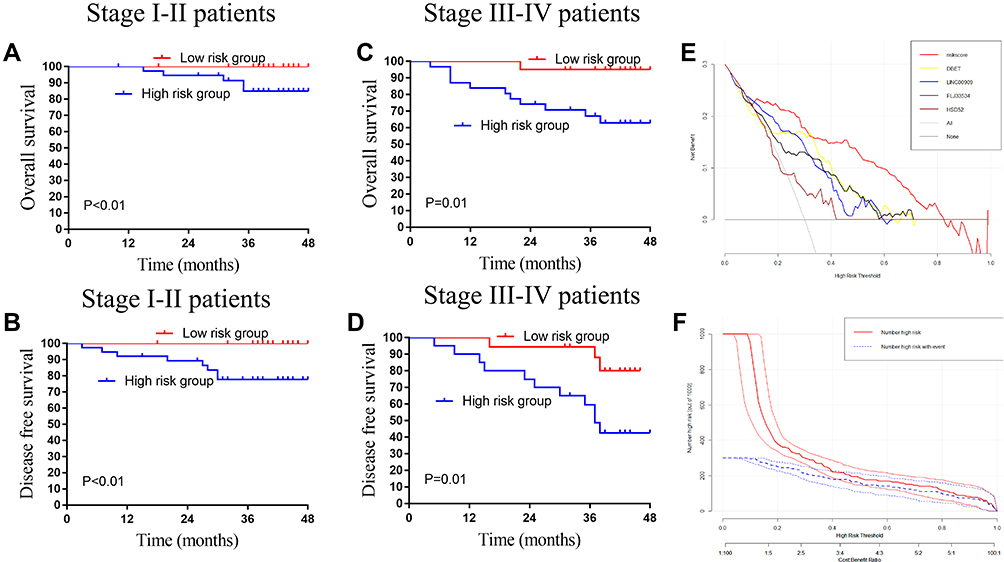 |
Figure 7 The application value of the lncRNAs in the colorectal cancer patients. (A) The OS analysis of the risk score in the pathology stage I–II CRC patients. (B) The DFS analysis of the risk score in the pathology stage I–II CRC patients. (C) The OS analysis of the risk score in the pathology stage III–IV CRC patients. (D) The DFS analysis of the risk score in the pathology stage III–IV CRC patients. (E) Decision curve analysis for disease recurrence in the 138 CRC patients. (F) Clinical impact curve for the risk score in the 138 CRC patients. Of 1000 patients, the red solid line shows the total number of patients deemed to be at high risk for each risk threshold. The blue dashed line shows how many of those would be true positives. |
The lncRNAs Validate in the R2 Platform and Oncomine Database
The expression of DBET, LINC00909, and FLJ33534 in the CRC tissues was further validated using the R2 platform and Oncomine database. High expression of DBET, LINC00909, and FLJ33534 was associated with a worse prognosis in the three independent databases in the R2 platform (Figure 8). These results were consistent with our findings. Meta-analysis in the Oncomine database further confirmed that DBET, LINC00909, and FLJ33534 were highly expressed in the CRC tissues than in the adjuvant-cancerous tissues. These findings collectively suggested that DBET, LINC00909, and FLJ33534 acted as oncogenes in CRC patients.
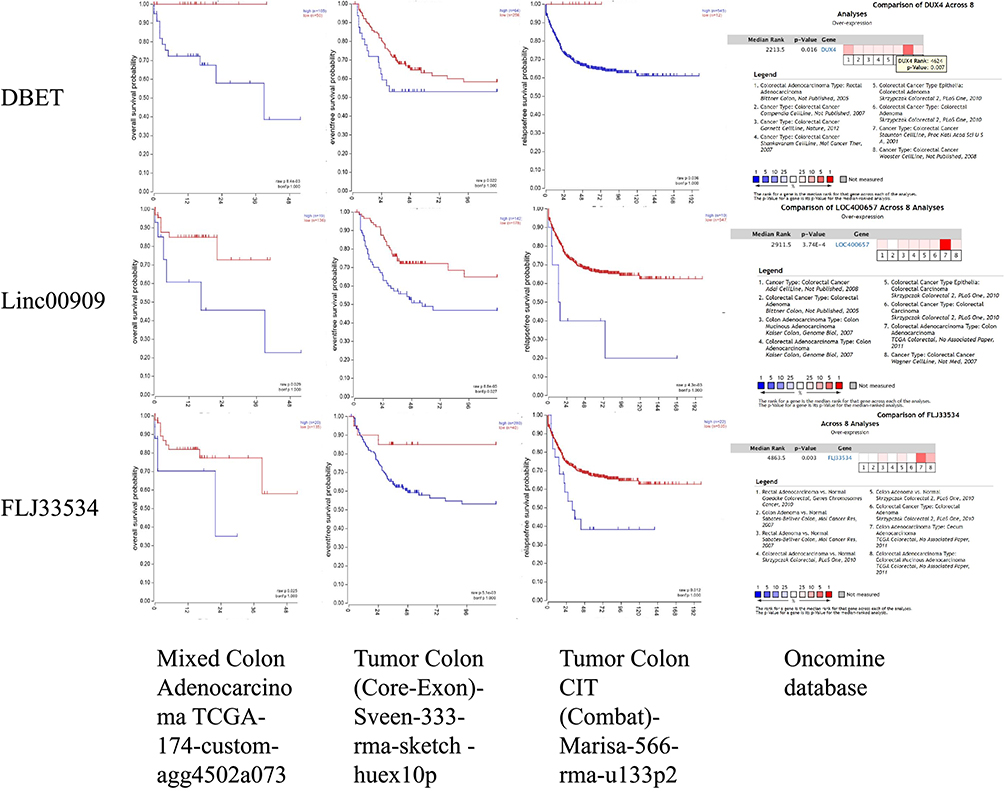 |
Figure 8 Verified the three lncRNAs in the R2 platform and Oncomine database. High expression of the DBET, LINC00909, and FLJ33534 were associated with worse prognosis in the TCGA, Sveen, and Marisa datasets in the R2 platform (all P < 0.05). Moreover, the DBET, LINC00909, and FLJ33534 were higher expression in the CRC cancer tissues compared with adjutant-cancerous tissues by eight datasets meat-analysis in Oncomine database. |
Overexpression of the LINC00909 Associated with the NCRT Resistance in vivo and in vitro
LINC00909 was found to be the most powerful lncRNA in predicting NCRT response and prognosis in CRC patients. Two LINC00909 overexpression CRC cell lines, DLD-over-LINC00909 and SW620-over-LINC00909 (all P < 0.01), were thus constructed to further identify the function of LINC00909 in the CRC cell lines (Figure 9A). Moreover, we detected the LINC00909 overexpression CRC cell lines resistant to NCRT. The IC50 of the DLD-CON group was 112.80±20.76 ug/mL to 5-FU, while that of the DLD-over group was 1104.74±50.74 ug/mL to 5-FU. In the same line, the IC50 of the SW620-CON group was 94.89±9.887 ug/mL to 5-FU, while that of the SW620-over group was 845.62±35.24 ug/mL to 5-FU (Figure 9B and C). An exploration of the 5-FU combined with radiotherapy in the DLD and SW620 cell lines revealed inhibition of 55.1±4.2% and 34.7±4.2% to 50ug/mL 5-FU combined with 4 Gy in the DLD-CON and the DLD-over groups, respectively (P = 0.02). The inhibition of the SW620-CON and SW620-over groups were 57.6±5.2% and 34.1±2.3% to 50ug/mL 5-FU combined with 4 Gy P = 0.01 (Figure 9D). An analysis of the sensitivity of the LINC00909 overexpression cell lines to 4Gy radiotherapy (Figure 9E and F) demonstrated that the colony numbers of the DLD-CON and DLD-over groups were 19.33±10.12 and 62.33±15.04, respectively (P < 0.01). Similarly, the colony numbers of the SW620-CON and SW620-over groups were 21.33±11.37 and 101.67±25.03, respectively (P < 0.01). Moreover, tumor xenografts examined in vivo in the two groups to explore the function of LINC00909 further confirmed LINC00909 to be an oncogene in CRC (all P < 0.01; Figure 9G–I).
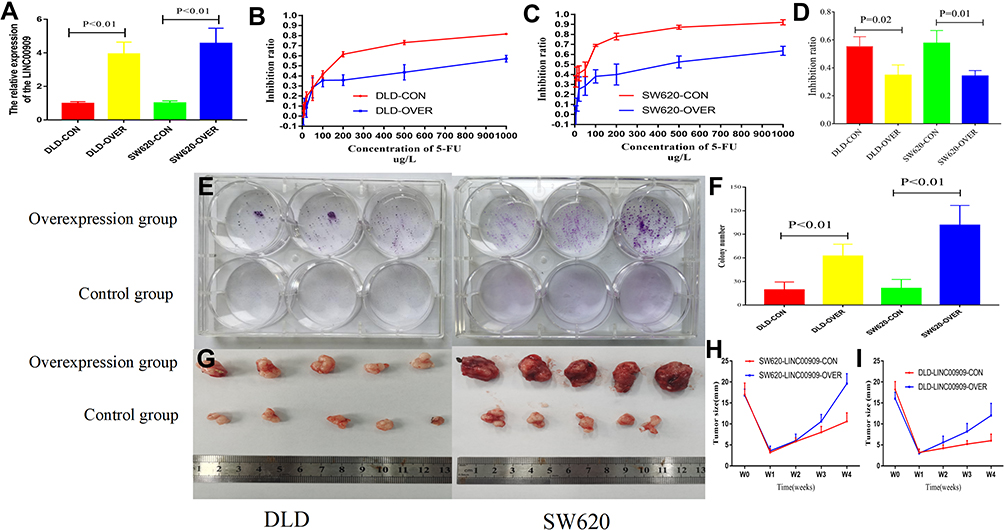 |
Figure 9 Overexpression of LINC00909 enhanced the resistance to the NCRT in vivo and in vitro. (A) LINC00909 expression was increased in overexpression group (P < 0.01). (B and C) CCK-8 assays revealed that significantly enhanced the resistance to the 5-FU in overexpression LINC00909 group compared with control group. (D) CCK-8 assays revealed that significantly enhanced the resistance to the 5-FU combined with 4Gy in overexpression LINC00909 group compared with control group. (E and F) Colony formation assays demonstrated significantly increased cell number in overexpression LINC00909 cell lines, compared to control cells. (G) Representative tumor images of control and overexpression LINC00909 in SW620 and DLD cells. (H and I) Tumor growth curves of SW620 and DLD xenografts from the overexpressed LINC00909 and control groups. |
Discussions
Among the four lncRNAs (DBET, LINC00909, FLJ33534, and HSD52) identified in this study, and DBET, LINC00909, and FLJ33534 were validated as the hub genes correlated with NCRT response and prognosis in CRC patients. A three-lncRNA-based risk model was subsequently constructed to predict NCRT and prognosis of CRC patients, followed by verifying the function of LINC00909 in CRC in vivo and in vitro experiment.
LncRNAs have been reported to act as potent biomarkers for diagnosis and prognosis in CRC patients.37–39 Li et al revealed several effective biomarkers comprising both mRNAs and lncRNAs, such as KRAS, PDPK1, PPP2R5C, PPP2R1B, and YES1could effectively predictNCRT response in the LARC.23 However, the predictive effect of lncRNAs and the use of predictive models based on lncRNAs in NCRT resistance remain unclear. In this study, we re-analyzed the LARC microarray and classified the genes based on their coding functions in the transcriptome to determine the role of lncRNAs in LARC patients receiving NCRT. The significantly effective four lncRNAs, DBET, LINC00909, FLJ33534, and HSD52, in the microarray data were then selected based on LASSO analysis to predict NCRT response and prognosis in CRC patients. Notably, DBET, LINC00909, and FLJ33534 had a good predictive power to predict NCRT response in both internal and external data sets, indicating that they were effective biomarkers in predicting NCRT response and prognosis.
These hub lncRNAs have been reported in several areas by previous studies. LINC00909 has been reported to act as an oncogenic lncRNA in glioma tumorigenesis.40 Xu et al’s study41 suggest that high expression of serum LINC00909 can be an effective diagnostic biomarker for CRC. The expression of the HSD52 gene is associated with the body mass index (BMI) in obese Korean women, including patients.42 Ahmad et al43 demonstrated that FLJ33534 has an intronic variant, rs140133294, which works in association with the BMI variance. To date, there are no studies that have investigated the biological functions of the DBET gene. Pearson analysis and a ceRNA network based on the hub lncRNAs were constructed to select the relevant mRNAs involved in NCRT response.44 The ceRNA network was constructed based on the hypothesis that lncRNAs directly interact with miRNAs thereby regulating the activity of mRNAs by acting as miRNA sponges.45 GO enrichment and KEGG pathway analyses further revealed that the hub lncRNAs were involved in the RAS signaling pathway and transcriptional activator activity, as reported in previous studies.46–48 In vivo and in vitro assays were conducted to verify if overexpression of LINC00909 could enhance NCRT resistance in CRC, and were consistent with the microarray and qPCR results.
The risk factor model has been employed for prognostication in several tumors, such as liver, lung, and colon cancers.10,49,50 However, no study has focused on NCRT response and prognosis in CRC patients. In this study, we successfully constructed a risk factor model based on a three-lncRNA signature that effectively predicted the prognosis of CRC patients. The time-dependent ROC curve further demonstrated that the model had the best AUC value than the single lncRNAs in predicting DFS in CRC patients. The relationship between the three lncRNAs and NCRT response in the CRC patients was further explored by screening 36 LARC patients who received NCRT before surgery. TheROC analysis result revealed that LINC00909, FLJ33534, and the risk factor score effectively predicted the NCRT response in LARC patients. Notably, the risk score model had better predictive power than any lncRNA in internal and external data sets. Succinctly, the risk factor model based on the four lncRNAs had a strong predictive ability in predicting the prognosis and NCRT response of CRC patients.
In clinical practice, a patient’s prognosis is usually influenced by various clinical factors. DCA is a useful tool that can assist in making vital clinical decisions. In the present study, the risk score based on the four lncRNAs better estimates the patients’ disease recurrence rate. The risk score was thus employed to analyze the prognosis of CRC patients. The pathological TNM stage is considered the most useful factor to predict the prognosis of CRC patients in many studies.51,52 The ypCR-Stage II patients are associated with a better prognosis. They are thus not recommended for postoperative chemotherapy according to the current NCCN guidelines.53 However, the recurrence rate of the early-stage patients is 83.1–88.7%,54,55 thus necessitating, screening out of these patients. In the present study, an analysis of the prognosis of the early-stage patients suggests that a higher risk score was associated with a higher risk of disease recurrence in CRC patients. The risk score model acted as an effective predictive biomarker in CRC patients and distinguished the ypCR-Stage II CRC patients who had a risk of disease recurrence.
Despite the notable findings of this study, it was limited by several factors. The small gene chip sample size was a major limitation. We included LARC patients who did not receive any treatment before biopsy from a colonoscopy, thus limiting the study’s sample size. The pathways of the hub lncRNAs were only identified using lncRNAs microarray profiling and bioinformatics methods without any validation assays to verify their correctness. Future studies should thus include larger sample sizes and conduct validation assays using in vitro and in vivo experiments to enhance their comprehensiveness.
Conclusion
In conclusion, we identified and validated the three hub lncRNAs as effective predictors for NCRT response and prognostic factor of CRC patients. A risk factor model was constructed and had a strong power to predict NCRT response and the prognosis of CRC patients. These results may help to discriminate CRC patients who are candidates for NCRT. The risk score can distinguish the ypCR-Stage II patients CRC patients who had higher disease recurrence rate and the early-stage patients with a high risk score will be considered for postoperative chemotherapy. LINC00909 was identified as associated with the NCRT response in vivo and in vitro. Nevertheless, more insightful molecular mechanisms are warranted in future studies.
Data Sharing Statement
I confirm that I have included a citation for available data in my references section and the data that support the findings of this study are available from the corresponding author (GXG) upon reasonable request.
Ethics Approval and Consent to Participate
This study was carried out in accordance with the committee of Fujian Medical University Union Hospital with written informed consent from all subjects. All subjects gave written informed consent in accordance with the Declaration of Helsinki. The protocol was approved by committee of the Fujian Medical University Union Hospital (2013051). The animal experiment was approved by committee of the Fujian Medical University (2019-0023).
Acknowledgments
The authors would like to express our sincere thanks for sharing the data from The Gene Expression Omnibus (GEO) database.
Author Contributions
All authors made a significant contribution to the present study, whether that is in the conception, study design, execution, acquisition of data, analysis and interpretation, or in all these areas; took part in drafting, revising or critically reviewing the article; gave final approval of the version to be published; have agreed on the journal to which the article has been submitted; and agree to be accountable for all aspects of the work.
Funding
This study was supported by the National Foundation of China (No. 82172800), Science Foundation of the Fujian Province, (No. 2019J0105), Special Financial Foundation of Fujian Provincial (No.2015-1297; 2020B1050), the Startup Fund for Scientific Research, Fujian Medical University (2017XQ1029, 2018QH2027), and the Professor Development Foundation of Fujian Medical University (No.JS11006). Talent programs granted from The First Affiliated Hospital of Fujian Medical University (YJRC3600).
Disclosure
The authors report no conflicts of interest in this work.
References
1. Heald RJ, Husband EM, Ryall RD. The mesorectum in rectal cancer surgery–the clue to pelvic recurrence. Br J Surg. 1982;69:613–616. doi:10.1002/bjs.1800691019
2. Sauer R, Becker H, Hohenberger W, et al. Preoperative versus postoperative chemoradiotherapy for rectal cancer. N Engl J Med. 2004;351(17):1731–1740. doi:10.1056/NEJMoa040694
3. Sauer R, Liersch T, Merkel S, et al. Preoperative versus postoperative chemoradiotherapy for locally advanced rectal cancer: results of the German CAO/ARO/AIO-94 randomized Phase III trial after a median follow-up of 11 years. J Clin Oncol. 2012;30(16):1926–1933. doi:10.1200/JCO.2011.40.1836
4. van Gijn W, Marijnen CA, Nagtegaal ID, et al. Preoperative radiotherapy combined with total mesorectal excision for resectable rectal cancer: 12-year follow-up of the multicentre, randomised controlled TME trial. Lancet Oncol. 2011;12(6):575–582. doi:10.1016/S1470-2045(11)70097-3
5. Ha YJ, Tak KH, Kim CW, et al. PSMB8 as a candidate marker of responsiveness to preoperative radiation therapy in rectal cancer patients. Int J Radiat Oncol Biol Phys. 2017;98(5):1164–1173. doi:10.1016/j.ijrobp.2017.03.023
6. Ling H, Fabbri M, Calin GA. MicroRNAs and other non-coding RNAs as targets for anticancer drug development. Nat Rev Drug Discov. 2013;12:847–865. doi:10.1038/nrd4140
7. Anderson DM, Anderson KM, Chang CL, et al. A micropeptide encoded by a putative long noncoding RNA regulates muscle performance. Cell. 2015;160:595–606. doi:10.1016/j.cell.2015.01.009
8. Fatica A, Bozzoni I. Long non-coding RNAs: new players in cell differentiation and development. Nat Rev Genet. 2014;15:7–21. doi:10.1038/nrg3606
9. Nelson BR, Makarewich CA, Anderson DM, et al. A peptide encoded by a transcript annotated as long noncoding RNA enhances SERCA activity in muscle. Science. 2016;351:271–275. doi:10.1126/science.aad4076
10. Dai W, Feng Y, Mo S, et al. Transcriptome profiling reveals an integrated mRNA-lncRNA signature with predictive value of early relapse in colon cancer. Carcinogenesis. 2018;39:1235–1244. doi:10.1093/carcin/bgy087
11. Fernández-Barrena MG, Perugorria MJ, Banales JM. Novel lncRNA T-UCR as a potential downstream driver of the Wnt/β-catenin pathway in hepatobiliary carcinogenesis. Gut. 2017;66:1177–1178. doi:10.1136/gutjnl-2016-312899
12. Li W, Zhang Z, Liu X, et al. The FOXN3-NEAT1-SIN3A repressor complex promotes progression of hormonally responsive breast cancer. J Clin Invest. 2017;127:3421–3440. doi:10.1172/JCI94233
13. Shi L, Hong X, Ba L, et al. Long non-coding RNA ZNFX1-AS1 promotes the tumor progression and metastasis of colorectal cancer by acting as a competing endogenous RNA of miR-144 to regulate EZH2 expression. Cell Death Dis. 2019;10:150. doi:10.1038/s41419-019-1332-8
14. Ali MM, Akhade VS, Kosalai ST, et al. PAN-cancer analysis of S-phase enriched lncRNAs identifies oncogenic drivers and biomarkers. Nat Commun. 2018;9:883. doi:10.1038/s41467-018-03265-1
15. Casero D, Sandoval S, Seet CS, et al. Long non-coding RNA profiling of human lymphoid progenitor cells reveals transcriptional divergence of B cell and T cell lineages. Nat Immunol. 2015;16:1282–1291. doi:10.1038/ni.3299
16. Fu X, Ravindranath L, Tran N, Petrovics G, Srivastava S. Regulation of apoptosis by a prostate-specific and prostate cancer-associated noncoding gene, PCGEM1. DNA Cell Biol. 2006;25:135–141. doi:10.1089/dna.2006.25.135
17. Jiang Z, Slater CM, Zhou Y, et al. LincIN, a novel NF90-binding long non-coding RNA, is overexpressed in advanced breast tumors and involved in metastasis. Breast Cancer Res. 2017;19:62. doi:10.1186/s13058-017-0853-2
18. Kurian L, Aguirre A, Sancho-Martinez I, et al. Identification of novel long noncoding RNAs underlying vertebrate cardiovascular development. Circulation. 2015;131:1278–1290. doi:10.1161/CIRCULATIONAHA.114.013303
19. Sánchez Y, Huarte M. Long non-coding RNAs: challenges for diagnosis and therapies. Nucleic Acid Ther. 2013;23:15–20. doi:10.1089/nat.2012.0414
20. Li P, Zhang X, Wang H, et al. MALAT1 is associated with poor response to oxaliplatin-based chemotherapy in colorectal cancer patients and promotes chemoresistance through EZH2. Mol Cancer Ther. 2017;16:739–751. doi:10.1158/1535-7163.MCT-16-0591
21. Li Z, Chen Y, Ren WU, et al. Transcriptome alterations in liver metastases of colorectal cancer after acquired resistance to cetuximab. Cancer Genomics Proteomics. 2019;16:207–219. doi:10.21873/cgp.20126
22. Yokoyama Y, Sakatani T, Wada R, et al. In vitro and in vivo studies on the association of long non‑coding RNAs H19 and urothelial cancer associated 1 with the susceptibility to 5‑fluorouracil in rectal cancer. Int J Oncol. 2019;55(6):1361–1371. doi:10.3892/ijo.2019.4895
23. Li N, Yu J, Luo A, et al. LncRNA and mRNA signatures associated with neoadjuvant chemoradiotherapy downstaging effects in rectal cancer. J Cell Biochem. 2019;120:5207–5217. doi:10.1002/jcb.27796
24. Ferrando L, Cirmena G, Garuti A, et al. Development of a long non-coding RNA signature for prediction of response to neoadjuvant chemoradiotherapy in locally advanced rectal adenocarcinoma. PLoS One. 2020;15(2):e0226595. doi:10.1371/journal.pone.0226595
25. Benitez JC, Campayo M, Díaz T, et al. Lincp21-RNA as predictive response marker for preoperative chemoradiotherapy in rectal cancer. J Pers Med. 2021;11(5). doi:10.3390/jpm11050420
26. Zhang Y, Sun Y, Xu Z, Chi P, Lu X. Is neoadjuvant chemoradiotherapy always necessary for mid/high local advanced rectal cancer: a comparative analysis after propensity score matching. Eur J Surg Oncol. 2017;43(8):1440–1446. doi:10.1016/j.ejso.2017.04.007
27. Benson AB, Venook AP, Al-Hawary MM, et al. Rectal cancer, version 2.2018, NCCN clinical practice guidelines in oncology. J Natl Compr Canc Netw. 2018;16(7):874–901. doi:10.6004/jnccn.2018.0061
28. Zerbino DR, Achuthan P, Akanni W, et al. Ensembl 2018. Nucleic Acids Res. 2018;46:D754–754D761. doi:10.1093/nar/gkx1098
29. Zhang Y, Sun L, Sun Y, et al. Overexpressed CES2 has prognostic value in CRC and knockdown CES2 reverses L-OHP-resistance in CRC cells by inhibition of the PI3K signaling pathway. Exp Cell Res. 2020;389:111856. doi:10.1016/j.yexcr.2020.111856
30. Friedman J, Hastie T, Tibshirani R. Regularization paths for generalized linear models via coordinate descent. J Stat Softw. 2010;33(1):1–22. doi:10.18637/jss.v033.i01
31. Agesen TH, Sveen A, Merok MA, et al. ColoGuideEx: a robust gene classifier specific for stage II colorectal cancer prognosis. Gut. 2012;61:1560–1567. doi:10.1136/gutjnl-2011-301179
32. Zhang JX, Song W, Chen ZH, et al. Prognostic and predictive value of a microRNA signature in stage II colon cancer: a microRNA expression analysis. Lancet Oncol. 2013;14:1295–1306. doi:10.1016/S1470-2045(13)70491-1
33. Jiang Y, Zhang Q, Hu Y, et al. ImmunoScore signature: a prognostic and predictive tool in gastric cancer. Ann Surg. 2018;267:504–513. doi:10.1097/SLA.0000000000002116
34. Sveen A, Ågesen TH, Nesbakken A, et al. ColoGuidePro: a prognostic 7-gene expression signature for stage III colorectal cancer patients. Clin Cancer Res. 2012;18:6001–6010. doi:10.1158/1078-0432.CCR-11-3302
35. Rousson V, Zumbrunn T. Decision curve analysis revisited: overall net benefit, relationships to ROC curve analysis, and application to case-control studies. BMC Med Inform Decis Mak. 2011;11:45. doi:10.1186/1472-6947-11-45
36. Vickers AJ, Elkin EB. Decision curve analysis: a novel method for evaluating prediction models. Med Decis Making. 2006;26:565–574. doi:10.1177/0272989X06295361
37. Alidoust M, Hamzehzadeh L, Rivandi M, et al. Polymorphisms in non-coding RNAs and risk of colorectal cancer: a systematic review and meta-analysis. Crit Rev Oncol Hematol. 2018;132:100–110. doi:10.1016/j.critrevonc.2018.09.003
38. Pichler M, Rodriguez-Aguayo C, Nam SY, et al. Therapeutic potential of FLANC, a novel primate-specific long non-coding RNA in colorectal cancer. Gut. 2020;69:1818–1831. doi:10.1136/gutjnl-2019-318903
39. Wei L, Wang X, Lv L, et al. The emerging role of noncoding RNAs in colorectal cancer chemoresistance. Cell Oncol (Dordr). 2019;42(6):757–768. doi:10.1007/s13402-019-00466-8
40. Liu Z, Lu C, Hu H, et al. LINC00909 promotes tumor progression in human glioma through regulation of miR-194/MUC1-C axis. Biomed Pharmacother. 2019;116:108965. doi:10.1016/j.biopha.2019.108965
41. Xu W, Zhou G, Wang H, et al. Circulating lncRNA SNHG11 as a novel biomarker for early diagnosis and prognosis of colorectal cancer. Int J Cancer. 2019. doi:10.1002/ijc.32747
42. Lee M, Kwon DY, Kim MS, Choi CR, Park MY, Kim AJ. Genome-wide association study for the interaction between BMR and BMI in obese Korean women including overweight. Nutr Res Pract. 2016;10:115–124. doi:10.4162/nrp.2016.10.1.115
43. Ahmad S, Zhao W, Renström F, et al. A novel interaction between the FLJ33534 locus and smoking in obesity: a genome-wide study of 14 131 Pakistani adults. Int J Obes (Lond). 2016;40:186–190. doi:10.1038/ijo.2015.152
44. Kopp F, Mendell JT. Functional classification and experimental dissection of long noncoding RNAs. Cell. 2018;172:393–407. doi:10.1016/j.cell.2018.01.011
45. Fan CN, Ma L, Liu N. Systematic analysis of lncRNA-miRNA-mRNA competing endogenous RNA network identifies four-lncRNA signature as a prognostic biomarker for breast cancer. J Transl Med. 2018;16:264. doi:10.1186/s12967-018-1640-2
46. Bando H, Kagawa Y, Kato T, et al. Correction: a multicentre, prospective study of plasma circulating tumour DNA test for detecting RAS mutation in patients with metastatic colorectal cancer. Br J Cancer. 2020;122:1271. doi:10.1038/s41416-020-0766-1
47. Samalin E, Mazard T, Assenat E, et al. Triplet chemotherapy plus cetuximab as first-line treatment in RAS wild-type metastatic colorectal carcinoma patients. Ann Oncol. 2019;30(Suppl 4):iv26–26iv27. doi:10.1093/annonc/mdz155.098
48. Vera R, Mata E, González E, et al. Is aflibercept an optimal treatment for wt RAS mCRC patients after progression to first line containing anti-EGFR. Int J Colorectal Dis. 2020;35:739–746. doi:10.1007/s00384-020-03509-x
49. Gu J, Zhang X, Miao R, et al. A three-long non-coding RNA-expression-based risk score system can better predict both overall and recurrence-free survival in patients with small hepatocellular carcinoma. Aging (Albany NY). 2018;10(7):1627–1639. doi:10.18632/aging.101497
50. Liao M, Liu Q, Li B, et al. A group of long noncoding RNAs identified by data mining can predict the prognosis of lung adenocarcinoma. Cancer Sci. 2018;109(12):4033–4044. doi:10.1111/cas.13822
51. Liu Q, Luo D, Cai S, Li Q, Li X. Real-world implications of nonbiological factors with staging, prognosis and clinical management in colon cancer. Cancers (Basel). 2018;10:263. doi:10.3390/cancers10080263
52. Zhou R, Zeng D, Zhang J, et al. A robust panel based on tumour microenvironment genes for prognostic prediction and tailoring therapies in stage I-III colon cancer. EBioMedicine. 2019;42:420–430. doi:10.1016/j.ebiom.2019.03.043
53. Benson AB, Venook AP, Cederquist L, et al. Colon cancer, version 1.2017, NCCN clinical practice guidelines in oncology. J Natl Compr Canc Netw. 2017;15:370–398. doi:10.6004/jnccn.2017.0036
54. Ackermann CJ, Guller U, Jochum W, Schmied BM, Warschkow R. The prognostic value of signet ring cell histology in stage I/II colon cancer-A population-based, propensity score-matched analysis. Int J Colorectal Dis. 2018;33:1183–1193. doi:10.1007/s00384-018-3096-5
55. Low YS, Blöcker C, McPherson JR, et al. A formalin-fixed paraffin-embedded (FFPE)-based prognostic signature to predict metastasis in clinically low risk stage I/II microsatellite stable colorectal cancer. Cancer Lett. 2017;403:13–20. doi:10.1016/j.canlet.2017.05.031
 © 2021 The Author(s). This work is published and licensed by Dove Medical Press Limited. The
full terms of this license are available at https://www.dovepress.com/terms
and incorporate the Creative Commons Attribution
- Non Commercial (unported, 3.0) License.
By accessing the work you hereby accept the Terms. Non-commercial uses of the work are permitted
without any further permission from Dove Medical Press Limited, provided the work is properly
attributed. For permission for commercial use of this work, please see paragraphs 4.2 and 5 of our Terms.
© 2021 The Author(s). This work is published and licensed by Dove Medical Press Limited. The
full terms of this license are available at https://www.dovepress.com/terms
and incorporate the Creative Commons Attribution
- Non Commercial (unported, 3.0) License.
By accessing the work you hereby accept the Terms. Non-commercial uses of the work are permitted
without any further permission from Dove Medical Press Limited, provided the work is properly
attributed. For permission for commercial use of this work, please see paragraphs 4.2 and 5 of our Terms.