Back to Journals » Diabetes, Metabolic Syndrome and Obesity » Volume 19
Linear Inverse Association Between Triglyceride Glucose-Body Mass Index and Osteoporosis in Patients with Type 2 Diabetes Mellitus: A Cross-Sectional Study
Authors Zhou L, Zhang F, Wang Z, Kang Z
Received 24 September 2025
Accepted for publication 23 December 2025
Published 6 January 2026 Volume 2026:19 569521
DOI https://doi.org/10.2147/DMSO.S569521
Checked for plagiarism Yes
Review by Single anonymous peer review
Peer reviewer comments 2
Editor who approved publication: Dr Rebecca Baqiyyah Conway
Lingfan Zhou,1,2 Fengjiao Zhang,2 Zhenwei Wang,3 Zhiqiang Kang2
1Department of Endocrinology, Henan Medical University Affiliated Zhengzhou Central Hospital, Zhengzhou, 450000, People’s Republic of China; 2Department of Endocrinology, Zhengzhou Central Hospital Affiliated to Zhengzhou University, Zhengzhou, 450000, People’s Republic of China; 3Department of Cardiology, The First Affiliated Hospital of Zhengzhou University, Zhengzhou, 450000, People’s Republic of China
Correspondence: Zhenwei Wang, Department of Cardiology, The First Affiliated Hospital of Zhengzhou University, Zhengzhou, 450000, People’s Republic of China, Email [email protected] Zhiqiang Kang, Department of Endocrinology, Affiliated Central Hospital of Zhengzhou University, Zhengzhou, 450000, People’s Republic of China, Email [email protected]
Aim: This study was to evaluate the association between triglyceride glucose-body mass index (TyG-BMI) and osteoporosis in patients with type 2 diabetes mellitus (T2DM).
Methods: In this cross-sectional study, 892 patients with T2DM hospitalized at Zhengrzhou Central Hospital between April 2024 and March 2025 were included. Participants were grouped into TyG-BMI tertiles (T1 ≤ 209.31, T2 209.31– 243.39, T3 > 243.39). Logistic regression analysis, subgroup and sensitivity analyses, receiver operating characteristic (ROC) curve analysis, and restricted cubic spline (RCS) modeling were performed to evaluate the relationship between TyG-BMI and osteoporosis.
Results: After adjusting for potential confounders, each one-unit increase in TyG-BMI was associated with a 1.5% lower odds of osteoporosis (OR = 0.985, 95% CI: 0.978– 0.992). Compared with T1, the odds of osteoporosis were significantly reduced in T2 and T3 (T2: OR = 0.565, 95% CI: 0.352– 0.908; T3: OR = 0.322, 95% CI: 0.167– 0.620). Subgroup analyses confirmed that the inverse association remained stable across most demographic and clinical strata. Sensitivity analyses further supported this trend: participants in the highest TyG-BMI quartile had a 74.8% lower risk of osteoporosis compared with those in the lowest quartile. Individuals with TyG-BMI above the median also showed a markedly reduced osteoporosis risk. ROC analysis showed TyG-BMI had a higher predictive value (AUC = 0.657) for osteoporosis than TyG index (AUC = 0.554) or BMI (AUC = 0.647) alone. RCS analysis indicated a significant linear negative relationship without evidence of nonlinearity (P for nonlinearity = 0.720).
Conclusion: Higher TyG-BMI levels are inversely associated with the risk of osteoporosis in patients with T2DM.
Keywords: insulin resistance, triglyceride-glucose index, triglyceride glucose-body mass index, osteoporosis, type 2 diabetes mellitus
Introduction
Osteoporosis is a global public health issue and a systemic skeletal disorder characterized by low bone mass and deterioration of bone microarchitecture, leading to increased fragility and susceptibility to fractures.1 It is defined as a bone mineral density (BMD) of the femoral neck, measured by dual-energy X-ray absorptiometry (DXA), that is at least 2.5 standard deviations (SD) below the mean for healthy young women (T-score ≤ –2.5 SD).2 As the population ages, the socioeconomic and medical burden of osteoporosis is expected to rise, particularly in cases of postmenopausal osteoporosis.3 Although postmenopausal osteoporosis is the most common type, secondary osteoporosis—caused by underlying diseases or medications—also deserves attention, particularly in patients with chronic conditions such as diabetes, where its prevalence is increasingly recognized.3
Diabetes mellitus has increased markedly in recent years, becoming a major chronic disease that threatens human health. Diabetic osteopathy is a secondary form of osteoporosis that heightens the risk of persistent bone pain and motor dysfunction, and patients with diabetic osteoporosis have a higher likelihood of fractures and disability compared with those with primary osteoporosis.4 However, the association between type 2 diabetes mellitus (T2DM) and osteoporosis remains controversial, possibly due to variations in pathogenesis, clinical stage, and environmental factors. Although the precise pathogenesis has not been fully elucidated, decreased insulin secretion, insulin resistance (IR), hyperglycemia, altered adipocytokine profiles, and other diabetic complications are recognized as important contributors to bone metabolism changes in diabetes.5
The prevalence of osteoporosis among patients with T2DM has risen significantly in recent years. A retrospective cohort study reported that more than 35% of patients with T2DM experienced bone loss, and approximately 20% met the diagnostic criteria for osteoporosis.6 Furthermore, secondary osteoporosis caused by diabetes is often characterized by varying degrees of bone mass reduction, low BMD, microstructural degradation, and increased bone fragility. Diabetes may also increase fracture risk and impair fracture healing.7 Therefore, timely identification and management of modifiable risk factors for osteoporosis in patients with T2DM are of great clinical importance to reduce its high prevalence, prevent excessive fracture risk, and improve prognosis.
Existing evidence indicates that IR plays an important clinical role in the development of osteoporosis, and an increasing number of studies have demonstrated a significant negative correlation between IR and BMD.8–10 For example, Shin et al assessed IR using the homeostatic model assessment (HOMA-IR) and found that both HOMA-IR and fasting plasma insulin levels were inversely associated with bone mass.9 Similarly, Ahn et al measured femoral neck width and axial length using hip DXA and calculated composite strength indices by combining BMD, body weight, and height. Their findings showed that HOMA-IR was negatively correlated with the compression strength index (CSI), bending strength index (BSI), and impact strength index (ISI).10 In another study, Shah et al reported that patients with type 1 diabetes mellitus (T1DM) had significantly lower trabecular bone scores (TBS), and that TBS was negatively associated with several components of metabolic syndrome, including IR.11 In contrast, Wang et al evaluated 234 patients with T2DM using a C-peptide–based modified HOMA-IR and measured lumbar BMD via DXA, and their results revealed a nonlinear positive association between IR and osteoporosis risk in female patients.12
The triglyceride–glucose index (TyG index), a surrogate marker of IR, has been widely used in metabolic research because it is derived from routine clinical tests, is highly reproducible, and easy to calculate.13 For instance, Zhan et al found that the TyG index was an independent predictor of osteoporosis in patients with T2DM.14 Pan et al also reported in a study of 220 postmenopausal women with T2DM and osteoporosis that the TyG index was positively associated with fragility fracture risk, with the high TyG group having a 1.293-fold higher risk compared with the low TyG group.15 Moreover, a systematic review by Yousefiasl et al demonstrated a significant association between the TyG index and fracture risk, suggesting that it may serve as a surrogate marker for osteoporosis not only in the elderly but also in the general population.16
Although the TyG index reflects IR, it does not account for body fatness, which is an important determinant of bone metabolism. TyG-BMI combines the TyG index with BMI, allowing it to simultaneously capture glucose–lipid metabolic dysregulation and adiposity-related metabolic stress, thereby providing a more comprehensive reflection of the body’s metabolic burden. In addition, excessive adiposity can lead to chronic inflammation, increased bone marrow adiposity, and oxidative stress, all of which may influence bone remodeling. Higher TyG-BMI levels may also be associated with suppressed osteoblast differentiation, enhanced osteoclast activity, and abnormal secretion of adipokines, thereby altering bone turnover. Moreover, TyG-BMI may reflect impairments in osteoblast insulin signaling caused by IR, resulting in reduced bone formation and increased bone resorption. These potential biological pathways offer a plausible mechanistic basis for the involvement of TyG-BMI in bone metabolism. Compared with the TyG index alone, TyG-BMI may better represent metabolic factors closely related to bone health. Therefore, based on this research background, the present study aims to evaluate the association between TyG-BMI and osteoporosis in patients with T2DM, thereby addressing this gap and providing theoretical evidence for risk monitoring and prognosis assessment of osteoporosis in T2DM.
Methods
Study Population
In this single-center, cross-sectional study, 892 patients with T2DM were enrolled at Zhengzhou Central Hospital between April 2024 and March 2025. The inclusion criteria were: (1) age ≥ 18 years; (2) a confirmed diagnosis of T2DM according to the American Diabetes Association (ADA) criteria;17 and (3) complete information regarding the diagnosis of osteoporosis. The exclusion criteria were: (1) severe hepatic failure (alanine aminotransferase or aspartate aminotransferase > 5× the upper limit of normal) or renal failure (clinically confirmed uremia); (2) severe hematological disorders (including clinically diagnosed leukemia or lymphoma); (3) severe immune system diseases; (4) malignant tumors; (5) missing data on fasting triglycerides (TG), fasting blood glucose (FBG), or BMI; and (6) a history of fractures. After applying these criteria, 892 patients were included in the final analysis. Since this study adopted a retrospective cross-sectional design, the sample size was determined by the total number of eligible patients hospitalized during the study period. Therefore, no a priori sample size or statistical power calculation was performed. Including all consecutive eligible cases helped maximize representativeness and minimize selection bias. The study complied with the principles of the Declaration of Helsinki and was reviewed and approved by the Ethics Committee of Zhengzhou Central Hospital (ZXYY2024145). As this was a cross-sectional study and all data were anonymized, the requirement for informed consent was waived by the ethics committee.
Definition and Grouping of TyG-BMI
The TyG-BMI was calculated as the product of the TyG index and BMI, where the TyG index was defined as Ln [fasting TG (mg/dL) × FBG (mg/dL) / 2].18 Participants were categorized into three groups according to TyG-BMI tertiles: T1 (≤ 209.31, n = 297), T2 (209.31–243.39, n = 298), and T3 (> 243.39, n = 297); into four groups according to TyG-BMI quartiles: Q1 (≤ 199.97, n = 223), Q2 (199.97–224.66, n = 223), Q3 (224.66–255.87, n = 223), and Q4 (> 255.87, n = 223); and into two groups based on the median TyG-BMI value: the low TyG-BMI group (≤ 224.66, n = 446) and the high TyG-BMI group (> 224.66, n = 446).
Detection and Evaluation of Osteoporosis
In this study, the diagnosis of osteoporosis was based on T-scores obtained from DXA examinations during hospitalization or documented in the patients’ medical history. The T-score reflects the number of SD by which a patient’s bone density differs from that of a healthy young adult reference population. A T-score within ±1 SD is considered normal, a T-score between –1.0 and –2.5 SD is classified as osteopenia, and a T-score ≤ –2.5 SD is defined as osteoporosis.19 Based on these diagnostic thresholds, participants were categorized into two groups: those without osteoporosis (n = 772) and those with osteoporosis (n = 120).
Collection and Definition of Covariates
Demographic data were collected, including age, sex, duration of diabetes, smoking history, and alcohol consumption. Smoking was defined as any previous regular smoking, regardless of current abstinence, and alcohol consumption was defined as any prior regular intake of alcoholic beverages, irrespective of current abstinence. Comorbidity data included hypertension, hyperlipidemia, hyperuricemia, hyperhomocysteinemia, chronic kidney disease (CKD), as well as the use of antihypertensive and lipid-lowering medications. Hypertension was defined as a prior clinical diagnosis of hypertension, systolic blood pressure (SBP) ≥ 140 mmHg or DBP ≥ 90 mmHg during hospitalization, or current use of antihypertensive drugs.20 T2DM was defined according to the ADA criteria as glycosylated hemoglobin (HbA1c) ≥ 6.5%, FBG ≥ 126 mg/dL (7.0 mmol/L) after at least 8 hours of fasting, or a 2-hour plasma glucose level ≥ 200 mg/dL (11.1 mmol/L) during an oral glucose tolerance test.17 Hyperlipidemia was defined as TG ≥ 2.3 mmol/L, total cholesterol (TC) ≥ 6.2 mmol/L, or low-density lipoprotein cholesterol (LDL-C) ≥ 4.1 mmol/L.21 Hyperuricemia was defined as serum uric acid > 420 μmol/L in men or > 360 μmol/L in women.22 Hyperhomocysteinemia was defined as a plasma homocysteine concentration >10 μmol/L.23 CKD was defined as structural or functional renal impairment lasting > 3 months, with evidence of kidney damage or an estimated glomerular filtration rate (eGFR) < 60 mL/min/1.73 m2 persisting for > 3 months;24 the eGFR was calculated using the Modification of Diet in Renal Disease (MDRD) equation adapted for the Chinese population.25
Anthropometric data included height, weight, SBP, DBP, and BMI, which was calculated as weight (kg) / height2 (m2). Laboratory indicators included white blood cell count (WBC), platelet count, C-reactive protein (CRP), creatinine, uric acid, albumin, TC, TG, HDL-C, LDL-C, serum sodium, potassium, calcium, and phosphorus, as well as HbA1c, fibrinogen, D-dimer, homocysteine (measured using an enzymatic cycling assay), and 25-hydroxyvitamin D3 (measured by chemiluminescent immunoassay). All blood markers were measured in the hospital’s central laboratory using standard assays performed on venous blood samples drawn from the antecubital vein after patients had fasted for at least 8 hours.
Statistical Methods
All continuous variables were tested for normality using the Shapiro–Wilk normality test before analysis. Variables conforming to a normal distribution were expressed as mean ± standard deviation (SD), and differences among the three groups were assessed using one-way analysis of variance (ANOVA). Continuous variables that did not meet the assumptions of normality were expressed as median (interquartile range), and differences across groups were evaluated with the Kruskal–Wallis test. Categorical variables were presented as frequencies (percentages), and group differences were examined using the chi-square test.
Univariate logistic regression was first conducted to identify factors significantly associated with osteoporosis. Variables with P < 0.05 were subsequently included in three multivariable logistic regression models to further assess the relationship between TyG-BMI and osteoporosis. Model 1 was adjusted for age and sex only. Model 2 was adjusted for age, sex, smoking status, lipid-lowering medications, and duration of diabetes. Model 3 was further adjusted for age, sex, smoking status, lipid-lowering medications, diabetes duration, TG, HDL-C, uric acid, albumin, eGFR, and 25-hydroxyvitamin D3. To explore the consistency of the association between TyG-BMI and osteoporosis, subgroup analyses were performed by age (< 60 or ≥ 60 years), sex (male or female), smoking status (yes or no), duration of diabetes (< 7 or ≥ 7 years), hypertension (yes or no), hyperlipidemia (yes or no), hyperuricemia (yes or no), hyperhomocysteinemia (yes or no), and CKD (yes or no). Sensitivity analyses were also conducted to evaluate the robustness of the findings. The predictive performance of TyG-BMI, the TyG index, and BMI for osteoporosis was assessed using receiver operating characteristic (ROC) curves and the area under the curve (AUC), while potential nonlinear associations were examined with restricted cubic spline (RCS) plots. All statistical analyses were performed using SPSS software version 26.0 (IBM Corp., Armonk, NY, USA) and R software version 4.3.4 (R Foundation for Statistical Computing, Vienna, Austria). All tests were two-sided, and P values < 0.05 were considered statistically significant.
Results
Clinical Characteristics by TyG-BMI Tertiles
As shown in Table 1, a total of 892 participants were included in the study, with 297, 298, and 297 individuals assigned to the T1, T2, and T3 groups, respectively. Significant differences were observed among the three groups in several clinical characteristics, including age, sex, duration of diabetes, smoking status, hypertension, hyperlipidemia, hyperuricemia, use of lipid-lowering medications, BMI, SBP, DBP, FBG, WBC, platelet count, CRP, uric acid, albumin, eGFR, TC, TG, HDL-C, LDL-C, serum sodium, calcium, HbA1c, D-dimer, homocysteine, 25-hydroxyvitamin D3, and the presence of osteoporosis (all P < 0.05). Notably, the prevalence of osteoporosis decreased progressively across higher tertiles of the TyG-BMI (P < 0.001).
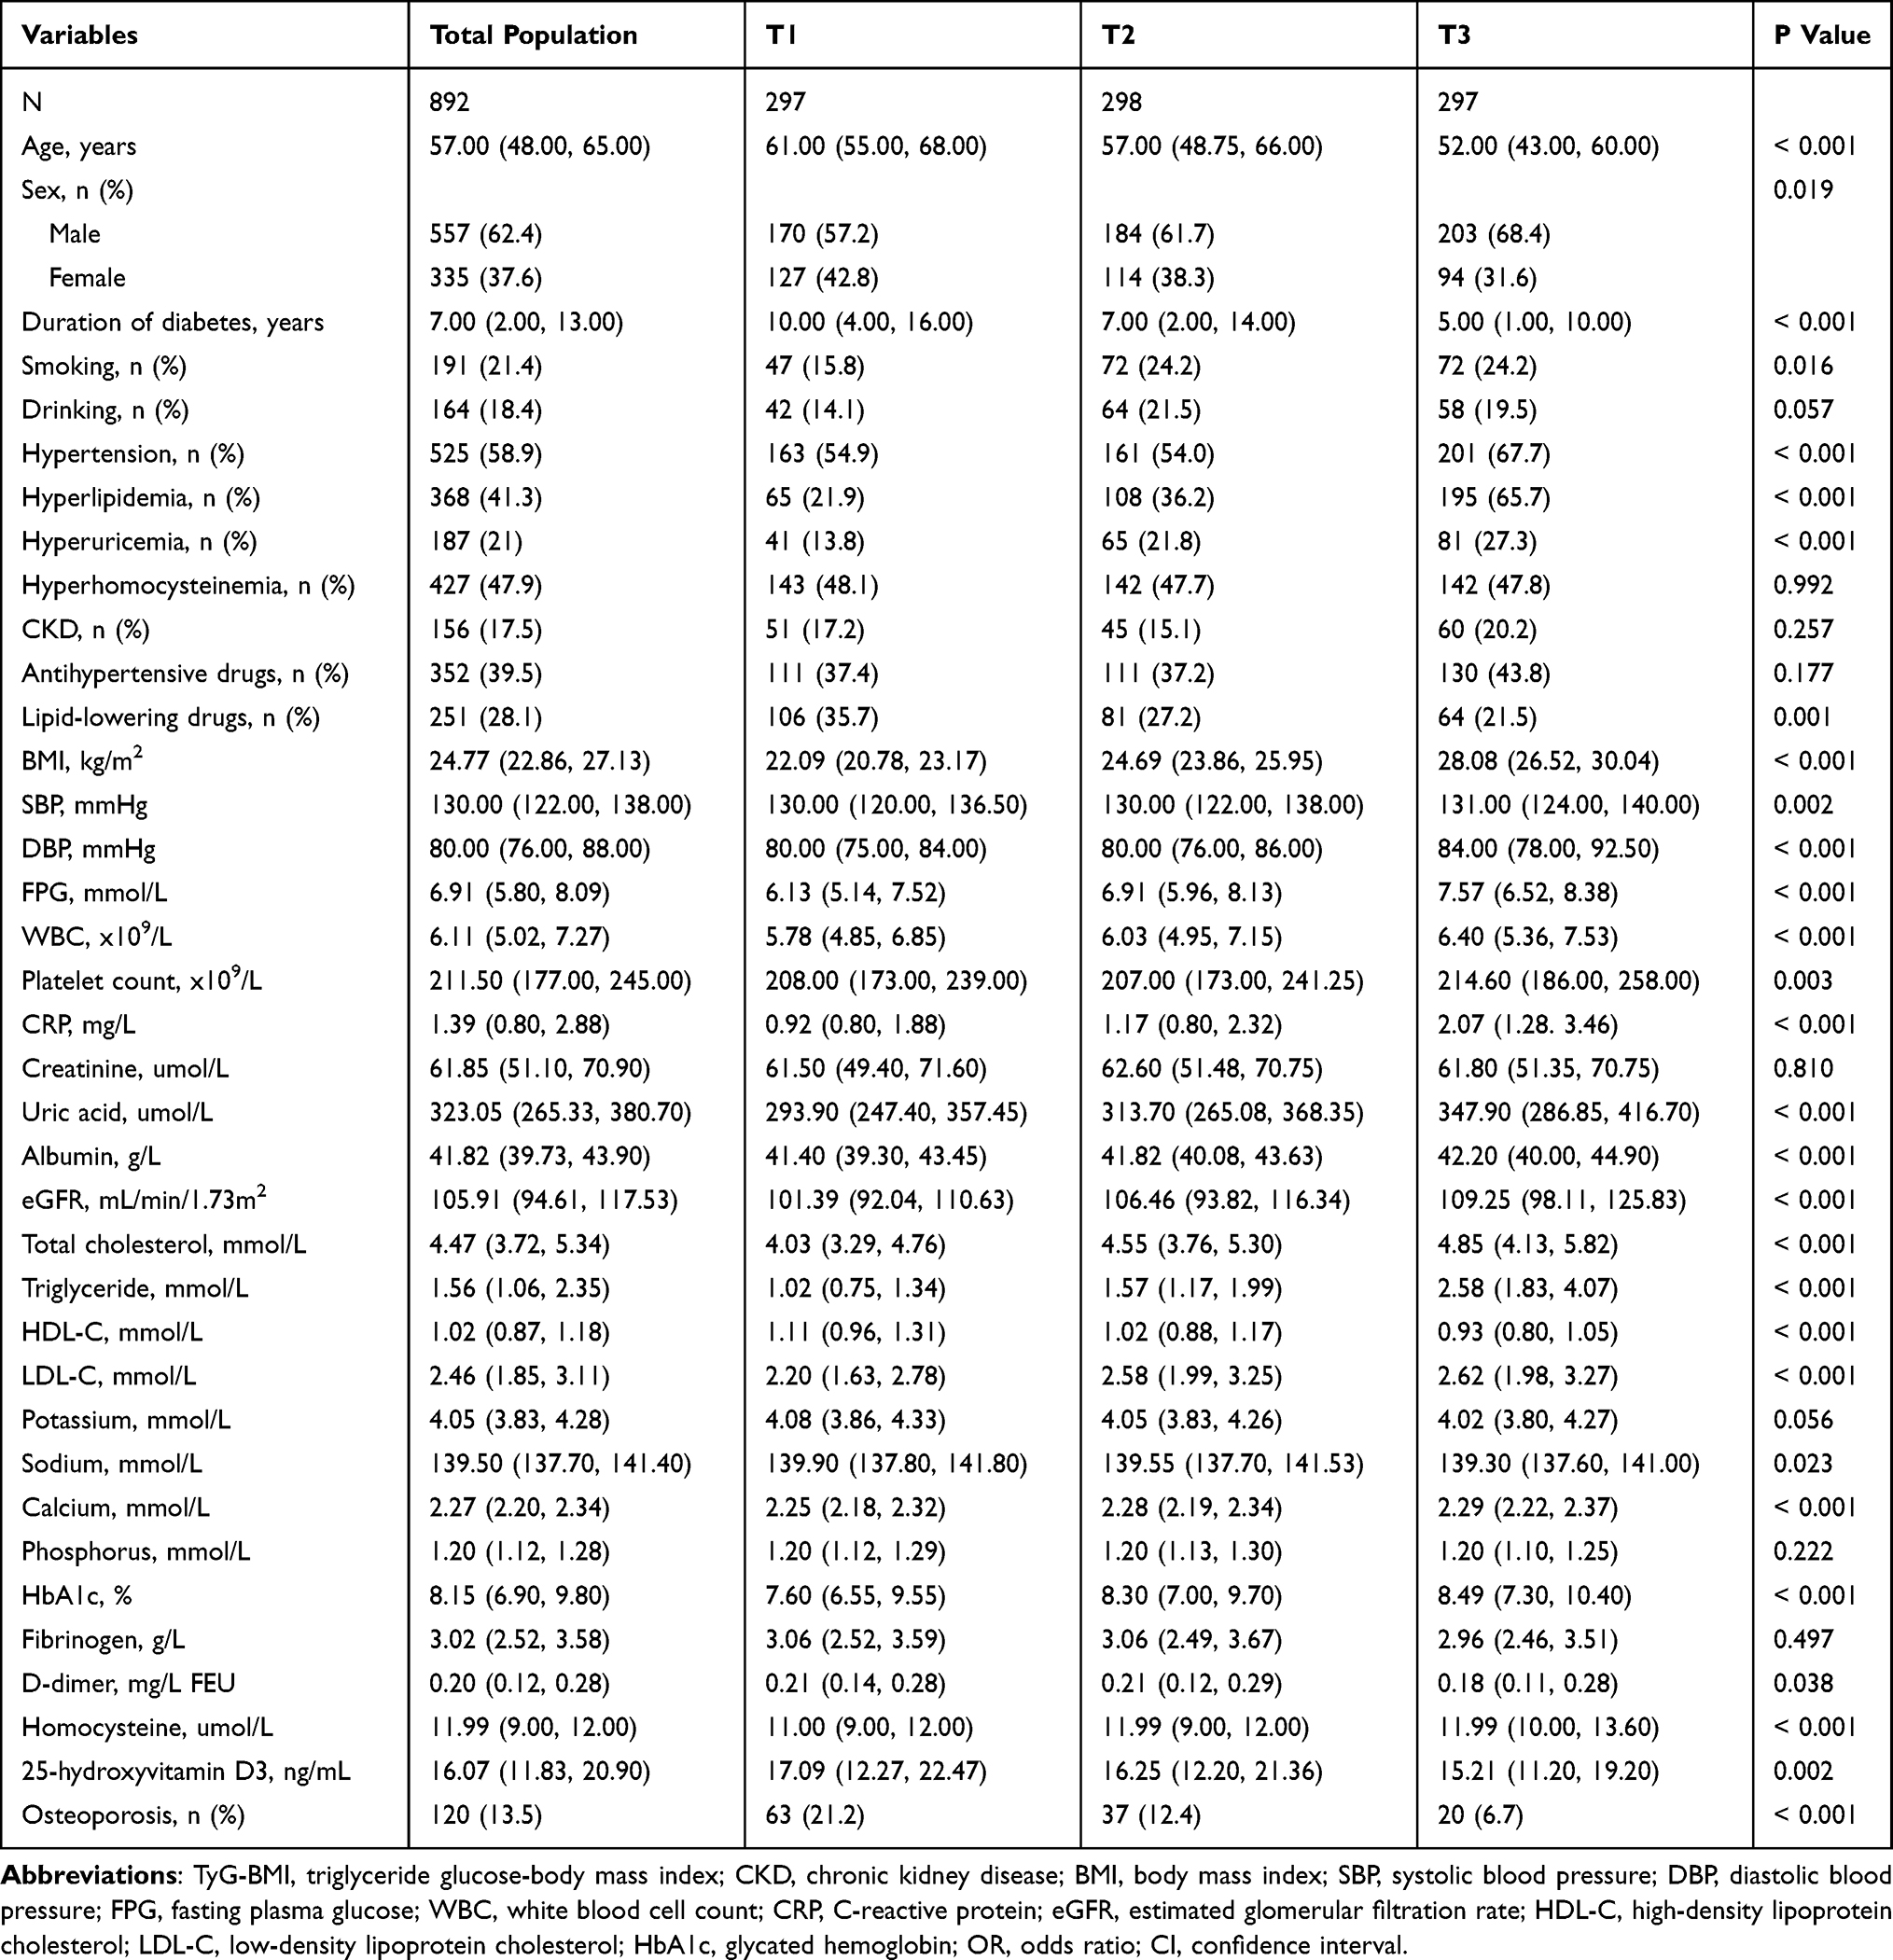 |
Table 1 Based on the Clinical Characteristics of the TyG-BMI Tertile Groups |
TyG-BMI and Osteoporosis: Multivariate Regression Analysis
As shown in Table 2, TyG-BMI was significantly associated with osteoporosis when analyzed as both a continuous and a categorical variable. This association remained significant in Model 1, which was adjusted for age and sex, and in Model 2, which was adjusted for age, sex, smoking status, use of lipid-lowering medications, and duration of diabetes (P < 0.05). More importantly, in the fully adjusted Model 3—which accounted for age, sex, smoking status, lipid-lowering medications, diabetes duration, TG, HDL-C, uric acid, albumin, eGFR, and 25-hydroxyvitamin D3—each one-unit increase in TyG-BMI was associated with a 1.5% reduction in the risk of osteoporosis (odds ratio [OR] = 0.985, 95% confidence interval [CI]: 0.978–0.992, P < 0.001). Furthermore, compared with the T1 group, the risk of osteoporosis was significantly lower in the T2 group (OR = 0.565, 95% CI: 0.352–0.908, P = 0.018) and the T3 group (OR = 0.322, 95% CI: 0.167–0.620, P = 0.001).
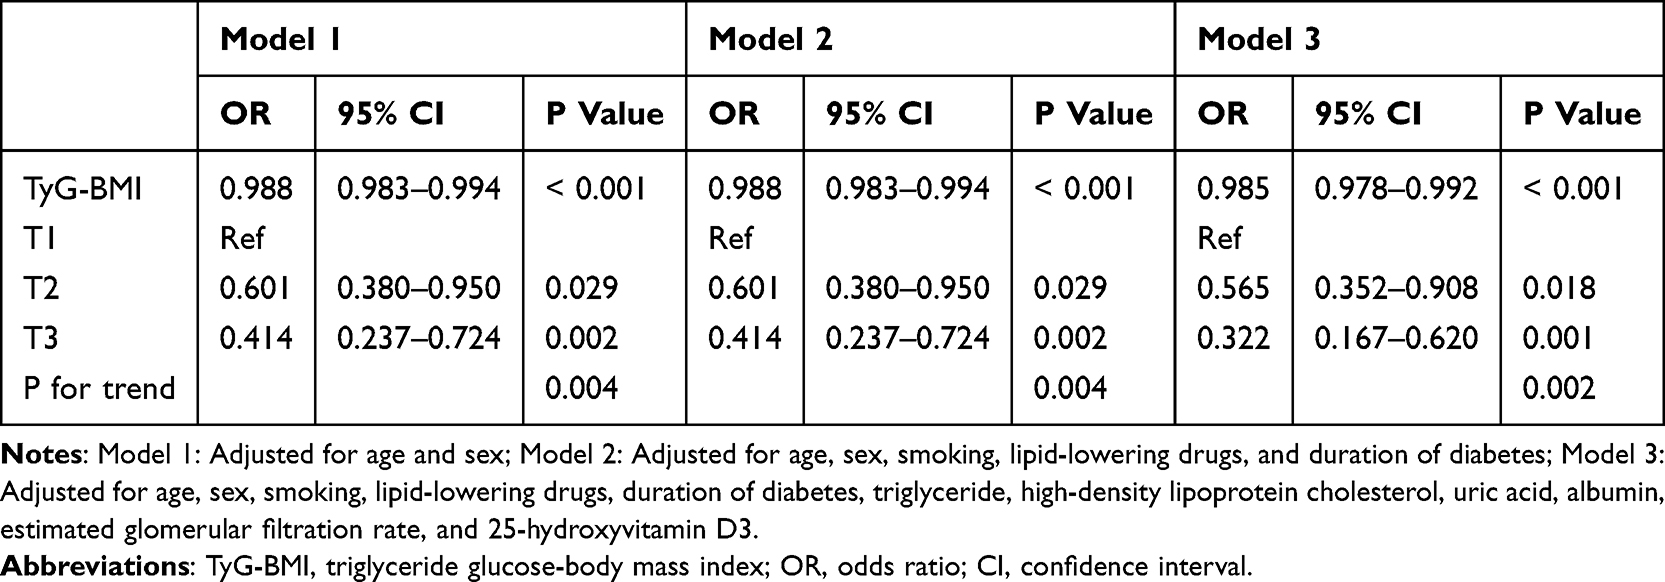 |
Table 2 Multivariate Logistic Regression Analysis of TyG-BMI and Osteoporosis |
Multivariate Subgroup Analysis of TyG-BMI and Osteoporosis
As shown in Table 3, subgroup analyses demonstrated that higher TyG-BMI levels were consistently associated with a lower risk of osteoporosis across most strata. In participants aged < 60 years, the risk of osteoporosis was reduced by 61.5% and 66.8% in the T2 and T3 groups, respectively, compared with T1, and decreased by 1.5% for each one-unit increase in TyG-BMI. Among those aged ≥ 60 years, the risk was reduced by 47.4% in T2 and 84.4% in T3 compared with T1, with a 2.0% reduction for each unit increase in TyG-BMI. In the male subgroup, osteoporosis risk declined by 56.4% in T2 and 75.4% in T3 compared with T1, and decreased by 1.5% per unit increase in TyG-BMI. Among females, the risk was 68.6% lower in T3 than in T1, and declined by 1.7% with each additional TyG-BMI unit. In non-smokers, the risk was 68.3% lower in T3 compared with T1. For participants with a diabetes duration < 7 years, osteoporosis risk decreased by 66.4% in T3 versus T1, with a 1.1% reduction per TyG-BMI unit; for those with a duration ≥ 7 years, the risk decreased by 65.4% in T3, with a 1.7% reduction per unit.
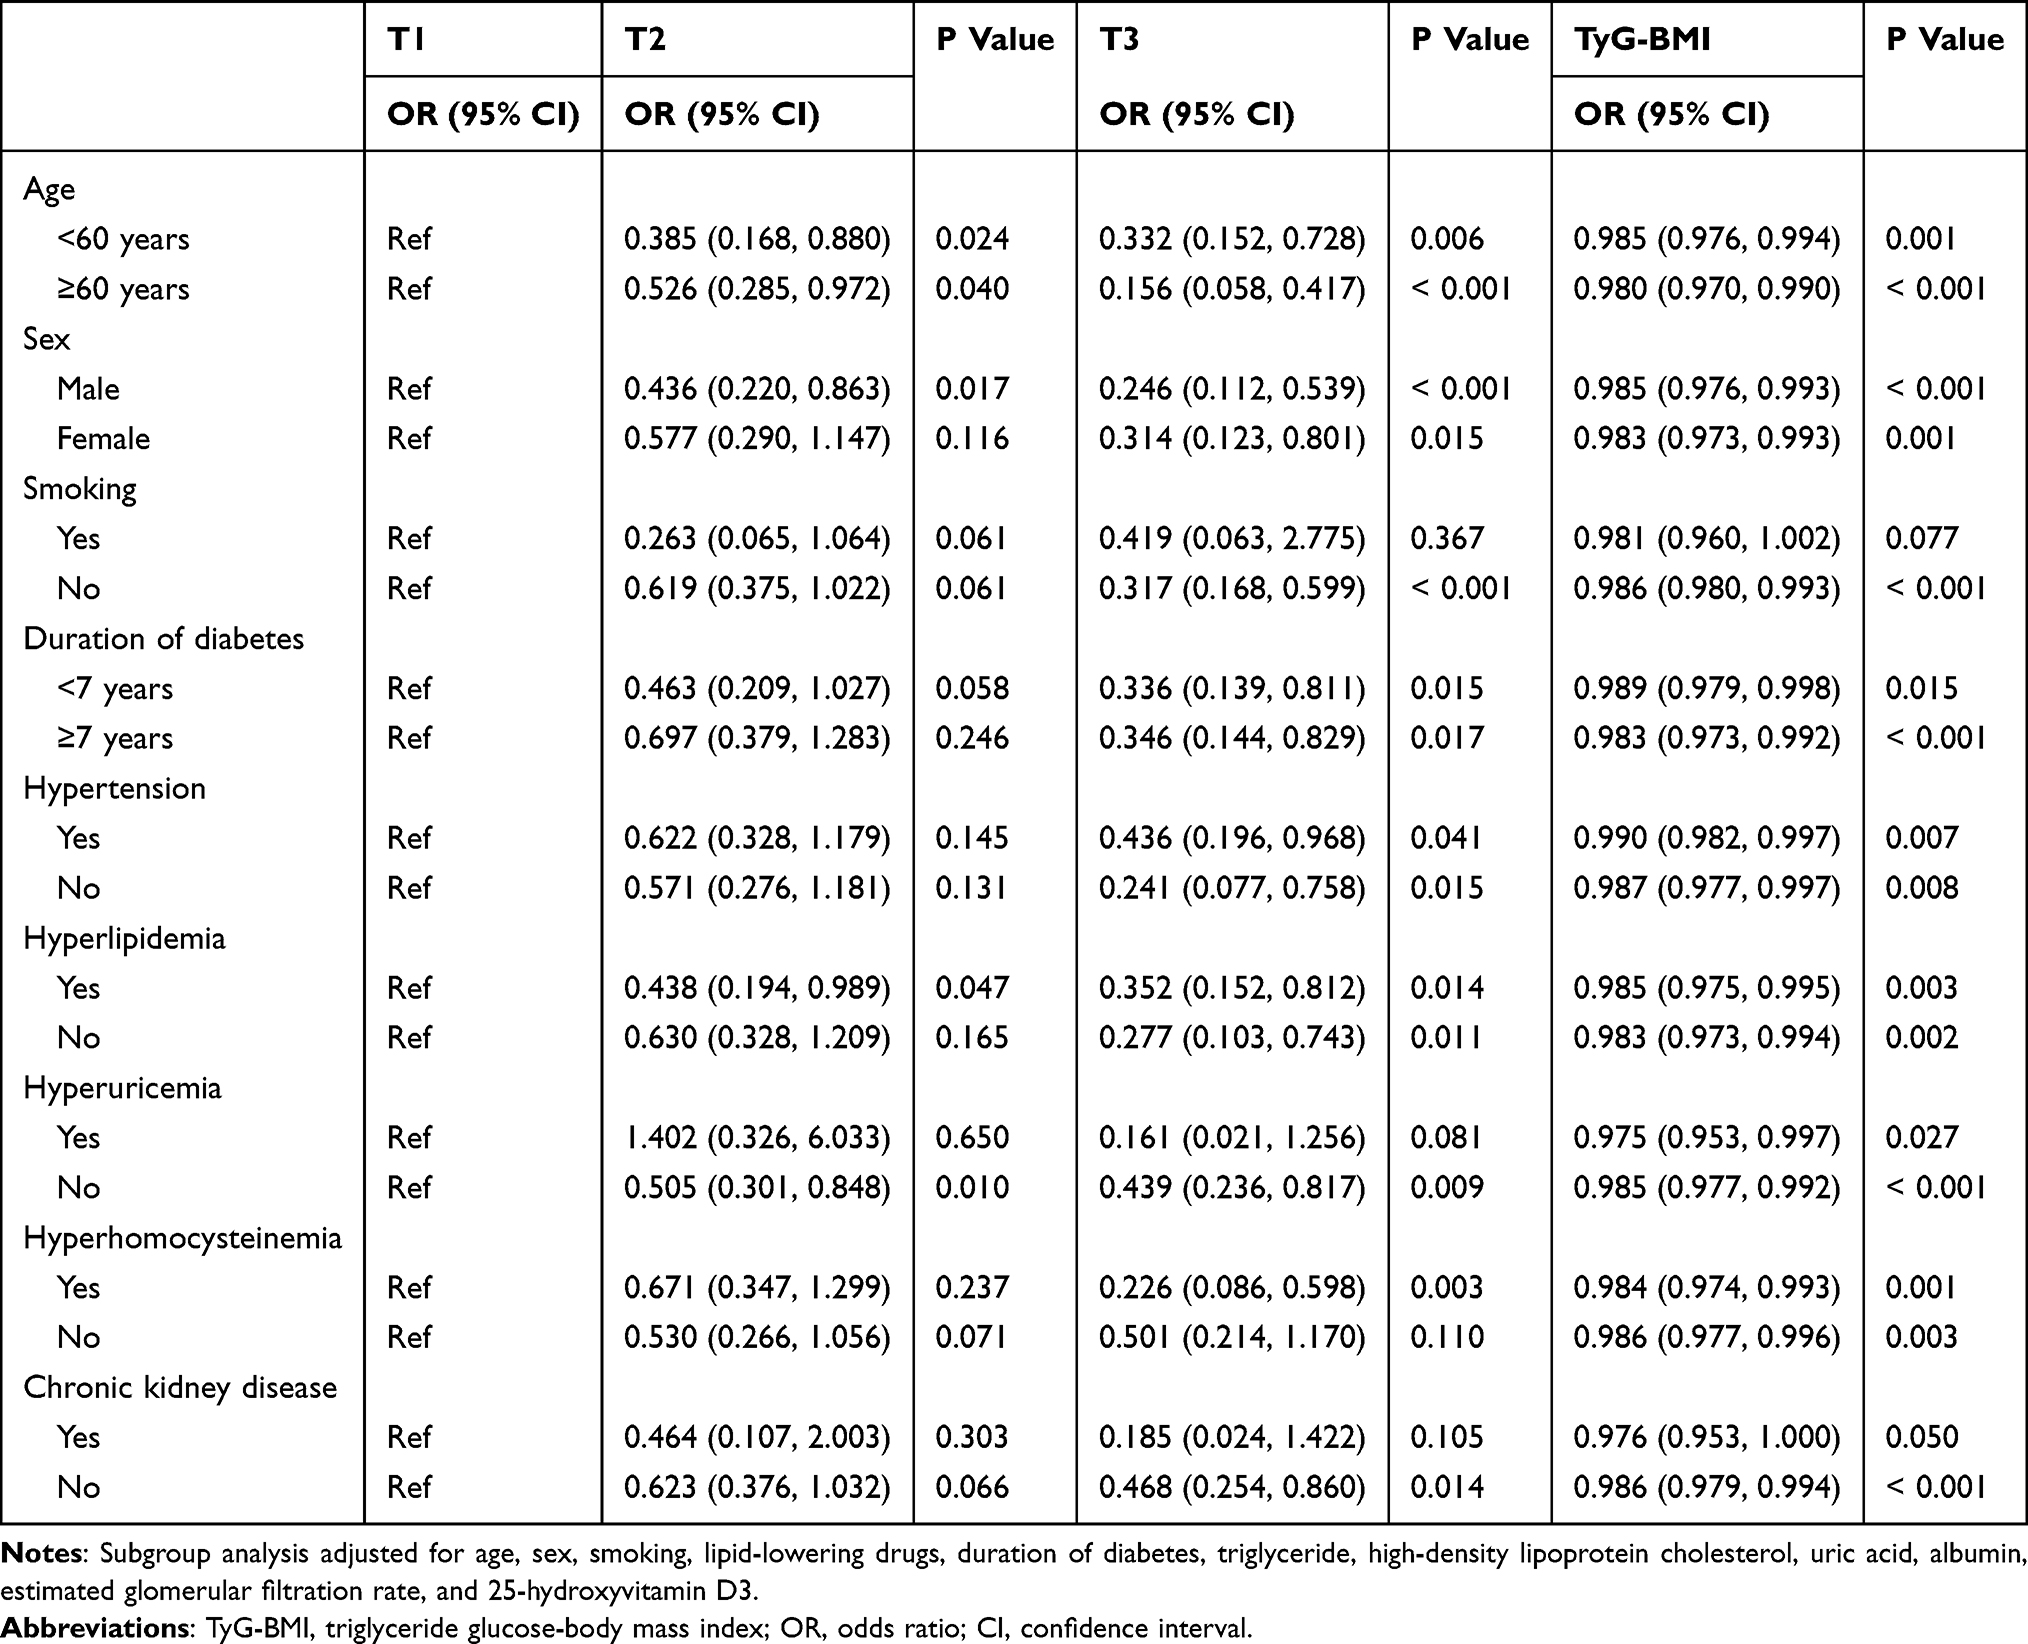 |
Table 3 Subgroup Analysis of the Correlation Between TyG-BMI and Osteoporosis |
Among participants with hypertension, the risk was reduced by 56.4% in T3 compared with T1, and by 1.0% per TyG-BMI unit. In the non-hypertensive subgroup, the risk was 75.9% lower in T3 than in T1, and declined by 1.3% per unit. For those with hyperlipidemia, the risk was 56.2% lower in T2 and 64.8% lower in T3 compared with T1. In participants without hyperlipidemia, osteoporosis risk decreased by 72.3% in T3 compared with T1, and by 1.7% for each TyG-BMI unit. In the hyperuricemia subgroup, each unit increase in TyG-BMI reduced the risk of osteoporosis by 2.5%. Among participants without hyperuricemia, the risk decreased by 49.5% in T2 and 56.1% in T3 compared with T1, and by 1.5% per unit increase in TyG-BMI. In those with hyperhomocysteinemia, osteoporosis risk was 77.4% lower in T3 compared with T1, and declined by 1.6% for each unit increase in TyG-BMI. Among participants without hyperhomocysteinemia, the risk decreased by 1.4% per unit. Finally, in the subgroup without CKD, the risk of osteoporosis was 53.2% lower in T3 compared with T1, and decreased by 1.4% with each additional TyG-BMI unit.
Sensitivity Analysis of the Association Between TyG-BMI and Osteoporosis
As shown in Table 4, participants were stratified into four groups according to the quartiles of the TyG-BMI. In the fully adjusted model, the risk of osteoporosis was 56.2% lower in the Q3 group and 74.8% lower in the Q4 group compared with the Q1 group (Q3: OR = 0.438, 95% CI: 0.244–0.786, P = 0.006; Q4: OR = 0.252, 95% CI: 0.115–0.554, P = 0.001). Furthermore, when participants were categorized by the median TyG-BMI value, those in the high TyG-BMI group had a 48.8% lower risk of osteoporosis compared with the low TyG-BMI group (OR = 0.512, 95% CI: 0.327–0.799, P = 0.003).
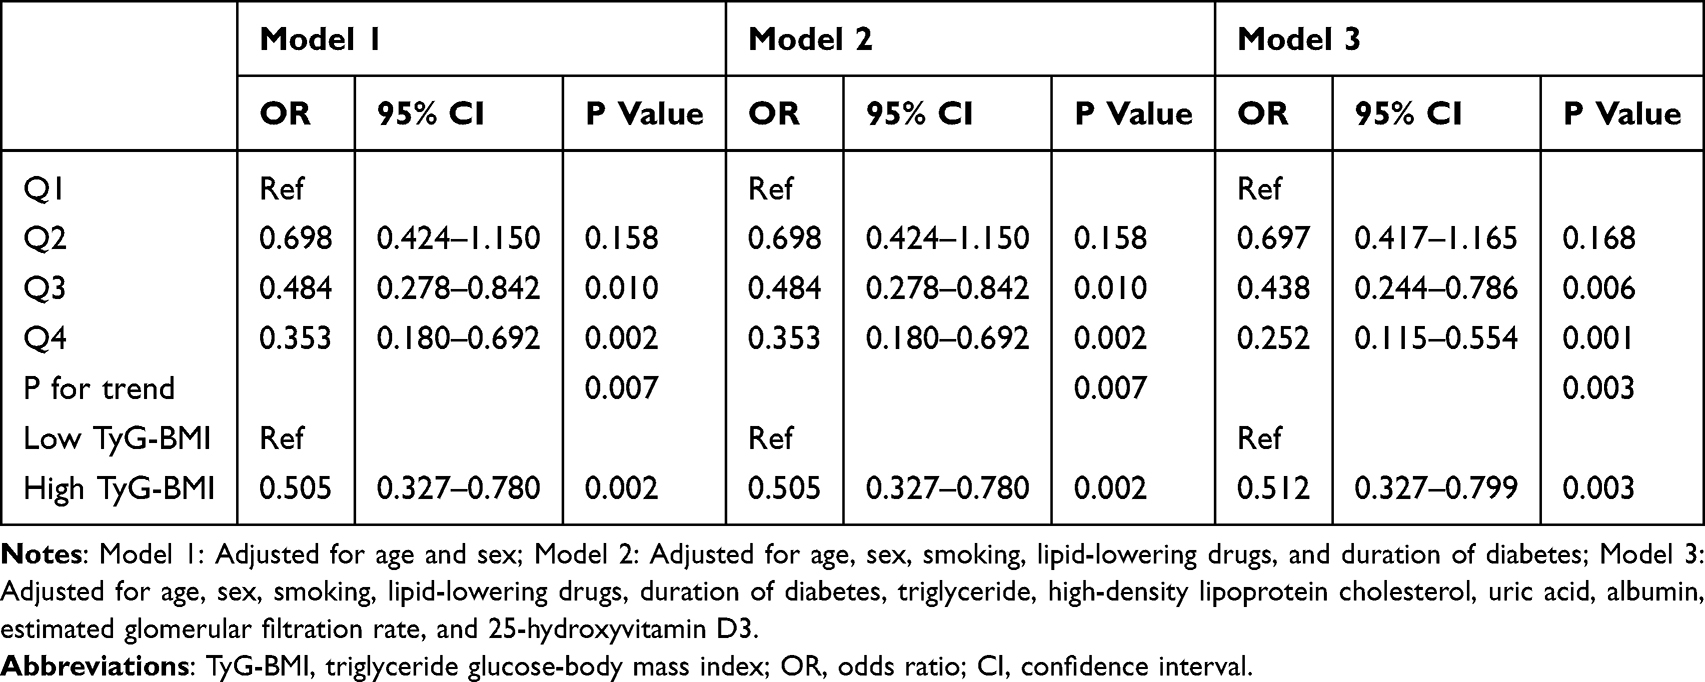 |
Table 4 Sensitivity Analysis: Based on Different Groups of TyG-BMI |
Predictive Value and Nonlinear Association of TyG-BMI with Osteoporosis
As shown in Figure 1, ROC curve analysis demonstrated that TyG-BMI had a moderate predictive value for osteoporosis, with an AUC of 0.657 (95% CI: 0.606–0.707, P < 0.001). Notably, the predictive performance of TyG-BMI was superior to that of the TyG index alone (AUC = 0.554) and BMI alone (AUC = 0.647). Furthermore, as illustrated in Figure 2, RCS analysis revealed a significant linear negative association between TyG-BMI and osteoporosis, with no evidence of nonlinearity (P for nonlinearity = 0.720).
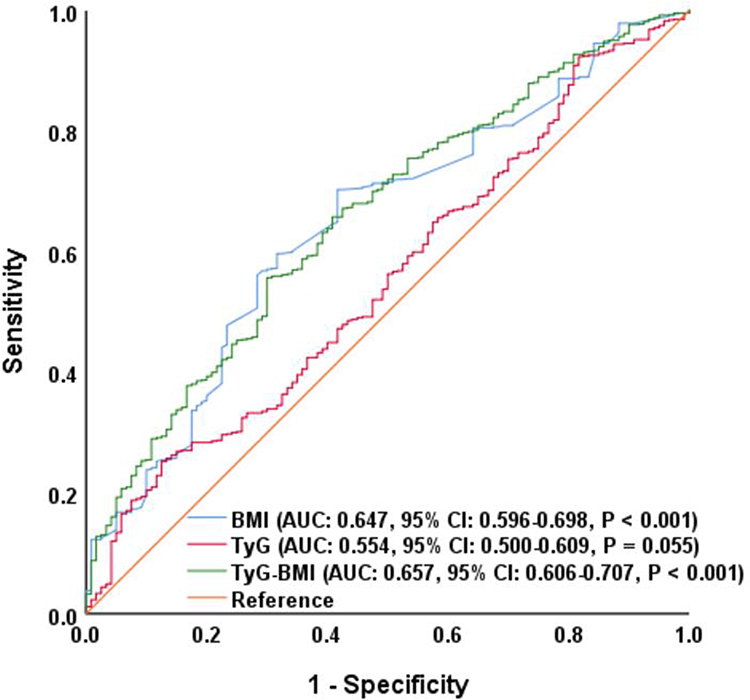 |
Figure 1 ROC curve assesses the discrimination ability of TyG-BMI, TyG and BMI for osteoporosis. Abbreviations: ROC, receiver operating characteristic curve; AUC, area under the curve; CI, confidence interval; TyG-BMI, triglyceride-glucose index - body mass index. |
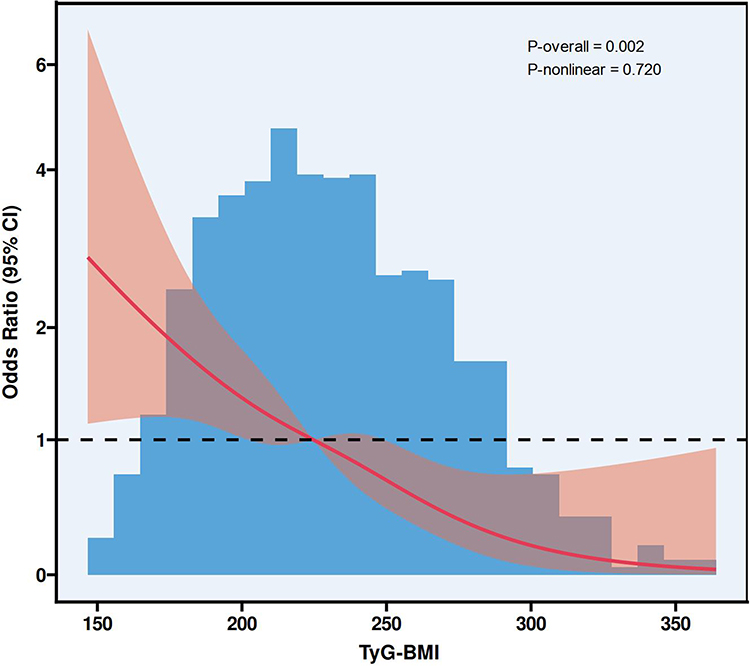 |
Figure 2 RCS plot of the correlation between TyG-BMI and osteoporosis. Abbreviations: RCS, restricted cubic spline; CI, confidence interval; TyG-BMI, triglyceride-glucose index - body mass index. |
Discussion
This study investigated the relationship between TyG-BMI and osteoporosis in patients with T2DM. A total of 892 individuals with T2DM were enrolled, and univariate and multivariate logistic regression analyses, subgroup and sensitivity analyses, ROC curve analysis, and RCS modeling were performed. The results consistently showed that higher TyG-BMI levels were significantly associated with a lower risk of osteoporosis, and this association remained robust after adjustment for multiple confounders across various subgroups. A key finding was that TyG-BMI demonstrated superior predictive performance for osteoporosis compared to its individual components (TyG index and BMI). These findings suggest that TyG-BMI, an easily obtainable indicator derived from routine clinical parameters, may serve as a valuable tool for assessing osteoporosis risk in patients with T2DM, providing clinicians with an additional approach for early identification and intervention.
In recent years, an increasing number of studies have focused on the role of the TyG-BMI in bone metabolism, particularly in osteoporosis, providing new perspectives for assessing bone health in both diabetic and non-diabetic populations. For example, Chen et al reported that TyG-BMI is an important predictor of osteoporosis in middle-aged and elderly patients with T2DM, showing a positive association with osteoporosis risk, which was more pronounced in women, and demonstrating strong discriminative power.26 Zeng et al, based on a prospective cohort study, found a linear relationship between TyG-BMI and the incidence of osteoporosis in older men, with its protective effect influenced by BMI and dietary patterns.27 Jia et al further revealed in a rural population that TyG-BMI was positively associated with BMD, with each one-unit increase in TyG-BMI corresponding to an approximately 2% reduction in OP risk, particularly among women and individuals with hypertension.28 In non-diabetic populations, TyG-BMI has also demonstrated potential value for bone metabolism. Tian et al, using data from the US National Health and Nutrition Examination Survey, observed a significant positive association between TyG-BMI and BMD, with higher TyG-BMI levels linked to a lower risk of osteoporosis.29 Similarly, Wen et al showed in a study of middle-aged and elderly non-diabetic individuals that TyG-BMI was not only positively associated with BMD but also negatively associated with the risk of hip fracture, suggesting its predictive value for both bone structure and fracture risk.30 In addition, Sun et al found in T2DM patients that TyG-BMI was inversely correlated with bone turnover markers, indicating that higher TyG-BMI levels may be related to impaired bone remodeling, thereby providing a new biological basis for the early identification of diabetes-related osteoporosis.31 From the perspectives of systematic reviews and studies in specific populations, Shirinezhad et al conducted a systematic review on surrogate markers of IR and BMD, suggesting that despite limited evidence, TyG-BMI appears to be generally positively associated with BMD and may exert a protective effect against OP.13 Collectively, these studies indicate that TyG-BMI, as a simple surrogate marker of IR calculated from routine clinical parameters, can reliably reflect bone metabolic status across diverse populations and holds considerable potential for assessing osteoporosis risk. Taken together, current evidence underscores the close relationship between TyG-BMI and BMD, bone turnover, and fracture risk in both diabetic and non-diabetic populations, and its clinical utility is increasingly recognized. Despite these promising findings, it is important to recognize that the discriminatory performance of TyG-BMI was only moderate in this study. Therefore, TyG-BMI should be considered an adjunctive clinical indicator rather than a standalone predictive tool. Its practical value is likely to be maximized when interpreted in conjunction with other established osteoporosis risk factors, biochemical markers, or imaging findings. However, the biological mechanisms by which TyG-BMI affects bone metabolism remain incompletely understood, warranting further investigation into its potential pathways involving IR, inflammatory responses, and lipid metabolism.
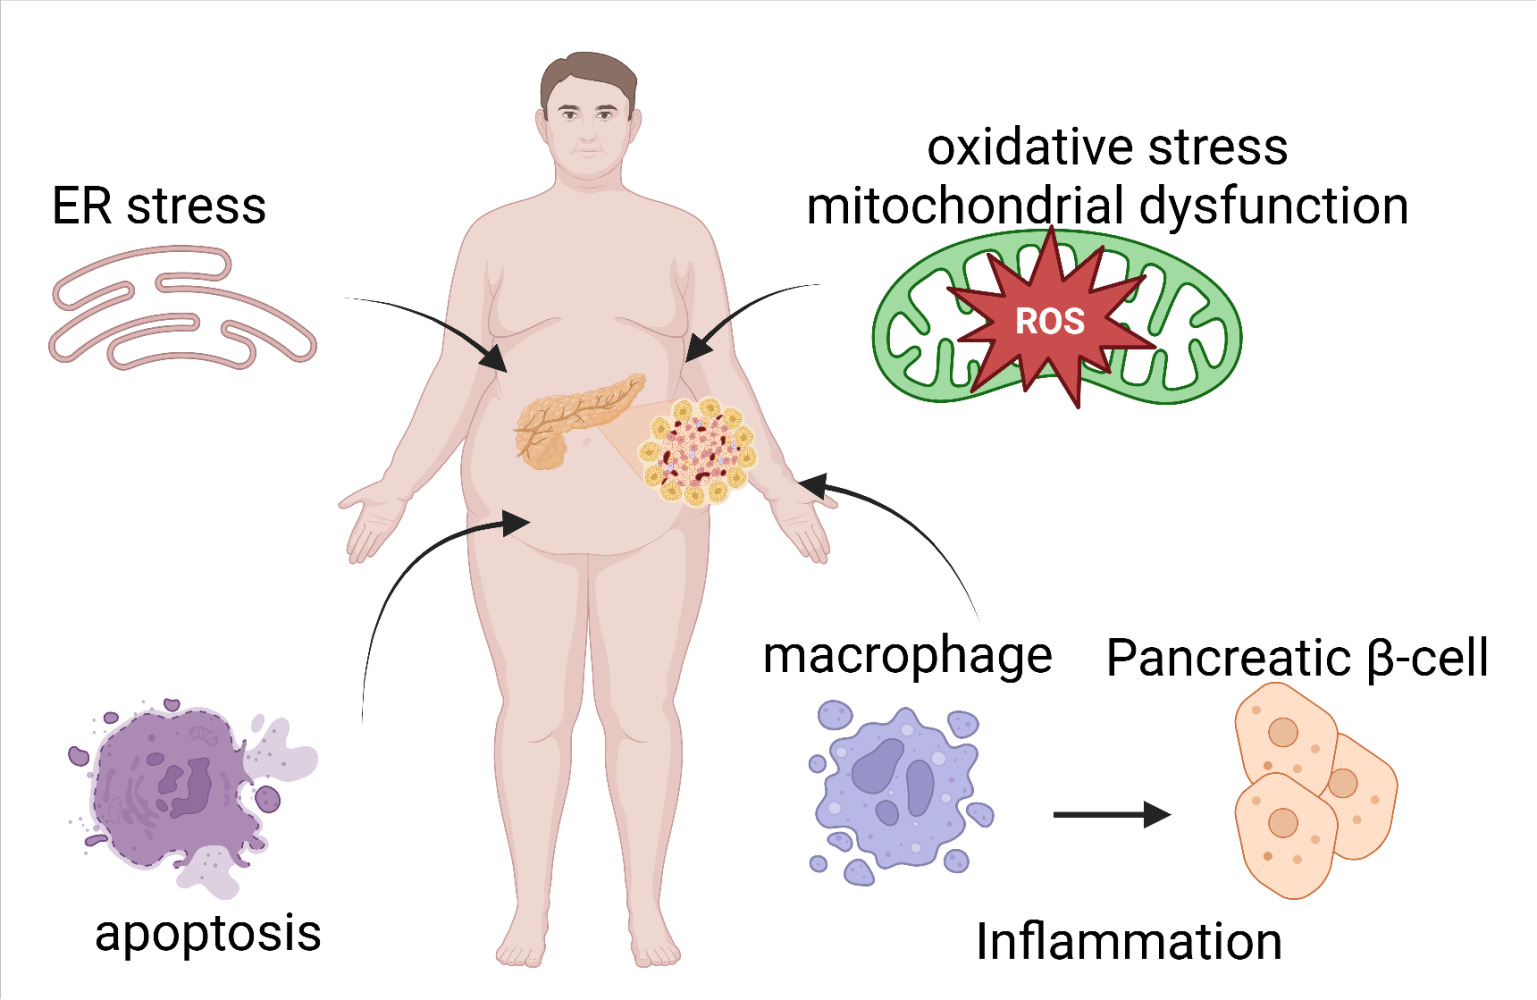
The mechanisms by which TyG-BMI influences bone metabolism and the risk of osteoporosis may involve several interrelated pathways. First, TyG-BMI is a surrogate marker of IR, and impaired insulin signaling can reduce osteoblast proliferation and collagen synthesis, suppress bone formation, and ultimately lead to decreased BMD.32 Second, higher TyG-BMI levels not only reflect abnormalities in glucose and triglyceride metabolism but also indicate adipose tissue dysfunction, which can trigger chronic low-grade inflammation and the release of cytokines.33,34 These inflammatory mediators activate the receptor activator of nuclear factor-κB ligand pathway, promote osteoclastogenesis, and accelerate bone resorption. Third, lipid metabolism disorders and oxidative stress associated with elevated TyG-BMI may drive mesenchymal stem cells toward adipogenic rather than osteogenic differentiation, interfere with vitamin D metabolism, and weaken both trabecular and cortical bone integrity, thereby increasing the risk of fragility fractures.35,36 Taken together, these findings suggest that TyG-BMI may affect bone through IR, inflammatory signaling, and lipid-related oxidative stress, providing a theoretical basis for future studies to clarify its causal role and to explore whether improving metabolic homeostasis could help prevent osteoporosis.
Although this study yielded valuable findings, several limitations should be acknowledged. First, as a single-center, cross-sectional study with a relatively small sample size, the results may not be fully representative of the broader population; therefore, large-scale prospective clinical trials are needed to further validate and expand on these findings. Second, owing to its cross-sectional design, this study was observational in nature, and no genetic analyses were performed to establish a causal relationship between TyG-BMI and osteoporosis in patients with T2DM. Third, although a significant association between TyG-BMI and osteoporosis was identified, the TyG index alone did not show a meaningful relationship with osteoporosis in our analysis and was therefore not explored in detail. Fourth, TyG-BMI was assessed only once, without dynamic monitoring, making it impossible to evaluate whether continuous exposure levels or temporal changes in TyG-BMI influence osteoporosis risk. Fifth, because this was a cross-sectional study, osteoporosis was diagnosed during hospitalization and participants were not followed over time; as a result, we were unable to examine the relationship between TyG-BMI and the incidence or progression of osteoporosis in T2DM. Sixth, despite adjusting for a wide range of baseline variables, the multivariate regression analysis may not have fully accounted for unmeasured confounders such as genetic susceptibility, dietary patterns, physical activity, lifestyle habits, and occupational exposures. Seventh, another limitation of this study was that the sample size was not determined based on a priori sample size or statistical power calculation, as all eligible patients during the study period were retrospectively included. This design may introduce the risk of insufficient statistical power in certain subgroup analyses. Nevertheless, the final sample of 892 participants, including 120 osteoporosis cases, provided an adequate number of events to meet the commonly accepted requirement of at least 10 events per variable in multivariable logistic regression analyses. Moreover, the consistency of findings across multiple subgroup and sensitivity analyses further supports the robustness and credibility of the results despite this limitation. Eighth, although osteoporosis was diagnosed using T-scores obtained during hospitalization, complete continuous BMD values (eg, g/cm2) were not available in this study. Consequently, we were unable to examine the association between TyG-BMI and BMD treated as a continuous variable, which limits the depth of BMD-related analyses. Ninth, detailed information on specific classes, dosages, and duration of antidiabetic medications was not available due to the retrospective nature of this study. Therefore, we could not account for the potential effects of different glucose-lowering regimens on osteoporosis risk, which may act as an unmeasured confounder. Finally, as the study population was drawn from a single medical center in China, the findings may not be generalizable to other ethnicities or populations. Future research should include large, multicenter, prospective studies to confirm the robustness and external validity of these associations.
Conclusions
In this real-world, single-center, cross-sectional study, higher levels of TyG-BMI were significantly associated with a lower risk of osteoporosis in patients with type 2 diabetes. This not only broadens the scope of osteoporosis in patients with type 2 diabetes, but also provides strong evidence for the inclusion of TyG-BMI in the monitoring and assessment of osteoporosis risk in patients with type 2 diabetes. In future studies, bioinformatics, artificial intelligence, cell and animal experiments and multicenter clinical studies will be combined to further explore the stability of their associations from multiple systems and perspectives.
Data Sharing Statement
The datasets used during the study are available from the corresponding author on reasonable request.
Ethics Approval and Consent to Participate
The study complied with the principles of the Declaration of Helsinki and was reviewed and approved by the Ethics Committee of Zhengzhou Central Hospital (ZXYY2024145). As this was a retrospective study and all data were anonymized, the requirement for informed consent was waived by the ethics committee.
Author Contributions
Lingfan Zhou: Conceptualization, Methodology, Software, Investigation, Data curation, Formal analysis, Visualization, Writing - original draft, Writing - review & editing. Fengjiao Zhang: Conceptualization, Writing - review & editing. Zhenwei Wang and Zhiqiang Kang: Conceptualization, Validation, Funding acquisition, Project administration, Supervision, Writing - review & editing. All authors gave final approval of the version to be published; have agreed on the journal to which the article has been submitted; and agree to be accountable for all aspects of the work.
Funding
This research received no external funding.
Disclosure
The authors declare that they have no competing interests.
References
1. Lorentzon M, Cummings SR. Osteoporosis: the evolution of a diagnosis. J Intern Med. 2015;277(6):650–12. doi:10.1111/joim.12369
2. Kanis JA, McCloskey EV, Harvey NC, Johansson H, Leslie WD. Intervention Thresholds and the Diagnosis of Osteoporosis. J Bone Miner Res. 2015;30(10):1747–1753. doi:10.1002/jbmr.2531
3. Rachner TD, Khosla S, Hofbauer LC. Osteoporosis: now and the future. Lancet. 2011;377(9773):1276–1287. doi:10.1016/S0140-6736(10)62349-5
4. Ebeling PR, Nguyen HH, Aleksova J, Vincent AJ, Wong P, Milat F. Secondary Osteoporosis. Endocr Rev. 2022;43(2):240–313. doi:10.1210/endrev/bnab028
5. Ferrari SL, Abrahamsen B, Napoli N, et al. Diagnosis and management of bone fragility in diabetes: an emerging challenge. Osteoporos Int. 2018;29(12):2585–2596. doi:10.1007/s00198-018-4650-2
6. Chau DL, Edelman SV, Chandran M. Osteoporosis and diabetes. Curr Diab Rep. 2003;3(1):37–42. doi:10.1007/s11892-003-0051-8
7. Xu Y, Wu Q. Trends in osteoporosis and mean bone density among type 2 diabetes patients in the US from 2005 to 2014. Sci Rep. 2021;11(1):3693. doi:10.1038/s41598-021-83263-4
8. Wu B, Fu Z, Wang X, et al. A narrative review of diabetic bone disease: characteristics, pathogenesis, and treatment. Front Endocrinol (Lausanne). 2022;13:1052592. doi:10.3389/fendo.2022.1052592
9. Shin D, Kim S, Kim KH, Lee K, Park SM. Association between insulin resistance and bone mass in men. J Clin Endocrinol Metab. 2014;99(3):988–995. doi:10.1210/jc.2013-3338
10. Ahn SH, Kim H, Kim BJ, Lee SH, Koh JM. Insulin resistance and composite indices of femoral neck strength in Asians: the fourth Korea National Health and Nutrition Examination Survey (KNHANES IV). Clin Endocrinol (Oxf). 2016;84(2):185–193. doi:10.1111/cen.12958
11. Shah VN, Sippl R, Joshee P, et al. Trabecular bone quality is lower in adults with type 1 diabetes and is negatively associated with insulin resistance. Osteoporos Int. 2018;29(3):733–739. doi:10.1007/s00198-017-4353-0
12. Wang X, Jiang L, Shao X. Association Analysis of Insulin Resistance and Osteoporosis Risk in Chinese Patients with T2DM. Ther Clin Risk Manag. 2021;17:909–916. doi:10.2147/TCRM.S328510
13. Shirinezhad A, Azarboo A, Ghaseminejad-Raeini A, et al. A systematic review of the association between insulin resistance surrogate indices and bone mineral density. Front Endocrinol (Lausanne). 2024;15:1499479. doi:10.3389/fendo.2024.1499479
14. Zhan J, Wei Q, Guo W, et al. Evaluating the triglyceride glucose index as a predictive biomarker for osteoporosis in patients with type 2 diabetes. Front Endocrinol (Lausanne). 2025;16:1534232. doi:10.3389/fendo.2025.1534232
15. Pan J, Huang X, Wang Q, et al. Triglyceride Glucose Index is Strongly Associated with a Fragility Fracture in Postmenopausal Elderly Females with Type 2 Diabetes Mellitus Combined with Osteoporosis: a 6-Year Follow-Up Study. Clin Interv Aging. 2023;18:1841–1849. doi:10.2147/CIA.S434194
16. Yousefiasl M, Soltanattar A, Ezzatollahi Tanha A, et al. Association of triglyceride-glucose index with bone mineral density and fracture: a systematic review. Diabetol Metab Syndr. 2025;17(1):77. doi:10.1186/s13098-025-01642-7
17. American Diabetes Association Professional Practice Committee. Diagnosis and Classification of Diabetes: standards of Care in Diabetes-2024. Diabetes Care. 2024;47(Suppl 1):S20–S42. doi:10.2337/dc24-S002.
18. Ramdas Nayak VK, Satheesh P, Shenoy MT, Kalra S. Triglyceride Glucose (TyG) Index: a surrogate biomarker of insulin resistance. J Pak Med Assoc. 2022;72(5):986–988. doi:10.47391/JPMA.22-63
19. Ensrud KE, Crandall CJ. Osteoporosis. Ann Intern Med. 2024;177(1):ITC1–ITC16. doi:10.7326/AITC202401160
20. McEvoy JW, McCarthy CP, Bruno RM, et al. 2024 ESC Guidelines for the management of elevated blood pressure and hypertension. Eur Heart J. 2024;45(38):3912–4018. doi:10.1093/eurheartj/ehae178. [published correction appears in Eur Heart J. 2025 Apr 7;46(14):1300. doi: 10.1093/eurheartj/ehaf031.].
21. Li JJ, Zhao SP, Zhao D, et al. Chinese guideline for lipid management. Front Pharmacol. 2023;14:1190934. doi:10.3389/fphar.2023.1190934
22. Du L, Zong Y, Li H, et al. Hyperuricemia and its related diseases: mechanisms and advances in therapy. Signal Transduct Target Ther. 2024;9(1):212. doi:10.1038/s41392-024-01916-y
23. Wu DF, Yin RX, Deng JL. Homocysteine, hyperhomocysteinemia, and H-type hypertension. Eur J Prev Cardiol. 2024;31(9):1092–1103. doi:10.1093/eurjpc/zwae022
24. Kidney Disease Improving Global Outcomes (KDIGO) CKD Work Group. KDIGO 2024 Clinical Practice Guideline for the Evaluation and Management of Chronic Kidney Disease. Kidney Int. 2024;105(4S):S117–S314. doi:10.1016/j.kint.2023.10.018
25. Ma YC, Zuo L, Chen JH, et al. Modified glomerular filtration rate estimating equation for Chinese patients with chronic kidney disease. J Am Soc Nephrol. 2006;17(10):2937–2944. doi:10.1681/ASN.2006040368
26. Chen Y, Zhang Y, Qin S, Yu F, Ni Y, Zhong J. The correlation between TyG-BMI and the risk of osteoporosis in middle-aged and elderly patients with type 2 diabetes mellitus. Front Nutr. 2025;12:1525105. doi:10.3389/fnut.2025.1525105
27. Zeng J, Li T, Pan Z, et al. Role of TyG, TyG-BMI and METS-IR in osteoporosis risk among older men: a retrospective cohort study. Asia Pac J Clin Nutr. 2025;34(3):477–485. doi:10.6133/apjcn.202506_34(3).0021
28. Jia F, Lu Y, Wen H, et al. Correlations Between TyG-Related Indices and Bone Health: a Cross-Sectional Study of Osteoporosis in a Rural Chinese Population. Diabetes Metab Syndr Obes. 2025;18:1445–1458. doi:10.2147/DMSO.S505024
29. Tian C, Liu J, Ma M, et al. Association between surrogate marker of insulin resistance and bone mineral density in US adults without diabetes. Arch Osteoporos. 2024;19(1):42. doi:10.1007/s11657-024-01395-2
30. Wen Z, Li Y, Xu L, et al. Triglyceride Glucose-Body Mass Index Is a Reliable Indicator of Bone Mineral Density and Risk of Osteoporotic Fracture in Middle-Aged and Elderly Nondiabetic Chinese Individuals. J Clin Med. 2022;11(19):5694. doi:10.3390/jcm11195694
31. Sun W, Xing Y, Zhou F, Ma Y, Wan X, Ma H. Association Analysis of Triglyceride Glucose-Body Mass Index and Bone Turnover Markers in Patients with Type 2 Diabetes Mellitus. Diabetes Metab Syndr Obes. 2023;16:1435–1447. doi:10.2147/DMSO.S406849
32. Armutcu F, McCloskey E. Insulin resistance, bone health, and fracture risk. Osteoporos Int. 2024;35(11):1909–1917. doi:10.1007/s00198-024-07227-w
33. Kirk B, Lombardi G, Duque G. Bone and muscle crosstalk in ageing and disease. Nat Rev Endocrinol. 2025;21(6):375–390. doi:10.1038/s41574-025-01088-x
34. Szukiewicz D. Molecular Mechanisms for the Vicious Cycle between Insulin Resistance and the Inflammatory Response in Obesity. Int J Mol Sci. 2023;24(12):9818. doi:10.3390/ijms24129818
35. Kimball JS, Johnson JP, Carlson DA. Oxidative Stress and Osteoporosis. J Bone Joint Surg Am. 2021;103(15):1451–1461. doi:10.2106/JBJS.20.00989
36. Kim H, Oh B, Park-Min KH. Regulation of Osteoclast Differentiation and Activity by Lipid Metabolism. Cells. 2021;10(1):89. doi:10.3390/cells10010089
 © 2026 The Author(s). This work is published and licensed by Dove Medical Press Limited. The
full terms of this license are available at https://www.dovepress.com/terms
and incorporate the Creative Commons Attribution
- Non Commercial (unported, 4.0) License.
By accessing the work you hereby accept the Terms. Non-commercial uses of the work are permitted
without any further permission from Dove Medical Press Limited, provided the work is properly
attributed. For permission for commercial use of this work, please see paragraphs 4.2 and 5 of our Terms.
© 2026 The Author(s). This work is published and licensed by Dove Medical Press Limited. The
full terms of this license are available at https://www.dovepress.com/terms
and incorporate the Creative Commons Attribution
- Non Commercial (unported, 4.0) License.
By accessing the work you hereby accept the Terms. Non-commercial uses of the work are permitted
without any further permission from Dove Medical Press Limited, provided the work is properly
attributed. For permission for commercial use of this work, please see paragraphs 4.2 and 5 of our Terms.
Recommended articles
Tang-Ping-San Decoction Remodel Intestinal Flora and Barrier to Ameliorate Type 2 Diabetes Mellitus in Rodent Model
Yin W, Zhang SQ, Pang WL, Chen XJ, Wen J, Hou J, Wang C, Song LY, Qiu ZM, Liang PT, Yuan JL, Yang ZS, Bian Y
Diabetes, Metabolic Syndrome and Obesity 2022, 15:2563-2581
Published Date: 20 August 2022
Association Between Hemoglobin Levels and Osteoporosis in Chinese Patients with Type 2 Diabetes Mellitus: A Cross-Sectional Study
Ye T, Lu L, Guo L, Liang M
Diabetes, Metabolic Syndrome and Obesity 2022, 15:2803-2811
Published Date: 14 September 2022
The Association Between Sarcopenia and Diabetes: From Pathophysiology Mechanism to Therapeutic Strategy
Chen H, Huang X, Dong M, Wen S, Zhou L, Yuan X
Diabetes, Metabolic Syndrome and Obesity 2023, 16:1541-1554
Published Date: 30 May 2023
Impact of Lipids on Insulin Resistance: Insights from Human and Animal Studies
Elkanawati RY, Sumiwi SA, Levita J
Drug Design, Development and Therapy 2024, 18:3337-3360
Published Date: 31 July 2024
Lipotoxicity: A New Perspective in Type 2 Diabetes Mellitus
Chen B, Li T, Wu Y, Song L, Wang Y, Bian Y, Qiu Y, Yang Z
Diabetes, Metabolic Syndrome and Obesity 2025, 18:1223-1237
Published Date: 24 April 2025