Back to Journals » Journal of Inflammation Research » Volume 18
Interpretable Machine Learning Model for Early Mortality Prediction in Septic Patients Using Routine Post-Diagnosis Clinical Data: A Multicenter Study
Authors Sun W ![]() , Zhang L, Mou D, Zhao B, Che Z, Li Y, Wang S
, Zhang L, Mou D, Zhao B, Che Z, Li Y, Wang S
Received 11 July 2025
Accepted for publication 19 October 2025
Published 28 October 2025 Volume 2025:18 Pages 15003—15015
DOI https://doi.org/10.2147/JIR.S553042
Checked for plagiarism Yes
Review by Single anonymous peer review
Peer reviewer comments 2
Editor who approved publication: Dr Anh Ngo
Wenwu Sun,1,* Lijuan Zhang,2,* Dan Mou,3,* Bing Zhao,4,* Zaiqian Che,4 Yang Li,1 Shu Wang3
1Department of Emergency Medicine, Daping Hospital, Army Medical University, State Key Laboratory of Trauma and Chemical Poisoning, Chongqing, 400042, People’s Republic of China; 2Intensive Care Unit, The Central Hospital of Wuhan, Tongji Medical College, Huazhong University of Science and Technology, Wuhan, 430014, People’s Republic of China; 3Department of Intensive Care Medicine, Chongqing University Central Hospital, Chongqing Emergency Medical Center, Chongqing, 400016, People’s Republic of China; 4Department of Emergency, Ruijin Hospital, Shanghai Jiao Tong University School of Medicine, Shanghai, 200025, People’s Republic of China
*These authors contributed equally to this work
Correspondence: Shu Wang, Department of Intensive Care Medicine, Chongqing University Central Hospital, Chongqing Emergency Medical Center, Chongqing, 400016, People’s Republic of China, Tel/Fax +86 13996583283, Email [email protected] Yang Li, Department of Emergency Medicine, Daping Hospital, Army Medical University, State Key Laboratory of Trauma and Chemical Poisoning, Chongqing, 400042, People’s Republic of China, Tel/Fax +86 02368819999, Email [email protected]
Background: Early identification of high-risk patients is crucial for improving outcomes. This study aims to develop and validate a machine learning (ML) model to predict early 7-day mortality in sepsis patients based on routine clinical data obtained immediately after diagnosis.
Methods: Data were collected from four tertiary hospitals across diverse regions in China. Seven ML algorithms were employed to construct the prediction model. Model performance was evaluated using Area Under the Receiver Operating Curve (AUROC), calibration curves, Decision Curve Analysis (DCA), and clinical application. The SHapley Additive exPlanations (SHAP) method was used to interpret the model and identify key predictors.
Results: Among 8729 patients, 752 (8.6%) died within 7 days after admission. The Artificial Neural Network (ANN) model demonstrated superior predictive performance, achieving an AUROC of 0.767 (95% CI: 0.748– 0.787) in training set, outperforming traditional scoring systems such as APACHE II (AUROC: 0.710, 95% CI: 0.698– 0.721) and SOFA (AUROC: 0.718, 95% CI: 0.707– 0.729). This performance was consistent in the test set. Key predictors of early mortality included Glasgow Coma Scale (GCS), blood chloride, and albumin levels. The SHAP analysis provided interpretable insights into the model.
Conclusion: We developed a machine learning model to predict the risk of early 7-day mortality in sepsis patients based on routine clinical data obtained immediately after diagnosis and validated its potential as a clinically reliable tool, achieving an AUROC of 0.767 in the training set. The use of SHAP-based interpretation enhances model interpretability, enabling clinicians to better understand the factors influencing mortality, identify high-risk patients early, and implement timely interventions to improve outcomes.
Keywords: sepsis, early mortality, machine learning, predictive models, SHAP, critical care
Introduction
Sepsis, a life-threatening systemic inflammatory response syndrome triggered by infection, is a leading cause of mortality in intensive care units (ICUs) worldwide.1 Annually, there are an estimated 48.9 million cases and 11 million deaths related to sepsis worldwide.2 In China, the incidence and mortality rates of sepsis are similarly alarming, with hospital mortality rates ranging from 30% to 50%, and exceeding 50% in cases of severe sepsis and septic shock.3 Beyond its devastating impact on patient survival, sepsis imposes a significant economic burden on healthcare systems, with annual costs exceeding tens of billions of dollars.4
Early identification and intervention are critical to improving outcomes in septic patients. Studies have demonstrated that patients who receive standardized treatment within the first hours of sepsis onset experience significantly lower mortality rates.5 However, the heterogeneous clinical manifestations of sepsis and the lack of specific biomarkers make early diagnosis and risk stratification particularly challenging.6 In the clinical scenario, several hours often elapse by the time routine laboratory test results become available following a patient’s initial admission. Therefore, predicting mortality in septic patients based on existing test results and medical history is critical for early risk stratification and subsequent therapeutic decision-making.
The Sequential Organ Failure Assessment (SOFA) score serves as a fundamental component of the Sepsis-3 diagnostic criteria. While multiple studies have explored its utility in predicting outcomes for septic patients, the performance of the SOFA score in forecasting short-term mortality has demonstrated notable variability across different investigations.7,8 With the rapid advancement of computer technology, machine learning (ML) has increasingly captured the attention and gained recognition within the clinical community. Recent ML-based studies have demonstrated significant potential in predicting sepsis mortality, offering clinicians a powerful tool to identify high-risk patients and facilitate timely, targeted therapeutic interventions.9–11 Despite advances in sepsis research, a critical gap remains: when a patient is diagnosed with sepsis in the emergency setting, can we reliably predict early mortality based on immediately available clinical data to facilitate timely risk stratification and intervention? Current models often rely on delayed laboratory results, limiting their utility in the crucial “golden hour” of sepsis management. Moreover, previous ML models in sepsis prediction have faced notable limitations, particularly in terms of interpretability. Many models operate as “black boxes”, providing predictions without clear explanations of the underlying decision-making process. This lack of transparency hinders clinical adoption, as clinicians require interpretable insights to trust and act on model outputs. SHapley Additive exPlanations (SHAP) addresses this critical limitation by offering feature attribution with local interpretability, facilitating the integration of ML into evidence based decision-making processes.12
Therefore, this study aims to develop an interpretable machine learning model for early sepsis mortality prediction using multicenter data to enable timely clinical interventions.
Methods
Participants
This retrospective study draws its cohort from four leading academic medical centers across China’s major metropolitan areas: representing Western China, the study includes the Daping Hospital, Army Medical University; and the Chongqing University Central Hospital, Chongqing Emergency Medical Center; from Central China: the Central Hospital of Wuhan, Tongji Medical College, Huazhong University of Science and Technology; and from Eastern China: the Ruijin Hospital, Shanghai Jiao Tong University School of Medicine. The study protocol was approved by the respective ethics boards of each participating hospital (Daping Hospital, 2024-384; Central Hospital of Wuhan, WHZXKYL2023-097-02; Chongqing University Central Hospital, 2025-24; and Ruijin Hospital, 2025-138). The requirement for informed consent was waived due to the retrospective and non-interventional nature of the study. Data analysis adhered to the principles of the 1964 Declaration of Helsinki.
The study screened consecutive adult inpatients diagnosed with sepsis on admission during the periods of January 2016 to December 2023 at the Daping Hospital, January 2017 to July 2023 at the Central Hospital of Wuhan, January 2017 to September 2023 at the Chongqing Emergency Medical Center, and January 2012 to May 2022 at the Ruijin Hospital. The diagnosis of sepsis is defined as SOFA score ≥2 points consequent to the infection (Sepsis-3).13 All patients received treatment in accordance with established guidelines. Exclusion criteria included: (1) Patients were younger than 18 years; (2) The hospital stay duration less than 2 days; (3) Death occurred within 7 days following withdrawal of treatment; (4) Discharged within 7 days with an unknown outcome; (5) Active malignancy or immunosuppressed state; (6) Missing indicators ≥ 30%.
Data Collection and Outcomes
Clinical variables were extracted from both paper-based and electronic medical records for each patient. The variables extracted in this study were: (1) Baseline demographic information: gender, age; (2) Infection source: Respiratory system, gastrointestinal tract, urinary system, and other infections; (3) Comorbidities: hypertension, diabetes, heart failure, acute coronary syndrome (ACS), cirrhosis, renal dysfunction, chronic dialysis, brain injury, respiratory dysfunction, and home oxygen therapy (HOT); (4) Vital signs: temperature, heart rate, respiratory rate, and mean arterial pressure (MAP); (5) Laboratory indicators collected the first result within 24 hours after admission: Arterial pH, oxygenation index (PaO2/FiO2), white blood cell (WBC), neutrophils, neutrophil percentage, lymphocytes, lymphocyte percentage, hemoglobin, hematocrit, platelets, blood chloride, sodium, potassium, C-reactive protein (CRP), blood urea nitrogen (BUN), creatinine, alanine aminotransferase (ALT), aspartate aminotransferase (AST), total bilirubin (TBIL), direct bilirubin (DBIL), albumin, prothrombin time (PT), activated partial thromboplastin time (APTT), Thrombin time (TT), international normalized ratio (INR), Ddimers, lactate and procalcitonin. (6) Interventions: mechanical ventilation and Vasoactive drugs on admission; (7) The Glasgow Coma Scale (GCS); (8) Previous studies demonstrated that biomarker combinations have prognostic value.14 In this study, CRP-albumin-lymphocyte ratio (CALLY), neutrophil-to-lymphocyte ratio (NLR), CRP-to-albumin ratio (CAR), platelet-to-lymphocyte ratio (PLR), platelet-to-albumin ratio (PAR), and neutrophil-to-albumin ratio (NAR) are included. To reduce the impact of missing data on model construction, the MissForest technique was employed to address datasets with less than 20% missing values, while datasets exceeding a 20% missing rate were excluded from the analysis (Table S1).
The primary outcome was 7-day mortality after admission.
Machine Learning Model Development and Statistical Analysis
Baseline characteristics as continuous and categorical variables were presented as median (interquartile range) and n (%), respectively. Continuous variables will be compared using the t-test for normally distributed variables or Wilcoxon rank-sum test for non-normally distributed variables. For categorical variables, either the Chi-squared test or Fisher’s exact test was employed.
The dataset was partitioned into a training set and a test set with a 7:3 ratio. The training set was further partitioned into an internal training set for model construction and a tuning set for hyperparameters tuning with a 7:3 ratio. The Least Absolute Shrinkage and Selection Operator (LASSO) was employed for feature selection. This method incorporates L1 regularization to compress coefficients, thereby selecting salient features and reducing dimensionality by identifying features with significant contributions and eliminating redundant ones. In this study, seven ML algorithms, logistic regression, decision tree, random forest, extreme gradient boosting (XGBoost), light gradient boosting machine (LightGBM), support vector machine (SVM), and artificial neural network (ANN), were used to construct the prediction model. To optimize the hyperparameters for each algorithm, a grid search methodology was employed. The hyperparameter exhibiting the highest Area Under the Receiver Operating Curve (AUROC) was selected as the optimal one. The predictive performance of the model was evaluated using the AUC of the ROC curve. The predictive value of the model was compared with the APACHE II (Acute Physiology and Chronic Health Evaluation II) score and the SOFA (Sequential Organ Failure Assessment) score on admission. Additionally, calibration curves and Decision Curve Analysis (DCA) were generated to assess the clinical utility. Calibration performance will be evaluated using Brier score, integrated calibration index, and visual examination of non-parametric calibration curve. To quantify the clinical utility of the models, the net benefit of each model was shown across a range of threshold probabilities (10–30%). The predictive performance of selected optimal model will undergo final validation across datasets from each center. To evaluate the interpretability of the constructed model, SHAP (Version: 0.46.0) was utilized to assess the contribution of each variable to the final predictive outcome, with the background data for SHAP value calculation derived from the internal training set. SHAP values provide a quantitative measure of the extent to which a specific input variable either positively or negatively influences the final prediction, thereby elucidating the impact of individual features on the model’s decision-making process. All statistical analyses were conducted using Python software (version 3.12.3), with a two-sided p-value less than 0.05 was considered significant.
Results
Baseline Characteristics of the Study Patients
After screening, a total of 8729 patients diagnosed with sepsis on admission were finally included in analysis, and 752 (8.6%) died within 7 days. The screening process was illustrated in Figure 1. The dataset was partitioned into a training set and a test set with a 7:3 ratio. Baseline characteristics between training set and test set were balanced and shown in Table S2.
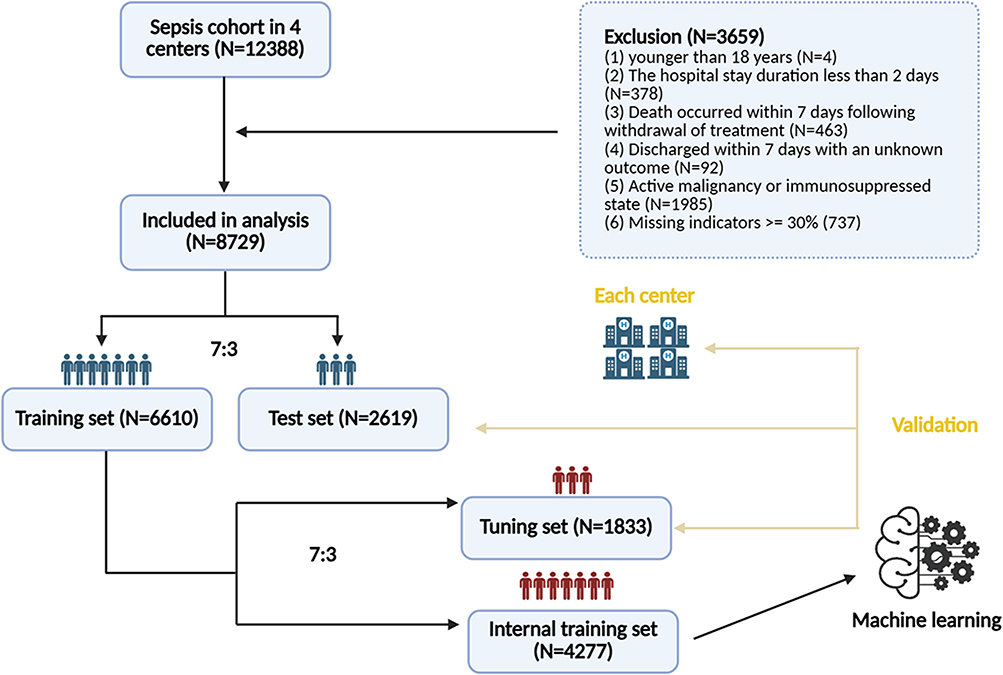 |
Figure 1 Patient screening flow. |
Table 1 showed baseline information of all patients enrolled in the training set. Comparative analysis between the non-survivor group (patients who expired within 7 days post-admission) and the survivor group revealed no statistically significant differences in median age (69 years vs 71 years, p = 0.141) or gender distribution (male: 61.5% vs 63.5%, p = 0.375). However, the non-survivor cohort demonstrated significantly higher prevalence rates of comorbidities, including hypertension, diabetes, heart failure, and ACS. On admission, non-survivor patients more frequently required mechanical ventilation, and vasoactive drugs. Vital signs revealed that non-survivor patients had lower levels of MAP, but elevated heart rate and respiratory rate. Comprehensive laboratory investigations demonstrated marked impairment in hepatic, renal, respiratory, and coagulation functions among non-survivors. Biomarker combinations showed significant differences on CALLY, CAR, PLR, PAR and NAR between the two groups. However, no significant difference was observed in the NLR.
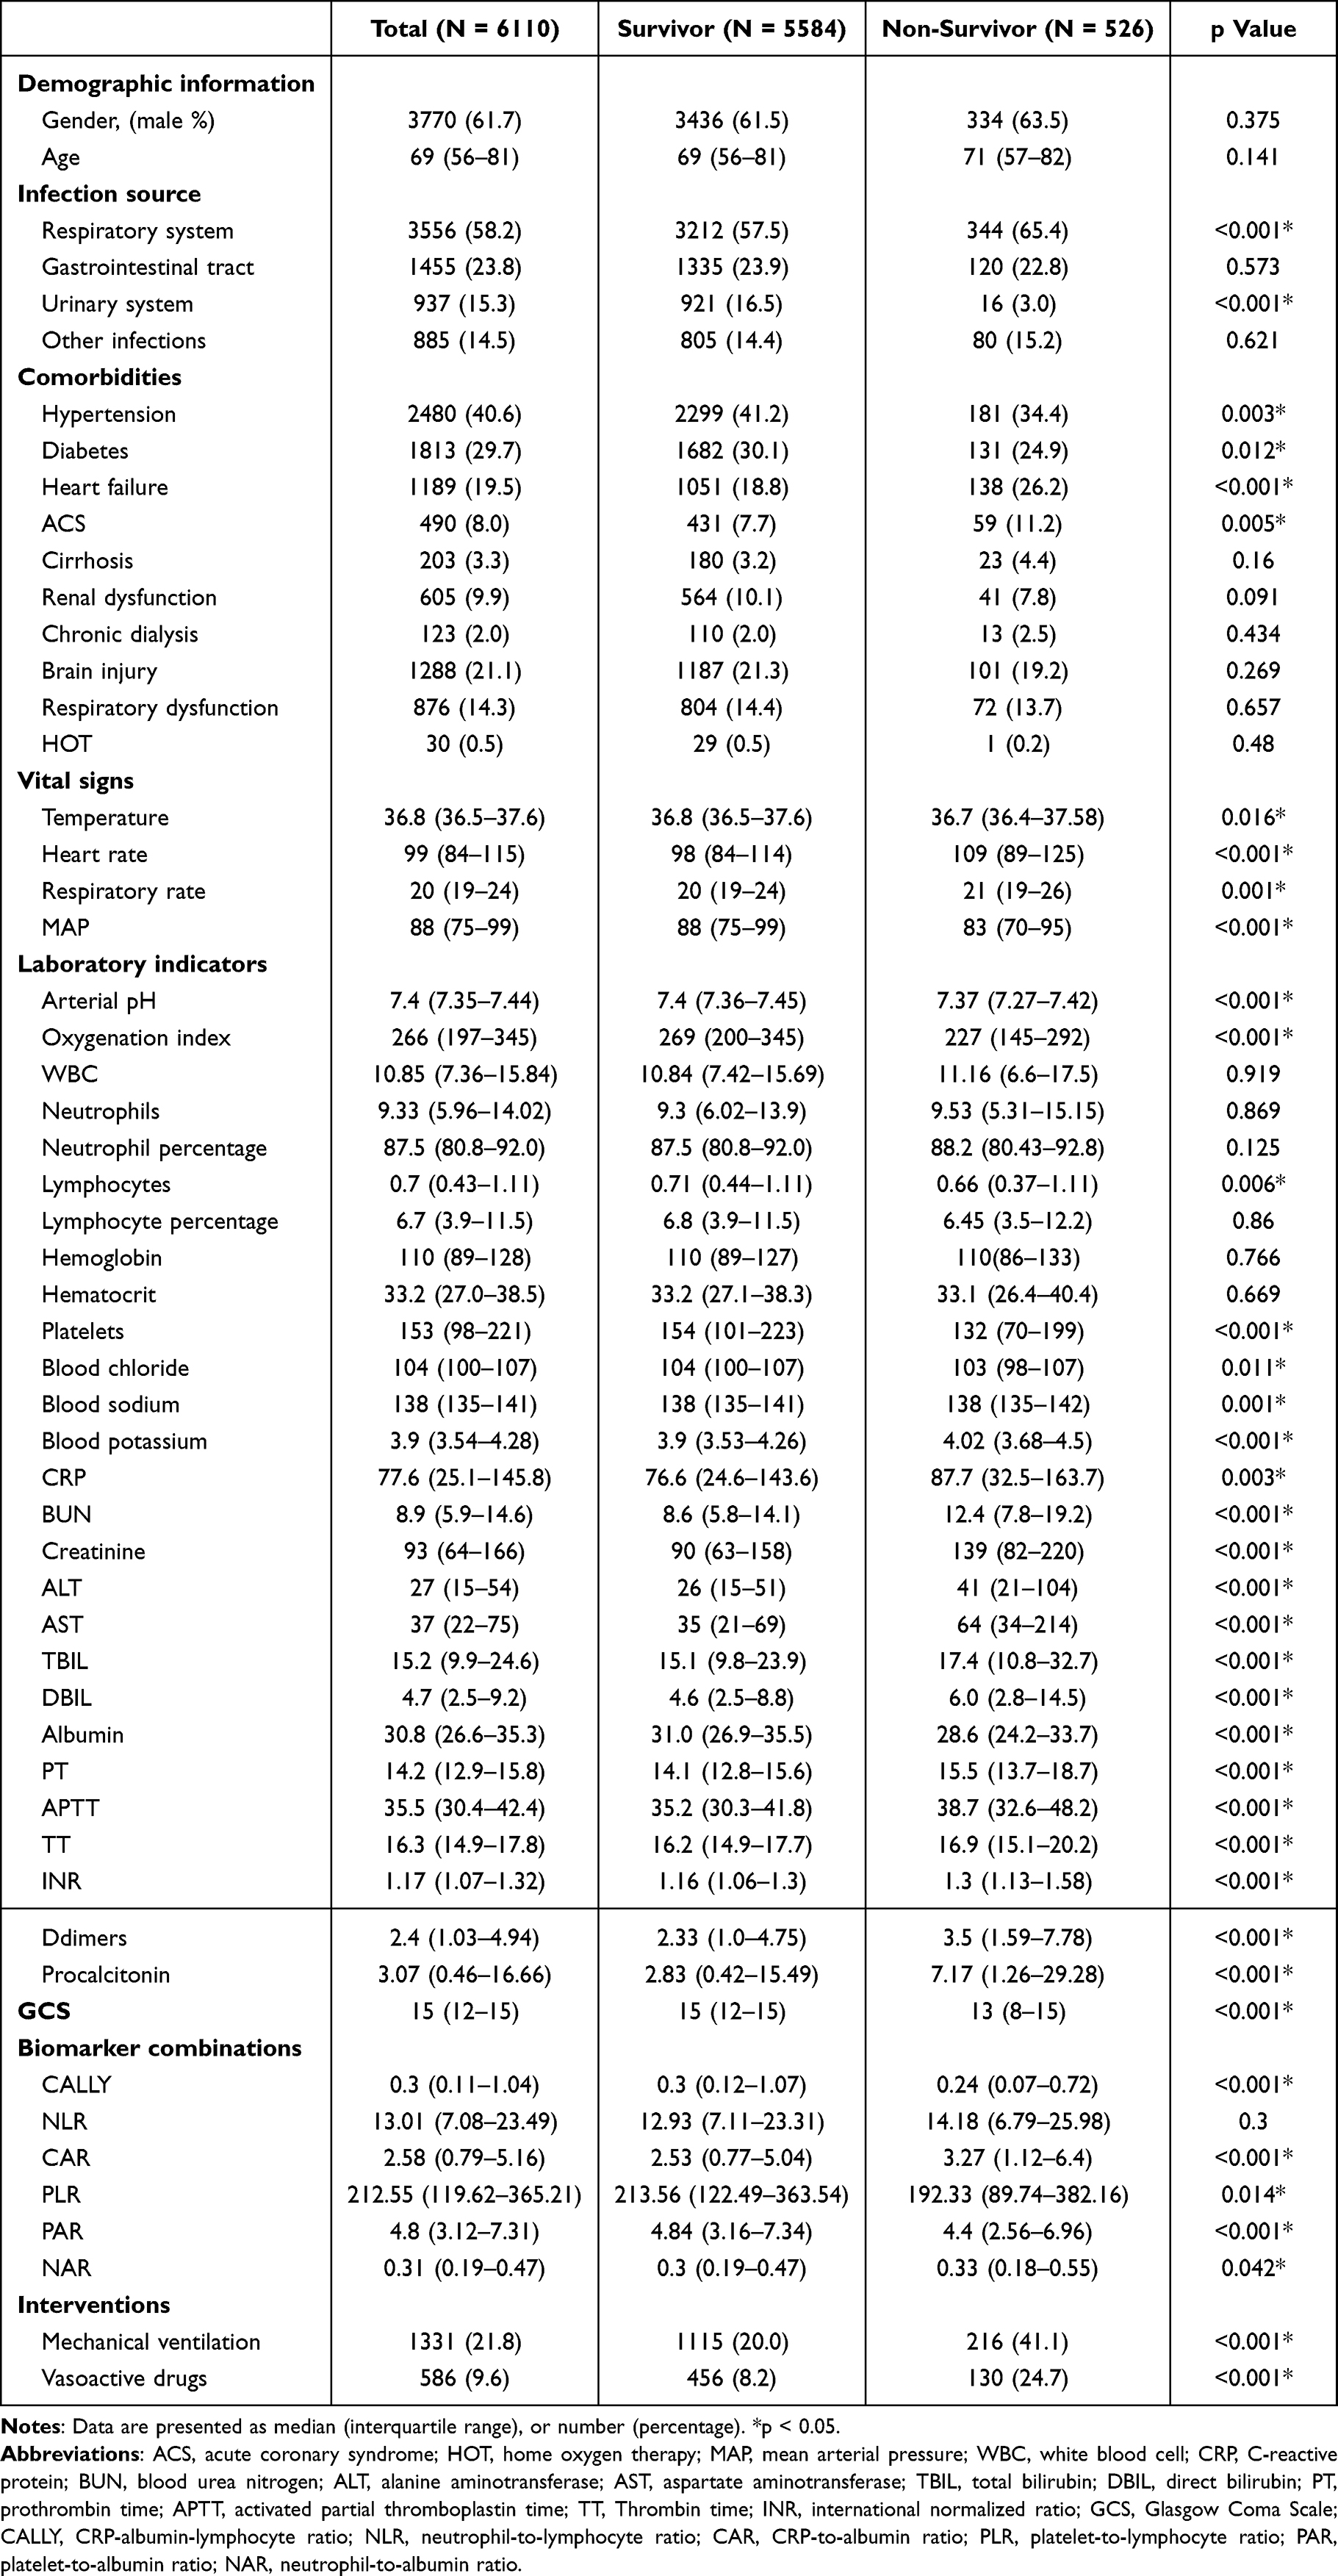 |
Table 1 Comparison of Baseline Characteristics in the Survivor and Non-Survivor Group in the Training Set |
Feature Selection
LASSO regression was employed to perform feature selection on the internal training set. The trajectory of variable coefficients was illustrated in Figure 2 The process of selecting the optimal parameter λ value in the lasso regression model is carried out by the fivefold cross-validation method. LASSO regression identified 28 clinically significant variables strongly associated with 7-day mortality: age, GCS, respiratory rate, heart rate, MAP, hemoglobin, neutrophil percentage, neutrophils, lymphocyte percentage, platelets, creatinine, BUN, AST, PT, APTT, TT, oxygenation index, albumin, ALT, TBIL, Ddimers, blood sodium, blood chloride, procalcitonin, CRP, CALLY, NLR and PLR.
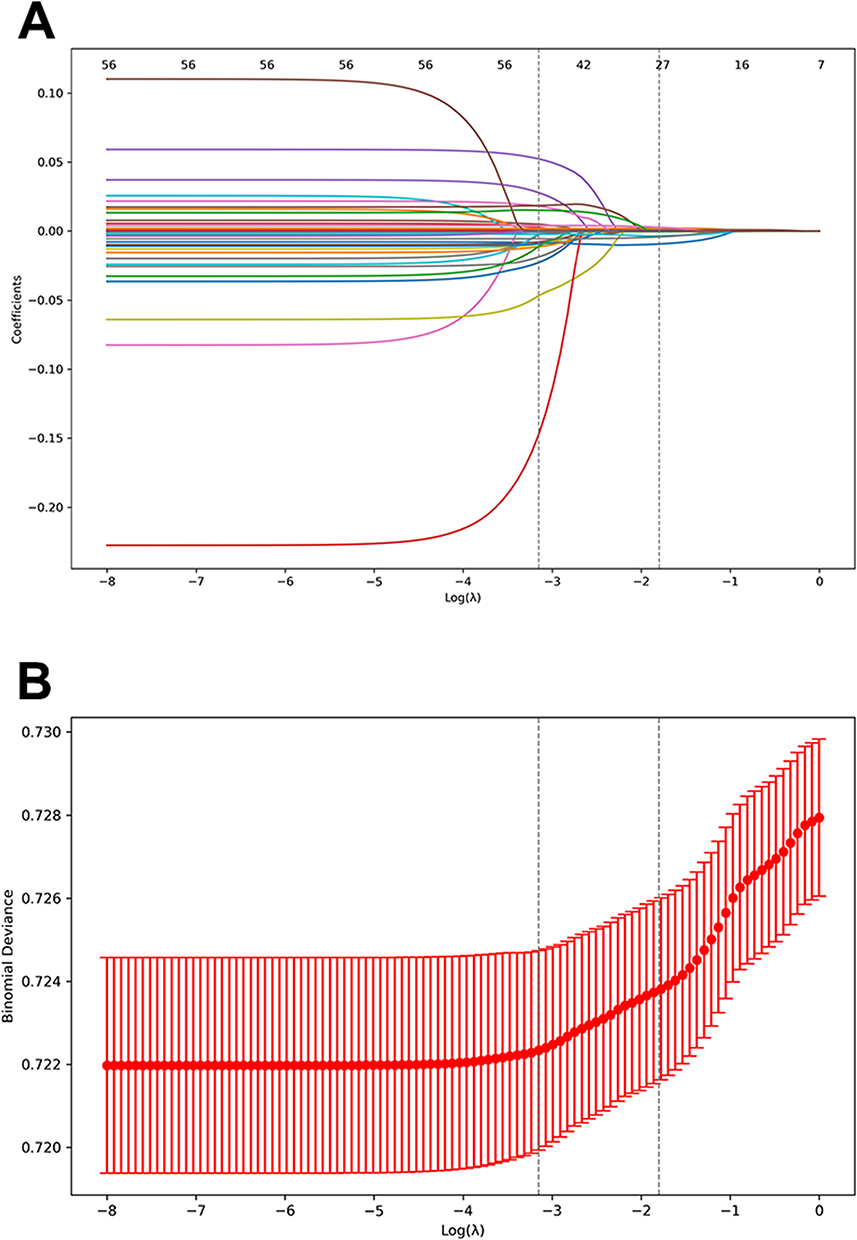 |
Figure 2 Variable screening using LASSO regression. (A) Coefficient paths of lasso regression for variable selection; (B) Cross-validation curve for LASSO regression. |
Machine Learning Model Performance
Seven ML models were constructed to predict the risk of 7-day mortality of septic patients. Figure 3 and Table S3 illustrate the discriminative performance of these models using ROC curves. Six of the seven models, except for decision tree model, demonstrated substantial predictive capabilities for 7-day mortality of septic patients compared with APACHEII or SOFA. In training set, the random forest and LightGBM model achieve the highest performance, with an AUC of 0.790 [95% confidence interval (CI): 0.771–0.808], and 0.790 (95% CI: 0.771–0.809), respectively. The XGBoost model closely followed, exhibiting comparable efficacy with an AUC of 0.789 (95% CI: 0.770–0.808), surpassing the remaining algorithms. The other models also exhibited good predictive power but ranked lower in descending order of performance: ANN (AUC = 0.767, 95% CI: 0.748–0.787), SVM (AUC = 0.753, 95% CI: 0.733–0.772), and logistic regression (AUC = 0.752, 95% CI: 0.741–0.762). In test set, these models also demonstrated robust generalizability. The XGBoost model achieves the highest performance, with an AUC of 0.769 (95% CI: 0.752–0.784).
 |
Figure 3 ROC curves for the machine learning models. (A) ROC curves for the machine learning models in the training set; (B) ROC curves for the machine learning models in the test set. Abbreviations: XGBoost, extreme gradient boosting; LightGBM, light gradient boosting machine; SVM, support vector machine; ANN, artificial neural network; APACHE II, Acute Physiology and Chronic Health Evaluation II score; SOFA, Sequential Organ Failure Assessment score; ROC, receiver operating characteristic; AUC, area under the curve. |
The calibration curves for all seven models showed deviation at certain points, which highlighting the importance of selecting the most appropriate model based on the specific clinical scenario (Figure S1). In terms of clinical applicability, five of the seven models, excluding decision tree and random forest models, showed robust net benefit across a wide range of threshold probabilities (Figure S2). After comprehensively considering the AUC values, calibration, and net benefit of each model, ANN was selected as the optimal model for predicting early mortality in septic patients. ANN model showed lowest Brier Score in training set and ICI in test set (Table S4). Table S4 summarized the net benefit of each model in both the training and test sets across the clinically relevant threshold range (10–30%). The results demonstrated that ANN consistently performs well compared to other models, particularly in terms of stability and generalizability (Table S5). The calibration curve and DCA for the ANN model in training set and test set were shown in Figure S3.
The findings from the multicenter validation study provide a more robust assessment of the predictive performance of the ANN model, while also highlighting inherent heterogeneity across different datasets. The predictive performance of ANN model underwent final validation across datasets from each center. In most studies, the predictive efficacy on multicenter data is generally observed to be lower compared to the internal validation set. However, in the present study, the AUC demonstrated significant enhancement in each center: Center_1, AUC 0.839, 95% CI: 0.826–0.853; Center_2, AUC 0.840, 95% CI: 0.818–0.862; Center_3, AUC 0.787, 95% CI: 0.773–0.800; Center_4, AUC 0.838, 95% CI: 0.817–0.860 (Figure S4).
Interpretability Analysis
Figure 4A presented a swarm plot delineating the variable distribution in the ANN model. The x-axis represented SHAP values, while the y-axis displayed features ranked by their aggregate SHAP value contribution. Each data point corresponds to an individual observation, with its x-axis position indicating the SHAP value for that particular instance and feature. As demonstrated in the figure, GCS emerged as the most significant predictive variable, followed sequentially by blood chloride, albumin, lymphocyte percentage, and PT. Consequently, GCS exerted a more substantial influence on 7-day mortality prediction compared to other variables in the context of sepsis. Figure 4B illustrates a waterfall plot detailing the predictive process for an individual case. The E[f(X)] = 0.085 presented at the apex of the chart represents the baseline expectation value; The f(x) = 0.455 displayed at the base represents the output prediction of the patient. Each horizontal bar represents a specific feature’s standardized contribution to the predictive shift from the baseline to the final value. Positive contributions are shown in pink, while negative contributions are depicted in blue. In this particular case, the primary features driving the prediction were PT, GCS, TBIL and AST.
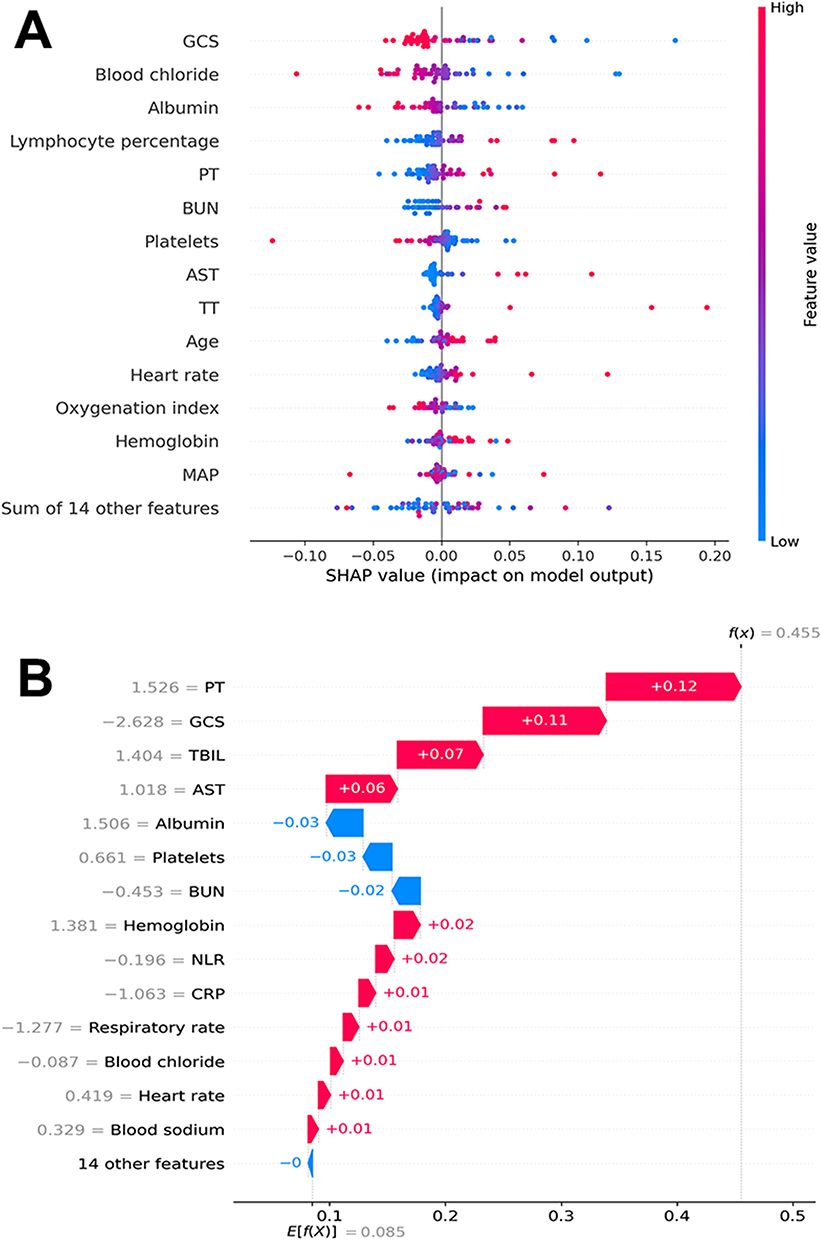 |
Figure 4 Visually interpret ANN model using SHAP. (A) SHAP swarm plot: Red indicates higher feature values; Blue indicates lower feature values; SHAP value represents the contribution of each feature to the model’s prediction. Positive values indicate that an increase in the feature value leads to an increase in the model’s output, while negative values indicate the opposite (B) SHAP waterfall plot: Red indicates a positive impact on the model’s output; Blue indicates a negative impact on the model’s output; E[f(X)] = 0.085 represents the base value, which is the average model prediction without considering any feature information; f(x) = 0.455 represents the final prediction value after considering all feature contributions. Abbreviations: ANN, artificial neural network; GCS, the Glasgow Coma Scale; PT, prothrombin time; BUN, blood urea nitrogen; AST, aspartate aminotransferase; TT, thrombin time; MAP, mean arterial pressure. |
Discussion
This study aimed to develop an interpretable machine learning model utilizing readily available patient history data upon admission and initial laboratory test results to predict early 7-day mortality in sepsis patients, thereby enabling timely clinical interventions. The research was based on multicenter data collected from tertiary teaching hospitals in major cities across western, central, and eastern China. A comprehensive comparison of seven distinct machine learning models was conducted, with the artificial neural network (ANN) ultimately selected as the optimal model. The findings revealed that both random forest and LightGBM models achieved the highest performance, each with an AUC value of 0.790, closely followed by XGBoost with an AUC of 0.789. Although the ANN model exhibited a slightly lower AUC of 0.767, it was selected as the optimal model due to its superior clinical applicability, more robust performance in calibration curve analysis, and significant outperformance over the APACHE II and SOFA scores (AUC of 0.710 and 0.718, respectively), those are commonly used in critically ill patients. In the interpretability analysis, the study employed the SHAP method to elucidate the model, identifying key clinical features that influence early mortality. These features included the GCS, blood chloride, and albumin, among others. These findings provide clinicians with valuable insights, aiding in the identification of high-risk patients and the formulation of personalized treatment strategies.
Identifying the risk of early mortality in septic patients remains challenging, primarily because of the disease’s severe nature, clinical complexity, and consistently high mortality rates. Additionally, early diagnosis of sepsis proves difficult as it manifests with clinical signs (eg, alterations in vital signs), symptoms (eg, elevated body temperature), and molecular changes (eg, dysregulation of immune response) that are common to many other conditions. Therefore, when sepsis is finally diagnosed, the optimal treatment window has often already been missed.15 Both the SOFA score and the APACHE II score are extensively employed in clinical settings to predict the prognosis of patients with sepsis. However, the APACHE II score is calculated based on physiological and laboratory parameters collected within the first 24 hours of hospital admission, which significantly restricts its applicability in early-stage assessments. Conversely, the SOFA score, while effective in evaluating organ dysfunction, does not sufficiently incorporate the inflammatory response and immune dysregulation inherent to sepsis pathogenesis. This oversight may undermine its predictive accuracy for mortality risk.16,17 ML has demonstrated significant potential in predicting mortality among sepsis patients, emerging as a focal point in recent medical research. Yao et al developed an ML-based model for predicting in-hospital mortality in postoperative sepsis patients, which exhibited high accuracy in distinguishing between survivors and non-survivors.9 Wang et al utilized the MIMIC-IV database to construct an XGBoost model, which also showed excellent performance in predicting sepsis mortality (AUROC: 0.873).18 Kong et al further demonstrated that ML models outperformed traditional scoring systems in predicting ICU sepsis mortality, underscoring their clinical utility.19 Unlike previous studies predominantly relying on public databases such as MIMIC, our study utilized real-world data from tertiary hospitals across diverse regions in China, representing the unique epidemiological and clinical characteristics of sepsis patients in this population. Our results demonstrate the significant value of machine learning in predicting early mortality among sepsis patients. The primary strength of our ANN model lies in its ability to provide clinicians with a predictive tool for assessing a patient’s risk of mortality within the first 7 days after admission, particularly during the early and critical stages of disease progression or in primary care settings where clinical experience may be limited. This capability enables timely intervention and improved patient management. ANN is particularly well-suited for this task due to its ability to model complex, non-linear relationships in high-dimensional data, which is often characteristic of clinical datasets. The ANN model developed in this study has significant potential for integration into daily clinical practice. Previous studies have demonstrated the effectiveness of ANN models in various clinical scenarios, such as the early warning of respiratory pathogen outbreaks and the early detection of cardiac arrest in emergency departments.20,21 The ANN model demonstrated remarkable stability and generalization capabilities, as evidenced by its performance across multiple validation centers. On the training set and test set, the model achieved AUC values of 0.767 (95% CI: 0.748–0.786) and 0.757 (95% CI: 0.740–0.773), respectively. In most studies, the predictive effect on multicenter data is slightly inferior to that on the training set and validation set. While in this study, the AUC showed significant improvement on each center (ranging from 0.787 to 0.840). These differences may be attributed to variations in population characteristics, laboratory standards, or treatment protocols. Despite the observed differences, the model demonstrated robust performance across all centers, indicating consistent and excellent predictive performance across diverse geographical regions in China. However, while multicenter data validation underscores the model’s stability, it also highlights several challenges inherent to building robust ML models. Key issues included an imbalance in the proportion of positive outcomes among septic patients, significant variability in sample sizes, and a high prevalence of missing values. To address these challenges and ensure the model’s robustness, extensive data cleaning procedures were implemented. In this study, we initially considered lactate as a potential predictor due to its clinical relevance in sepsis. However, due to its high missing rate (51.72%), we decided to exclude this variable from the final model to avoid introducing significant bias through imputation. For biomarkers with moderate missingness rates (eg, procalcitonin, CRP), we used the MissForest algorithm for imputation. While this method is widely used and has been shown to perform well in similar contexts, we recognize that imputation introduces some uncertainty into the model. The high missingness rates for certain biomarkers may reflect real-world clinical practice, where not all tests are routinely performed for every patient. These findings not only validate the ANN model’s reliability but also emphasize its potential for broad applicability in heterogeneous clinical settings. The model’s ability to maintain high predictive accuracy across diverse datasets underscores its utility as a valuable tool for risk stratification and decision support in real-world clinical practice, particularly in resource-constrained environments.
This study has several limitations. First, this study is based on retrospective data collected from multiple hospitals, which may introduce selection bias and limit the generalizability of the findings. Although efforts were made to standardize data collection across sites, variations in clinical practices and documentation could have influenced the results. Future prospective studies are needed to validate these findings. Second, even though we collect the source of infection, the study did not extensively analyze the types of pathogens responsible for the infections, which could influence the severity and outcomes of sepsis. Variations in pathogen virulence, antibiotic resistance patterns, and treatment responses were not accounted for, potentially affecting the interpretation of the results. Third, the study was conducted in hospitals located in specific regions of China, which may limit the external validity of the findings to other geographic or healthcare settings. The patient demographics, healthcare practices, and sepsis management protocols in these regions may differ from those in other countries or healthcare systems. Multicenter international studies are warranted to confirm the applicability of these results globally. Fourth, the lack of stratification by sepsis severity and timing from symptom onset could influence the predictive performance of the model. These factors are critical determinants of patient outcomes and may affect the generalizability of our findings. Future studies should incorporate these variables to enhance the robustness and applicability of the predictive model.
Conclusion
We developed a machine learning model to predict the risk of early 7-day mortality in sepsis patients based on routine clinical data obtained immediately after diagnosis and validated its potential as a clinically reliable tool. ANN model was selected as the optimal model due to its superior performance and its ability to generalize well across diverse patient populations. SHAP enhances the interpretability of the model by providing a quantitative measure of the contribution of each clinical feature to the prediction outcome. This transparency enables clinicians to better understand the key factors influencing mortality. By identifying high risk patients early and elucidating the underlying clinical drivers, SHAP facilitates the integration of the model into clinical workflows, supporting timely, targeted interventions to improve patient outcomes. Future research should prioritize the inclusion of lactate, incorporate stratification by sepsis severity, and apply rigorous statistical corrections to further enhance the model’s clinical utility.
Abbreviations
ACS, acute coronary syndrome; HOT, home oxygen therapy; MAP, mean arterial pressure; WBC, white blood cell; CRP, C-reactive protein; BUN, blood urea nitrogen; ALT, alanine aminotransferase; AST, aspartate aminotransferase; TBIL, total bilirubin; DBIL, direct bilirubin; PT, prothrombin time; APTT, activated partial thromboplastin time; TT, Thrombin time; INR, international normalized ratio; GCS, Glasgow Coma Scale; CALLY, CRP-albumin-lymphocyte ratio; NLR, neutrophil-to-lymphocyte ratio; CAR, CRP-to-albumin ratio; PLR, platelet-to-lymphocyte ratio; PAR, platelet-to-albumin ratio; NAR, neutrophil-to-albumin ratio; XGBoost, extreme gradient boosting; LightGBM, light gradient boosting machine; SVM, support vector machine; ANN, artificial neural network; APACHE II, Acute Physiology and Chronic Health Evaluation II score; SOFA, Sequential Organ Failure Assessment score; ROC, receiver operating characteristic; AUC, area under the curve; DCA, Decision Curve Analysis; SHAP, SHapley Additive exPlanations.
Data Sharing Statement
Raw data supporting the obtained results are available at the corresponding author Shu Wang.
Ethics Approval and Consent to Participate
The study protocol was approved by the respective ethics boards of each participating hospital (Daping Hospital, 2024-384; Central Hospital of Wuhan, WHZXKYL2023-097-02; Chongqing University Central Hospital, 2025-24; and Ruijin Hospital, 2025-138). The requirement for informed consent was waived due to the retrospective and non-interventional nature of the study. Data analysis adhered to the principles of the 1964 Declaration of Helsinki.
Acknowledgments
We thank all the authors for their meticulous work. The authors wish to thank Night for Sepsis Group for their contributions to the data collection and curation. The Night for Sepsis Group is a collaborative sepsis research group jointly established by five major tertiary academic hospitals in China. The group comprises Wenwu Sun and Yang Li from the Daping Hospital, Army Medical University; Shu Wang from the Chongqing University Central Hospital, Chongqing Emergency Medical Center; Lijuan Zhang from the Central Hospital of Wuhan, Tongji Medical College, Huazhong University of Science and Technology; Bing Zhao and Enqiang Mao from the Ruijin Hospital, Shanghai Jiao Tong University School of Medicine.
Author Contributions
WS, LZ, MD and BZ contributed equally and share first authorship. Concept and design: SW, YL and ZC. Acquisition, analysis, or interpretation of data: Night for Sepsis Group and DM. Drafting of the manuscript: WS and SW. All authors made a significant contribution to the work reported, whether that is in the conception, study design, execution, acquisition of data, analysis and interpretation, or in all these areas; took part in drafting, revising or critically reviewing the article; gave final approval of the version to be published; have agreed on the journal to which the article has been submitted; and agree to be accountable for all aspects of the work.
Funding
This research is supported by the Joint Project of Chongqing Health Commission and Science and Technology Bureau, grant number 2025MSXM122.
Disclosure
The authors report no conflicts of interest in this work.
References
1. Singer M, Deutschman CS, Seymour CW, et al. The third international consensus definitions for sepsis and septic shock (Sepsis-3). JAMA. 2016;315:801–810. doi:10.1001/jama.2016.0287
2. Rudd KE, Johnson SC, Agesa KM, et al. Global, regional, and national sepsis incidence and mortality, 1990–2017: analysis for the global burden of disease study. Lancet. 2020;395:200–211. doi:10.1016/S0140-6736(19)32989-7
3. Zhou J, Tian H, Du X, et al. Population-based epidemiology of sepsis in a subdistrict of Beijing. Crit Care Med. 2017;45:1168–1176. doi:10.1097/CCM.0000000000002414
4. Lagu T, Rothberg MB, Shieh MS, Pekow PS, Steingrub JS, Lindenauer PK. Hospitalizations, costs, and outcomes of severe sepsis in the United States 2003 to 2007. Crit Care Med. 2012;40:754–761. doi:10.1097/CCM.0b013e318232db65
5. Pepper DJ, Sun J, Cui X, Welsh J, Natanson C, Eichacker PQ. Antibiotic- and fluid-focused bundles potentially improve sepsis management, but high-quality evidence is lacking for the specificity required in the centers for medicare and medicaid service’s sepsis bundle (SEP-1). Crit Care Med. 2019;47:1290–1300. doi:10.1097/CCM.0000000000003892
6. Pierrakos C, Vincent JL. Sepsis biomarkers: a review. Crit Care. 2010;14:R15. doi:10.1186/cc8872
7. Liu Z, Meng Z, Li Y, et al. Prognostic accuracy of the serum lactate level, the SOFA score and the qSOFA score for mortality among adults with Sepsis. Scand J Trauma Resusc Emerg Med. 2019;27:51. doi:10.1186/s13049-019-0609-3
8. Hu H, Jiang JY, Yao N. Comparison of different versions of the quick sequential organ failure assessment for predicting in-hospital mortality of sepsis patients: a retrospective observational study. World J Emerg Med. 2022;13:114–119. doi:10.5847/wjem.j.1920-8642.2022.027
9. Yao RQ, Jin X, Wang GW, et al. A machine learning-based prediction of hospital mortality in patients with postoperative sepsis. Front Med. 2020;7:445. doi:10.3389/fmed.2020.00445
10. Wang S, Liu X, Yuan S, Bian Y, Wu H, Ye Q. Artificial intelligence based multispecialty mortality prediction models for septic shock in a multicenter retrospective study. NPJ Digit Med. 2025;8:228. doi:10.1038/s41746-025-01643-w
11. Park SW, Yeo NY, Kang S, et al. Early prediction of mortality for septic patients visiting emergency room based on explainable machine learning: a real-world multicenter study. J Korean Med Sci. 2024;39:e53. doi:10.3346/jkms.2024.39.e53
12. Lundberg SM, Erion G, Chen H, et al. From local explanations to global understanding with explainable AI for trees. Nat Mach Intell. 2020;2:56–67. doi:10.1038/s42256-019-0138-9
13. Rhodes A, Evans LE, Alhazzani W, et al. Surviving sepsis campaign: international guidelines for management of sepsis and septic shock: 2016. Crit Care Med. 2017;45:486–552. doi:10.1097/CCM.0000000000002255
14. Uluc K, Akkutuk Ongel E, Colakoglu SM, et al. Effects of HALP score, C-reactive protein/albumin ratio, and platelet/lymphocyte ratio on predicting mortality in geriatric patients in the respiratory intensive care unit. Clin Interv Aging. 2025;20:815–823. doi:10.2147/CIA.S482214
15. Ramar K, Gajic O. Early recognition and treatment of severe sepsis. Am J Respir Crit Care Med. 2013;188:7–8. doi:10.1164/rccm.201304-0801ED
16. Hu T, Lv H, Jiang Y. The association between four scoring systems and 30-day mortality among intensive care patients with sepsis: a cohort study. Sci Rep. 2021;11:11214. doi:10.1038/s41598-021-90806-2
17. Tong-Minh K, Welten I, Endeman H, et al. Predicting mortality in adult patients with sepsis in the emergency department by using combinations of biomarkers and clinical scoring systems: a systematic review. BMC Emerg Med. 2021;21:70. doi:10.1186/s12873-021-00461-z
18. Wang Y, Gao Z, Zhang Y, Lu Z, Sun F. Early sepsis mortality prediction model based on interpretable machine learning approach: development and validation study. Intern Emerg Med. 2025;20:909–918. doi:10.1007/s11739-024-03732-2
19. Kong G, Lin K, Hu Y. Using machine learning methods to predict in-hospital mortality of sepsis patients in the ICU. BMC Med Inform Decis Mak. 2020;20:251. doi:10.1186/s12911-020-01271-2
20. Jang DH, Kim J, Jo YH, et al. Developing neural network models for early detection of cardiac arrest in emergency department. Am J Emerg Med. 2020;38:43–49. doi:10.1016/j.ajem.2019.04.006
21. Nia ZM, Seyyed-Kalantari L, Goitom M, et al. Leveraging deep-learning and unconventional data for real-time surveillance, forecasting, and early warning of respiratory pathogens outbreak. Artif Intell Med. 2025;161:103076. doi:10.1016/j.artmed.2025.103076
 © 2025 The Author(s). This work is published and licensed by Dove Medical Press Limited. The
full terms of this license are available at https://www.dovepress.com/terms
and incorporate the Creative Commons Attribution
- Non Commercial (unported, 4.0) License.
By accessing the work you hereby accept the Terms. Non-commercial uses of the work are permitted
without any further permission from Dove Medical Press Limited, provided the work is properly
attributed. For permission for commercial use of this work, please see paragraphs 4.2 and 5 of our Terms.
© 2025 The Author(s). This work is published and licensed by Dove Medical Press Limited. The
full terms of this license are available at https://www.dovepress.com/terms
and incorporate the Creative Commons Attribution
- Non Commercial (unported, 4.0) License.
By accessing the work you hereby accept the Terms. Non-commercial uses of the work are permitted
without any further permission from Dove Medical Press Limited, provided the work is properly
attributed. For permission for commercial use of this work, please see paragraphs 4.2 and 5 of our Terms.
Recommended articles
An Explainable Machine Learning Model to Predict Acute Kidney Injury After Cardiac Surgery: A Retrospective Cohort Study
Gao Y, Wang C, Dong W, Li B, Wang J, Li J, Tian Y, Liu J, Wang Y
Clinical Epidemiology 2023, 15:1145-1157
Published Date: 4 December 2023
Machine Learning Predictive Model for Septic Shock in Acute Pancreatitis with Sepsis
Xia Y, Long H, Lai Q, Zhou Y
Journal of Inflammation Research 2024, 17:1443-1452
Published Date: 5 March 2024
Identification and Analysis of PANoptosis-Related Genes in Sepsis-Induced Lung Injury by Bioinformatics and Experimental Verification
Yang Z, Kao X, Huang N, Yuan K, Chen J, He M
Journal of Inflammation Research 2024, 17:1941-1956
Published Date: 28 March 2024
Acute Kidney Injury Prediction Model Using Cystatin-C, Beta-2 Microglobulin, and Neutrophil Gelatinase-Associated Lipocalin Biomarker in Sepsis Patients
Susianti H, Asmoro AA, Sujarwoto, Jaya W, Sutanto H, Kusdijanto AY, Kuwoyo KP, Hananto K, Khrisna MB
International Journal of Nephrology and Renovascular Disease 2024, 17:105-112
Published Date: 28 March 2024
Cuproptosis-Related Biomarkers and Characterization of Immune Infiltration in Sepsis
Wang Y, Qiu X, Liu J, Liu X, Pan J, Cai J, Liu X, Qu S
Journal of Inflammation Research 2024, 17:2459-2478
Published Date: 22 April 2024