Back to Journals » Nature and Science of Sleep » Volume 14
Interactive Effect of Combined Intermittent and Sustained Hypoxia and High-Fat Diet on the Colonic Mucosal Microbiome and Host Gene Expression in Mice
Authors Mashaqi S, Laubitz D, Morales EJD, De Armond R, Alameddin H, Ghishan FK, Kiela PR, Parthasarathy S
Received 2 May 2022
Accepted for publication 5 September 2022
Published 9 September 2022 Volume 2022:14 Pages 1623—1639
DOI https://doi.org/10.2147/NSS.S370957
Checked for plagiarism Yes
Review by Single anonymous peer review
Peer reviewer comments 3
Editor who approved publication: Prof. Dr. Ahmed BaHammam
Saif Mashaqi,1,2 Daniel Laubitz,3 Efreim Joseph D Morales,3 Richard De Armond,1,2 Hanan Alameddin,4 Fayez K Ghishan,3 Pawel R Kiela,3,5 Sairam Parthasarathy1,2
1Department of Pulmonary, Allergy, Critical Care, and Sleep, University of Arizona College of Medicine, Tucson, AZ, USA; 2University of Arizona Health Sciences Center for Sleep & Circadian Sciences, University of Arizona College of Medicine, Tucson, AZ, USA; 3Department of Pediatrics, Steele Children’s Research Center, University of Arizona College of Medicine, Tucson, AZ, USA; 4The University of Arizona College of Pharmacy, Tucson, AZ, USA; 5Department of Immunobiology, University of Arizona College of Medicine, Tucson, AZ, USA
Correspondence: Saif Mashaqi, Department of Pulmonary, Allergy, Critical Care, and Sleep Medicine, The University of Arizona, College of Medicine Tucson, 1625 N Campbell Ave, Tucson, AZ, 85719, USA, Tel +1 520-626-8309, Fax +1 520-626-1876, Email [email protected]
Purpose: Gut dysbiosis can cause cardiometabolic disease. Gut dysbiosis can be independently caused by high-fat diet (HFD) and intermittent hypoxia (IH; characterizing obstructive sleep apnea), but the interactive effect of combined intermittent and sustained hypoxia (IH+SH) (characterizing obesity hypoventilation syndrome) and HFD on gut dysbiosis is unclear. We aimed to investigate the interactive effect of a combination of IH and SH and HFD on proximal colonic microbiota and colonic gene expression pattern.
Methods: Male mice (n=16) were randomly received four different combinations of diet (normal versus HFD) and oxygen conditions (normoxia versus IH+SH) for 4 weeks. Bacterial DNA and mucosal epithelial cell RNA from proximal colon were collected for analysis of adherent microbiome and host’s gene expression analysis.
Results: HFD during IH+SH (22.6 ± 5.73; SD) led to greater Firmicutes: Bacteroidetes ratio than HFD during normoxia (5.89 ± 1.19; p=0.029). HFD significantly decreased microbial diversity as compared to normal diet, but the addition of IH+SH to HFD mildly reversed such effects. When compared to HFD during normoxia, HFD with combination of IH+SH resulted in changes to host mucosal gene expression for apical junctional complexes and adhesion molecules. Specifically, when compared to HFD during normoxia, HFD during IH+SH led to upregulation of Claudin 2 and Syk (tight junction dysfunction and increased mucosal permeability), while the barrier promoting claudin 4 was downregulated.
Conclusion: HFD during combined IH and SH causes greater gut dysbiosis and potentially adverse changes in colonic epithelial transcriptome than HFD during normoxia. The latter changes are suggestive of impaired gut barrier function.
Keywords: hypoxia, microbiome, obesity, diet, gene expression, sleep apnea
Introduction
Obesity hypoventilation syndrome (OHS) is an extreme phenotype of obstructive sleep apnea (OSA) and is characterized by morbid obesity, daytime hypoventilation, and sleep-disordered breathing. Sleep-disordered breathing in OHS is further characterized by both sleep-related hypoventilation (causing sustained hypoxia [SH]) in addition to repetitive closure of the upper airway that characterizes OSA, which, in turn, causes intermittent hypoxia [IH]).1 OHS affects nearly one million individuals in the US and is associated with a greater risk for cardiometabolic disease and early mortality when compared to individuals with only morbid obesity or OSA.2–5
IH, featuring OSA has been shown to selectively activate NF-kB-dependent transcription and downstream proinflammatory pathways, whereas SH triggers Hypoxia Inducible Factor (HIF-1α) and downstream pathways.6 However, severe OSA can cause activation of HIF-1α. A possible explanation is that patients with severe OSA may be exposed to sufficient cumulative periods of sustained hypoxia during sleep to activate (HIF-1α) via Ca2+/calmodulin kinase-dependent pathway.7 Such a variable response to IH versus SH may be responsible for the more severe pathogenesis of inflammation and cardiometabolic dysfunction observed in OHS when compared to that in OSA. Besides the direct effects of IH and SH on cellular pathways, IH seen in OSA can lead to gut dysbiosis and alteration in the gut barrier function.8 Both gut dysbiosis and gut barrier dysfunction caused by a shift in the microbiota profile can lead to systemic inflammation and consequent cardiometabolic derangements.9–13 We know that the spatial oxygen gradient (PO2) between the epithelial lining and the gut lumen determines the composition of gut microbiota. When host-tissue oxygen levels are reduced in disease states, such as IH of OSA, there is a further reduction of luminal oxygen levels that causes a shift in the gut microbiota composition.8 The effect of a combination of SH and IH on the gut microbiota is less clear.
A major factor influencing the gut microbiota is dietary fat content. High-fat diet (HFD) was causally related to gut dysbiosis and manifested by an increase in Firmicutes:Bacteroidetes (F:B) ratio. Furthermore, the interactive effects of IH and high-fat diet on the gut microbiome and cardiovascular morbidity (eg, hypertension) has been previously studied.14–18 In a rat model, high-fat diet in combination with IH led to gut dysbiosis and hypertension, whereas IH with a normal diet failed to cause hypertension.14 Fecal transplantation from hypertensive rats with gut dysbiosis to normoxic and normotensive rats led to hypertension when exposed to IH. This study demonstrated that there is a causal relationship between gut dysbiosis and cardiometabolic derangement (hypertension) and that there may be an interactive effect between IH and high-fat diet.14,19 Understanding that there are significant differences in the proinflammatory versus adaptive response of IH versus SH, respectively, we set out to investigate the interactive effect of combined intermittent and sustained hypoxia and high-fat diet on proximal colonic microbiota and colonic gene expression pattern. To address this aim, we performed a pilot study of mice subjected to a 2×2 factorial design of a combination of oxygen derangements ([IH+SH] or normoxia) and dietary conditions (high-fat diet or normal fat diet). We hypothesized that the combination of intermittent and sustained hypoxia (IH+SH) and high-fat diet will cause greater degree of gut dysbiosis than high-fat diet alone. A secondary hypothesis was that the combination of (IH+SH) and high -at diet will have greater influence on colonic epithelial transcriptome than the effect of high fat alone.
Materials and Methods
Protocol
All mice used in this work were kept in the University of Arizona Animal Care, Specific Pathogen Free facility, and handled in accordance with the university’s guidelines and approved by the University of Arizona Institutional Animal Care and Use Committee (IACUC) (Gillian Paine, Protocol # 13–431 and 07–029). All mice had ad libitum access to food, water, and 12/12 h day/night light cycle (light cycle was 7:00 am to 7:00 pm and dark cycle was 7:00 pm to 7:00 am). The study was carried out with 16, three-week old, male C57BL/6 mice that were originally obtained from The Jackson Laboratory (Sacramento, CA). All mice were housed in same area to standardize the sound environment and minimize outside variations. Mice were randomly assigned to four experimental groups for 4 weeks – different combinations of diet (normal diet [ND] or high-fat diet [HFD]) and oxygen treatments (normoxia [NM] and intermittent hypoxia+sustained hypoxia [IH+SH]). Experimental group designations were as follows: ND and NM, HFD and NM, ND and IH+SH, and HFD and IH+SH. The high-fat chow was comprised of 60% kcal from fat, 21% kcal from carbohydrates and 19% kcal from protein. Normal chow was comprised with 18% kcal from fat, 59% kcal from carbohydrates and 23% kcal from protein. During their sleep cycle (from 7:00 am to 7:00 pm), mice in the hypoxia groups were exposed to a combination of IH and SH. IH consisted of 10 cycles per hour for 3 hours (ranging from 20.95% FiO2 to 9% FiO2), followed by 6 hours of persistent hypoxia (9% FiO2), then another 3 hours of intermittent hypoxia.
The rationale of our protocol and the sequential manner we followed (IH-SH-IH) reflects the pathophysiology of OHS that is characterized by sustained hypoxemia (SH) of alveolar hypoventilation as well as the intermitted hypoxemia (IH) of the coexistent obstructive sleep apnea (OSA) events in contrast to the intermittent hypoxemia without sustained hypoxemia of simple OSA.2,20–22 Observations by us and other investigators of the hypoxia signature in humans with OHS revealed IH during the early portion of the night marked by events of OSA followed by sustained hypoxia (SH) of slow wave sleep and then intermittent hypoxia (IH) of REM sleep.22,23 Our rationale for such degree of hypoxemia is in keeping with reports of degree of hypoxemia in patients with OHS.24 Moreover, in various animal studies, Farre et al found that there was indeed a wide range of hypoxic stimulus observed in various studies that ranged from a FiO2 nadir of 4–15%.25 In our study, we chose to use the mid-point of such studies at 9%. Moreover, the most common paradigms of intermittent hypoxia when applied to mice used nadir values in the range 50–70%.26–30 Our paradigm was again at the midpoint of this range that has been used by other investigators and goes in favor of the thinking that such low nadirs (50–70%) in mice mimic the hypoxemic events in patients since they actually correspond to PaO2 values similar to those in patients with OSA.25 The oxygen concentration control was maintained by a computer-regulated flow of gas circulated through a sealed commercially designed chamber (OxyCycler A44XO, BioSpherix, Parish, NY). During the 12-hour dark cycle, mice in the hypoxia groups were exposed to normoxia in the animal facility outside the chambers. Hypoxia exposure was continuously monitored and recorded via internal oxygen sensors built into the computer-regulated Oxycycler device and periodically cross-verified with external oxygen sensors (ISO-OXY-2, World Precision Instruments). A control NM group was exposed to a continuous flow of room air. Normoxia and hypoxia treatments were maintained for the duration of the study. Each mouse was weighed every 3 days. At the end of 4 weeks, after euthanasia, small sections of tissue from proximal colon were collected. The proximal segments of the colon were collected and were frozen at −80°C until analyzed.
Complete Blood Count
Blood collected from cardiac puncture at the time of euthanasia was submitted for complete blood count (CBC) to University of Arizona Animal Care Pathology Services Laboratory which uses the HEMAVET Multispecies Hematology Analyzer, a quantitative, automated multispecies hematology analyzer for in vitro diagnostic use.
DNA and RNA Extraction
Both DNA for adherent microbiota analysis and RNA for microarray gene expression analyses were purified from 25–30 mg of collected tissues using AllPrep DNA/RNA mini Kit (Qiagen). Tissue was homogenized in TissueLyser II (MoBio) disruptor at 30Hz for 10 min in a cold room. After the first round, the plate orientation was changed and another cycle of 10 min at 30Hz was performed. Lysis buffer for DNA/RNA extraction was supplemented with Reagent DX (Qiagen), to prevent foaming of samples during mechanical disruption. The lysis step was followed by the DNA and RNA extraction as described in the manufacturer’s protocol. The integrity of RNA was confirmed using Agilent Bioanalyzer 2100 (min. RIN=9.0) and concentration assessed with Nanodrop (Thermo Fisher).
Microbiome Analysis
The hypervariable V4 region of the 16S rRNA gene was amplified from each sample using 806R and 515F primers.31 Each PCR (final volume 40µ) contained 2x MyFi Mix (BioLine), 0.5µM V4-specific primers extended with Illumina adapter, sequencing primer binding sites and the reverse primer with a sample unique barcode. The cycling conditions were 95°C for 2 min, followed by 35 cycles of 95°C for 30 seconds, 50°C for 45 seconds, 74°C for 30 seconds, and then followed with a final extension at 72°C for 5 min. Amplicons were quantified using Quant-iT PicoGreen dsDNA Assay Kit according to the manufacturer’s protocol (Thermo Fisher Scientific). Pooled sequencing library was created by combining 240 ng of DNA from each sample. Pooled library was cleaned using UltraClean PCR Clean-Up Kit (MoBio). Then, the library was quantified against a standard curve using the qPCR-based KAPA Library Quantification Kit for Illumina platforms (KAPA). The library was diluted to a concentration of 4nM, denatured with 0.2N NaOH and further diluted to a concentration 7pM. Due to the limited sequence diversity among 16S rRNA amplicons, 5% of the PhiX control library (Illumina) made from phiX174 was added and the library was subjected to the paired-end sequencing using 2 x 151bp MiSeq Reagent Kit V2 (Illumina) using custom primers.31 Sequencing was performed on the Illumina MiSeq (SN M03190, with the MiSeq Control Software v 2.5.0.5). The reads were processed, and data analyzed as we described previously.32,33 Briefly, de-multiplexing was performed using idemp script (https://github.com/yhwu/idemp). Filtering, dereplication, sample inference, chimera identification, and merging of paired-end reads was done with a reference-free Divisive Amplicon Denoising Algorithm 2 (Dada2, version 1.18.0)34 package in RStudio (version 1.3.1093 with R version 4.0.3). The ASVs taxonomy was assigned using RDP classifier against SILVA database release 13235 (https://www.arb-silva.de/documentation/release-132/). The vegan package36 (version 2.5.7) was used as a tool for diversity analysis, ordination methods, for the analysis of dissimilarities, and statistical analysis. The obtained results were visualized with ggplot237 (2D plots, version 3.3.3) and plotly38 (3D plots, version 4.9.3) packages.
Microarray Analysis of Colonic Gene Expression Profile
Amplified and biotinylated sense-stranded DNA targets were generated from total RNA isolated from individual mice in each experimental group (n = 4 in each treatment group) using GeneChip® WT PLUS Reagent kit (Affymetrix) and hybridized to GeneChip® Mouse Gene 2.0 ST Arrays (Affymetrix). Gene expression analysis was performed using GeneSpring GX 14.9 software (Agilent Technologies, Santa Clara, CA). Data were processed using the RMA16 summarization algorithm and normalized against the mean of control samples (NM, ND). Gene ontology (GO) functional annotation analysis was performed either with GeneSpring or using the Database for Annotation, Visualization, and Integrated Discovery (DAVID) v6.8 online tool.39
Statistical Analysis
Complete blood count data were analyzed using one-way ANOVA followed by Fisher’s least significant difference (LSD) pairwise comparison test (Prism 9.1.2; GraphPad). Statistical analysis of gene expression statistical was performed using built-in tools, including normalized t-test or two-way ANOVA, in both cases with Benjamini–Hochberg multiple testing correction (GeneSpring GX, Agilent). Gene ontology (GO) functional annotation analysis was performed either with GeneSpring or using the Database for Annotation, Visualization, and Integrated Discovery (DAVID) v6.8 online tool (Nature Protocols 2009; 4(1):44 and Nucleic Acids Res. 2009;37(1):1).39,40 More detailed results of the analyses, including raw and normalized expression values, can be viewed at the National Center for Biotechnology Information Gene Expression Omnibus microarray depository web site (www.ncbi.nlm.nih.gov; GEO accession no. pending).
Results
Hematological Evidence of Exposure to Hypoxia
To verify that all mice in the hypoxia group experienced sufficient exposure to hypoxic conditions, we analyzed their blood collected at the time of euthanasia for characteristic physiological response using CBC. All parameters tested showed significant difference between groups (ANOVA, p<0.002; (Figure 1). In no case did HFD alone affect the CBC profile. Intermittent and sustained hypoxia, irrespective of diet, significantly elevated red blood count (RBC), hemoglobin concentration (Hb), hematocrit (HCT), mean corpuscular volume (MCV), mean corpuscular hemoglobin (MCH), and red cell distribution width (RDW). Interestingly, in mice fed HFD, hypoxia (IH + SH) further increased RBC, HCT, and RDW values, while it decreased MCH (Figure 1).
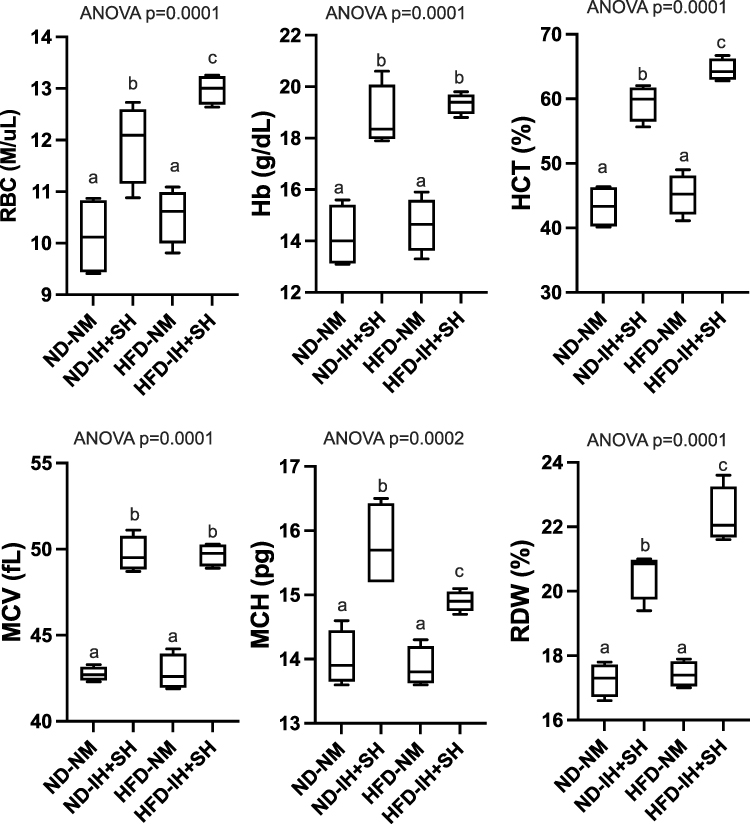 |
Figure 1 Complete blood count (CBC) demonstrates a physiological response to intermittent hypoxia. Red blood cell count (RBC), hemoglobin (Hb), hematocrit (Hct), mean corpuscular volume (MCV), mean corpuscular hemoglobin (MCH), and red cell distribution width (RDW) values in each group were analyzed with one-way ANOVA (p value indicated) followed by Fisher’s LSD test (different letter next to bar indicates a statistical difference in pairwise comparisons at p<0.05). Abbreviations: HFD, high-fat diet; ND, normal diet; IH+SH, intermittent and sustained hypoxia; NM, normoxia. |
Characterization of Colonic Mucosal Microbiota
We first conducted a permutational multivariate analysis of variance using ADONIS tool in vegan using 16S profiling data from the mucosal adherent microbiota in the proximal and distal segments of the colon. This tool is directly analogous to MANOVA (multivariate analysis of variance) and allows for identification of the main drivers of community differences in multifactorial ecological experiments. ADONIS test indicated that diet and oxygen status were the most significant variables, while segment did not contribute to the observed differences (Table 1). Thus, we focused subsequent microbiota and gene expression analyses on the proximal colon alone. Richness analysis indicated HFD significantly decreased microbial diversity as compared to mice on normal diet, irrespective of the oxygen status (Figure 2). IH+SH, however, reversed the effects of HFD to a small extent (Figure 2), suggesting that intermittent and sustained hypoxia modulated the impact of HFD on the mouse gut microbial diversity. The β-diversity analysis and ordination using non-metric multidimensional scaling (NMDS) showed that in ND mice, IH+SH had a minor influence on microbial composition (Figure 3), with only two unclassified genera from the Muribaculaceae family that passed DESeq2 analysis (corrected p<0.05, cutoff twofold; Supplementary Data-A). Genus-level analysis confirmed that diet was the most significant variable shaping mucosal colonic microbiota, with both HFD groups clustering closely together and separated from ND groups (Supplementary Data-B). However, in HFD-fed mice, IH+SH more considerably influenced the ordination of HFD_IH+SH group compared to HFD_NM, suggesting that intermittent and sustained hypoxia modulates the adherent mucosal microbiota in mice fed high-fat diet (Figure 3). In phylum-level taxonomic analysis, HFD induced an expansion of Firmicutes at the cost of Bacteroidetes and other phyla, and this phenomenon was further exacerbated by hypoxia in HFD_IH+SH group (Figure 4A). This was especially reflected in the Firmicutes:Bacteroidetes ratio which increased from 5.89 ± 1.19 in HFD-NM to 22.6 ± 5.73 in HFD-IH+SH (Mean ± SD; p=0.029; Figure 4B).
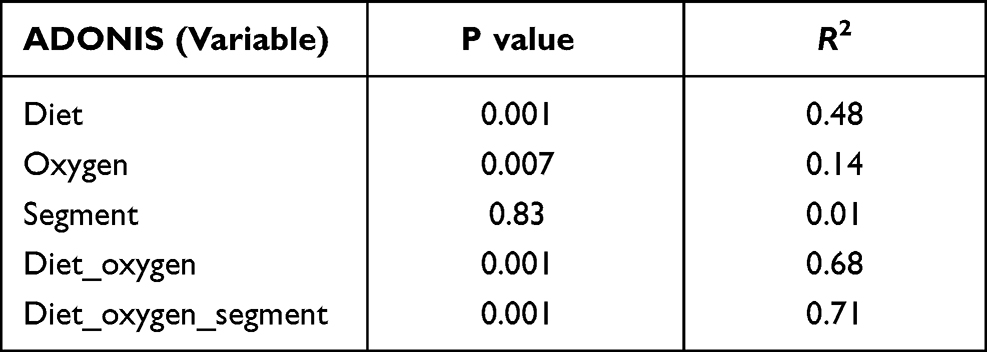 |
Table 1 Permutational Multivariate Analysis of Variance (ADONIS) of the Murine Mucosal Microbiota in the Proximal and Distal Segment of the Colon |
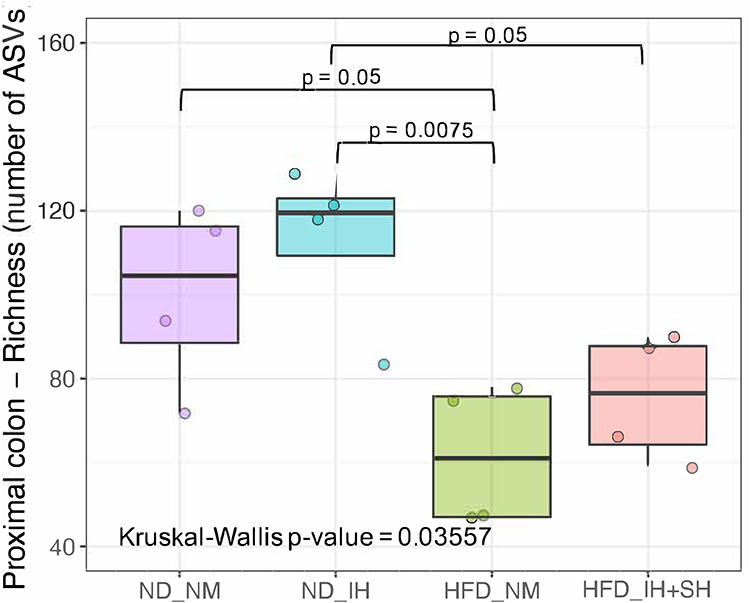 |
Figure 2 Richness (number of amplicon sequence variants; ASVs) in colonic mucosal microbiome is modulated by diet and the oxygen status. The lower and upper hinges represent the first and third quartiles, respectively. The middle line represents the median value. Kruskal–Wallis rank sum test followed by Dunn’s multiple comparison test were used for statistical comparisons (P value indicated). Abbreviations: HFD, high-fat diet; ND, normal diet; IH+SH, intermittent and sustained hypoxia; NM, normoxia. |
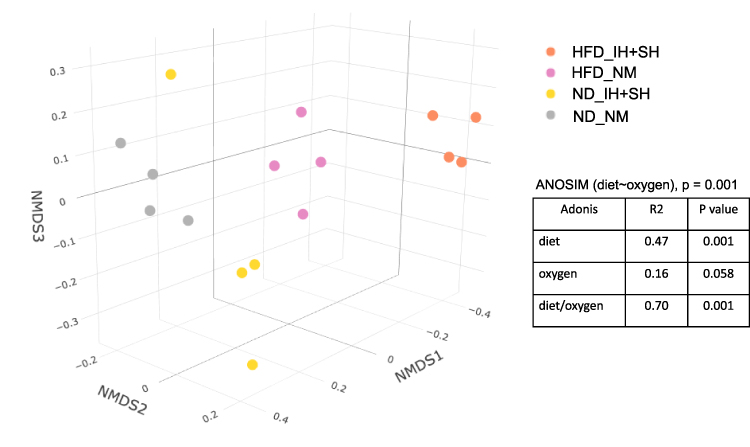 |
Figure 3 Bray–Curtis-based non-metric multidimensional (NMDS) scaling plot of dissimilarities between all four experimental groups. Analysis of similarities (ANOSIM) was used to test the differences between groups. ADONIS for beta diversity distances was used to determine the factor (diet or oxygen status) with the strongest impact on dissimilarities between groups. Abbreviations: HFD, high-fat diet; ND, normal diet; IH+SH, intermittent and sustained hypoxia; NM, normoxia. |
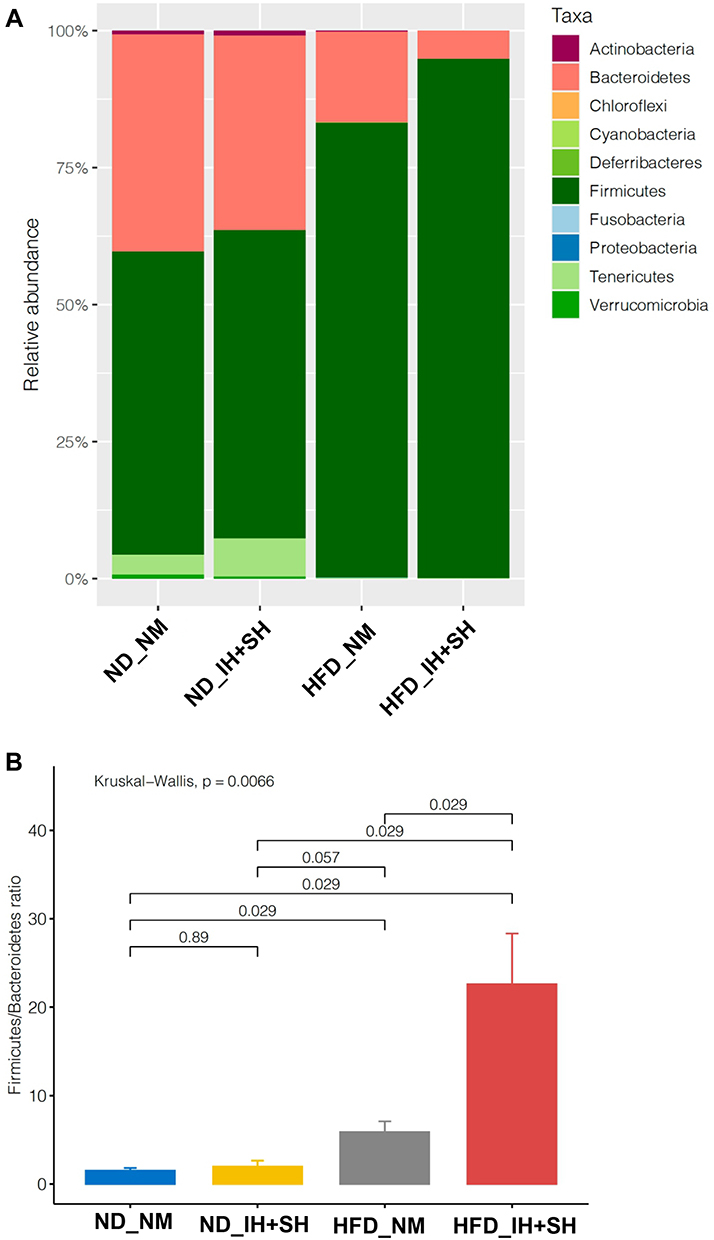 |
Figure 4 Phylum-level taxonomic analysis of the four experimental groups. (A) Bar graph depicting the effects of diet and combined intermittent and sustained hypoxia on the relative abundance of phyla in the colonic mucosa. (B) The effects of diet and combined intermittent and sustained hypoxia on Firmicutes:Bacteroidetes ratio in the colonic mucosa. Kruskal–Wallis rank sum test followed by Dunn’s multiple comparison test were used for statistical comparisons (P value indicated). Abbreviations: HFD, high-fat diet; ND, normal diet; IH+SH, intermittent and sustained hypoxia; NM, normoxia. |
Taxonomic analysis at the genus level confirmed the effects of high-fat diet and their modulation by intermittent and sustained hypoxia (Figure 5A). Stringent pairwise analysis with DESeq2 (corrected p<0.05, cutoff twofold) between ND_NM and HFD_NM (the effect of high-fat diet in normoxia) identified multiple ASVs with genera representing the families of Lachnospiraceae (A2, Acetifactor, Eisenbetgiella, Lachnospiraceae_NK4A136_group), Ruminococcaceae (Oscillibacter, Ruminiclostridium, Ruminococcaceae_UCG-009), Akkermansiaceae (Akkermansia), Rikenellaceae (Alistipes), Anaeroplasmataceae (Anaeroplasma), Streptococcaceae (Lactococcus), and Erisipelotrichaceae (Turicibacter) (Figure 5B). In high-fat diet-fed mice, intermittent and sustained hypoxia (HFD_IH+SH vs HFD_NM) significantly increased the relative abundance of four ASVs from Lachnospiraceae family representing two genera: A2 and Lachnospiraceae_NK4A136_group), as well as three unclassified ASVs from the Muribaculaceae family (Figure 5C). One ASV from this family was significantly decreased in the HFD_IH+SH group (Figure 5C). A detailed summary of microbial community changes between the experimental groups are provided in Supplementary Data-C.
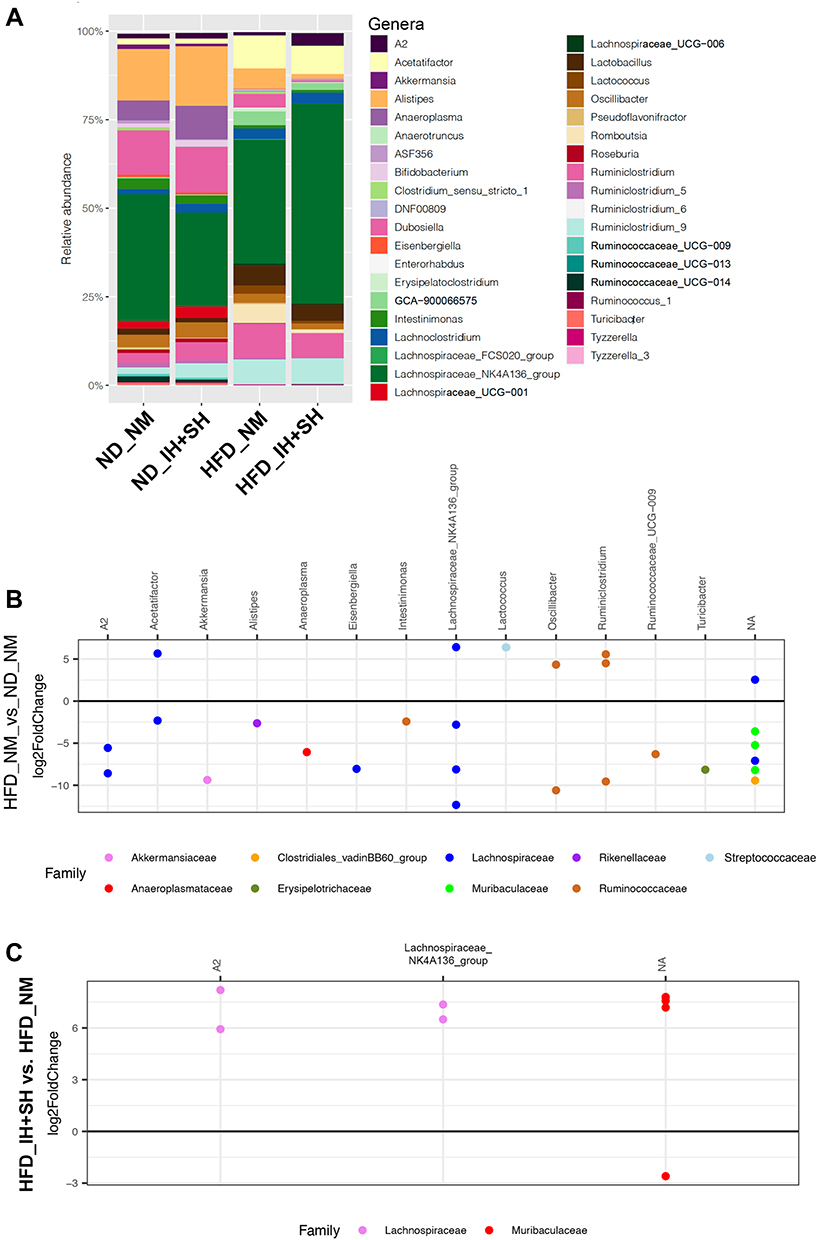 |
Figure 5 Genus-level taxonomic analysis of the four experimental groups. (A) Bar graph depicting the effects of diet and combined intermittent and sustained hypoxia on the relative abundance of specific genera in the colonic mucosa. Genera with relative abundance less than 0.1% were filtered out for figure clarity. (B) DESeq2 analysis (corrected p<0.05, cutoff twofold) of the effect of HFD in normoxic mice (HFD_NM vs ND_NM). Genus name indicated on top, and color indicates the respective family. NA=lack of classification of the ASV at the genus level. (C) Analogous: DESeq2 analysis of the modulating effects of intermittent and sustained hypoxia in mice fed HFD on mucosal microbiota. |
Transcriptional Response of the Host to IH, SH, and HFD
Two-way ANOVA was performed to investigate how each variable (diet, oxygen status, or combination of the two) contributed to most significant changes in gene expression. Similar to microbiota, diet was demonstrated to have the most impact with 1702 transcript cluster IDs (TIDs) significantly altered (corrected p<0.05) in contrast to the 39 TIDs associated with oxygen status (Figure 6) exclusively. Furthermore, only three TIDs are involved with the combined influence of diet and oxygen status (Figure 6).
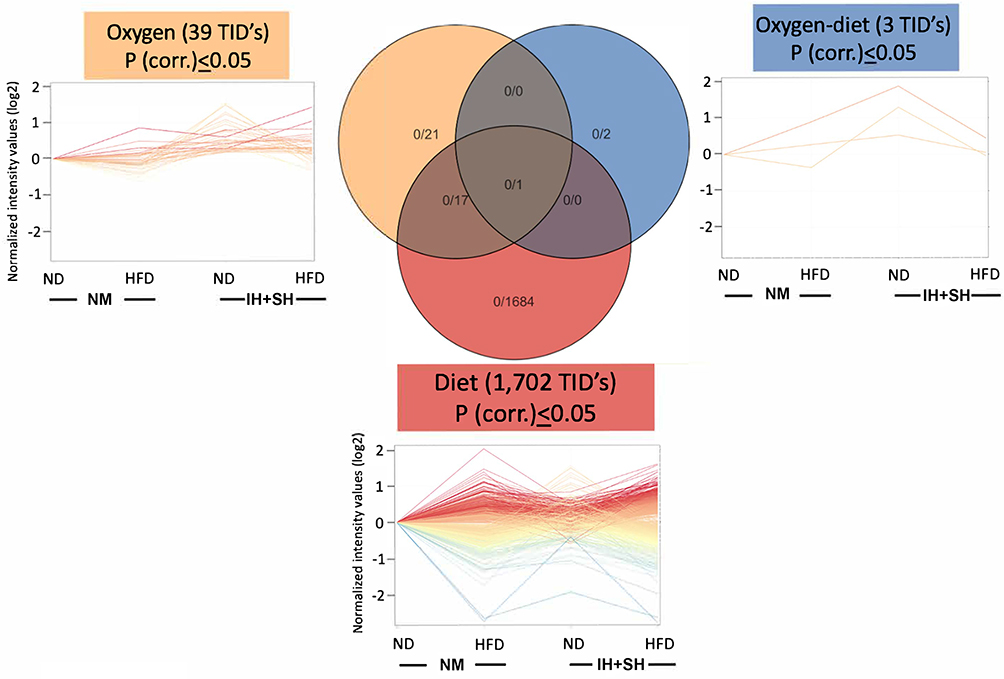 |
Figure 6 Diet is the dominant factor shaping colonic transcriptome. Two-way ANOVA analysis was performed on samples filtered to include genes with raw intensity >50 at least in 3/16 samples. Diet had the most impact with 1702 transcript cluster IDs (TIDs; corrected p<0.05), while 39 TIDs were associated with the oxygen status. Three TIDs were identified as affected by the combined influence of diet and oxygen status. Normoxia-normal diet (NM-ND), normoxia-high-fat diet (NM-HFD), intermittent and sustained hypoxia-normal diet (IH+SH-ND) and intermittent and sustained hypoxia-high-fat diet (IH+SH-HFD). |
When compared to baseline controls (ND_NM), HFD_IH+SH treatment showed a profound effect on colonic transcriptomic profile with a skewed proclivity for gene upregulation (Figure 7A and B). The set of genes that were unique, annotated, statistically different between ND_NM and HFD_IH+SH were analyzed with the DAVID gene ontology (GO) annotation tool under high stringency (minimum 10 genes per category, EASE score <0.05). As shown in (Figure 8A), some of the molecular function GO categories overrepresented in this dataset were protein binding, RNA and DNA binding, hydrolases, kinases, but also microtubule binding, actin-, and lipid binding. Actin binding proteins may be involved with tight junction assembly and thus with intestinal permeability regulation. On the other hand, lipid binding may reflect an impact of HFD on lipid metabolism, specifically in peroxidation, fat absorption and adipogenesis. GO biological processes analysis indicated changes in expression of genes associated in cell cycle/division/proliferation, transcription, membrane transport, lipid metabolism, and red-ox, among others (Figure 8B).
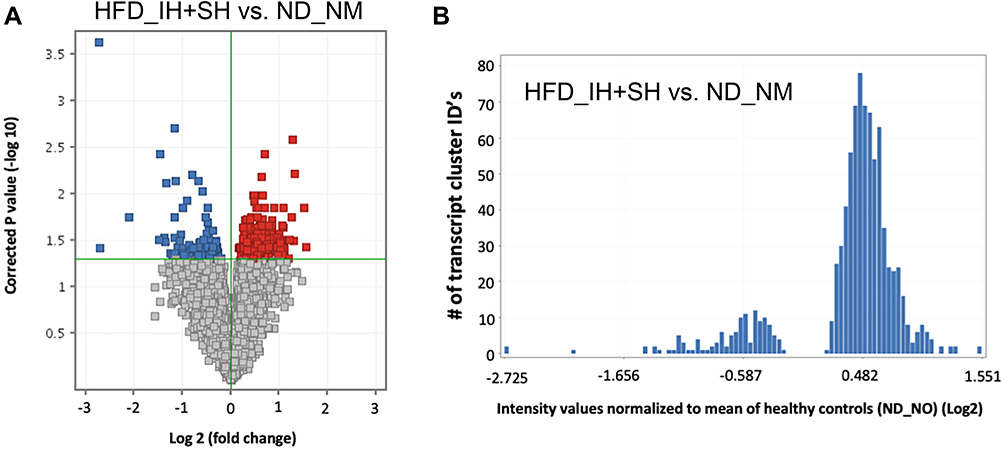 |
Figure 7 Transcriptiomic differences in colonic gene expression in healthy (ND-NM) mice and a model of intermittent and sustained hypoxia (HFD-IH+SH). (A) Volcano plot illustrating upregulated (in red) and downregulated genes (in blue) (B) Histogram depicting skewed pattern of regulation with majority of genes upregulated in HFD-IH+SH. |
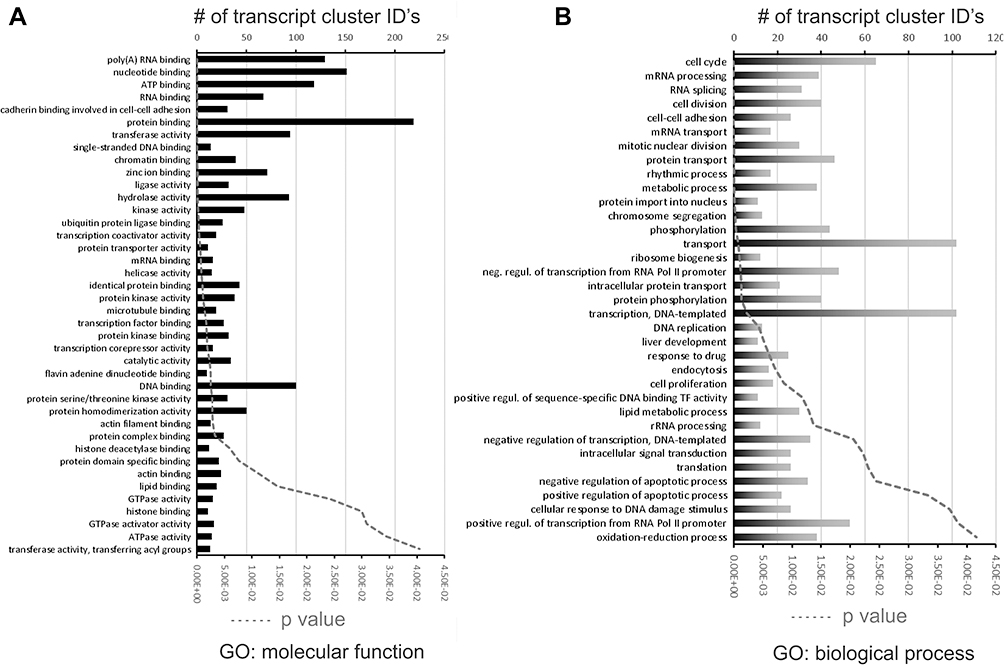 |
Figure 8 Gene ontology (GO) analysis utilizing DAVID with focus is on (A) molecular function and (B) biological process. Number of transcript cluster IDs (TIDs) for each GO category is plotted (bars) along with p-value (dashed line). |
Considering that diet is a factor potentially easier to modify as a part of lifestyle change in patients with OSA, we also focused our analysis on the effects of HFD in normoxic vs hypoxic conditions. Although HFD had significant impact on both IH+SH- and NM-treated mice, microarray analysis data demonstrated that while HFD influence in the NM group resulted in significant change of 251 TIDs (HFD_NM vs ND_NM; Figure 9A), HFD applied in hypoxic conditions (HFD_IH+SH vs HFD_NM) led to altered expression of 1804 genes (Figure 9B). Interestingly, the sets of genes dysregulated by HFD in NM or IH+SH states were very discordant, both in number and in the ascribed function (Figure 10). GO analysis of the gene sets regulated by HFD exclusively in NM or IH+SH indicated that while under NM, HFD had significant impact on notable processes such as the downregulation of bile acid biosynthesis and brown adipocyte differentiation, the affected biological processes were more expansive in the HFD_IH+SH group, with many unique GO categories observed. One of them, prominently overrepresented in this experimental group was cell–cell adhesion (Figure 10). Among the dysregulated genes in this category were genes coding for known members of the apical junctional complexes (eg, claudins, nectins), or adhesion molecules (eg, CD164) (Figure 11). Interestingly, Claudin 2 (Cldn2) and spleen-associated tyrosine kinase (Syk), both associated with tight junction dysfunction and increased mucosal permeability were significantly up regulated in the HFD_IH+SH group, while claudin 4 (Cldn4), a barrier-forming claudin exclusively expressed in luminal epithelial cells, was downregulated by HFD in hypoxic mice.
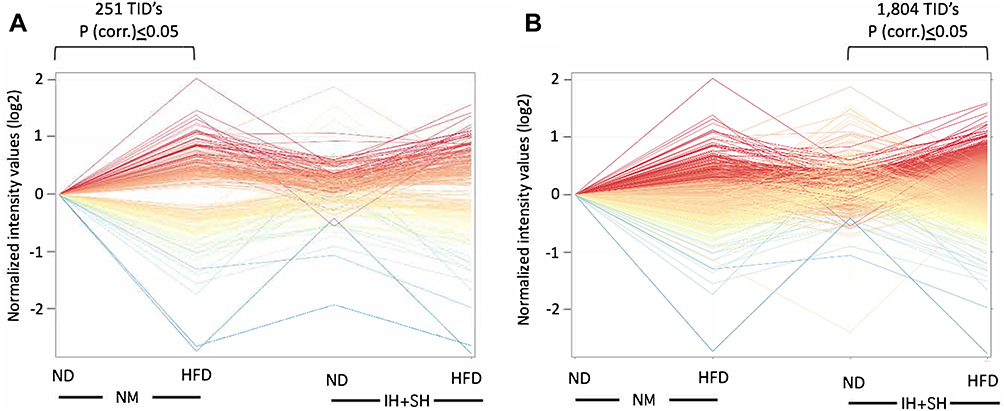 |
Figure 9 Intermittent and sustained hypoxia modulates colonic transcriptomic response to high-fat diet. (A) 251 transcript cluster IDs (TIDs) identified as differentially regulated by HFD in normoxic (NO) conditions (corr. p<0.05) and plotted in all four experimental groups. (B) 1804 TIDs’s identified as differentially regulated by HFD in intermittent and sustained hypoxia (IH+SH) conditions (corr. p<0.05) and plotted in all four experimental groups. |
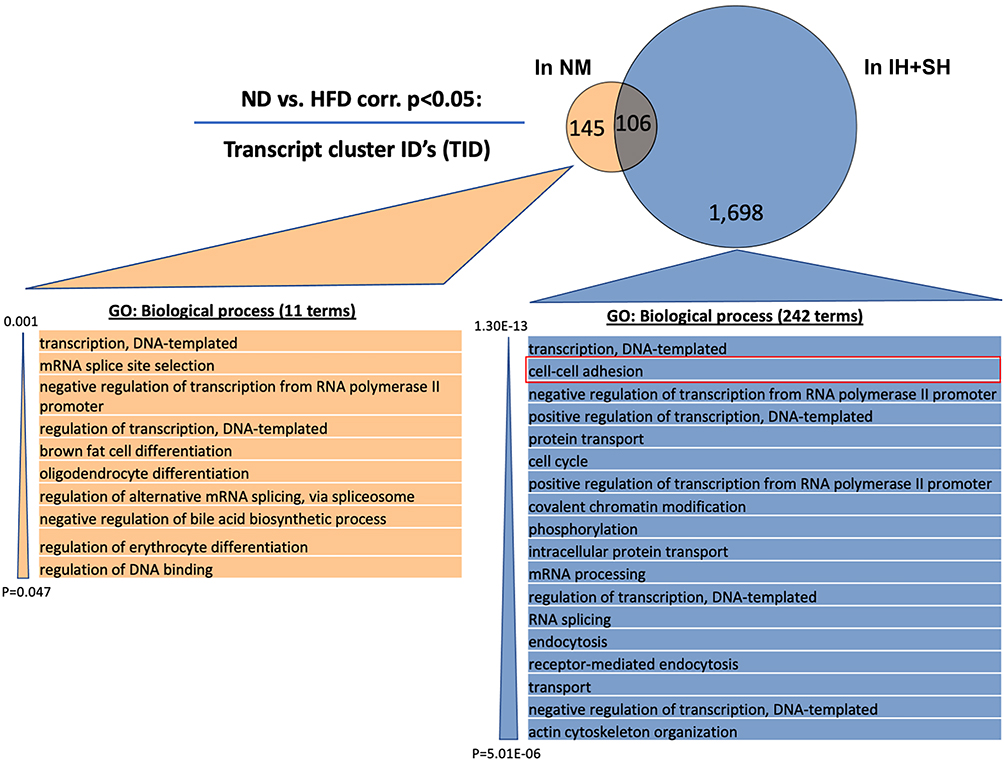 |
Figure 10 Intermittent and sustained hypoxia modulates colonic transcriptomic response to high-fat diet – gene ontology analysis. Venn diagram depicts the minimal overlap among the genes significantly regulated by high-fat diet (HFD) in normoxic mice (NM; in orange) and mice under intermittent and sustained hypoxia (IH+SH; in blue) treatment. Gene ontology (GO) analysis was performed with transcript cluster IDs (TIDs) exclusively regulated by HFD in NM (145) and in mice treated with IH+SH (1698). Ease score threshold of p<0.05 was chosen and calculated per number of GO-annotated TIDs. Out of a diverse group of 242 biological process categories within 1698 TIDs, only 18 most significant are shown for clarity and cell–cell adhesion category is highlighted in red. |
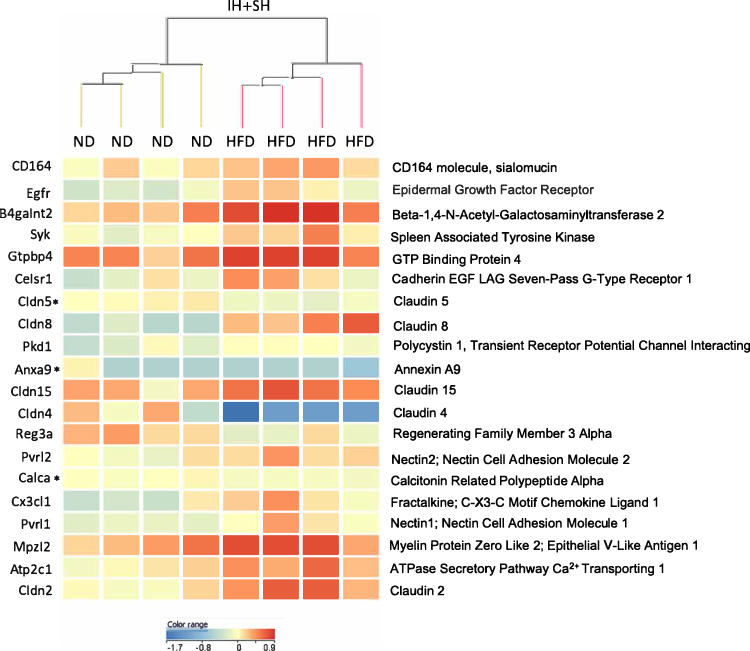 |
Figure 11 Intermittent and sustained hypoxia affects expression of genes associated with cell adhesion in high-fat diet-fed mice. Genes identified by gene set analysis (GSA) focused on a subset of 89 genes within the cell–cell adhesion category, which were significantly different (moderated t-test, p<0.05) between mice that underwent intermittent and sustained hypoxia (IH+SH) and fed normal diet (ND) or high-fat diet (HFD). Of the 20 genes shown, asterisk denoted three genes with very low expression (<30 raw intensity data) in all eight experimental mice, and which may not be of biological relevance. Data was clustered using hierarchical clustering algorithm using normalized intensity values, with Euclidean distance metrics and Ward’s linkage rule. |
Discussion
Certain general observations can be made from our study. First, while high-fat diet was the major driving force in changing the microbiota composition at the family and genera levels, intermittent hypoxia combined with sustained hypoxia modulates the effect of high-fat diet on the colonic mucosal microbiome. Second, intermittent hypoxia combined with sustained hypoxia accentuated the increase in Firmicutes:Bacteroidetes ratio affected by HFD alone. Finally, and more importantly, IH+SH combined with HFD altered the expression of proteins associated with cell–cell interactions, actin binding, and lipid binding, thus suggesting a dysregulation of the intestinal barrier function and lipid metabolism.
Most experiments in this area of study investigated the impact of intermittent hypoxia (with or without high-fat diet) on the gut microbiome but not the effects of sustained hypoxia.14,41 Recently, Zhen et al42 conducted an experiment in mice comparing the impact of intermittent hypoxia, sustained hypoxia, and combination of intermittent and sustained hypoxia on several cardiometabolic variables when compared to normoxia. Mice experiencing a combination of intermittent and sustained hypoxia showed an increase in systolic blood pressure, right ventricular systolic blood pressure, hepatic oxidative stress, low-density lipoprotein, and very low-density lipoprotein. There was no observed change in glucose disposal. However, the investigators did not study the interactive effect of high-fat diet and hypoxia in this experiment (mice were fed a regular chow diet ad libitum). More importantly, they did not study the effect of such influences on gut dysbiosis. It is conceivable, that gut dysbiosis may have mediated the effect of the combination of intermittent and sustained hypoxia and high-fat diet on such cardiometabolic changes. In our study, we demonstrated the interactive effects of the combination of intermittent and sustained hypoxia with high-fat diet in causing gut dysbiosis that has previously been shown to cause hypertension by Durgan et al.14 In the study by Durgan et al, high-fat diet and intermittent hypoxia led to significant alterations of the gut microbiota including decreases in bacterial taxa that are known to produce the short-chain fatty acid butyrate. The causal influence of such gut dysbiosis on hypertension was demonstrated by transplantation of the dysbiotic cecal contents from hypertensive rats (experiencing intermittent hypoxia and high-fat diet) to recipient normotensive rats (receiving intermittent hypoxia and normal chow diet) that resulted in hypertension similar to that of the donor.
The Firmicutes:Bacteroidetes (F:B) ratio is a well-established characteristic of gut dysbiosis. In the study by Durgan et al, the Firmicutes:Bacteroidetes ratio of rats receiving high-fat diet and intermittent hypoxia tended to be lower than rats on a high-fat diet alone. However, in our study, we found that mice receiving a combination of intermittent and sustained hypoxia in addition to high-fat diet manifested a nearly fourfold increase in Firmicutes:Bacteroidetes ratio when compared to that affected by HFD alone. We recognize however that in the study by Durgan et al, they subjected their animals to a shorter period (2 weeks) as opposed to our 4-week protocol and that their model (rats) versus our murine model may have contributed to such differences.14,19 Nevertheless, our longer protocol identified an adverse interactive effect of the combination of intermittent and sustained hypoxia that was not observed with intermittent hypoxia alone.
Interestingly, one of the features observed in animal models with gut dysbiosis is impaired epithelial barrier and increased intestinal permeability (leaky gut), which is believed to contribute to a state of low-grade systemic inflammation that constitutes a cornerstone in the pathophysiology of many comorbid diseases and chronic illnesses.43–46 Moreno-Indias et al47 demonstrated low-grade endotoxemia during recovery from intermittent hypoxia in mice. Moreover, Ganesh et al48 demonstrated that rats exposed to HFD-IH showed loss of epithelial goblet cells, thinning of the mucus barrier, and lower levels of short chain fatty acids (mainly acetate) in the cecum. Short chain fatty acids serve as a nutrient source for epithelial cells and help maintain the integrity of cell–cell adhesion and gut barrier permeability. Supplementation with pre- and pro- biotics in these rats prevented goblet cell loss and mucosal thinning. Replacement of acetate by continuous infusion for 2 weeks prevented IH-induced systemic hypertension.19,48
Our colonic gene expression analysis indicated that in addition to genes associated with lipid metabolism, HFD and IH+SH synergized to regulate the expression of genes associated with epithelial barrier function. Barrier-forming claudin 4 (Cldn4)49,50 known to be downregulated in ulcerative colitis,51 collagenous colitis,52 and irritable bowel syndrome53 was also downregulated in HFD_IH+SH group in our study. Concurrently, expression of claudin 2, known for its association with leaky epithelia and upregulated in intestinal inflammation was increased in the HFD_IH+SH group.54 Similarly, spleen-associated tyrosine kinase (SYK), which indirectly controls epithelial barrier, was upregulated in HFD_IH+SH mice.55,56 Admittedly, not all genes identified in this GO category support the notion about defective barrier. Nectins, which are known for their association with adherens and tight junctions, and which support barrier formation were upregulated in the HFD_IH+SH group.57 Thus, future studies will have to determine whether the net effect of the observed changes indeed translates to impaired barrier function and increased epithelial permeability.
To our knowledge, our experiment is the first to examine the impact of the combination of intermittent and sustained hypoxia and the interactive effect of such exposure with HFD on the colonic mucosal microbiome and host tissue gene expression profile. We also used the colonic mucosa tissue instead of the fecal samples to examine the microbiome. Our study has limitations. First, we exposed the mice in our experiment to intermittent hypoxia without intermittent hypercapnia.15,16,58–60 There is strong evidence that intermittent hypercapnia plays an important role in shaping the gut microbiota. However, several studies applied only intermittent hypoxia protocols and concluded a shift in the gut microbiota profile.41,47,61 Second, our host gene expression findings of altered intestinal permeability and cell–cell adhesion were not confirmed by permeability assay (FITCH-conjugated dextran assay) to check the luminal translocation of molecules into the bloodstream. Third, we did not measure cardiometabolic outcomes of the mice in the various conditions of our study. The performance of such measures would have enabled us to better connect the hypoxia exposures with cardiometabolic outcomes in relation to gut dysbiosis and fat intake. Fourth, we did not apply an intermittent hypoxia alone or a sustained hypoxia alone arm in our study to directly compare the differential effects of such exposure. Instead, we compared findings from our study with that of others who can perform a similar experiment with intermittent hypoxia alone and high-fat diet.14 Nevertheless, although the addition of the IH alone and SH alone groups would have provided greater insight, they would have increased the number of groups and the complexity of our study and would not have detracted anything away from the comparisons within our current study design which remain valid. We plan to conduct additional studies performing head-to-head comparisons of intermittent and sustained hypoxia. Finally, our sample size was small which resulted in underpowered results.
Conclusion
High-fat diet during combined intermittent and sustained hypoxia causes greater gut dysbiosis and potentially adverse changes in colonic epithelial transcriptome than high-fat diet during normoxia. The latter changes are suggestive of impaired gut barrier function that may form the basis for low systemic inflammation and cardiometabolic disease. These findings can shed more light on novel therapeutic interventions targeting the gut microbiome as an adjuvant treatment in patients with obesity hypoventilation syndrome to mitigate metabolic disorders and systemic inflammation associated with sleep-disordered breathing and dietary fat intake.
Acknowledgments
Dr Parthasarathy reports research grants funded by the NIH (OT2-HL-161847-01, OT2-HL-156812, OT2-HL-158287, R25HL126140, C06OD028307, U01HL128954, UG3HL140144), PCORI (CER‐2018C2‐13262, DI-2018C2-13161), CDC (CDC-OT21-2103 (Subcontract #: CTR056154)) and Office of Minority Health (Department of Health and Human Services; CT-HD-22-089), Foundations (ASMF-169-SR-17) and Industry (Philips, Whoop. Inc.). He is a site-PI or co-investigator on research funded by DOD (W81XWH-14-1-0570, W81XWH20C0051, W81XWH2110025).
Disclosure
SP is a consultant for Jazz Pharmaceuticals, Inc., receives royalty from UpToDate, Inc., and has a patent that was licensed by SaiOx, Inc. (US20160213879A1). SP reports receiving grants to institution from the following entities: Sergey Brin Family Foundation (Verily Life Sciences, Inc.), Philips-Respironics, Inc., WHOOP, Inc., Sommetrics, Inc., and Regeneron, Inc. These conflicts are unrelated to this manuscript. The author reports no other conflicts of interest in this work.
References
1. Chau EH, Lam D, Wong J, Mokhlesi B, Chung F. Obesity hypoventilation syndrome: a review of epidemiology, pathophysiology, and perioperative considerations. Anesthesiology. 2012;117(1):188–205. doi:10.1097/ALN.0b013e31825add60
2. Mokhlesi B. Obesity hypoventilation syndrome: a state-of-The-art review. Respir Care. 2010;55(10):
3. Nowbar S, Burkart KM, Gonzales R, et al. Obesity-associated hypoventilation in hospitalized patients: prevalence, effects, and outcome. Am J Med. 2004;116(1):1–7. doi:10.1016/j.amjmed.2003.08.022
4. Piper AJ, Grunstein RR. Obesity hypoventilation syndrome: mechanisms and management. Am J Respir Crit Care Med. 2011;183(3):292–298. doi:10.1164/rccm.201008-1280CI
5. Carrillo A, Ferrer M, Gonzalez-Diaz G, et al. Noninvasive ventilation in acute hypercapnic respiratory failure caused by obesity hypoventilation syndrome and chronic obstructive pulmonary disease. Am J Respir Crit Care Med. 2012;186(12):1279–1285. doi:10.1164/rccm.201206-1101OC
6. Ryan S, Taylor CT, McNicholas WT. Selective activation of inflammatory pathways by intermittent hypoxia in obstructive sleep apnea syndrome. Circulation. 2005;112(17):2660–2667. doi:10.1161/CIRCULATIONAHA.105.556746
7. Yuan G, Nanduri J, Bhasker CR, Semenza GL, Prabhakar NR. Ca2+/calmodulin kinase-dependent activation of hypoxia inducible factor 1 transcriptional activity in cells subjected to intermittent hypoxia. J Biol Chem. 2005;280(6):4321–4328. doi:10.1074/jbc.M407706200
8. Albenberg L, Esipova TV, Judge CP, et al. Correlation between intraluminal oxygen gradient and radial partitioning of intestinal microbiota. Gastroenterology. 2014;147(5):1055–1063.e1058. doi:10.1053/j.gastro.2014.07.020
9. Chassaing B, Gewirtz AT. Gut microbiota, low-grade inflammation, and metabolic syndrome. Toxicol Pathol. 2014;42(1):49–53. doi:10.1177/0192623313508481
10. Tang WH, Wang Z, Levison BS, et al. Intestinal microbial metabolism of phosphatidylcholine and cardiovascular risk. N Engl J Med. 2013;368(17):1575–1584. doi:10.1056/NEJMoa1109400
11. Huć T, Nowinski A, Drapala A, Konopelski P, Ufnal M. Indole and indoxyl sulfate, gut bacteria metabolites of tryptophan, change arterial blood pressure via peripheral and central mechanisms in rats. Pharmacol Res. 2018;130:172–179. doi:10.1016/j.phrs.2017.12.025
12. Ohira H, Tsutsui W, Fujioka Y. Are short chain fatty acids in gut microbiota defensive players for inflammation and atherosclerosis? J Atheroscler Thromb. 2017;24(7):660–672. doi:10.5551/jat.RV17006
13. Yin J, Liao SX, He Y, et al. Dysbiosis of gut microbiota with reduced trimethylamine-N-oxide level in patients with large-artery atherosclerotic stroke or transient ischemic attack. J Am Heart Assoc. 2015;4:11. doi:10.1161/JAHA.115.002699
14. Durgan DJ, Ganesh BP, Cope JL, et al. Role of the gut microbiome in obstructive sleep apnea-induced hypertension. Hypertension. 2016;67(2):469–474. doi:10.1161/HYPERTENSIONAHA.115.06672
15. Xue J, Allaband C, Zhou D, et al. Influence of intermittent hypoxia/hypercapnia on atherosclerosis, gut microbiome, and metabolome. Front Physiol. 2021;12:663950. doi:10.3389/fphys.2021.663950
16. Tripathi A, Melnik AV, Xue J, et al. Intermittent hypoxia and hypercapnia, a hallmark of obstructive sleep apnea, alters the gut microbiome and metabolome. mSystems. 2018;3(3). doi:10.1128/mSystems.00020-18
17. Hu C, Wang P, Yang Y, et al. Chronic intermittent hypoxia participates in the pathogenesis of atherosclerosis and perturbs the formation of intestinal microbiota. Front Cell Infect Microbiol. 2021;11:560201. doi:10.3389/fcimb.2021.560201
18. Daniel H, Gholami AM, Berry D, et al. High-fat diet alters gut microbiota physiology in mice. Isme j. 2014;8(2):295–308.
19. Mashaqi S, Gozal D. Obstructive sleep apnea and systemic hypertension: gut dysbiosis as the mediator? JCSM. 2019;15(10):1517–1527. doi:10.5664/jcsm.7990
20. Masa JF, Pépin JL, Borel JC, Mokhlesi B, Murphy PB, Sánchez-Quiroga M. Obesity hypoventilation syndrome. Eur Respir Rev. 2019;28(151):180097. doi:10.1183/16000617.0097-2018
21. Shetty S, Parthasarathy S. Obesity hypoventilation syndrome. Curr Pulmonol Rep. 2015;4(1):42–55. doi:10.1007/s13665-015-0108-6
22. Rapoport DM, Garay SM, Epstein H, Goldring RM. Hypercapnia in the obstructive sleep apnea syndrome. A reevaluation of the “Pickwickian syndrome”. Chest. 1986;89(5):627–635. doi:10.1378/chest.89.5.627
23. Shetty S, Fernandes A, Patel S, Combs D, Grandner MA, Parthasarathy S. Unanticipated nocturnal oxygen requirement during positive pressure therapy for sleep apnea and medical comorbidities. JCSM. 2017;13(1):73–79. doi:10.5664/jcsm.6392
24. Banerjee D, Yee BJ, Piper AJ, Zwillich CW, Grunstein RR. Obesity hypoventilation syndrome: hypoxemia during continuous positive airway pressure. Chest. 2007;131(6):1678–1684. doi:10.1378/chest.06-2447
25. Farre R, Montserrat JM, Gozal D, Almendros I, Navajas D. Intermittent hypoxia severity in animal models of sleep apnea. Front Physiol. 2018;9:1556. doi:10.3389/fphys.2018.01556
26. Jun J, Reinke C, Bedja D, et al. Effect of intermittent hypoxia on atherosclerosis in apolipoprotein E-deficient mice. Atherosclerosis. 2010;209(2):381–386. doi:10.1016/j.atherosclerosis.2009.10.017
27. Reinke C, Bevans-Fonti S, Drager LF, Shin MK, Polotsky VY. Effects of different acute hypoxic regimens on tissue oxygen profiles and metabolic outcomes. J Appl Physiol. 2011;111(3):881–890. doi:10.1152/japplphysiol.00492.2011
28. Torres M, Laguna-Barraza R, Dalmases M, et al. Male fertility is reduced by chronic intermittent hypoxia mimicking sleep apnea in mice. Sleep. 2014;37(11):1757–1765. doi:10.5665/sleep.4166
29. Torres M, Rojas M, Campillo N, et al. Parabiotic model for differentiating local and systemic effects of continuous and intermittent hypoxia. J Appl Physiol. 2015;118(1):42–47. doi:10.1152/japplphysiol.00858.2014
30. Lim DC, Brady DC, Po P, et al. Simulating obstructive sleep apnea patients’ oxygenation characteristics into a mouse model of cyclical intermittent hypoxia. J Appl Physiol. 2015;118(5):544–557. doi:10.1152/japplphysiol.00629.2014
31. Caporaso JG, Kuczynski J, Stombaugh J, et al. QIIME allows analysis of high-throughput community sequencing data. Nat Methods. 2010;7(5):335–336. doi:10.1038/nmeth.f.303
32. Detman A, Laubitz D, Chojnacka A, et al. Dynamics and complexity of dark fermentation microbial communities producing hydrogen from sugar beet molasses in continuously operating packed bed reactors. Front Microbiol. 2020;11:612344. doi:10.3389/fmicb.2020.612344
33. Laubitz D, Typpo K, Midura-Kiela M, et al. Dynamics of gut microbiota recovery after antibiotic exposure in young and old mice (A Pilot Study). Microorganisms. 2021;9(3):647. doi:10.3390/microorganisms9030647
34. Callahan BJ, McMurdie PJ, Rosen MJ, Han AW, Johnson AJ, Holmes SP. DADA2: high-resolution sample inference from Illumina amplicon data. Nat Methods. 2016;13(7):581–583. doi:10.1038/nmeth.3869
35. Quast C, Pruesse E, Yilmaz P, et al. The SILVA ribosomal RNA gene database project: improved data processing and web-based tools. Nucleic Acids Res. 2013;41(Databaseissue):D590–596. doi:10.1093/nar/gks1219
36. Jari Oksanen FGB, Friendly M, Kindt R, et al. vegan: community ecology package; 2020.
37. Wickham H. ggplot2: Elegant Graphics for Data Analysis. Springer-Verlag; 2016.
38. Sievert C. Interactive Web-Based Data Visualization with R, Plotly, and Shiny. Chapman and Hall/CRC; 2020.
39. Huang da W, Sherman BT, Lempicki RA. Systematic and integrative analysis of large gene lists using DAVID bioinformatics resources. Nat Protoc. 2009;4(1):44–57. doi:10.1038/nprot.2008.211
40. Huang da W, Sherman BT, Lempicki RA. Bioinformatics enrichment tools: paths toward the comprehensive functional analysis of large gene lists. Nucleic Acids Res. 2009;37(1):1–13. doi:10.1093/nar/gkn923
41. Moreno-Indias I, Torres M, Montserrat JM, et al. Intermittent hypoxia alters gut microbiota diversity in a mouse model of sleep apnoea. Eur Respir J. 2015;45(4):1055–1065. doi:10.1183/09031936.00184314
42. Zhen X, Moya EA, Gautane M, et al. Combined intermittent and sustained hypoxia is a novel and deleterious cardio-metabolic phenotype. Sleep. 2021;45(6):zsab290.
43. Poroyko VA, Carreras A, Khalyfa A, et al. Chronic sleep disruption alters gut microbiota, induces systemic and adipose tissue inflammation and insulin resistance in mice. Sci Rep. 2016;6:35405. doi:10.1038/srep35405
44. Burt VL, Cutler JA, Higgins M, et al. Trends in the prevalence, awareness, treatment, and control of hypertension in the adult US population. Data from the health examination surveys, 1960 to 1991. Hypertension. 1995;26(1):60–69. doi:10.1161/01.HYP.26.1.60
45. Canani RB, Costanzo MD, Leone L, Pedata M, Meli R, Calignano A. Potential beneficial effects of butyrate in intestinal and extraintestinal diseases. World j Gastroenterol. 2011;17(12):1519–1528. doi:10.3748/wjg.v17.i12.1519
46. Vinolo MA, Rodrigues HG, Nachbar RT, Curi R. Regulation of inflammation by short chain fatty acids. Nutrients. 2011;3(10):858–876. doi:10.3390/nu3100858
47. Moreno-Indias I, Torres M, Sanchez-Alcoholado L, et al. Normoxic recovery mimicking treatment of sleep apnea does not reverse intermittent hypoxia-induced bacterial dysbiosis and low-grade endotoxemia in mice. Sleep. 2016;39(10):1891–1897. doi:10.5665/sleep.6176
48. Ganesh BP, Nelson JW, Eskew JR, et al. Prebiotics, probiotics, and acetate supplementation prevent hypertension in a model of obstructive sleep apnea. Hypertension. 2018;72(5):1141–1150. doi:10.1161/HYPERTENSIONAHA.118.11695
49. Colegio OR, Van Itallie CM, McCrea HJ, Rahner C, Anderson JM. Claudins create charge-selective channels in the paracellular pathway between epithelial cells. Am J Physiol Cell Physiol. 2002;283(1):C142–147. doi:10.1152/ajpcell.00038.2002
50. Van Itallie C, Rahner C, Anderson JM. Regulated expression of claudin-4 decreases paracellular conductance through a selective decrease in sodium permeability. J Clin Invest. 2001;107(10):1319–1327. doi:10.1172/JCI12464
51. Oshima T, Miwa H, Joh T. Changes in the expression of claudins in active ulcerative colitis. J Gastroenterol Hepatol. 2008;23(Suppl 2):S146–150. doi:10.1111/j.1440-1746.2008.05405.x
52. Bürgel N, Bojarski C, Mankertz J, Zeitz M, Fromm M, Schulzke JD. Mechanisms of diarrhea in collagenous colitis. Gastroenterology. 2002;123(2):433–443. doi:10.1053/gast.2002.34784
53. Kong WM, Gong J, Dong L, Xu JR. [Changes of tight junction claudin-1,-3,-4 protein expression in the intestinal mucosa in patients with irritable bowel syndrome]. Nan Fang Yi Ke Da Xue Xue Bao. 2007;27(9):1345–1347. Chinese.
54. Barmeyer C, Schulzke JD, Fromm M. Claudin-related intestinal diseases. Semin Cell Dev Biol. 2015;42:30–38. doi:10.1016/j.semcdb.2015.05.006
55. Biagioli M, Mencarelli A, Carino A, et al. Genetic and pharmacological dissection of the role of spleen tyrosine kinase (Syk) in intestinal inflammation and immune dysfunction in inflammatory bowel diseases. Inflamm Bowel Dis. 2017;24(1):123–135. doi:10.1093/ibd/izx031
56. Gong W, Yu J, Zheng T, et al. CCL4-mediated targeting of spleen tyrosine kinase (Syk) inhibitor using nanoparticles alleviates inflammatory bowel disease. Clin Transl Med. 2021;11(2):e339. doi:10.1002/ctm2.339
57. Fukuhara A, Irie K, Yamada A, et al. Role of nectin in organization of tight junctions in epithelial cells. Genes Cells. 2002;7(10):1059–1072. doi:10.1046/j.1365-2443.2002.00578.x
58. Xue J, Zhou D, Poulsen O, et al. Intermittent hypoxia and hypercapnia accelerate atherosclerosis, partially via trimethylamine-oxide. Am J Respir Cell Mol Biol. 2017;57(5):581–588. doi:10.1165/rcmb.2017-0086OC
59. Tripathi A, Xu ZZ, Xue J, et al. Intermittent hypoxia and hypercapnia reproducibly change the gut microbiome and metabolome across rodent model systems. mSystems. 2019;4(2). doi:10.1128/mSystems.00058-19
60. Allaband C, Lingaraju A, Martino C, et al. Intermittent hypoxia and hypercapnia alter diurnal rhythms of luminal gut microbiome and metabolome. mSystems. 2021;6(3):e0011621. doi:10.1128/mSystems.00116-21
61. Liu J, Li T, Wu H, et al. Lactobacillus rhamnosus GG strain mitigated the development of obstructive sleep apnea-induced hypertension in a high salt diet via regulating TMAO level and CD4(+) T cell induced-type I inflammation. Biomed Pharmacother. 2019;112:108580. doi:10.1016/j.biopha.2019.01.041
 © 2022 The Author(s). This work is published and licensed by Dove Medical Press Limited. The
full terms of this license are available at https://www.dovepress.com/terms
and incorporate the Creative Commons Attribution
- Non Commercial (unported, 3.0) License.
By accessing the work you hereby accept the Terms. Non-commercial uses of the work are permitted
without any further permission from Dove Medical Press Limited, provided the work is properly
attributed. For permission for commercial use of this work, please see paragraphs 4.2 and 5 of our Terms.
© 2022 The Author(s). This work is published and licensed by Dove Medical Press Limited. The
full terms of this license are available at https://www.dovepress.com/terms
and incorporate the Creative Commons Attribution
- Non Commercial (unported, 3.0) License.
By accessing the work you hereby accept the Terms. Non-commercial uses of the work are permitted
without any further permission from Dove Medical Press Limited, provided the work is properly
attributed. For permission for commercial use of this work, please see paragraphs 4.2 and 5 of our Terms.
Recommended articles
Overweight/Obese Status Synergistically Worsens Nocturnal Time-to-Time Blood Pressure in Children with Obstructive Sleep Apnea
Wu Y, Geng X, Xu Z, Ni X
Nature and Science of Sleep 2022, 14:1261-1271
Published Date: 15 July 2022
Microbiome-Targeted Therapies as an Adjunct to Traditional Weight Loss Interventions: A Systematic Review and Meta-Analysis
Peckmezian T, Garcia-Larsen V, Wilkins K, Mosli RH, BinDhim NF, John GK, Yasir M, Azhar EI, Mullin GE, Alqahtani SA
Diabetes, Metabolic Syndrome and Obesity 2022, 15:3777-3798
Published Date: 11 December 2022
Body Weight-Related Differences in Adipokines and Inflammatory Markers Among Women with Systemic Lupus Erythematosus
Carvalho LM, Da Mota JC, Ribeiro AA, Souza LL, Sales RCDS, Gualano B, Martínez-Urbistondo M, Martínez JA, Borba EF, Nicoletti CF
Journal of Inflammation Research 2026, 19:579501
Published Date: 28 February 2026