
Back to Journals » International Journal of General Medicine » Volume 19
Integrative Single-Cell RNA Sequencing and Machine Learning Reveals Candidate Plasma Protein-Associated Gene Signatures for Osteoporosis: A Preliminary Exploratory in Silico Study
Authors Chen X  , Wang Y, Yan C , He Y, Song Y
Received 6 May 2026
Accepted for publication 4 July 2026
Published 21 July 2026 Volume 2026:19 616181
DOI https://doi.org/10.2147/IJGM.S616181
Checked for plagiarism Yes
Review by Single anonymous peer review
Peer reviewer comments 2
Editor who approved publication: Dr Woon-Man Kung
Xiaoting Chen, Yangting Wang, Chenyan Yan, Yingzi He, Yingxiang Song
Key Laboratory of Endocrine Gland Diseases of Zhejiang Province, Department of Endocrinology, Geriatric Medicine Center, Zhejiang Provincial People’s Hospital (Affiliated People’s Hospital, Hangzhou Medical College), Hangzhou, Zhejiang, People’s Republic of China
Correspondence: Yingxiang Song, Email [email protected]
Purpose: Plasma proteins are associated with the onset and progression of osteoporosis (OP) and can serve as indicators for this disease. This study aimed to comprehensively analyze and identify plasma protein-associated biomarkers in OP, and clarify their potential molecular mechanisms.
Methods: Data related to OP and plasma protein-associated genes were retrieved from public databases. Biomarkers were screened and validated via high-dimensional Weighted Gene Co-Expression Network Analysis (hdWGCNA), differential expression analysis, machine learning algorithms, and expression profiling. Additionally, nomogram construction, enrichment analysis, and immune infiltration analysis were performed to further investigate the regulatory roles of biomarkers. Molecular docking was conducted to computationally predict potential drug-target interactions, which require experimental verification. Single-cell RNA sequencing (scRNA-seq) data from one OP patient were used for exploratory examination of biomarker expression patterns in key cell types, providing cellular context for the bulk transcriptomic findings. Finally, reverse transcription quantitative polymerase chain reaction (RT-qPCR) validated biomarker expression in lymphocytes from 6 OP patients and 6 controls, while ELISA measured serum CTSD activity in 10 independent samples per group.
Results: Two biomarkers (JUN and CTSD) were identified as significantly linked to plasma protein in OP. The nomogram developed based on these biomarkers showed potential diagnostic utility that warrants further evaluation. The biomarkers were significantly enriched in the ribosome, proteasome, lysosome, and spliceosome pathways. Notably, JUN showed strong positive correlations with activated dendritic cells and mast cells. Molecular docking further demonstrated that the biomarkers could bind favorably with streptozocin and bruceantin. Moreover, JUN and CTSD exhibited differential expression changes during the differentiation of bone marrow mesenchymal stem cells. Finally, we validated the expression of CTSD and JUN in lymphocytes from OP and control groups, finding that CTSD expression was increased in the OP group compared with the control group.
Conclusion: In summary, we identified JUN and CTSD as transcriptome-derived plasma protein-associated gene biomarkers in OP. These findings may provide preliminary insights that could inform future diagnostic and therapeutic investigations, although further validation in larger cohorts and direct proteomic studies are warranted.
Keywords: osteoporosis, plasma protein, machine learning, single-cell RNA sequencing, biomarkers
Introduction
Osteoporosis (OP) is currently the most common metabolic bone disease, characterized by impaired bone cell metabolism that disrupts the balance between bone resorption and new bone formation, ultimately resulting in skeletal fragility and an increased risk of fracture.1 It was reported that the global prevalence of OP is currently 19.7%, significantly impacting global health.2 Meanwhile, with the increasing aging of the population, OP fractures and their complications will place a significant burden on society. At present, dual-energy X-ray absorptiometry (DXA) is the clinical gold standard for OP diagnosis, and bone mineral density (BMD) is also an important indicator for predicting the risk of OP-related fractures. Furthermore, bone mineral density is also a significant indicator for predicting fracture risk.3,4 Although studies have reported that factors such as estrogen deficiency, inappropriate glucocorticoid use, diabetes, malnutrition, and excessive alcohol consumption are risk factors for OP and fracture occurrence, most people do not pay sufficient attention to OP. Some people only begin to seek treatment of OP after a fracture occurs.5 Therefore, early diagnosis and initial risk stratification of OP are crucial for reducing its incidence and facilitating treatment after onset. Discovering more effective diagnostic and therapeutic targets for OP has become the preferred strategy for its prevention and treatment.
Plasma proteins are considered an ideal source of biomarkers due to the non-invasiveness of their collection and dynamic reflection of physiological and pathological states.6 Studies have shown that plasma proteins play an important predictive role in the development and progression of various chronic diseases and aging, including Alzheimer’s disease (AD),7 cardiovascular and cerebrovascular diseases8 and OP. In recent years, multiple studies have highlighted the substantial impact of plasma proteins on bone loss.9,10 Mendelian randomization (MR) studies have revealed a causal association between 67 plasma proteins and bone mineral density (BMD), with the majority of them influencing OP risk by participating in the formation of the extracellular matrix (ECM).11 Serum proteomics studies have also indicated that 53 proteins, including apolipoproteins and complement components, are associated with OP, suggesting that the serum proteome may serve as a key indicator for assessing skeletal aging.9 However, it is currently unclear which plasma protein factors can serve as reliable indicators for OP. Therefore, exploring plasma protein factors with potential regulatory roles holds promise for providing new insights into the diagnosis and treatment of OP. Crucially, we must differentiate between experimentally measured plasma proteins (reflecting direct circulating abundance) and computationally inferred plasma protein-related genes (PRGs). Identified via GWAS, Mendelian randomization, or transcriptomics, PRGs act as genetic or transcriptional proxies rather than direct substitutes for protein levels. Recognizing this distinction is vital for correctly interpreting our integrated findings.12,13
Various factors, including estrogen deficiency and oxidative stress, act on different cell types such as osteoblasts, osteoclasts, and osteocytes, triggering complex cell-cell interactions that lead to the development of OP.14,15 Therefore, clarifying the roles of different cell types in the pathogenesis of OP is crucial. Beyond genetic susceptibility and pharmacological interventions, physical activity and rehabilitation training are established modulators of bone metabolism and musculoskeletal integrity.16 Exercise-induced mechanical loading can influence circulating bone turnover markers, cytokine profiles, and osteogenic signaling pathways, thereby promoting skeletal adaptation and reducing fracture risk.17 For instance, different exercise modalities have been shown to exert differential effects on pain relief, muscle strength, and functional recovery in patients with degenerative joint diseases such as knee osteoarthritis,18 underscoring the broader biological link between mechanical stimulation and tissue remodeling. Despite the recognition of these effects, the specific molecular networks through which rehabilitation-related signals regulate bone metabolism at the transcriptomic and single-cell levels remain largely unexplored. This knowledge gap further justifies our integrative approach—namely, the identification of robust and biologically meaningful biomarkers that may also inform future adjunctive therapeutic strategies for osteoporosis based on exercise or rehabilitation.
Single-cell RNA sequencing (scRNA-seq) can precisely profile the gene expression of each individual cell, thereby revealing the complex interactions between different cell types and their unique gene expression signatures.19 Consequently, integrating bulk RNA-seq, scRNA-seq, and plasma protein data analysis can better combine transcriptomic analysis at the tissue and cellular levels to identify key mechanisms in the onset and progression of OP.
Therefore, this study first successfully identified plasma protein-related biomarkers in OP using bioinformatics methods. Furthermore, enrichment analysis, immune infiltration analysis, and drug prediction were performed to elucidate the potential mechanisms of these biomarkers in OP pathogenesis. Simultaneously, single-cell data analysis was used to characterize the expression patterns of the aforementioned biomarkers in key cell types, providing a basis for in-depth exploration of the functional characteristics of individual cells and revealing heterogeneity within cell populations. Finally, mRNA and Elisa analysis were used to verify whether the expression of biomarkers was consistent with the bioinformatics results. Through systematic exploration of plasma protein genes and their potential mechanisms in OP, this study aims to provide new theoretical support for clinical diagnosis and optimization of treatment strategies for OP.
Materials and Methods
Data Selection
The transcriptome data from RNA-seq datasets (GSE56815 and GSE2208) and the scRNA-seq dataset GSE147287, all of which were linked to OP, were obtained from the Gene Expression Omnibus (GEO) database (http://www.ncbi.nlm.nih.gov/geo/). Among them, GSE56815 (platform: GPL96), designated as the training set, comprised 40 low BMD samples (serving as the OP group) and 40 high BMD samples (serving as the control group). For GSE2208 (platform: GPL96), the validation set, gene expression data were downloaded from 9 low BMD samples versus 10 high BMD samples. Meanwhile, the scRNA-seq dataset GSE147287 (platform: GPL24676) contains one sample of bone marrow obtained from a patient with OP. Additionally, in the Proteome-Phenome-Atlas database (https://proteome-phenome-atlas.com/), Cox regression analysis was performed with sensitivity statistics to mitigate the confounding effects of comorbidities, age, gender, and other covariates. A total of 843 plasma protein-related genes (PRGs) (Table S1) were identified in the general population with OP (p < 0.05).
scRNA-Seq Data Processing
In all samples of GSE147287, to comprehensively investigate the cellular distribution and potential functions across distinct cell populations in OP, an exploratory analysis of scRNA-seq data was performed using the Seurat package (v 5.1.0).20 Raw sequencing data were imported and processed into Seurat objects for downstream analysis. Cells were subjected to stringent quality control with the following inclusion criteria: (1) cells expressing 200–5000 genes; (2) cells with 500–30,000 unique molecular identifiers (UMIs); (3) cells with a mitochondrial gene expression ratio of < 20%. Additionally, genes expressed in fewer than 3 cells were filtered out to minimize noise. After quality control, gene expression values were normalized. And the FindVariableFeatures function was then applied to identify the top 2000 highly variable genes (HVGs). Subsequently, principal component analysis (PCA) was conducted to reduce the dimensionality of the scRNA-seq data. Statistically significant principal components (PCs) were identified using the JackStraw, JackStrawPlot, and ElbowPlot functions (p < 0.05). Clustering analysis was performed using the FindNeighbors and FindClusters functions (resolution = 0.2). To visualize the global clustering landscape of the samples, t-SNE was implemented on the selected PCs. Cell type annotation was performed by referencing canonical marker genes reported in previous studies.21–23 Osteoblasts differentiated from bone marrow mesenchymal stem cells (BM-MSCs), and the impairment of this differentiation process constitutes a core pathological event in OP.24,25 To further dissect the cellular heterogeneity of BM-MSCs (as key cells), dimensionality reduction, re-clustering (resolution = 0.1), and re-annotation21 were performed. Osteoblasts, a critical cell type derived from BM-MSCs, were the focus of analysis, and genes associated with this cell type were identified.
High-Dimensional Weighted Gene Co-Expression Network Analysis (hdWGCNA)
Based on single-cell level data, the hdWGCNA package (v 0.4.5)26 was utilized, and the MetacellsByGroups function was employed to generate a metacell gene expression matrix for constructing metacells specific to the osteoblasts of the samples. Gene expression profiles associated with the osteoblast-specific module were explored through eigengene connectivity (kME). The ModuleExprScore function of the AUCell algorithm (v 1.22.0)27 was applied to calculate the gene signature score for each module, with genes meeting the criteria of |correlation coefficient (cor) with the module eigengene| > 0.3 and p < 0.05 retained. Genes within the modules that exhibited a strong correlation with osteoblasts were defined as osteoblast-related module genes.
Identification of Candidate Genes
The limma package (v 3.58.1)28 was employed to identify differentially expressed genes (DEGs) between low BMD samples and high BMD samples in GSE56815 (|log2 fold change (FC)| > 0.1 and p < 0.05).29 The ggvenn package (v 0.1.10)30 was used to identify the overlapping genes among PRGs, osteoblast-related module genes, and DEGs, which were defined as differentially expressed PRGs (DE-PRGs). To elucidate the biological functions of DE-PRGs in OP, clusterProfiler package (v 4.8.1)31 was used to perform GO and KEGG analysis (p < 0.05). Furthermore, the DE-PRGs were imported into the STRING database (http://string-db.org, confidence ≥ 0.15, species = Homo sapiens). The protein-protein interaction (PPI) network was visualized using the circlize package (v 0.4.15).32 Subsequently, the MCC, MNC, and Degree algorithms embedded in the Cytohubba plugin of Cytoscape software (v 3.8.2)33 were employed to identify the top 10 genes, respectively. The overlapping genes among the three sets were defined as candidate genes.
Machine Learning Algorithms
Based on the candidate genes derived from GSE56815, three machine learning algorithms were employed to identify feature genes associated with plasma proteins. LASSO regression was employed to select features (seed = 1), with the optimal regularization parameter identified via 5-fold cross-validation. Then, the glmnet package (v4.1.8)34 was used to train the model with binary logistic regression and L1 regularization. For SVM-RFE (seed = 131, 5-fold cross-validation), the least important features were removed per iteration, and the number of removed features was halved in each subsequent iteration. Error rate curves were generated for all feature subsets, and the optimal subset was selected using the caret package (v 6.0–94).35 A RF model was constructed using the randomForest package (v4.7–1.1)36 (seed = 387). A 5-fold cross-validation procedure was carried out, with the number of trees (ntree) varying from 1 to 100. Feature genes were selected based on the tree count that yielded the minimum error rate. By integrating the results of these algorithms using the ggvenn package (v 0.1.10), the final feature genes associated with plasma proteins were identified.
Identification of Biomarkers and Creation of Nomogram
The expression of the final feature genes was evaluated in GSE56815 and GSE2208 using the Wilcoxon test (p < 0.05), and the feature genes that showed significant differences and consistent expression trends between low BMD samples and high BMD samples were defined as biomarkers. To further appraise the overall predictive capability of biomarkers for OP, a nomogram was established using the rms package (v 6.8–1)37 in GSE56815. Subsequently, calibration curves were generated to exhibit the diagnostic efficacy via rms package (v 6.8–1). The Hosmer-Lemeshow (HL) test served as an indicator for model fitting (p > 0.05). The rmda package (v 1.6)38 was employed to perform decision curve analysis (DCA) to value the clinical utility. The pROC package (v 1.18.5)39 was applied to validate the nomogram’s accuracy. An area under the curve (AUC) value greater than 0.7 was defined as excellent performance.
Gene Set Enrichment Analysis (GSEA) and Gene Set Variation Analysis (GSVA)
To further investigate the functions and regulatory mechanisms of the biomarkers, GSEA was performed using the whole-genome expression matrix of the GSE56815 dataset. The Spearman correlation analysis was conducted40 to calculate the cors between the biomarkers and all other genes via the psych package (v 2.4.3), respectively. Based on the ranking of these cors, GSEA was conducted using the clusterProfiler package (v 4.2.2) (p < 0.05, FDR < 0.25, and |NES)| > 1).
To assess the enrichment status between low BMD samples and high BMD samples, the GSVA package (v 1.50.0)41 was applied to score KEGG pathways. In parallel, the limma package (v 3.58.1) was utilized to compare the differences in GSVA scores across the two sample groups (|t| > 2 and p < 0.05). Notably, the background gene set (c2.cp.kegg_legacy.v2025.1.Hs.entrez.gmt) was obtained from the MSigDB (http://software.broadinstitute.org/gsea/msigdb/index.jsp).
Immune Infiltration
Immune infiltration analysis identifies diverse immune cell populations, predicts therapeutic responses, and facilitates the development of immunotherapeutic strategies by uncovering the complex interactions between immune cells and biomarkers. In the GSE56815 dataset, infiltration scores for 28 immune cell types42 were determined using the ssGSEA algorithm from the GSVA package (v 1.50.0). Differential immune cells (DICs) between low BMD samples and high BMD samples were identified based on the infiltration scores (p < 0.05). Subsequently, Spearman correlation analyses were performed to explore three types of relationships (among biomarkers, among DICs, and between biomarkers and DICs) (|cor| > 0.3 and p < 0.05).
Chromosome Localization and GeneMANIA
Gene localization is of great significance for investigating the structure, function, and interactions of biomarkers. The RCircos package (v 1.2.2)43 was applied to visualize the distribution of these biomarkers on chromosomes. The biomarkers were input into the GeneMANIA (http://www.genemania.org) to construct a gene-gene interaction network, which facilitated the identification and annotation of the biological functions of these biomarkers.
Drug Prediction and Molecular Docking
To provide a basis for the clinical application of OP treatment, the DGIdb (https://dgidb.org/) was utilized to explore potential targeted drugs for the identified biomarkers. The top 15 drugs ranked by the Interaction Score (a specific metric of DGIdb) were visualized. Among the predicted drugs targeting the biomarkers, those that had been approved for clinical use and exhibited the highest Interaction Score were selected for molecular docking analysis, aiming to evaluate their binding affinity. The molecular structures of the drugs were retrieved from the PubChem database (https://pubchem.ncbi.nlm.nih.gov/). The crystal structures of biomarkers were obtained from the Protein Data Bank (PDB, http://www.rcsb.org/). CB-Dock2 (https://cadd.labshare.cn/cb-dock2/php/index.php) was employed to predict the binding sites and affinities of protein-ligand complexes. Binding energy with a value of ≤ −5 kcal/mol was considered favorable binding affinity. Molecular docking was performed as an in silico computational prediction to assess potential binding affinities. The results are preliminary and do not constitute evidence of biological activity or therapeutic efficacy, which must be validated through biochemical and cellular assays.
Characterization of Key Cells
In GSE147287, the CellChat package (v 1.6.1)44 was employed to separately analyze molecular interactions and ligand-receptor pairs among different annotated cells. Subsequently, the monocle package (v 2.28.0)45 was applied for pseudo-time analysis to explore the differentiation trajectory of key cells. Variations in the expression levels of biomarkers during the differentiation of key cells were analyzed in GSE147287. Finally, the SCENIC package (v 1.3.1)46 was employed, in combination with the GRNBoost2 algorithm and a list of human transcription factors (TFs), to infer TF-target gene regulatory networks. The Regulatory Specificity Score (RSS) of key cellular regulators in GSE147287 was calculated, and TFs with active regulatory roles that could target the biomarkers were selected. The RSS scores of key cellular regulators across different cell subtypes were visualized, with the top 10 TFs with the highest RSS scores labeled.
Experimental Validation by RT-qPCR and Plasma Protein Level
The clinic data, lymphocytes and serum of OP patients and controls were collected at Zhejiang Provincial People’s Hospital and informed consent was obtained from all people prior to study commencement. This study was approved by the Ethics Committee of Zhejiang Provincial People’s Hospital [approval number ZJPPHEC 2026O (057)]. Venous blood (ethylenediaminetetraacetic acid-anticoagulated) was drawn from patients with OP/osteopenia (n=6) and control (n=6), each group consisted of three males and three females, and lymphocytes were isolated. Total RNA of lymphocytes was extracted by using Trizol method (Invitrogen, United States). The total mRNA (1ug) was reverse transcribed into cDNA (Takara, Japan). And quantitative real time PCR was conducted as previously described47 by LightCycler480 (Roche, United States). The primers were as used as previously described.48,49 The primers were as follows: CTSD: forward primer 5′-GCAAACT GCTGGACATCGCTTG-3′, reverse primer 5′-GCCATAGTGGATGTCAAACGAGG-3′, glyceraldehyde 3-phosphate dehydrogenase (GAPDH): forward primer 5′-CATCATCCCTGCCT CTACTG-3′, reverse primer 5′-GCCTGCTTCACCACCTTC-3′, JUN: forward primer 5′-CTTTTTCGGCACTTGGAGG-3′, reverse primer 5′-GTCCGAGAGCGGACCTTATG-3′ (Sangon Biotech, Shanghai, China).
Further, venous blood was collected from individuals aged from 60 to 65 with normal bone mineral density (n=10) and those with osteopenia/OP (n=10) into pre-chilled tubes and centrifuged (1000 g for 10 min at 4°C) and serum was frozen in liquid nitrogen and stored at −80°C until analyses. And the clinical characteristics of patients was showed in Table S10. An enzyme-linked immunosorbent assay (ELISA) kit for cathepsin D (Wuhan USCN, Wuhan, China) was used for the assay according to the manufacturer’s instructions. Briefly, plasma samples were diluted with Dulbecco’s phosphate-buffered saline (DPBS), and samples and standards were incubated with antibody-coated wells for 1h. After discarding the solutions, the wells were incubated with detection reagent A for 1 h, followed with three times of wash. Then the plate was incubated with detection reagent B for 30mins, followed with three times of wash. Finally, the reaction was then stopped by adding stop solution, and the plate was read immediately at a wavelength of 450 nm using a plate reader (MQX200, Bio-Tek, USA).
Statistical Analysis
All data were processed using R software (v 4.3.3) and GraphPad Prism (v 10). In addition, the Wilcoxon test and the t-test were employed in this study to assess intergroup differences, with the significance threshold set at p < 0.05. The overall analytical workflow for this study is shown in Figure 1.
 |
Figure 1 Analysis flowchart. |
Results
Cell Clusters Identification in scRNA-Seq Dataset
Initially, after integrating and filtering the original data of GSE147287 for OP, the data contained 49,436 cells and 9654 genes before quality control and 20,435 cells and 7709 genes after quality control (Figure S1A). After normalizing all samples and selecting the top 2000 HVGs (the top 10 HVGs were: GNLY, IBSP, IGKC, IGLC2, FABP4, IGHA1, IGHG1, DEFA3, RNASE1, HMOX1), dimensionality reduction was performed, and the top 20 PCs were selected (p < 0.05, Figure S1B–D). Then, 14 distinct cell clusters were identified and 8 cell types were annotated (Figure 2A and B). Bubble plots were employed to display marker gene expressions in different cell clusters (Figures S1E and 2C). Eight specific cell types were identified, including BM-MSCs (LEPR, NGFR, ENG, THY1, NT5E), neutrophils (FCGR3B, CSF3R, CXCR2, G0S2), monocytes (CTSS, FCN1, LYZ, CD14), T cells (CD3D, CD3G, TRAC), B cells (CD79A, IGHM, IGHA2, CD19), natural killer (NK) cells (NCAM1), nucleated red blood cells (NRBC, HBA1), and plasmacytoid dendritic cells (pDC, IL3RA, CLEC4C). Previous studies have demonstrated that BM-MSCs undergo progressive senescence with advancing age or estrogen deficiency, which is primarily characterized by a differentiation imbalance: enhanced adipogenic differentiation coupled with impaired osteogenic potential, ultimately leading to reduced bone formation.50 Additionally, mechanisms including epigenetic alterations, impaired autophagic function, and accumulated oxidative stress have been recognized as the drivers of OP.51 To further dissect the heterogeneity of BM-MSC subsets, secondary dimensionality reduction and clustering analysis were performed on BM-MSCs (15 PCs, p < 0.05, Figure S2A–C), which identified three distinct cell clusters (Figures 2D and S2D). Three specific cell types were identified, including osteoblasts (COL1A1, ALPL), adipocytes (MGP, APOD), and terminally differentiated cells (NCAM1, OMD) (Figure 2E and F).
 |
Figure 2 Identification of cell clusters and BM-MSC subtypes in osteoporosis scRNA-seq data. (A) t-SNE plot showing 14 cell clusters identified from the integrated scRNA-seq dataset of osteoporosis (resolution = 0.2). (B) Annotation of the 14 clusters into eight major cell types based on canonical marker genes, including BM-MSCs (LEPR, NGFR, ENG, THY1, NT5E), neutrophils (FCGR3B, CSF3R, CXCR2, G0S2), monocytes (CTSS, FCN1, LYZ, CD14), T cells (CD3D, CD3G, TRAC), B cells (CD79A, IGHM, IGHA2, CD19), NK cells (NCAM1), NRBC (HBA1), and pDC (IL3RA, CLEC4C). (C) Bubble plot showing the expression patterns of representative marker genes across the annotated cell types. (D) t-SNE plot showing the re-clustering of BM-MSCs into three subclusters. (E) Annotation of BM‑MSC subclusters into osteoblasts (COL1A1, ALPL), adipocytes (MGP, APOD), and terminally differentiated cells (NCAM1, OMD). (F) Bubble plot showing the expression of representative marker genes in the three BM-MSC-derived subtypes. Abbreviations: BM-MSCs, bone marrow mesenchymal stem cells; scRNA-seq, single-cell RNA sequencing; NK, natural killer; NRBC, nucleated red blood cell; pDC, plasmacytoid dendritic cell. |
Identification of Osteoblast-Related Module Genes by hdWGCNA
Osteoblasts differentiate from BM-MSCs, and impaired differentiation capacity of osteoblasts is a core pathological process of OP.24,25 Meanwhile, osteoblasts can also regulate the progression of OP by modulating multiple pathways such as metabolism, immunity, and oxidative stress. To further explore the key markers of osteoblasts, hdWGCNA analysis was performed with a soft power of 5 (R2 = 0.809, average connectivity = 366.458) to construct a gene co-expression network, which successfully identified three distinct gene co-expression modules Figure 3A and B). Module correlation analysis revealed a strong positive correlation between the brown and blue modules Figure 3C), and both modules showed a strong association with osteoblasts (cor = 0.64, p < 0.0001) Figure 3D and E). To investigate the functional roles of genes in these two modules, genes with significant associations with osteoblasts were screened, and 2453 osteoblast-related module genes were obtained (Table S2). These findings not only verified the robustness of the results but also suggested the potential regulatory role of these osteoblast-related module genes in the pathogenesis of OP.
 |
Figure 3 Identification of osteoblast-related gene modules by hdWGCNA. (A) Soft-threshold power analysis for scale-free topology and mean connectivity to determine the optimal soft‑thresholding parameter for constructing a weighted gene co-expression network specifically in osteoblasts. (B) Hierarchical clustering dendrogram of genes, with module assignments shown in color bars below. Three co-expression modules (brown, blue, grey) were identified using dynamic tree-cutting. (C) Correlation matrix among the identified gene modules. (D) Module signature scores (calculated via AUCell algorithm) for each module in osteoblasts. “+” indicates high activity, and “−” indicates low activity. (E) Heatmap showing the correlations between gene modules and BM-MSC-derived subtypes, highlighting the strong associations of the blue and brown modules with osteoblasts. Red indicates a positive correlation, and blue indicates a negative correlation. The darker the color, the stronger the correlation. Abbreviations: hdWGCNA, high-dimensional weighted gene co-expression network analysis; BM-MSCs, bone marrow mesenchymal stem cells. |
Identification and Functional Evaluation of DE-PRGs
In GSE56815, 1214 DEGs (Table S3) were identified between distinct BMD samples. Among them, 648 genes were upregulated and 566 genes were downregulated in the low BMD samples (Figure 4A and B). The intersection of 843 PRGs, 2453 osteoblast-related module genes, and 1214 DEGs was used to identify 15 DE-PRGs, namely EGFR, CTSD, EIF2S2, PTX3, CD99, JUN, ENPP2, ATRAID, HLA-E, BSG, ADAM15, CANT1, ACTA2, LGALS3BP, and CTSO (Figure 4C). A total of 343 GO terms enriched for DE-PRGs included symbiotic interaction, entry into host cell, vesicle lumen, tertiary granule lumen, polysaccharide binding, and exogenous protein binding (p < 0.05, Table S4). KEGG demonstrated that DE-PRGs were enriched in 33 KEGG pathways, such as relaxin signaling pathway, apoptosis pathway, and estrogen signaling pathway (p < 0.05, Figure 4D and Table S5). Based on the STRING database, the protein interactions among 14 of the 15 DE-PRGs (one gene lacked interaction data) involving 31 paired interactions were investigated. Within this network, EGFR, JUN, CTSD, BSG, and LGALS3BP exhibited extensive interactions with other proteins, thereby playing a core regulatory role in the biological network (Figure 4E). The networks of MCC, MNC, and Degree algorithms all consisted of 10 nodes and 25 edges. The top 10 important candidate genes identified from these networks were consistently CD99, JUN, LGALS3BP, PTX3, BSG, CTSD, ACTA2, HLA-E, EGFR, and ENPP2 (Figure 4F).
 |
Figure 4 Identification and functional characterization of differentially expressed plasma protein-related genes in osteoporosis. (A) Volcano plot showing differentially expressed genes between low-BMD and high-BMD samples in GSE56815. Each dot in the plot represents a single gene. Red dots indicate genes with upregulated expression, while blue dots denote genes with downregulated expression. The horizontal axis corresponds to log2FC, the log-transformed value of fold change in gene expression level. The vertical axis is defined as −log10(p value), the negative base-10 logarithm of the P value. (B) Circular heatmap showing the expression patterns of differentially expressed plasma protein-related genes (DE-PRGs). (C) Venn diagram showing the overlap among 843 PRGs, 2453 osteoblast-related module genes, and 1214 DEGs, yielding 15 DE-PRGs. (D) GO (biological process, cellular component, molecular function) and KEGG pathway enrichment results for DE-PRGs (p < 0.05), highlighting pathways such as relaxin signaling, apoptosis, and estrogen signaling. (E) PPI network of 14 DE-PRGs (one gene lacked interaction data) constructed via STRING (confidence ≥ 0.15), with edge width representing combined score. (F) Hub gene network from the intersection of the top 10 genes ranked by MCC, MNC, and Degree algorithms in CytoHubba, consistently identifying CD99, JUN, LGALS3BP, PTX3, BSG, CTSD, ACTA2, HLA-E, EGFR, and ENPP2 as candidate genes. Abbreviations: BMD, bone mineral density; DE-PRGs, differentially expressed plasma protein-related genes; GO, Gene Ontology; KEGG, Kyoto Encyclopedia of Genes and Genomes; DEG, differentially expressed gene; PPI, protein‑protein interaction. |
Identification of JUN and CTSD as Biomarkers for OP
In the LASSO algorithm, the model was constructed using the standard error λ value as the minimum criterion (log (lambda.min) = −3.462) to avoid overfitting and improve prediction accuracy, leading to the identification of 7 LASSO-feature genes, namely EGFR, JUN, CTSD, HLA-E, PTX3, CD99, and ENPP2 (Figure 5A). In the SVM-RFE analysis, when the top 7 features were sufficient to support the optimal discriminative performance of the model, the prediction precision of the model reached its highest value for the first time. This process ultimately identified 7 SVM-RFE-feature genes, including EGFR, PTX3, CTSD, LGALS3BP, ENPP2, HLA-E, and JUN (Figure 5B). The minimum error rate was used as the criterion to select the optimal tree threshold of 19. The constructed RF model identified the top 5 RF-feature genes ranked by importance score, namely EGFR, CD99, CTSD, LGALS3BP, and JUN (Figure 5C). The feature genes from the three machine learning methods were intersected to obtain three final feature genes, including EGFR, CTSD, and JUN (Figure 5D). JUN and CTSD exhibited significantly upregulated expression in the high BMD samples (p < 0.05, Figure 5E and F). Collectively, these results identified JUN and CTSD as biomarkers associated with OP.
 |
Figure 5 Machine learning-based identification of plasma protein-related biomarkers in osteoporosis. (A) LASSO regression analysis, including the coefficient profiles and deviance plot, for feature gene selection. Top: LASSO coefficient profiles for candidate genes as a function of log(λ). Bottom: 5-fold cross-validation deviance plot; the optimal λ (log λ = −3.462, 1‑se criterion) was selected to minimize overfitting, identifying 7 LASSO-feature genes (EGFR, JUN, CTSD, HLA-E, PTX3, CD99, ENPP2). (B) SVM-RFE analysis showing the relationship between variable number and model performance, with the optimal feature subset identified at seven variables (EGFR, PTX3, CTSD, LGALS3BP, ENPP2, HLA-E, JUN). (C) Left: Random forest error rate as a function of the number of trees (ntree), with the minimum error at ntree = 19. Right: Variable importance plot ranking the top 5 genes (EGFR, CD99, CTSD, LGALS3BP, JUN) by importance score. (D) Venn diagram showing the overlap of feature genes (EGFR, CTSD, and JUN) identified by LASSO, SVM-RFE, and random forest. (E and F) Violin plots showing the expression of EGFR, CTSD, and JUN in the GSE56815 training set (E) and GSE2208 validation set (F). Only JUN and CTSD showed significantly consistent upregulation in high-BMD samples across both cohorts (Wilcoxon test), thus defined as biomarkers. ns represents insignificant, *p<0.05, **p<0.01, ***p<0.001. Abbreviations: LASSO, least absolute shrinkage and selection operator; SVM-RFE, support vector machine-recursive feature elimination. |
An OP diagnostic nomogram model was developed based on the biomarkers (JUN and CTSD) from GSE56815. The higher the total points, the greater the probability of suffering from OP (Figure 6A). The calibration curve nearly overlapped with the ideal prediction curve, indicating that the model had reliable predictive accuracy (p = 0.507) (Figure 6B). The model curve maintained a distinct distance from the two extreme curves, indicative of favorable predictive performance. Moreover, the nomogram yielded a higher net benefit rate compared with any single gene, further corroborating the superior diagnostic efficacy of the established model (Figure 6C). The AUC of the nomogram was 0.762 in the GSE56815, and the AUC of the nomogram was 0.922 in the GSE2208, indicating the reliability of the model’s diagnostic efficacy (Figure 6D and E).
 |
Figure 6 Diagnostic nomogram based on the identified biomarkers. (A) Nomogram integrating JUN and CTSD for individualized prediction of OP probability. Points are assigned to each biomarker based on its expression value; total points correspond to predicted risk, **p<0.01. (B) Calibration curve for the nomogram in GSE56815. The dashed diagonal line represents ideal prediction; the solid curve shows actual performance, with the Hosmer-Lemeshow test p = 0.507 indicating good fit. (C) Decision curve analysis comparing the net clinical benefit of the nomogram (blue) versus individual genes (red and yellow) and the “All” (gray) or “None” (black) strategies. The nomogram provides good net benefit across a wide range of threshold probabilities. (D and E) Receiver operating characteristic curve showing the diagnostic performance of the nomogram in the GSE56815 (D) and GSE2208 (E) datasets. |
Biological Mechanisms Associated with Biomarkers in OP
GSEA results demonstrated that JUN was enriched in 10 distinct pathways, with key pathways encompassing the ribosome, proteasome, and spliceosome pathways (p < 0.05, Figure 7A and Table S6). By contrast, CTSD was enriched in 23 pathways, including the lysosome, RNA degradation, and citrate cycle (TCA cycle) pathways (p < 0.05, Figure 7B and Table S7). Notably, both CTSD and JUN were significantly enriched in the five overlapping pathways, such as ribosome, proteasome, lysosome, and spliceosome (p < 0.05, Figure 7C and D). Furthermore, GSVA results revealed that a total of 48 pathways exhibited significant intergroup differences (p < 0.05). The representative pathways significantly upregulated in the low BMD samples included ABC transporters and aminoacyl tRNA biosynthesis (p < 0.05, Figure 7E and Table S8).
 |
Figure 7 Functional pathway analyses of JUN and CTSD in osteoporosis. (A) GSEA enrichment plots for JUN-correlated genes (Spearman correlation with whole-genome expression in GSE56815). Significant pathways include ribosome, proteasome, and spliceosome (p < 0.05, FDR < 0.25, |NES| > 1). (B) GSEA plots showing representative pathways significantly associated with CTSD. (C) Venn diagram showing the overlap of significantly enriched pathways between JUN and CTSD. (D) Heatmap showing the normalized enrichment scores of the overlapping pathways shared by JUN and CTSD, *p<0.05, **p<0.01, ***p<0.001. (E) GSVA plots showing representative KEGG pathways with significant differences between low-BMD and high-BMD samples. *p<0.05, **p<0.01, ***p<0.001. Abbreviations: GSEA, gene set enrichment analysis; GSVA, gene set variation analysis; KEGG, Kyoto Encyclopedia of Genes and Genomes; NES, normalized enrichment score, FDR, false discovery rate. |
Immune Landscape in OP
To conduct a more in-depth exploration of the immune microenvironment in OP, immune cell infiltration analysis was carried out using data from the GSE56815 dataset, clarifying the intricate interactions among immune cells. Compared with the low BMD samples, the infiltration levels of activated dendritic cells and mast cells were markedly upregulated in the high BMD samples (p < 0.05, Figure 8A and B). A positive correlation between activated dendritic cells and mast cells was found (cor = 0.61, p < 0.001). All differential immune cells exhibited positive correlations with the biomarkers: JUN showed strong positive correlations with activated dendritic cells (cor = 0.37, p < 0.001) and mast cells (cor = 0.57, p < 0.001), and CTSD also showed positive correlations with these two immune cell types (Figure 8C).
 |
Figure 8 Immune landscape associated with the identified biomarkers in osteoporosis. (A) Heatmap of ssGSEA-based infiltration scores for 28 immune cell types across GSE56815 samples. (B) Boxplots showing activated dendritic cells and mast cells as the two cell types with significantly different infiltration levels between low- and high-BMD groups (Wilcoxon test), ns represents insignificant, *p<0.05. (C) Spearman correlation matrix among JUN, CTSD, activated dendritic cells, and mast cells. JUN showed strong positive correlations with activated dendritic cells (cor = 0.37, p < 0.001) and mast cells (cor = 0.57, p < 0.001); CTSD also correlated positively with both, though weaker. ns represents insignificant, **p<0.01, ***p<0.001. Abbreviation: ssGSEA, single-sample gene set enrichment analysis; BMD, bone mineral density. |
Comprehensive Analysis of Biomarkers in OP
Chromosomal localization showed that JUN and CTSD are located on chromosome 1 and chromosome 11, respectively (Figure 9A). To further explore the interactions between the hub genes, the GeneMANIA database was employed. The co-expression network revealed associations between the biomarkers and 20 related genes, such as FOS, CTSA, ATF3, MAPK8, IGFBP7, MAPK9, ATF4, CREB5, IFI30, and KDM6B. These genes are likely involved in the same biological processes, including response to cadmium ion, cellular response to oxidative stress, Fc receptor signaling pathway, and RNA polymerase II transcription regulator complex (Figure 9B). The hub genes were submitted to the DGIdb database, and the results revealed that CTSD was linked to two candidate drugs, among which one (streptozocin) was a clinically approved agent and one (C3TD879) was an investigational compound. In contrast, JUN was associated with 46 drugs, including 24 approved pharmaceuticals (such as bruceantin and ciprofibrate) and 22 unapproved candidates (such as risolidone and sergeolide) (Table S9; only the top 15 drugs ranked by Interaction Score are presented herein) (Figure 9C). Subsequently, the approved drugs with the highest Interaction Score predicted to target these biomarkers were selected for molecular docking validation. The results revealed that streptozocin bound to CTSD with a binding energy of −6.5 kcal/mol, interacting via residues including GLY-79, SER-80, THR-125, ASP-33, and GLY-35 (Figure 9D). Bruceantin bound to JUN with a binding energy of −8.5 kcal/mol, interacting via residues including GLN-669 and ARG-286 (Figure 9E). This indicated that the docking results predicted favorable binding conformations, providing a computational basis for future experimental validation.
 |
Figure 9 Comprehensive characterization of JUN and CTSD and prediction of candidate drugs. (A) Chromosomal localization of JUN and CTSD. (B) GeneMANIA network showing genes functionally associated with JUN and CTSD. (C) Drug-gene interaction network showing the top predicted drugs targeting the biomarkers. (D) Molecular docking model of streptozocin with CTSD. (E) Molecular docking model of bruceantin with JUN. |
Characterization of BM-MSCs in OP
The cell-cell communication network was visualized to characterize the intensity and interaction counts of intercellular communication. Notably, the crosstalk between BM-MSCs and NK cells exhibited the highest activity level, ranking first in both interaction counts and communication intensity. These findings suggested that our exploratory analysis raises the possibility that BM-MSCs may influence NK cell activity, although this observation is derived from a single sample and requires confirmation. In contrast, neutrophils displayed minimal interactions with other cell types, implying that they might be in an immunosuppressed or senescent state within the chronic bone metabolic microenvironment (Figure 10A and B). Immune cells could activate BM-MSC functions via pathways such as SPP1, MDK, and FGF, and these pathways might either promote bone repair or exacerbate bone loss. Conversely, BM-MSCs could modulate immune responses and matrix remodeling through key signaling axes including CXCL12-CXCR4 and ANGPTL4-CDH11, thus forming a dynamic feedback loop (Figure 10C). BM-MSCs underwent two critical transition nodes during their development and differentiation. Adipocytes represented an early developmental stage, whereas terminally differentiated cells corresponded to the late stage of BM-MSC development and differentiation. The developmental timeline of macrophages was divided into five stages: Stage 1 was the early developmental stage and Stage 5 was the late developmental stage (Figure 11A). The expression patterns of biomarkers across pseudo-time trajectories were unveiled in BM-MSCs. CTSD was predominantly highly expressed in the early-to-middle phases of differentiation, whereas JUN exhibited robust expression mainly during the middle and terminal phases (Figure 11B). Additionally, this study revealed that BM-MSC subtypes were closely correlated with TFs. Specifically, TFs including EGR1, IRF1, JUN, and JUNB exhibited high activity in the osteoblast subtype, suggesting that these cells were in an intermediate state between osteogenic function execution and pathological response (Figure 11C). Moreover, the top 10 scoring TFs varied across the three distinct key cell subsets, which may indicate the presence of divergent transcriptional regulatory profiles among these cellular subtypes (Figure 11D).
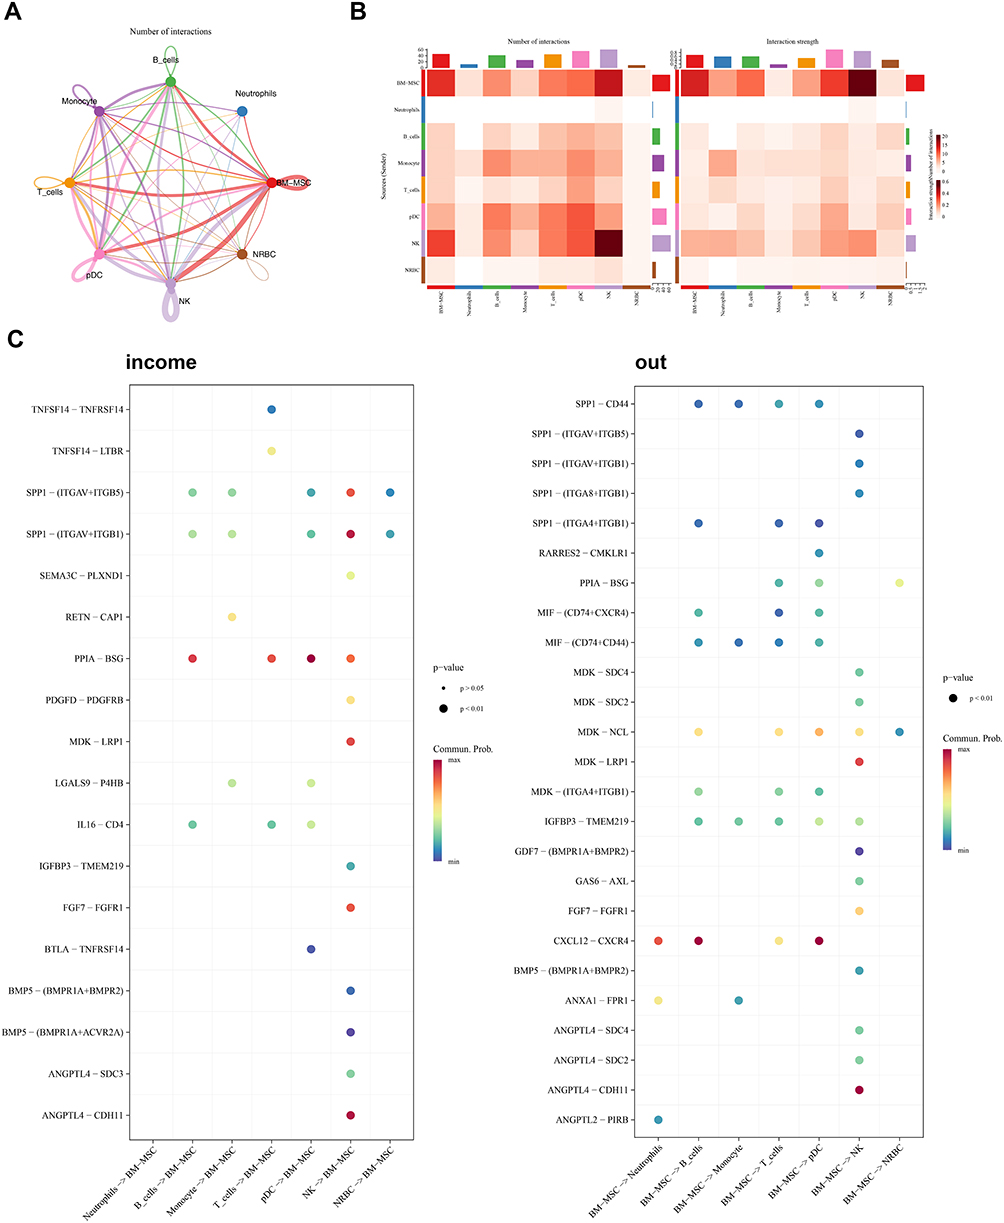 |
Figure 10 Characterization of BM-MSC communication in osteoporosis. (A) Intercellular communication network (CellChat) showing the number of interactions among all cell types. BM-MSCs and NK cells showed the highest interaction counts; neutrophils had minimal interactions. (B) Heatmaps showing the interaction number and interaction strength among cell types. (C) Bubble plots showing the major incoming and outgoing signaling pathways involved in BM-MSC communication. Abbreviation: BM-MSCs, bone marrow mesenchymal stem cells. |
 |
Figure 11 Characterization of BM-MSC differentiation trajectory, and transcriptional regulation in osteoporosis. (A) Monocle2 pseudotime trajectory of BM-MSC differentiation, with cells colored by pseudotime (left), cell state (middle), and subtype (right). Two bifurcation nodes were identified; adipocytes appeared at early stages and terminally differentiated cells at late stages. (B) Dynamic expression patterns of JUN and CTSD along the BM-MSC differentiation trajectory. (C) Heatmap showing the activity of representative transcription factors across osteoblasts, adipocytes, and terminally differentiated cells. “+” indicates that this transcription factor potentially exerts a positive regulatory effect. (D) Regulon specificity score plots showing the top transcription factors in osteoblast, terminally differentiated, and adipocyte subtypes. Abbreviation: BM-MSCs, bone marrow mesenchymal stem cells. |
Expression Confirmation of JUN and CTSD
To further study the expression of CTSD and JUN, 4 mL of venous blood (ethylenediaminetetraacetic acid-anticoagulated) was drawn from patients with OP and control, and lymphocytes were isolated, followed by RT-qPCR assays. The results showed that the mRNA expression of CTSD was significantly upregulated compared to the control group, while the expression of JUN showed no significant difference. Furthermore, we selected 20 serum samples from individuals aged from 60 to 65 with normal bone mineral density and those with osteopenia or osteoporosis, the baseline characteristics showed in Table S10. We then used ELISA to detect serum CTSD activity. The results showed that CTSD activity was significantly higher in the osteopenia or osteoporosis group than in the normal bone mineral density group, suggesting that CTSD may be associated with osteoporosis status (Figure 12).
 |
Figure 12 Analysis of the RT-qPCR expression and activity of CTSD and JUN. The relative mRNA expression levels of CTSD and JUN, and the activity of serum CTSD detected by ELISA, **p<0.01. |
Discussion
Plasma proteins play a critical role in numerous biological processes and the abnormal alterations of these proteins can lead to changes in physiological conditions. In recent years, there has been increasing research focusing on the relationship between plasma proteins and OP, with multiple studies reporting associations between plasma proteins and BMD as well as OP. Aparicio-Bautista et al52 reported that levels of several plasma proteins, including APOA1, SHBG, and FETB, differed in postmenopausal women with OP and osteopenia. Another study also found differential expression of the plasma protein ANXA2 between subjects with low and high BMD,53 suggesting that plasma proteins are important in the development of OP. By integrating whole-transcriptome analysis, single-cell sequencing, and machine learning approaches, this study systematically identified JUN and CTSD as plasma protein-related biomarkers for osteoporosis (OP), which were partially validated by RT-qPCR and ELISA assays. These two biomarkers are enriched in bone metabolism-related pathways and correlate with the infiltration of specific immune cells. Furthermore, the nomogram model constructed based on these biomarkers demonstrated promising diagnostic potential in retrospective datasets. However, all computational findings—particularly those related to immune regulation, molecular docking, and single-cell inference—are exploratory in nature and derived from a limited sample size. Independent validation through functional experiments and larger-scale prospective cohort studies is required before any translational medicine conclusions can be drawn.
Jun proto-oncogene (Jun) is one of the AP-1 transcription factor family proteins and has been reported to be mainly involved in fibrotic diseases and regulate key cellular processes such as the cell cycle.54 JUN also plays an important regulatory role in the skeletal system. Lerbs et al demonstrated using different Jun-induced mouse models that JUN can promote osteogenic differentiation and bone formation, as well as aiding fracture repair.55 Mechanistically, it is reported that JUN may promote bone formation by regulating osteogenic differentiation of BMSCs through the Hedgehog and Wnt signaling pathway.55–57 Notably, JUN’s role in bone metabolism is double-edged: Under stimulation by inflammatory signals (such as TNF-α and IL-6), phosphorylation or upregulation of c-Jun can enhance osteoclast activity and promote bone resorption.58,59 Furthermore, our RT-qPCR validation did not detect significant differences in JUN mRNA expression between OP patients and controls. This observation can be attributed to multiple factors. First, the biological function of JUN is primarily dictated by its protein levels and post-translational modifications (PTMs) rather than mRNA abundance. As a core component of the AP-1 transcription complex, JUN’s transcriptional activity is strictly regulated by JNK-mediated phosphorylation at Ser63 and Ser73, as well as acetylation modifications that affect its stability.53,54 Therefore, mRNA levels may not directly reflect the functional activity of JUN. Second, JUN expression is subject to post-transcriptional regulation. Studies have shown that the RNA-binding protein ZFP36 suppresses JUN translation by binding to the 3’UTR of JUN mRNA, suggesting that protein expression can be uncoupled from its mRNA abundance.60 More broadly, the weak correlation between mRNA and protein levels of transcription factors is a well-recognized phenomenon. Third, JUN exerts a dual regulatory role in bone metabolism: it promotes osteogenic differentiation via the Hedgehog pathway while simultaneously driving osteoclast differentiation through the c-Fos/c-Jun axis.50–54 Given this functional complexity, measuring JUN mRNA alone is insufficient to comprehensively evaluate its role in OP. Future studies should incorporate protein-level and phosphorylation status analyses to better elucidate the involvement of JUN in this disease.
CTSD is a lysosomal aspartyl protease,61,62 primarily expressed in humans as an inactive proenzyme form.63 Studies have shown that the CTSD tissue-specific expression plays a crucial role in determining the development of different tissues.64 Recent research suggested that CTSD may be involved in the pathogenesis of OP65,66 and has the potential to be a biomarker for OP.65 However, current studies on the relationship between CTSD and OP are limited, and the underlying mechanisms remain unclear.67 Animal studies by Sun et al have found that CTSD can influence the osteogenic capacity of rat BMSCs, but the mechanism remained unclear.68 Conversely, research by Song et al suggested that CTSD can weaken osteogenic differentiation of BMSCs and new bone formation, which may be related to the ability of CTSD to degrade bone matrix proteins, regulate osteoclast activity, and indirectly affect the expression and function of plasma proteins related to bone metabolism.67,69 The seemingly contradictory results mentioned above suggest that the role of CTSD in bone metabolism may be context-dependent, and its specific regulatory mechanisms require further investigation. Furthermore, the apparent discrepancy in CTSD mRNA levels between the public transcriptomic data and our experimental validation may stem from multiple factors. First, as a lysosomal aspartic protease, CTSD synthesis requires signal peptide cleavage, glycosylation, and multiple proteolytic cleavages to transition from an inactive proenzyme to a mature enzyme.56,57 Consequently, mRNA abundance does not always parallel its proteolytic activity. Second, the cellular composition may vary across different datasets; since CTSD expression patterns can differ among immune cell subsets, this could affect the comparability of transcriptomic results. More importantly, the function of CTSD in bone metabolism primarily depends on its enzymatic activity rather than its transcriptional level. CTSD can degrade non-collagenous proteins in the bone matrix and promote osteoclast-mediated bone resorption,63 and animal studies have confirmed that CtsD deficiency leads to a significant decrease in bone mass.61,62 Therefore, the significantly elevated serum CTSD activity observed in OP patients in our study (via ELISA) provides more direct functional evidence than mRNA trends, supporting the rationale for its use as a candidate biomarker. Notably, regarding the specificity of JUN and CTSD, it is necessary to carefully delineate their value as biomarkers for osteoporosis (OP) from their broader associations with systemic inflammation or aging. As a core member of the AP-1 transcription factor family, JUN promotes inflammatory bone erosion in rheumatoid arthritis (RA) by regulating COX2 expression in macrophages, and the JNK/c-Jun signaling pathway is highly activated in RA synovial fibroblasts.70,71 However, its function in bone metabolism exhibits a cell type-dependent dual regulatory pattern. In osteoblast precursors, JUN significantly upregulates RUNX2 expression to drive osteogenic differentiation,55,72 whereas in an inflammatory microenvironment, c-Jun phosphorylation may enhance osteoclast activity.73 This functional duality suggests that the altered expression of JUN in OP must be interpreted within the context of bone-specific cells. Similarly, although CTSD, a lysosomal protease, is found at reduced levels in the plasma of Alzheimer’s disease (AD) patients and has been explored as a potential AD biomarker,74 its regulation in bone tissue may be unique. Yan et al demonstrated that CTSD is differentially expressed in the bone tissue of OP patients. Recombinant human CTSD downregulates the expression of osteogenic markers (ALP, RUNX2, and COL1A1), and exogenous CTSD reduces bone mineral density in mice, mimicking the phenotype of the ovariectomized (OVX) model.67 Furthermore, CTSD knockout mice also exhibit a significant reduction in bone mass.75 Collectively, these findings indicate that despite the involvement of JUN and CTSD in broad physiological and pathological processes, their expression and functions in bone tissue may be tissue-specific. Therefore, their value as OP biomarkers requires validation through bone microenvironment-specific assessments and large-scale cohort studies, rather than being simply attributed to concomitant systemic inflammation or aging.
To further explore the potential mechanisms of CTSD and JUN in OP, we performed pathway enrichment analysis. The results showed that both were significantly enriched in pathways related to ribosomes, proteasomes, lysosomes, spliceosomes, and Parkinson’s disease (PD). Notably, these pathways are closely related to intracellular protein homeostasis, suggesting that CTSD and JUN may show correlation with the pathogenesis of OP by synergistically regulating protein synthesis, folding, degradation, and RNA splicing. Previous studies have reported that various ribosomal proteins can affect bone metabolism, including RPS17, RPS12, RPL31, RPL34, and PRL29.76–79 These proteins may affect ribosome biogenesis and protein translation speed which can promote the translation of osteoblast differentiation-related factors, while inhibition of ribosome assembly can reduce osteoblast activity.80,81 The regulatory mechanism involved is currently unclear, but some researchers speculate that it may be related to inflammation activation or the impact of protein translation efficiency relating to bone formation and the bone microenvironment.76,79 Researchers have proposed that there are some similarities in the pathogenesis of PD and OP.82 Although less studied, PD-related pathways have some evidence suggesting that proteins like α-synuclein may influence bone remodeling via the circulatory system or bone marrow microenvironment.83 Furthermore, the improved bone microstructure observed in LRRK2 knockout mice suggests a possible interaction between this pathway and Wnt signaling.84
The proteasome and lysosomal pathways are closely related to bone metabolism, and their correlations have been extensively reported in many studies. Currently, several proteasome inhibitors (PIs) have been reported to control the degradation of key proteins in osteoblast differentiation, thereby promoting bone anabolism and stimulating osteoblast differentiation and fracture healing. Furthermore, studies have shown that PIs can also effectively prevent osteocyte death, thus reducing bone tissue loss.85 Lysosomes are closely related to various bone cell functions and bone metabolism. Specifically, the process that osteoblasts maintains mineralization rely on lysosome-mediated matrix vesicle transport and ECM component recycling. Osteoclasts inducing bone resorption rely on lysosome-driven acidification and protease release. Osteocytes utilize the lysosome-autophagy axis to maintain the patency of the lacunar-canalicular network and maintain responsiveness to microenvironmental signals.86–88 Splicing pathways primarily affect bone metabolism by regulating the transcription of key regulatory proteins in osteoblasts or osteoclasts. Existing studies have identified and validated several splice variants associated with key osteoblastogenesis or osteoclastogenesis proteins, such as TAF4, CBFB2, vRANK, and Bcl-xl.89 Considering the molecular characteristics of CTSD as a lysosomal protease and JUN as a transcription factor, we hypothesize that CTSD may directly participate in bone matrix degradation and osteoclast activation through the lysosomal pathway, while JUN may regulate the translation and splicing of osteogenesis-related genes through the ribosome/spliceosome pathway. Their co-enrichment in these pathways suggests they may form a functional axis that coordinately regulates the OP process. This finding provides a new direction for further in-depth studies on the specific molecular mechanisms of CTSD and JUN in OP.
The results of immune infiltration analysis in this study suggest a significant difference between the OP group and the control group in the infiltration levels of activated dendritic cells (DCs) and mast cells (MCs). Further analysis indicated that both immune cell types were positively correlated with JUN and CTSD, suggesting that these two biomarkers may participate in the immunopathological process of OP by regulating these cells. DCs are classified as part of the innate immune system. Their primary role is as antigen-presenting cells (APCs), enabling them to recognize pathogens, activate through antigen processing, migrate, present antigens to naive T cells, and secrete cytokines.90 In bone metabolism, DCs are closely related to osteoclasts: both originate from hematopoietic stem cells, exhibit highly overlapping gene expression profiles, and share the same surface markers.91 Under stimulation by inflammatory factors, immature DCs can transdifferentiate into osteoclasts under specific conditions. Conversely, osteoclastic products released from bone destruction areas can also promote the differentiation and activation of immature DCs, forming a feedback loop regulating bone metabolism.92 MCs are immune cells within tissues, originating from pluripotent precursor cells in the bone marrow. MCs precursors migrate into tissues where they differentiate and mature.93 Current research suggests that MCs play a bidirectional regulatory role in bone metabolism: on the one hand, activated mature MCs can rapidly release inflammatory mediators such as histamine and IL-6, enhancing osteoclast activity and promoting bone destruction.94 On the other hand, MCs can also secrete factors such as TGF-β, IL-12, and IFN-γ, enhancing osteoblast activity and inhibiting osteoclasts, thereby exerting a bone-protective effect.95,96 This functional duality suggests that the role of MCs in OP may depend on the dynamic balance of local microenvironmental signals. In summary, the positive correlation between JUN and activated DCs and MCs in this study, combined with the critical roles of these two immune cells in bone metabolism, suggests that JUN may participate in the immunomodulatory network of OP by regulating the function of DCs and MCs. In contrast, CTSD exhibits weaker correlations with these immune cells, suggesting its role might be more confined to processes such as lysosome-mediated antigen processing or bone matrix degradation, rather than direct immune regulation. This finding provides a new entry point for a deeper understanding of the molecular mechanisms of JUN in OP.
Through scRNA-seq analysis, this study identifies BM-MSCs as a critical cell type in the pathogenesis of OP. Consistent with other research, the imbalance in osteogenic and adipogenic differentiation of BM-MSCs is considered a core component of OP development.97–99 This study reveals a dynamic expression pattern of the biomarker JUN during BM-MSC differentiation. We guess that c-Jun overexpression may activates the NF-κB pathway under inflammatory or pathological conditions, inhibiting the activity of the key osteogenic transcription factor RUNX2, thereby impairing osteogenic differentiation and promoting adipogenic differentiation.100 Targeting and inhibiting c-Jun overactivation can restore the osteogenic capacity of BM-MSCs and improve BMD in OP model mice.101 These findings showed that JUN can be a a potential candidate for therapeutic exploration for OP. However, the scRNA-seq analysis in this study was based on a single OP sample. Consequently, the identified cellular subpopulation dynamics, pseudotime trajectories, and transcription factor regulatory networks are exploratory in nature. The generalizability and mechanistic interpretability of these findings must be validated in larger-scale single-cell cohorts.
In conclusion, as a preliminary exploratory study, this research integrated single-cell RNA sequencing, machine learning, and bulk transcriptomic data to screen and preliminarily validate JUN and CTSD as genetic biomarkers for osteoporosis (OP). Bioinformatic analyses suggested an association between these two genes and bone metabolism-related pathways as well as the immune microenvironment, while single-cell data revealed their expression characteristics during bone marrow mesenchymal stem cell differentiation. However, this study has several important limitations. First, the single-cell sequencing data were derived from only one OP patient. This extremely small sample size fails to represent the cellular heterogeneity of the OP population; thus, the resulting findings, such as cell-cell communication, should be regarded as exploratory. Second, due to the cross-sectional study design, this study can only reveal concurrent associations between variables. It cannot establish causality, nor can it infer the temporal evolution of the disease or predict individual-level risks of disease progression. Third, the current findings remain preliminary. All results are based on computational and correlational evidence, and their clinical significance and therapeutic value require validation through independent cohorts and experimental studies. They should not be overinterpreted as directly translatable clinical diagnostic or therapeutic strategies.
Overall, the primary significance of this study lies in providing novel candidate targets and testable hypotheses for the investigation of the molecular mechanisms underlying OP. Future research urgently requires large-scale, multicenter prospective cohort studies to validate the stability and reproducibility of these biomarkers over a longitudinal timeframe. Concurrently, it is necessary to expand the sample size for single-cell sequencing to include more OP patients and diverse clinical phenotypic subgroups, thereby comprehensively assessing cellular heterogeneity and verifying the generalizability of our findings. Furthermore, in vivo and in vitro functional experiments are essential to elucidate the specific mechanisms of JUN and CTSD in bone metabolism, allowing for a rigorous assessment of their clinical translational potential.
Conclusions
This preliminary exploratory study integrated bulk transcriptomic analysis, single-cell RNA sequencing, and machine learning algorithms to identify JUN and CTSD as plasma protein-related gene biomarkers for OP. Bioinformatic analyses revealed that these two biomarkers are significantly enriched in pathways related to ribosomes, proteasomes, lysosomes, and spliceosomes, suggesting their potential involvement in protein homeostasis regulation during OP pathogenesis. Immune infiltration analysis demonstrated positive correlations between JUN and activated dendritic cells and mast cells. Single-cell characterization further revealed distinct expression dynamics of JUN and CTSD during BM-MSCs differentiation, providing cellular context for their roles in bone metabolism. Experimental validation via RT-qPCR and ELISA confirmed elevated CTSD expression and activity in OP patients. Nevertheless, these findings are derived from computational and correlational evidence with limited sample sizes, and their clinical translational potential requires further validation through large-scale prospective cohorts and functional experiments.
Abbreviations
AUC, Area Under the Curve; BMD, Bone Mineral Density; BM-MSCs, Bone Marrow Mesenchymal Stem Cells; CTSD, Cathepsin D; DCs, Dendritic Cells; DEGs, Differentially Expressed Genes; EGFR, Epidermal Growth Factor Receptor; ELISA, Enzyme-Linked Immunosorbent Assay; FDR, False Discovery Rate; GEO, Gene Expression Omnibus; GO, Gene Ontology; GSEA, Gene Set Enrichment Analysis; GSVA, Gene Set Variation Analysis; hdWGCNA, High-Dimensional Weighted Gene Co-Expression Network Analysis; JUN, Jun Proto-Oncogene; KEGG, Kyoto Encyclopedia of Genes and Genomes; LASSO, Least Absolute Shrinkage and Selection Operator; MCs, Mast Cells; NES, Normalized Enrichment Score; NK cells, Natural Killer Cells; OP, Osteoporosis; PCA, Principal Component Analysis; PCs, Principal Components; PPI, Protein-Protein Interaction; PRGs, Plasma Protein-Related Genes; RT-qPCR, Reverse Transcription Quantitative Polymerase Chain Reaction; scRNA-seq, Single-Cell RNA Sequencing; SVM-RFE, Support Vector Machine – Recursive Feature Elimination; TFs, Transcription Factors; t-SNE, t-Distributed Stochastic Neighbor Embedding.
Data Sharing Statement
The datasets (GSE147287, GSE56815 and GSE2208) supporting the conclusions of this article are available in the [GEO] repository, [http://www.ncbi.nlm.nih.gov/geo/].
Ethics Approval and Informed Consent
This research was performed in compliance with the Declaration of Helsinki. The Ethics Committee of Zhejiang Provincial People’s Hospital sanctioned the study, assigning approval number ZJPPHEC 2026O (057). This study utilized fully anonymized data containing no personally identifiable images, with an informed consent approved by the Ethics Committee.
Acknowledgments
We would like to express our sincere gratitude to all individuals who supported and assisted us throughout this research. This work was supported by the National Natural Science Foundation of China, Grant/Award Number: 82200985; The Zhejiang Provincial Medical and Health Science and Technology Plan: 202569404. These funding sources were obtained by Xiaoting Chen.
Author Contributions
All authors made a significant contribution to the work reported, whether that is in the conception, study design, execution, acquisition of data, analysis and interpretation, or in all these areas; took part in drafting, revising or critically reviewing the article; gave final approval of the version to be published; have agreed on the journal to which the article has been submitted; and agree to be accountable for all aspects of the work.
Funding
This work was supported by the National Natural Science Foundation of China, Grant/Award Number: 82200985; The Zhejiang Provincial Medical and Health Science and Technology Plan: 2025KY643.
Disclosure
The authors declare that they have no competing interests in this work.
References
1. Reid IR, Billington EO. Drug therapy for osteoporosis in older adults. Lancet. 2022;399(10329):1080–26. doi:10.1016/S0140-6736(21)02646-5
2. Fuggle NR, Beaudart C, Bruyère O, et al. Evidence-based guideline for the management of osteoporosis in men. Nat Rev Rheumatol. 2024;20(4):241–251. doi:10.1038/s41584-024-01094-9
3. Li Z, Zhang W, Huang Y. MiRNA-133a is involved in the regulation of postmenopausal osteoporosis through promoting osteoclast differentiation. Acta Biochim Biophys Sin. 2018;50(3):273–280. doi:10.1093/abbs/gmy006
4. Messina C, Bandirali M, Sconfienza LM, et al. Prevalence and type of errors in dual-energy x-ray absorptiometry. Eur Radiol. 2015;25(5):1504–1511. doi:10.1007/s00330-014-3509-y
5. Johnston CB, Dagar M. Osteoporosis in Older Adults. Med Clin North Am. 2020;104(5):873–884. doi:10.1016/j.mcna.2020.06.004
6. Tuersong T, Yong YX, Chen Y, et al. Integrating plasma circulating protein-centered multi-omics to identify potential therapeutic targets for Parkinsonian cognitive disorders. J Transl Med. 2025;23(1):535. doi:10.1186/s12967-025-06541-z
7. Jiang Y, Zhou X, Ip FC, et al. Large-scale plasma proteomic profiling identifies a high-performance biomarker panel for Alzheimer’s disease screening and staging. Alzheimers Dement. 2022;18(1):88–102. doi:10.1002/alz.12369
8. Wang JH, Dong SS, Huang W, et al. Blood plasma proteome-wide association study implicates novel proteins in the pathogenesis of multiple cardiovascular diseases. Cardiovasc Diabetol. 2025;24(1):312. doi:10.1186/s12933-025-02847-w
9. Xu J, Cai X, Miao Z, et al. Proteome-wide profiling reveals dysregulated molecular features and accelerated aging in osteoporosis: a 9.8-year prospective study. Aging Cell. 2024;23(2):e14035. doi:10.1111/acel.14035
10. Al-Ansari MM, Aleidi SM, Masood A, et al. Proteomics profiling of osteoporosis and osteopenia patients and associated network analysis. Int J Mol Sci. 2022;23(17):10200. doi:10.3390/ijms231710200
11. Wu Z, Yang KG, Lam TP, Cheng JCY, Zhu Z, Lee WY. Genetic insight into the putative causal proteins and druggable targets of osteoporosis: a large-scale proteome-wide mendelian randomization study. Front Genet. 2023;14:1161817. doi:10.3389/fgene.2023.1161817
12. Zheng Y, Li J, Li Y, et al. Plasma proteomic profiles reveal proteins and three characteristic patterns associated with osteoporosis: a prospective cohort study. J Adv Res. 2025;75:491–503. doi:10.1016/j.jare.2024.10.019
13. Chen C, Zeng Q, Ye Q, Jin F. Risk relationship between osteoporosis and plasma proteins. Medicine. 2025;104(35):e44105. doi:10.1097/MD.0000000000044105
14. Song S, Guo Y, Yang Y, Fu D. Advances in pathogenesis and therapeutic strategies for osteoporosis. Pharmacol Ther. 2022;237:108168. doi:10.1016/j.pharmthera.2022.108168
15. Zhivodernikov IV, Kirichenko TV, Markina YV, Postnov AY, Markin AM. Molecular and cellular mechanisms of osteoporosis. Int J Mol Sci. 2023;24(21):15772. doi:10.3390/ijms242115772
16. Ma J, Wen J, Qiu Y, et al. The regional impact of exercise on bone density in older adults: a meta-analysis with molecular mechanism insights. Geriatr Nurs. 2025;65:103451. doi:10.1016/j.gerinurse.2025.103451
17. Dai S, Chen Z, Liu X, et al. Exercise-mediated mechanical stress promotes osteogenic differentiation of BMSCs through upregulation of lactylation via the IER3/LDHB axis. FASEB J. 2025;39(8):e70537. doi:10.1096/fj.202403157R
18. Özüdoğru A, Gelecek N. Effects of closed and open kinetic chain exercises on pain, muscle strength, function, and quality of life in patients with knee osteoarthritis. Rev Assoc Med Bras. 2023;69(7):e20230164. doi:10.1590/1806-9282.20230164
19. Cyr-Depauw C, Mižik I, Cook DP, et al. Single-cell RNA sequencing to guide autologous preterm cord mesenchymal stromal cell therapy. Am J Respir Crit Care Med. 2025;211(3):391–406. doi:10.1164/rccm.202403-0569OC
20. Satija R, Farrell JA, Gennert D, Schier AF, Regev A. Spatial reconstruction of single-cell gene expression data. Nat Biotechnol. 2015;33(5):495–502. doi:10.1038/nbt.3192
21. Wang Z, Li X, Yang J, et al. Single-cell RNA sequencing deconvolutes the in vivo heterogeneity of human bone marrow-derived mesenchymal stem cells. Int J Biol Sci. 2021;17(15):4192–4206. doi:10.7150/ijbs.61950
22. Kim N, Kim HK, Lee K, et al. Single-cell RNA sequencing demonstrates the molecular and cellular reprogramming of metastatic lung adenocarcinoma. Nat Commun. 2020;11(1):2285. doi:10.1038/s41467-020-16164-1
23. Salcher S, Sturm G, Horvath L, et al. High-resolution single-cell atlas reveals diversity and plasticity of tissue-resident neutrophils in non-small cell lung cancer. Cancer Cell. 2022;40(12):1503–1520.e8. doi:10.1016/j.ccell.2022.10.008
24. Dong Q, Fu H, Li W, et al. Nuclear farnesoid X receptor protects against bone loss by driving osteoblast differentiation through stabilizing RUNX2. Bone Res. 2025;13(1):20. doi:10.1038/s41413-024-00394-w
25. Ruan B, Dong J, Wei F, et al. DNMT aberration-incurred GPX4 suppression prompts osteoblast ferroptosis and osteoporosis. Bone Res. 2024;12(1):68. doi:10.1038/s41413-024-00365-1
26. Morabito S, Reese F, Rahimzadeh N, Miyoshi E, Swarup V. hdWGCNA identifies co-expression networks in high-dimensional transcriptomics data. Cell Rep Methods. 2023;3(6):100498. doi:10.1016/j.crmeth.2023.100498
27. Van de Sande B, Flerin C, Davie K, et al. A scalable SCENIC workflow for single-cell gene regulatory network analysis. Nat Protoc. 2020;15(7):2247–2276. doi:10.1038/s41596-020-0336-2
28. Ritchie ME, Phipson B, Wu D, et al. limma powers differential expression analyses for RNA-sequencing and microarray studies. Nucleic Acids Res. 2015;43(7):e47. doi:10.1093/nar/gkv007
29. Garreta E, Prado P, Stanifer ML, et al. A diabetic milieu increases ACE2 expression and cellular susceptibility to SARS-CoV-2 infections in human kidney organoids and patient cells. Cell Metab. 2022;34(6):857–873.e9. doi:10.1016/j.cmet.2022.04.009
30. Zheng Y, Gao W, Zhang Q, et al. Ferroptosis and autophagy-related genes in the pathogenesis of ischemic cardiomyopathy. Front Cardiovasc Med. 2022;9:906753. doi:10.3389/fcvm.2022.906753
31. Yu G, Wang LG, Han Y, He QY. clusterProfiler: an R package for comparing biological themes among gene clusters. Omics. 2012;16(5):284–287. doi:10.1089/omi.2011.0118
32. Gu Z, Gu L, Eils R, Schlesner M, Brors B. circlize implements and enhances circular visualization in R. Bioinformatics. 2014;30(19):2811–2812. doi:10.1093/bioinformatics/btu393
33. Liu P, Xu H, Shi Y, Deng L, Chen X. Potential molecular mechanisms of plantain in the treatment of gout and hyperuricemia based on network pharmacology. Evid Based Complement Alternat Med. 2020;2020:3023127. doi:10.1155/2020/3023127
34. Li Y, Lu F, Yin Y. Applying logistic LASSO regression for the diagnosis of atypical Crohn’s disease. Sci Rep. 2022;12(1):11340. doi:10.1038/s41598-022-15609-5
35. Zhang Z, Zhao Y, Canes A, Steinberg D, Lyashevska O. Predictive analytics with gradient boosting in clinical medicine. Ann Transl Med. 2019;7(7):152. doi:10.21037/atm.2019.03.29
36. Alderden J, Pepper GA, Wilson A, et al. Predicting pressure injury in critical care patients: a machine-learning model. Am J Crit Care. 2018;27(6):461–468. doi:10.4037/ajcc2018525
37. Sachs MC. plotROC: a tool for plotting ROC curves. J Stat Softw. 2017;79. doi:10.18637/jss.v079.c02
38. Liu C, He Y, Luo J. Application of chest CT imaging feature model in distinguishing squamous cell carcinoma and adenocarcinoma of the lung. Cancer Manag Res. 2024;16:547–557. doi:10.2147/CMAR.S462951
39. Robin X, Turck N, Hainard A, et al. pROC: an open-source package for R and S+ to analyze and compare ROC curves. BMC Bioinf. 2011;12:77. doi:10.1186/1471-2105-12-77
40. Orifjon S, Jammatov J, Sousa C, Barros R, Vasconcelos O, Rodrigues P. Translation and adaptation of the adult developmental coordination disorder/dyspraxia checklist (ADC) into Asian Uzbekistan. Sports. 2023;11(7). doi:10.3390/sports11070135
41. Hänzelmann S, Castelo R, Guinney J. GSVA: gene set variation analysis for microarray and RNA-seq data. BMC Bioinf. 2013;14:7. doi:10.1186/1471-2105-14-7
42. Li H, Li N, Wang H, et al. Comprehensive analysis of immune infiltration, gene correlations, and traditional Chinese medicine in lung adenocarcinoma. Int J Biol Macromol. 2025;321(Pt 1):146177. doi:10.1016/j.ijbiomac.2025.146177
43. Zhang H, Meltzer P, Davis S. RCircos: an R package for Circos 2D track plots. BMC Bioinf. 2013;14:244. doi:10.1186/1471-2105-14-244
44. Chen Q, Su L, Liu C, et al. PRKAR1A and SDCBP serve as potential predictors of heart failure following acute myocardial infarction. Front Immunol. 2022;13:878876. doi:10.3389/fimmu.2022.878876
45. Du J, Yuan X, Deng H, et al. Single-cell and spatial heterogeneity landscapes of mature epicardial cells. J Pharm Anal. 2023;13(8):894–907. doi:10.1016/j.jpha.2023.07.011
46. Aibar S, González-Blas CB, Moerman T, et al. SCENIC: single-cell regulatory network inference and clustering. Nat Methods. 2017;14(11):1083–1086. doi:10.1038/nmeth.4463
47. Chen X, Wu M, Liang N, Lu J, Qu S, Chen H. Thyroid hormone-regulated expression of period2 promotes liver urate production. Front Cell Dev Biol. 2021;9:636802. doi:10.3389/fcell.2021.636802
48. Liu CM, Shen HT, Lin YA, et al. Antiproliferative and antimetastatic effects of praeruptorin c on human non-small cell lung cancer through inactivating ERK/CTSD signalling pathways. Molecules. 2020;25(7). doi:10.3390/molecules25071625
49. Miao L, Yin RX, Huang F, Yang S, Chen WX, Wu JZ. Integrated analysis of gene expression changes associated with coronary artery disease. Lipids Health Dis. 2019;18(1):92. doi:10.1186/s12944-019-1032-5
50. Tian RC, Zhang RY, Ma CF. Rejuvenation of bone marrow mesenchymal stem cells: mechanisms and their application in senile osteoporosis treatment. Biomolecules. 2025;15(2):276. doi:10.3390/biom15020276
51. Tong Y, Tu Y, Wang J, et al. Mechanisms and therapeutic strategies linking mesenchymal stem cells senescence to osteoporosis. Front Endocrinol. 2025;16:1625806. doi:10.3389/fendo.2025.1625806
52. Aparicio-Bautista DI, Becerra-Cervera A, Rivera-Paredez B, et al. Label-free quantitative proteomics in serum reveals candidate biomarkers associated with low bone mineral density in Mexican postmenopausal women. Geroscience. 2024;46(2):2177–2195. doi:10.1007/s11357-023-00977-1
53. Liang X, Du Y, Wen Y, et al. Assessing the genetic correlations between blood plasma proteins and osteoporosis: a polygenic risk score analysis. Calcif Tissue Int. 2019;104(2):171–181. doi:10.1007/s00223-018-0483-4
54. Wernig G, Chen SY, Cui L, et al. Unifying mechanism for different fibrotic diseases. Proc Natl Acad Sci U S A. 2017;114(18):4757–4762. doi:10.1073/pnas.1621375114
55. Lerbs T, Cui L, Muscat C, et al. Expansion of bone precursors through jun as a novel treatment for osteoporosis-associated fractures. Stem Cell Reports. 2020;14(4):603–613. doi:10.1016/j.stemcr.2020.02.009
56. Wang CC, Weng JJ, Chen HC, Lee MC, Ko PS, Su SL. Differential gene expression orchestrated by transcription factors in osteoporosis: bioinformatics analysis of associated polymorphism elaborating functional relationships. Aging. 2022;14(12):5163–5176. doi:10.18632/aging.204136
57. Zhang X, Chen K, Chen X, et al. Integrative analysis of genomics and transcriptome data to identify regulation networks in female osteoporosis. Front Genet. 2020;11:600097. doi:10.3389/fgene.2020.600097
58. Xu R, Zhang C, Shin DY, et al. c-Jun N-Terminal Kinases (JNKs) are critical mediators of osteoblast activity in vivo. J Bone Miner Res. 2017;32(9):1811–1815. doi:10.1002/jbmr.3184
59. Jafri Z, Li Y, Zhang J, O’Meara CH, Khachigian LM. Jun, an oncological foe or friend? Int J Mol Sci. 2025;26(2):555. doi:10.3390/ijms26020555
60. Su H, Liang L, Wang J, Yuan X, Zhao B. ZFP36, an RNA-binding protein promotes hBMSCs osteogenic differentiation via binding with JUN. J Orthop Surg Res. 2024;19(1):758. doi:10.1186/s13018-024-05232-7
61. Stoka V, Turk V, Turk B. Lysosomal cathepsins and their regulation in aging and neurodegeneration. Ageing Res Rev. 2016;32:22–37. doi:10.1016/j.arr.2016.04.010
62. Faust PL, Kornfeld S, Chirgwin JM. Cloning and sequence analysis of cDNA for human cathepsin D. Proc Natl Acad Sci U S A. 1985;82(15):4910–4914. doi:10.1073/pnas.82.15.4910
63. Khalkhali-Ellis Z, Hendrix MJ. Two faces of cathepsin D: physiological guardian angel and pathological demon. Biol Med. 2014;6(2). doi:10.4172/0974-8369.1000206
64. Di YQ, Han XL, Kang XL, et al. Autophagy triggers CTSD (cathepsin D) maturation and localization inside cells to promote apoptosis. Autophagy. 2021;17(5):1170–1192. doi:10.1080/15548627.2020.1752497
65. Deng YX, He WG, Cai HJ, et al. Analysis and validation of hub genes in blood monocytes of postmenopausal osteoporosis patients. Front Endocrinol. 2021;12:815245. doi:10.3389/fendo.2021.815245
66. Wang X, Pei Z, Hao T, et al. Prognostic analysis and validation of diagnostic marker genes in patients with osteoporosis. Front Immunol. 2022;13:987937. doi:10.3389/fimmu.2022.987937
67. Yan S, Zeng J, Dong W, Wei J. In vivo and in vitro analysis of cathepsin D in bone homeostasis and osteoporosis. J Musculoskelet Neuronal Interact. 2025;25(3):341–350. doi:10.22540/JMNI-25-341
68. Sun C, He W, Wang L, et al. Studies on the role of MAP4K2, SPI1, and CTSD in osteoporosis. Cell Biochem Biophys. 2025;83(2):2115–2126. doi:10.1007/s12013-024-01621-1
69. Goto T, Yamaza T, Tanaka T. Cathepsins in the osteoclast. J Electron Microsc. 2003;52(6):551–558. doi:10.1093/jmicro/52.6.551
70. Hannemann N, Jordan J, Paul S, et al. The AP-1 transcription factor c-Jun promotes arthritis by regulating cyclooxygenase-2 and arginase-1 expression in macrophages. J Immunol. 2017;198(9):3605–3614. doi:10.4049/jimmunol.1601330
71. Zenz R, Eferl R, Scheinecker C, et al. Activator protein 1 (Fos/Jun) functions in inflammatory bone and skin disease. Arthritis Res Ther. 2008;10(1):201. doi:10.1186/ar2338
72. Fu L, Peng S, Wu W, Ouyang Y, Tan D, Fu X. LncRNA HOTAIRM1 promotes osteogenesis by controlling JNK/AP-1 signalling-mediated RUNX2 expression. J Cell Mol Med. 2019;23(11):7517–7524. doi:10.1111/jcmm.14620
73. David JP, Sabapathy K, Hoffmann O, Idarraga MH, Wagner EF. JNK1 modulates osteoclastogenesis through both c-Jun phosphorylation-dependent and -independent mechanisms. J Cell Sci. 2002;115(Pt 22):4317–4325. doi:10.1242/jcs.00082
74. Kim JW, Jung SY, Kim Y, et al. Identification of cathepsin D as a plasma biomarker for Alzheimer’s disease. Cells. 2021;10(1):138.
75. Tuan RS, Zhang Y, Chen L, et al. Current progress and trends in musculoskeletal research: highlights of NSFC-CUHK academic symposium on bone and joint degeneration and regeneration. J Orthop Translat. 2022;37:175–184. doi:10.1016/j.jot.2022.12.001
76. Ke D, Dai H, Han J, et al. Human peripheral osteoclast-precursor-development patterns reveal the significance of RPS17-dependent ribosome synthesis to Ankylosing Spondylitis lesions. Bone Res. 2025;13(1):100. doi:10.1038/s41413-025-00474-5
77. Zhang Y, Kong Y, Zhang W, et al. METTL3 promotes osteoblast ribosome biogenesis and alleviates periodontitis. Clin Clin Epigenet. 2024;16(1):18. doi:10.1186/s13148-024-01628-8
78. Zhou X, Chen Y, Zhang Z, Miao J, Chen G, Qian Z. Identification of differentially expressed genes, signaling pathways and immune infiltration in postmenopausal osteoporosis by integrated bioinformatics analysis. Heliyon. 2024;10(1):e23794. doi:10.1016/j.heliyon.2023.e23794
79. Oristian DS, Sloofman LG, Zhou X, Wang L, Farach-Carson MC, Kirn-Safran CB. Ribosomal protein L29/Hip deficiency delays osteogenesis and increases fragility of adult bone in mice. J Orthop Res. 2009;27(1):28–35. doi:10.1002/jor.20706
80. Trainor PA, Merrill AE. Ribosome biogenesis in skeletal development and the pathogenesis of skeletal disorders. Biochim Biophys Acta. 2014;1842(6):769–778. doi:10.1016/j.bbadis.2013.11.010
81. Gallage S, Irvine EE, Barragan Avila JE, et al. Ribosomal S6 kinase 1 regulates inflammaging via the senescence secretome. Nat Aging. 2024;4(11):1544–1561. doi:10.1038/s43587-024-00695-z
82. Figueroa CA, Rosen CJ. Parkinson’s disease and osteoporosis: basic and clinical implications. Expert Rev Endocrinol Metab. 2020;15(3):185–193. doi:10.1080/17446651.2020.1756772
83. Reid IR, Bolland MJ, Grey A. Effects of vitamin D supplements on bone mineral density: a systematic review and meta-analysis. Lancet. 2014;383(9912):146–155. doi:10.1016/S0140-6736(13)61647-5
84. Berwick DC, Javaheri B, Wetzel A, et al. Pathogenic LRRK2 variants are gain-of-function mutations that enhance LRRK2-mediated repression of β-catenin signaling. Mol Neurodegener. 2017;12(1):9. doi:10.1186/s13024-017-0153-4
85. Fan X, Zhang R, Xu G, et al. Role of ubiquitination in the occurrence and development of osteoporosis (Review). Int J Mol Med. 2024;54(2). doi:10.3892/ijmm.2024.5392
86. Lee SH, Jang JS, Mo S, Kim HH. TMEM175 plays a crucial role in osteoblast differentiation by regulating lysosomal function and autophagy. Mol Cells. 2024;47(11):100127. doi:10.1016/j.mocell.2024.100127
87. Zhou C, Hu X, Jing Y, et al. Bidirectional crosstalk between the bone extracellular matrix and lysosomes in bone remodeling and osteoporosis. Front Endocrinol. 2025;16:1698404. doi:10.3389/fendo.2025.1698404
88. Wang J, Zhang Y, Cao J, et al. The role of autophagy in bone metabolism and clinical significance. Autophagy. 2023;19(9):2409–2427. doi:10.1080/15548627.2023.2186112
89. Cao L, Hu Y, Jia K, et al. Alternative Splicing: a critical regulator in human bone biology and tumor progression. Research. 2025;8:0977. doi:10.34133/research.0977
90. Soedono S, Cho KW. Adipose tissue dendritic cells: critical regulators of obesity-induced inflammation and insulin resistance. Int J Mol Sci. 2021;22(16):8666. doi:10.3390/ijms22168666
91. Puchner A, Simader E, Saferding V, et al. Bona fide dendritic cells are pivotal precursors for osteoclasts. Ann Rheum Dis. 2024;83(4):518–528. doi:10.1136/ard-2022-223817
92. Wang B, Dong Y, Tian Z, Chen Y, Dong S. The role of dendritic cells derived osteoclasts in bone destruction diseases. Genes Dis. 2021;8(4):401–411. doi:10.1016/j.gendis.2020.03.009
93. Krystel-Whittemore M, Dileepan KN, Wood JG. Mast cell: a multi-functional master cell. Front Immunol. 2015;6:620. doi:10.3389/fimmu.2015.00620
94. Ragipoglu D, Dudeck A, Haffner-Luntzer M, et al. The role of mast cells in bone metabolism and bone disorders. Front Immunol. 2020;11:163. doi:10.3389/fimmu.2020.00163
95. Xia J, Sheng W, Pei L, et al. Effects of unfractionated heparin and rivaroxaban on the expression of heparanase and fibroblast growth factor 2 in human osteoblasts. Mol Med Rep. 2017;16(1):361–366. doi:10.3892/mmr.2017.6570
96. Prystaz K, Kaiser K, Kovtun A, et al. Distinct effects of IL-6 classic and trans-signaling in bone fracture healing. Am J Pathol. 2018;188(2):474–490. doi:10.1016/j.ajpath.2017.10.011
97. Robert AW, Marcon BH, Dallagiovanna B, Shigunov P. Adipogenesis, osteogenesis, and chondrogenesis of human mesenchymal stem/stromal cells: a comparative transcriptome approach. Front Cell Dev Biol. 2020;8:561. doi:10.3389/fcell.2020.00561
98. Cawthorn WP, Scheller EL, Learman BS, et al. Bone marrow adipose tissue is an endocrine organ that contributes to increased circulating adiponectin during caloric restriction. Cell Metab. 2014;20(2):368–375. doi:10.1016/j.cmet.2014.06.003
99. Cheng YH, Dong JC, Bian Q. Small molecules for mesenchymal stem cell fate determination. World J Stem Cells. 2019;11(12):1084–1103. doi:10.4252/wjsc.v11.i12.1084
100. Zhao X, Zhang G, Wu L, Tang Y, Guo C. Inhibition of ER stress-activated JNK pathway attenuates TNF-α-induced inflammatory response in bone marrow mesenchymal stem cells. Biochem Biophys Res Commun. 2021;541:8–14. doi:10.1016/j.bbrc.2020.12.101
101. Kusuyama J, Amir MS, Albertson BG, et al. JNK inactivation suppresses osteogenic differentiation, but robustly induces osteopontin expression in osteoblasts through the induction of inhibitor of DNA binding 4 (Id4). FASEB J. 2019;33(6):7331–7347. doi:10.1096/fj.201802465R
 © 2026 The Author(s). This work is published and licensed by Dove Medical Press Limited. The
full terms of this license are available at https://www.dovepress.com/terms
and incorporate the Creative Commons Attribution
- Non Commercial (unported, 4.0) License.
By accessing the work you hereby accept the Terms. Non-commercial uses of the work are permitted
without any further permission from Dove Medical Press Limited, provided the work is properly
attributed. For permission for commercial use of this work, please see paragraphs 4.2 and 5 of our Terms.
© 2026 The Author(s). This work is published and licensed by Dove Medical Press Limited. The
full terms of this license are available at https://www.dovepress.com/terms
and incorporate the Creative Commons Attribution
- Non Commercial (unported, 4.0) License.
By accessing the work you hereby accept the Terms. Non-commercial uses of the work are permitted
without any further permission from Dove Medical Press Limited, provided the work is properly
attributed. For permission for commercial use of this work, please see paragraphs 4.2 and 5 of our Terms.
Recommended articles

Development of Machine Learning Models for Predicting Osteoporosis in Patients with Type 2 Diabetes Mellitus—A Preliminary Study
Wu X, Zhai F, Chang A, Wei J, Guo Y, Zhang J
Diabetes, Metabolic Syndrome and Obesity 2023, 16:1987-2003
Published Date: 30 June 2023
Comprehensive Analysis of the Role of Metabolic Features in Osteoporosis: A Multi-Omics Analysis
Chang S, Tao W, Shi P, Wu H, Liu H, Xu J, Chen J, Zhu J
International Journal of General Medicine 2025, 18:2727-2739
Published Date: 26 May 2025
Copper Metabolism-Related Genes as Biomarkers in Colon Adenoma and Cancer
Zhang T, Fu Y
International Journal of General Medicine 2025, 18:3021-3043
Published Date: 10 June 2025
Unveiling PANoptosis in Acute Kidney Injury: An Integrative Multi-Dimensional Approach to Identify Key Biomarkers
Wang N, Zhang L, Xu Z, Xu Q, Lu Y, Niu P, Yan L, Wang L, Cao H, Shao F
Journal of Inflammation Research 2025, 18:8735-8754
Published Date: 2 July 2025
PI3 as a Common Hub Gene Linking Atopic Dermatitis and Ulcerative Colitis Through Immune Cell Recruitment Mechanisms
Jian D, Chen J, Yuan J, Namrata K, Su D, Bai B
Journal of Inflammation Research 2025, 18:11853-11868
Published Date: 27 August 2025