
Back to Journals » Breast Cancer: Targets and Therapy » Volume 18
Integrative Network-Based Transcriptomic Analysis Identifies Niclosamide as a Candidate Repositioned Drug for Breast Cancer
Authors Aydin B, Okutan BN  , Sara FE, Gulseren G, Sinha R
Received 10 March 2026
Accepted for publication 3 July 2026
Published 24 July 2026 Volume 2026:18 606551
DOI https://doi.org/10.2147/BCTT.S606551
Checked for plagiarism Yes
Review by Single anonymous peer review
Peer reviewer comments 4
Editor who approved publication: Professor Harikrishna Nakshatri
Busra Aydin,1 Beyza Nur Okutan,2 Fatmanur Elif Sara,2 Gulcihan Gulseren,3 Raghu Sinha4
1Department of Bioengineering, Faculty of Engineering and Architecture, Konya Food and Agriculture University, Konya, Turkey; 2Department of Biotechnology, Institute of Postgraduate Education, Konya Food and Agriculture University, Konya, Turkey; 3Department of Molecular Biology and Genetics, Faculty of Agriculture and Natural Sciences, Konya Food and Agriculture University, Konya, Turkey; 4Department of Molecular and Precision Medicine, Penn State College of Medicine, Hershey, PA, USA
Correspondence: Busra Aydin, Department of Biotechnology, Institute of Postgraduate Education, Konya Food and Agriculture University, Konya, Turkey, Email [email protected] Raghu Sinha, Department of Molecular and Precision Medicine, Penn State College of Medicine, Hershey, PA, USA, Email [email protected]
Purpose: Breast cancer (BC) is a highly heterogeneous malignancy, and current treatments often suffer from toxicity, limited selectivity, and high cost. This study aimed to integrate transcriptome-level data, multi-layered network analysis, and drug repositioning strategies to identify candidate diagnostic and prognostic biomarkers for BC and propose potential repositioned drug candidates.
Methods: Differentially expressed genes (DEGs) were identified from the GSE42568 dataset (|log2FC| > 1 and p < 0.05). Functional enrichment analyses were conducted using GO and KEGG. Three biological interaction layers - protein–protein interactions, transcription factors, and miRNA-mRNA interactions were constructed, and hub nodes were identified using topological metrics. Kaplan-Meier analyses assessed survival associations. PCA evaluated sample separation across datasets in GSE42568, GSE113865, and GSE22820. Drug repositioning was performed using L1000CDS2, and in vitro validation of a top drug candidate (niclosamide) and an exploratory comparative compound (amitriptyline) was performed using MCF-7 cells, including viability and combination assays.
Results: A total of 4266 DEGs were identified. Network analyses revealed 37 hub signatures, 11 of which—ESR1, RECQL4, FOS, BCL2, CXCL8, TRIM25, EGR1, CDH1, KRAS, PTGS2, and IL6 were associated with survival outcomes. PCA demonstrated clear separation between healthy and BC samples. Drug repositioning identified eight candidates, with niclosamide as the top hit. In vitro assays showed marked reduction in cell viability at 5 μM niclosamide and 25 μM amitriptyline after 24 h treatment. No significant additive effect was observed in the combination treatment.
Conclusion: This integrative approach revealed candidate BC-specific biomarkers and identified niclosamide as a potential repositioned therapeutic. These findings remain exploratory and do not provide definitive clinical evidence. Further validation across additional models and clinical settings is required.
Keywords: transcriptomics, biomarkers, breast cancer, drug repositioning, amitriptyline, niclosamide
Introduction
Breast cancer (BC) is a heterogeneous disease with a wide range of pathogenesis and clinical characteristics.1 BC is the most common cancer type with an incidence rate of 30%,2 making it one of the most encountered diseases among women. According to the World Health Organization (WHO), BC is categorized into various histopathologic subgroups, including in situ and invasive breast cancer, fibroepithelial and nipple tumors, mesenchymal and hematolymphoid neoplasms, male breast tumors, and genetic tumor syndromes.3 This classification is based on cellular morphology, growth characteristics, and architectural patterns. The molecular subtypes of BC are classified by the expression profiles of the estrogen receptor (ER), progesterone receptor (PR), and human epidermal growth factor receptor 2 (HER2).4 Among these, ER+ breast cancer represents the most prevalent subtype and is characterized by hormone-responsive tumor biology.5 The MCF-7 cell line is one of the most widely used in vitro models for ER+ BC due to its stable phenotype and well-characterized estrogen-dependent signaling, making it suitable for investigating drug responses in hormone-driven BC.6,7
The regulation of messenger RNAs (mRNA), microRNAs, and long non-coding RNAs are key factors involved in cancer development.8,9 Recent studies investigating the identification of breast cancer biomarkers using targeted transcriptome showed that mRNA levels of HER2, ER, and AR reflect the tumor characteristics.10 Moreover, miR-182 was identified as an oncogene contributing to breast cancer pathogenesis.11 miRNA-mRNA interactions in both BC and triple-negative breast cancer (TNBC), highlighting the potential use of these indicators in aggressive breast cancer types by identifying miRNAs like hsa-miR-802, hsa-miR-1258, hsa-miR-548a-3p, and hsa-miR-2053 and mRNAs like MELK, NCAPG, CCNA2, and NUSAP1 that were involved in disease progression and survival outcomes.12 These findings demonstrated that transcriptomic analysis is a more sensitive and reliable method for identifying BC-specific biomarkers and may provide new therapeutic approaches.
Conventional chemotherapy remains a cornerstone in BC treatment; however, the limited selectivity of many antineoplastic agents can lead to off-target effects, potentially impacting healthy tissues and contributing to treatment-related morbidity. Therefore, novel therapeutic strategies are needed. The “drug repositioning” strategy could significantly reduce the time and cost of developing innovative drugs with previously investigated molecules to eliminate risk.13 One crucial strategy for drug repositioning research is utilizing gene expression data linked to any genetic perturbations.14
The traditional de novo drug development process is quite expensive, roughly $12 billion, laborious, and time-intensive, lasting approximately 10 to 15 years with high clinical attrition rates.15 Therefore, drug repositioning has emerged as an alternative strategy for identifying new therapeutic indications for existing compounds while bypassing many early-stage safety evaluations.16,17 Recent advances in breast cancer management have improved patient outcomes through increasingly personalized treatment strategies.18 Nevertheless, disease heterogeneity, treatment resistance, and recurrence remain major clinical challenges, supporting the continued search for novel biomarkers and therapeutic targets.
Several repositioned compounds, including metformin and ritonavir, have previously demonstrated potential anticancer effects in BC.19,20 Niclosamide has been previously reported to exhibit anticancer activity through the inhibition of signaling pathways, such as the Wnt/β-catenin and STAT3 pathways,21–23 while amitriptyline has been associated with mitochondrial dysfunction and cytotoxic effects in cancer cells.24–26 However, their role within integrative transcriptomic-driven drug repositioning frameworks remains insufficiently characterized. Given these partially overlapping but mechanistically distinct biological effects, we explored whether these compounds could influence BC cell viability individually and under combinatorial conditions.
Despite the growing number of computational drug repositioning studies in BC,27,28 many existing approaches rely predominantly on differential expression-based drug matching and do not sufficiently integrate multilayer biological network prioritization with subsequent experimental validation.29,30 In addition, subtype-specific investigations, particularly focusing on ER+ breast cancer, remain limited, particularly in integrative frameworks combining network-based prioritization with survival-associated biomarker candidates for ER+ BC.
This study performed an integrative transcriptome-based microarray analysis to identify candidate repositioned small-molecule compounds associated with biologically prioritized BC signatures. A core regulatory cluster was determined by constructing a three-layered biological network using DEGs, followed by survival-based prioritization (log-rank p < 0.05) and independent expression-pattern assessment. The resulting prognostically relevant hub signatures were subsequently used as the input for L1000CDS2-based drug repositioning to identify compounds predicted to reverse the BC-associated transcriptional profile. Among the prioritized candidates, niclosamide emerged as the top-ranked compound and was therefore selected for preliminary in vitro validation. While amitriptyline was also included as a comparative exploratory compound, based on previously reported cytotoxic and mitochondrial effects in BC-related cellular models.24–26 Rather than assuming a predefined synergistic mechanism, the combined evaluation of these two agents was intended to explore whether distinct but partially convergent biological activities could influence breast cancer cell viability. This study aimed to contribute to the identification of candidate therapeutic strategies for BC based on the integration of transcriptome-level data analysis, multiple-level biological network constructions, and drug repositioning.
Methods
Selection and Pre-Processing of the BC Datasets and Elucidation of DEGs
The publicly available NCBI Gene Expression Omnibus (NCBI-GEO) database31 was used to retrieve BC-related microarray datasets. The study design involved the use of separate datasets for (i) the identification of biomarkers associated with BC pathogenesis and (ii) the validation of the consistency of the resulting DEGs and network-derived hub molecules across independent cohorts. The microarray dataset of GSE4256832 was composed of 121 samples, which were analyzed to elucidate the omics signatures of BC. Among these samples, 104 were taken from patients with primary tumor tissue, and 17 from normal breast tissue. Differential gene expression analysis was performed using the GEO2R online statistical platform31 based on the submitter-provided processed series matrix expression data available in GSE42568. According to the original dataset publication,32 these deposited expression values were generated following GC-RMA normalization, quantile normalization, batch-effect adjustment, and probe-level filtering prior to GEO submission. GEO2R subsequently applied the GEOquery and limma Bioconductor packages to these processed data for differential comparison between user-defined sample groups. No additional raw CEL file normalization or independent probe-level preprocessing was carried out in the present study. Differential expression was performed under the default unpaired linear modeling framework implemented in GEO2R. To identify statistically significant DEGs from the selected dataset, the complete GEO2R output table was first downloaded, and statistical filtering was then applied in the downstream analysis: (i) p-value < 0.05 and (ii) |log2(fold change)| > 1. We considered the cut-off for the upregulated DEGs as log2FC ≥ 1 and for the downregulated DEGs as log2FC ≤ −1. To further visualize the distribution of gene expression changes, both a volcano plot and an MA (mean–difference) plot were generated. The volcano plot was constructed using log2FC and p-values to graphically display significantly differentially expressed genes with substantial fold changes and statistical significance. An MA plot was further obtained from the GEO2R visualization output to display log2FC against average log2 expression values. Moreover, the complete list of identified DEGs, including gene symbols, log2FC, p-values, and adjusted p-values, was provided as Supplementary Table 1. The datasets GSE113865 and GSE22820 were used to assess the consistency of expression patterns of the identified hub molecules across independent cohorts. The detailed information related to the selected datasets is shared in Table 1.
 |
Table 1 The Microarray Datasets for Transcriptomic Analysis of Breast Cancer |
Functional Enrichment Analysis of DEGs
Functional enrichment analysis of DEGs (upregulated and downregulated separately) was performed by the GeneCodis4 web-based bioinformatics tool.38 The cut-off criterion was determined as adj. p-value < 0.05. For the functional annotation of DEGs, the signaling processes represented by KEGG pathways39 were used. The Gene Ontology (GO)40 was used to ensure a comprehensive source of the biological processes that were associated with DEGs.
Network Constructions and Elucidation of the Reporter Molecules
Biological network constructions around all DEGs were performed by collecting the interaction data from protein-protein interactions (PPIs) (BioGrid),41 miRNA gene interactions (mirTarbase),42 and transcription factor gene interactions (TRRUST).43 Networks were visualized by Cytoscape software (v3.9.1),44 and topological network analysis was performed using degree and betweenness centrality metrics. By using the “cytohubba” package of Cytoscape software, topological local and global metrics such as degree and betweenness centrality were interpreted.45 PPIs from BioGRID were restricted to Homo sapiens (H. sapiens) and included experimentally validated interactions curated in the database without additional filtering by interaction type or confidence score. The miRNA–gene interactions (miRTarBase) and TF-gene interactions (TRRUST) were limited to experimentally validated entries. No tissue-specific filtering was applied; instead, a global human interaction network was constructed, and topological filtering metrics were used to identify the most relevant hub molecules. Degree and betweenness centrality were selected as topological metrics because these capture complementary aspects of network topology, namely local connectivity and global information flow, and are among the most widely applied prioritization metrics in biological network analysis. Betweenness centrality represents the number of times a node is present on the shortest path between other nodes. Degree centrality is simply the number of links held by each node. The node represents the genes of interest, while the edges represent the connections between the nodes. The top 10 hub elements for each interaction network were considered significant by topological metrics, including degree and betweenness centrality. Topological properties of the networks, including node and edge numbers, network density, and clustering coefficient, were calculated using the Network Analyzer tool46 in Cytoscape.
Survival Analysis of BC Datasets
The hub molecules obtained from the TF–gene, miRNA–gene, and PPI interaction networks were subsequently integrated into a combined non-redundant candidate signature pool. This integrated hub set constituted the “core cluster” used for downstream prioritization analyses. To further refine the biological and clinical relevance of these signatures, Kaplan-Meier (KM) survival analysis was subsequently applied, and only molecules showing statistically significant prognostic associations (log-rank p < 0.05) were retained as the final prognostic biomarker set.
KM survival analysis was performed using the KM Plotter online tool (http://kmplot.com),47 which integrates gene expression and clinical data from multiple publicly available breast cancer cohorts, including the GEO and TCGA. To evaluate the prognostic significance of a particular gene, patient samples were categorized based on the gene’s median expression (high versus low expression),48 as determined by the KM Plotter algorithm.
All analyses were conducted using the default settings of the KM Plotter breast cancer module. The “all datasets” option was selected, and no additional filtering was applied based on molecular subtype or treatment. The total number of patients included in the analysis was approximately 4929, which is indicated by the platform output. Gene expression values were derived from the user-selected probe set option for each gene. Median expression values used for patient stratification were automatically computed by the KM Plotter algorithm.
We performed survival analysis around core cluster elements based on the patient’s clinical data gathered from the TCGA and GEO databases. The KM Plotter47 was used to conduct survival analysis. The core cluster elements, which have log-rank p-values<0.05, were accepted as prognostic biomarkers for BC.
Survival analyses were conducted to evaluate the prognostic relevance of hub genes identified from TF, PPI, and miRNA networks. Overall survival (OS) was used as the primary endpoint. All available patients meeting the default inclusion criteria of the platform were included as a single cohort without further stratification.
Principal Component Analysis (PCA)
PCA was performed to understand the clustering ability of the prognostic biomarkers, considering diseased and healthy samples depending on their gene expression values in the GSE42568, GSE22820, and GSE113865 datasets. For cross-dataset comparisons, the 11 hubs identified from survival analysis were included. Gene expression values were normalized using z-score transformation (centering and scaling) to ensure comparability across datasets before performing PCA. PCA was carried out using R software (version 4.3.2) with the aid of R Studio (release 2024.12.1) and the utilization of the “factoextra” package. No explicit batch effect correction was applied, and analyses were performed separately for each dataset. PCA was provided to distinguish the samples according to their tissue origin (healthy vs diseased). Besides PCA, factor analysis was also conducted to reduce the variables by extracting all their commonalities into a smaller number of factors. The factor analysis also helped us to reveal the contribution levels of prognostic markers to the discrimination of samples.
Drug Repositioning and Cellular Viability Assays
For the drug repositioning stage, the prognostically significant hub elements obtained after KM survival filtering were retained as the final BC molecular signature. These genes were subsequently categorized into upregulated and downregulated groups according to their expression tendencies in the discovery dataset and submitted to the L1000CDS249 search engine to identify candidate compounds predicted to reverse the BC-associated transcriptional profile (Supplementary Table 2). The L1000CDS2 platform ranks candidate compounds using a transcriptomic overlap/reversal scoring approach based on cosine similarity metrics. Specifically, the platform evaluates the similarity between the uploaded disease-associated gene signature and perturbation-induced transcriptional profiles derived from the LINCS L1000 database. In reverse mode, compounds are prioritized according to their ability to inversely correlate with the disease signature. The ranking metric is based on the transformation 1−cos(α), where cos(α) represents the cosine similarity between the disease-associated signature vector and the perturbagen-associated expression vector. Higher overlap/reversal scores therefore indicate stronger inverse transcriptomic relationships and a greater predicted capacity to reverse the disease-associated molecular state.
The top 50 resultant drugs, which were further evaluated by their association with B and were searched through publicly available databases such as DrugBank,50 NCATS Inxight Drugs,51 and ClinicalTrials.gov.52 The top-scoring 10 drugs were selected for further search on their mechanism of action, approval statuses, and association with BC.
After identifying repositioned drug candidates, we performed cell viability assays using niclosamide (N3510, Sigma-Aldrich) and amitriptyline (A8404, Sigma-Aldrich). Breast cancer cells, MCF-7 (ATCC, cat no: HTB-22), were cultured in high-glucose DMEM (GIBCO) with 10% fetal bovine serum (FBS) (Capricorn), 1% penicillin-streptomycin (Sigma), and 1% L-glutamine. MCF-7 cells were maintained at 37°C, in 5% CO2. After cells reached 80% confluency, trypsin-EDTA was used to detach cells from the flask and harvested by centrifugation at 4500 rpm for 5 minutes. 5×10³ cells were seeded in a 96-well plate for the viability assays. MCF-7 cells were treated with niclosamide and amitriptyline at 1, 5, 25, 50, and 100 µM concentrations, and cell viability was determined after 24 h and 72 h using AlamarBlue assay at 560–590 nm wavelength53 (n=3 replicate).
Besides that, to analyze the synergistic effect of the drugs, the concentration of the drugs was determined based on the previous viability results. The drug combination was applied to MCF-7 cells under the same experimental conditions. For the analysis of synergistic effect, Bliss independence model was applied.54,55
According to the Bliss definition formula:

where Niclosamide: MA and Amitriptyline: MB.
In order to show cytotoxic effect, the viability percentage on the graph is transformed to mortality percentage.
Additionally, the combination effects were analysed using the Chou–Talalay method to quantitatively determine the nature of the interaction between niclosamide and amitriptyline at the corresponding effect level. The combination index (CI) was calculated according to Chou–Talalay equation described as:
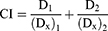
D1 and D2 represent the doses of each drug used in combination, while (Dₓ)1 and (Dₓ)2 correspond to the doses of each drug alone required to produce the same effect level (e.g., 50% inhibition).
Results
Significant Functions and Pathways Associated with DEGs of BC
The differential gene expression analysis between the test (BC samples) and control groups revealed 4266 DEGs. Their expression distribution was further illustrated by volcano and MA plots (Figure 1). The complete DEG list with corresponding statistical parameters is presented in Supplementary Table 1. The volcano plot revealed a clear distribution of DEGs (Figure 1A), with significantly upregulated and downregulated genes separated based on both statistical significance and fold change thresholds. Consistent with this, the MA plot showed that most genes were centered around a log2FC of zero, indicating overall balanced expression between groups (Figure 1B). Greater variability was observed among genes with lower average expression levels, whereas genes with higher expression showed more stable fold change patterns. These findings support the reliability of the differential expression analysis and indicate that the observed changes are not driven by systematic bias. Among those, 2171 were upregulated, and 2095 were downregulated genes. Genecodis was used for functional enrichment analysis using GO and KEGG databases by defining a cut-off criterion of the adj. p-value<0.05 to elucidate the functions of the DEGs in the BC case. The functional enrichment analysis was constructed from the 10 most enriched pathways for upregulated and downregulated DEGs.
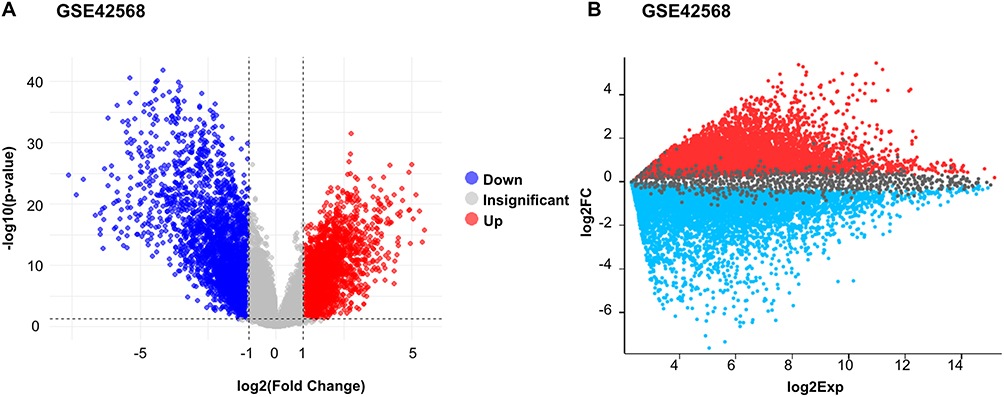 |
Figure 1 Visualization of differential gene expression analysis. (A) Volcano plot showing the distribution of genes based on log2FC and −log10(p-value), highlighting significantly upregulated and downregulated genes. (B) MA plot illustrating the relationship between log2FC and average gene expression levels across all genes. |
GO analysis was performed to elucidate DEGs’ biological processes and molecular functions. The downregulated DEGs were significantly enriched in biological processes such as lipid metabolic processes, brown fat cell differentiation, response to bacteria, and tricarboxylic acid cycle (Figure 2A). Whereas the upregulated DEGs were significantly enriched in cell division, migration, and DNA replication (Figure 2B).
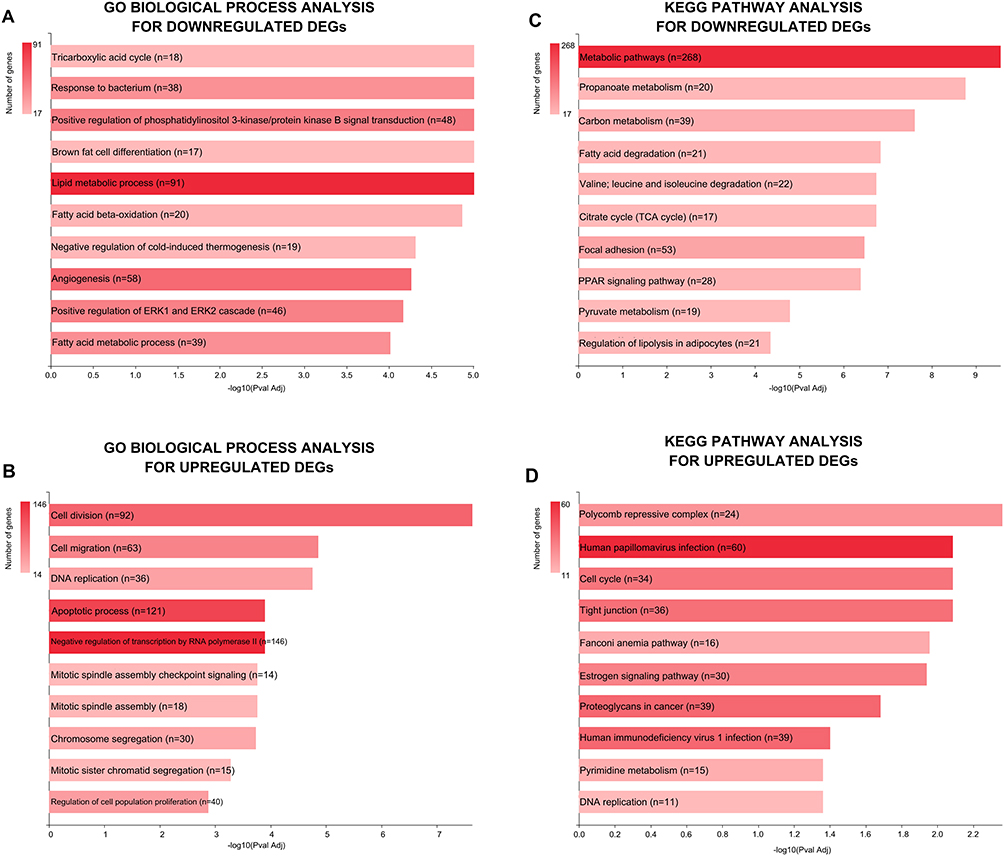 |
Figure 2 Enrichment analysis of DEGs. (A) GO-downregulated DEGs analysis. (B) GO-upregulated DEGs analysis. (C) KEGG pathway analysis of downregulated DEGs. (D) KEGG pathway analysis of upregulated DEGs. The number of genes associated with each pathway are indicated by n. |
KEGG analysis focuses on high-level biological system functions and provides knowledge about genes, molecular pathways, and their interactions. Down-regulated DEGs were significantly enriched in metabolic and PPAR signaling pathways, propanoate and carbon metabolism, fatty acid degradation, citrate (TCA) cycle, valine, leucine, and isoleucine degradation, and focal adhesion pathways (Figure 2C). Upregulated DEGs were enriched for the polycomb repressive complex, tight junction, human papillomavirus infection, Fanconi anemia, estrogen signaling pathways, proteoglycans in cancers, human immunodeficiency virus-1 infection, cell cycle, and pyrimidine metabolism pathways (Figure 2D).
TF-Gene Interaction Network Construction
To construct a TF-gene interaction network, the potential TF-gene interactions related to DEGs were revealed from the TRRUST database. The TF–gene interaction network consisted of 420 nodes and 1312 edges, with a network density of 0.015 and a clustering coefficient of 0.115. Associated interactions were visualized in the Cytoscape software to obtain hub molecules of the TF-gene interaction network based on betweenness centrality and degree metrics. Consequently, 17 hub molecules were determined. The top 10 hubs, based on betweenness centrality and degree metrics, were accepted as significant. The determined significant 17 hub molecules were AR, BCL2, CDH1, CXCL8, E2F1, EGR1, ESR1, FOS, HDAC1, IL6, JUN, NFKB1, PTGS2, RELA, SP1, STAT3, and TP53 (Figure 3A).
 |
Figure 3 Three-layered biological network construction. (A) TF-gene interactions of DEGs. (B) miRNA-gene interactions around DEG. (C) Protein-protein interactions of DEGs. |
miRNA-Gene Interaction Network Construction
To achieve a miRNA-gene interaction network, upregulated and downregulated DEGs related to potential miRNA gene interactions were investigated through the miRTarBase database, and the H. sapiens species was used as a source. The resulting data were used to construct miRNA-gene interactions in the Cytoscape application. The miRNA-gene interaction network comprised 774 nodes and 2171 edges, showing a network density of 0.003 and a clustering coefficient of 0.000. Using the cytohubba plug-in, the data were evaluated in terms of betweenness centrality and degree centrality. The obtained significant hub molecules were hsa-miR-335-5p, hsa-miR-26b-5p, hsa-miR-124-3p, hsa-miR-16-5p, hsa-miR-92a-3p, NUFIP2, hsa-let-7b-5p, IGF1R, hsa-miR-1-3p, hsa-miR-192-5p, hsa-miR-93-5p, hsa-miR-17-5p, VAV3, hsa-miR-8485, hsa-miR-106b-5p, GATA6 (Figure 3B).
PPI Network Construction
Since upregulated and downregulated DEGs are assumed to code for the same-named proteins, DEGs were used to construct the PPI network. To detect potential protein-protein interactions within our DEGs, the BioGRID database was utilized, and as a species source, H. sapiens data was selected. Using these interactions, the PPI network was constructed on Cytoscape software, and the cytohubba plug-in was employed to calculate topological metrics such as degree and betweenness centrality. As a result, 14 significant hub molecules were obtained. The top 10 hubs from the betweenness centrality metrics and the top 10 hubs from the degree metrics are selected as protein network signatures for BC. By combining these two groups and removing the replicates, 14 significant hub molecules were revealed, including EGFR, KRAS, ESR1, TRIM25, NR3C1, HDAC1, RECQL4, TRIM28, EGLN3, RHOA, DDX39A, APP, SNCA, and CSK proteins (Figure 3C). The PPI network was the most extensive structure, containing 9974 nodes and 19,422 edges, with a network density of 0.000 and a clustering coefficient of 0.224. Due to the high density and complexity of the interaction networks, not all node labels are simultaneously displayed with full readability in the global network visualizations. The primary purpose of these figures is to illustrate the overall topological architecture of the biological interaction networks, while emphasizing the visibility of topologically prioritized hub molecules.
Kaplan-Meier (KM) Estimator for Discriminating Hub Genes’ Prognostic Capability
KM survival analysis was conducted to understand and analyze the prognostic performance of the hub genes. A survival analysis was carried out among TF, PPI, and miRNA hub genes using the KM Plotter web-based tool. Regarding the log-rank p-value ≤ 0.05, 11 hubs were identified as prognostically significant. Among these, high expressions of ESR1 (HR= 0.64, p = 1×10⁻¹⁶), FOS (HR = 0.71, p = 1.3×10⁻¹¹), BCL2 (HR = 0.73, p = 1.2×10⁻⁹), TRIM25 (HR = 0.73, p = 4.5×10⁻⁵), EGR1 (HR = 0.82, p = 1.1×10⁻⁴), CDH1 (HR = 0.84, p = 7.7×10⁻⁴), KRAS (HR = 0.86, p = 3.5×10⁻³), PTGS2 (HR = 0.89, p = 2.3×10⁻²), and IL6 (HR = 0.9, p = 4.6×10⁻²) associated with improved OS, which may have a protective or tumor-suppressive function (Figure 4). In some molecular circumstances, these biomarkers may have tumor-suppressive functions because they are commonly implicated in hormone signaling (ESR1), cell proliferation (FOS), apoptotic regulation (BCL2), cell adhesion (CDH1), antiviral response (TRIM25), tumor suppressor (EGR1), signal transduction (KRAS), inflammation (PTGS2) and immunological modulation (IL6). Although KRAS is upregulated in breast cancer and is widely recognized as an oncogene, our KM analysis showed that higher expression was associated with improved overall survival (HR = 0.86, log-rank p = 0.0035). This finding contrasts with previous reports linking elevated KRAS expression to poorer prognosis and may reflect differences in cohort composition, subtype distribution, or analytical approaches. These results suggest that the prognostic impact of KRAS expression in breast cancer may be context-dependent rather than uniformly oncogenic. In contrast, worse OS was substantially linked to increased expression of CXCL8 (HR = 1.35, p = 4.9 x 10⁻⁹) and RECQL4 (HR = 1.54, p = 1.0 x 10⁻¹⁶), suggesting a role in inflammatory signaling and tumor growth. The prognostic associations observed for certain hub molecules, particularly PTGS2 and IL6, is interpreted cautiously due to modest effect sizes and the absence of multiple-testing correction across survival comparisons. The properties of prognostic biomarkers are shared in Table 2.
 |
Table 2 Prognostic Biomarkers Identified from Three-Layered Network Analysis |
 |
Figure 4 Kaplan-Meier (KM) survival curves of the core cluster expression levels. All elements of the core cluster had log-rank p-values <0.05, highlighting that they might serve as potential prognostic biomarkers for BC. |
Principal Component Analysis Showed Potential Diagnostic Biomarker Candidates for BC
PCA was conducted to determine the ability to discriminate between healthy and BC samples, considering the network biomarkers. The GSE42568, GSE113865, and GSE22820 datasets were used in PCA analysis to better understand the gene expression data. The PCA graph of variables for each dataset (Figure 5) demonstrates that the healthy controls and BC samples are separated on the principal components. This indicates that different biological circumstances or cellular states can be observed in the dataset. The principal component 1 (PC1) and PC2 explained 53.4% of the total variance in the GSE42568 dataset, with the highest contribution values for explaining the variance found in the IL6, EGR1, and FOS genes (Figure 5A). Although the GSE113865 dataset contains a limited number of samples, it was included as an independent exploratory cohort to assess the consistency of expression-pattern separation across datasets rather than to provide definitive statistical validation. In the GSE113865 data set, the PCA analysis explained 76.7% of the total variance (Figure 5C). This analysis determined the genes with the highest contribution values as KRAS, FOS, and PTGS2. In the GSE22820 dataset, 55.1% of the total variance was explained, and the genes with the highest contribution values were determined as FOS, EGR1, and KRAS (Figure 5B). The significance of gene contributions for explaining the variance of the datasets is estimated using the cos2 values. A low cos2 value means that the variable is not perfectly represented by that component (in our case, hub elements). A high cos2 value, on the other hand, means a good representation of the variable on that component. The variables presented in red and localized away from the circle’s origin exhibited the higher cos2 values. In contrast, variables that were presented in blue color and closer to the circle’s origin have lower cos2 values, which exhibit less significance. Multiple-testing correction was not applied in the present survival analyses because the primary objective was exploratory prioritization of candidate biomarkers for downstream network integration and drug repositioning rather than definitive prognostic modeling. We acknowledge that this approach may increase the risk of false-positive findings; however, applying stringent multiple-testing corrections at this stage could also increase false-negative results and potentially exclude biologically relevant candidates for subsequent analyses. These results indicate that EGR1, FOS, IL6, KRAS, and PTGS2 demonstrated sample-separation capability to discriminate between diseased and healthy samples. It specifically highlights the biological significance of these cancer-related genes and the requirement for them to be assessed as potential diagnostic biomarkers.
 |
Figure 5 Principal Component Analysis plots for (A) GSE42568, (B) GSE22820, (C) GSE113865. Variables are colored according to their cos2 values, where blue indicates low contribution and red indicates high contribution to the principal components. |
Drug Repositioning Revealed Candidate Repositioned Drugs for BC
To elucidate whether potential diagnostic biomarkers hold a feature of being treatment targets of the disease, we examined them further by utilizing the L1000CDS2 search engine. It prioritizes thousands of small-molecule signatures and their pairwise combinations using two techniques to reverse or mimic an input gene expression profile. To reverse the BC disease scenario into a healthy state, the tool uses a reverse mode that oppositely converts input gene expression signatures. The inputs were selected as up- and down-regulated potential diagnostic biomarkers. Based on KM survival filtering, 11 prognostically significant hub genes were retained for the drug repositioning analysis. Among these, CDH1, ESR1, KRAS, RECQL4, and TRIM25 constituted the upregulated input signature, whereas PTGS2, BCL2, CXCL8, EGR1, FOS, and IL6 formed the downregulated input signature submitted to L1000CDS2. The tool gave 50 repositioned drug candidates as a result. The candidate drugs from the query results were eliminated based on their approval status, mode of action, and indications. Among all resultant drugs, 4 of them were approved by the FDA, and the other four drugs were stated as investigational. Table 3 summarizes the detailed properties of selected repositioned drug candidates by giving their mechanisms of action, FDA approval status, and indications.
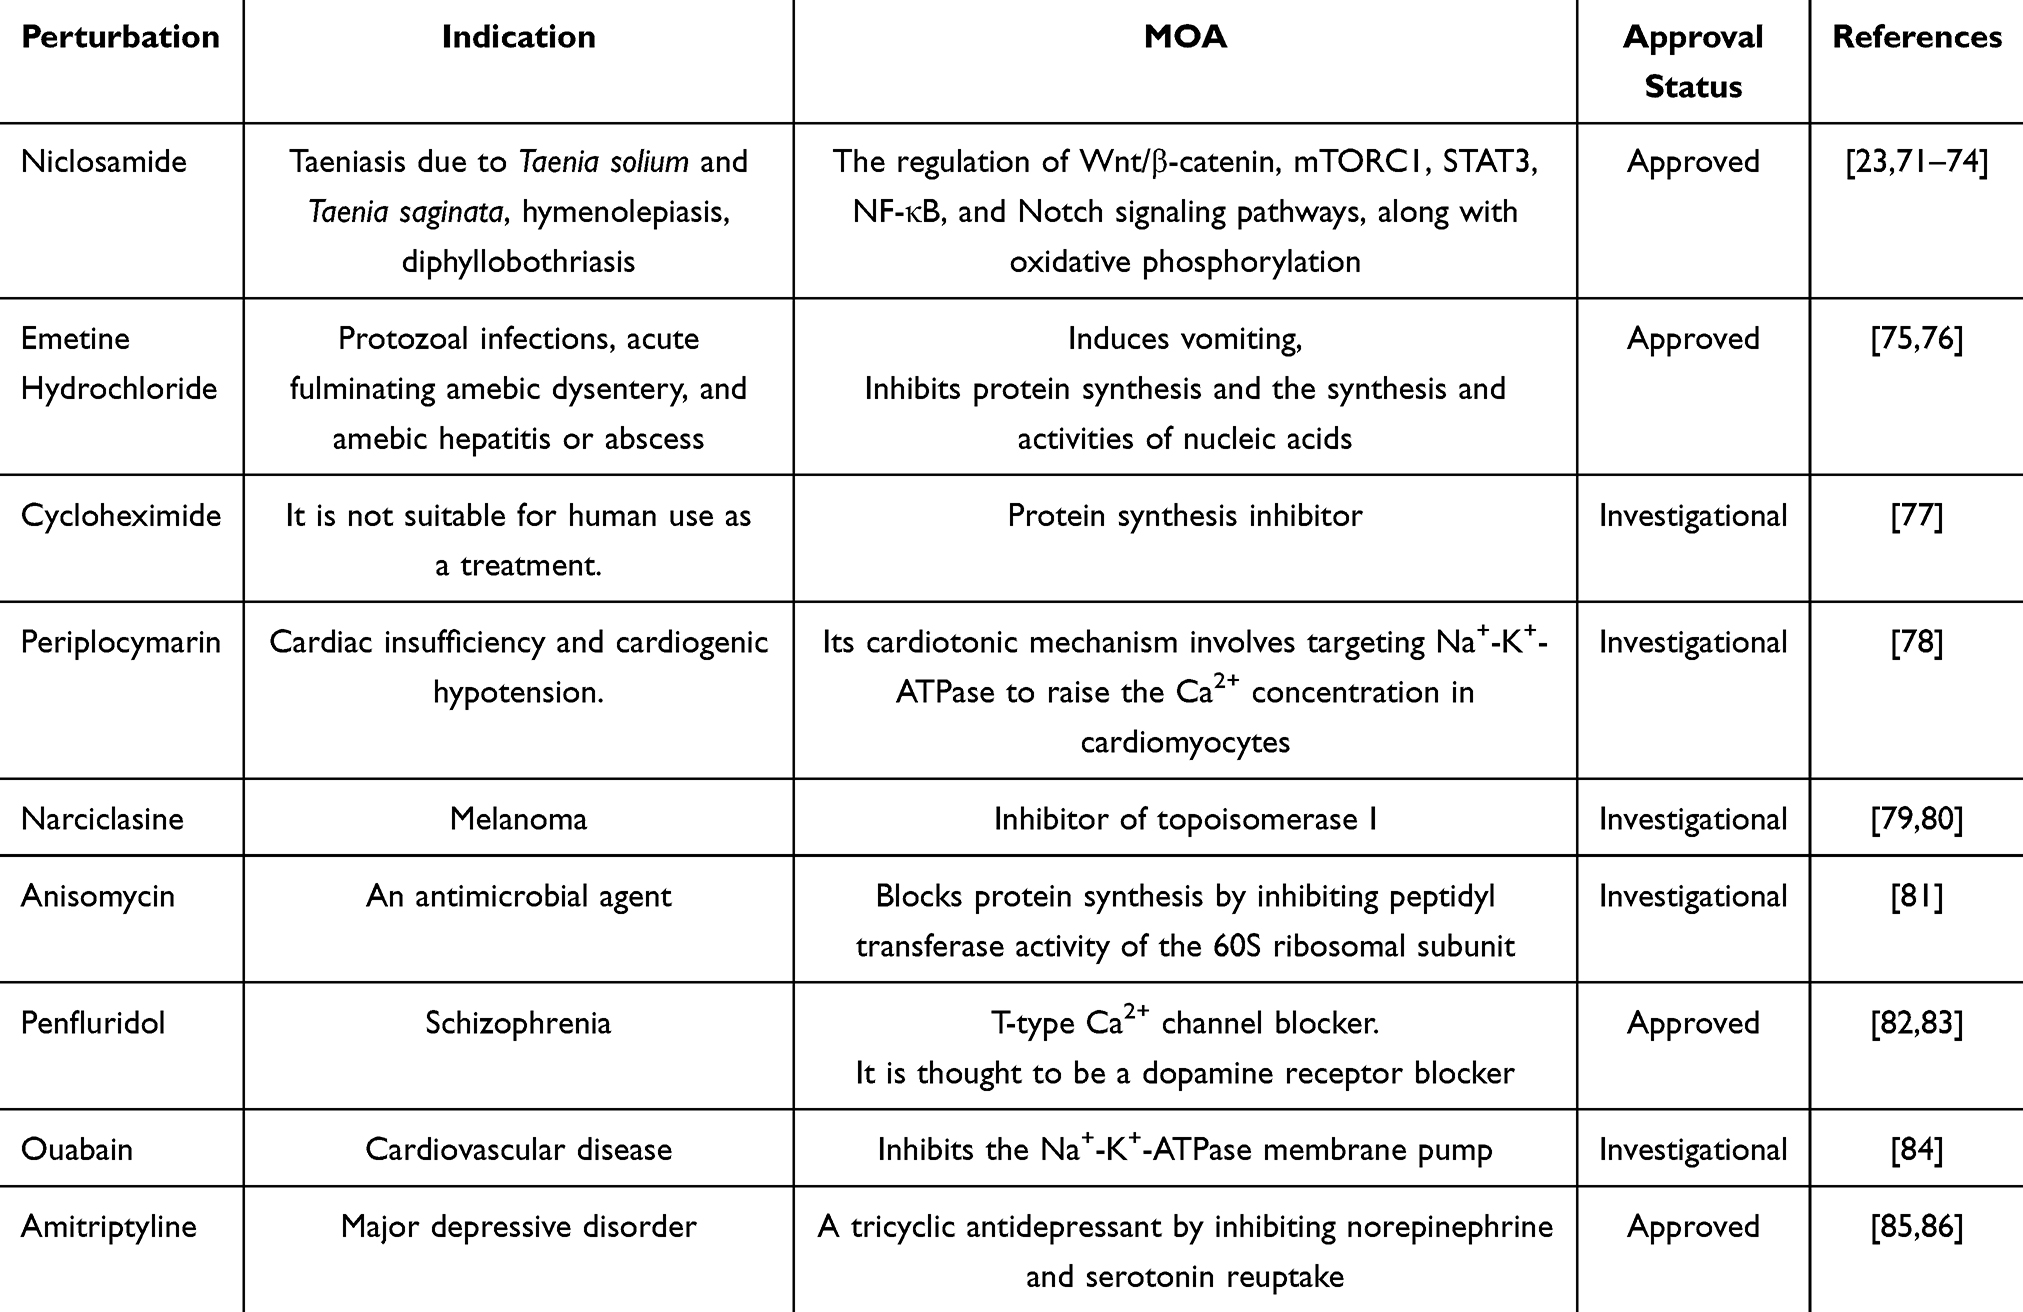 |
Table 3 Repurposed Drug Candidates Based on the BC-Specific Hub Genes |
Cell Viability Assays Revealed Niclosamide as a Repositioned Therapeutic for BC
MCF-7 cells were treated with varying concentrations (1, 5, 25, 50, and 100 µM) of repositioned drugs, including niclosamide and amitriptyline (n = 3 replicate). Although a broad concentration range of drug was tested to evaluate dose-dependent effects, some of the higher concentrations may be above clinically achievable plasma levels. This concentration range was tested to fully evaluate the cellular response profile and determine the effective dose window of drugs. Both drugs exhibited significant cytotoxicity at both 24 h and 72 h. At 24 h, amitriptyline inhibited cell proliferation with an IC50 value of 43.12 (95% CI: 10.88 to 191.7) (Supplementary Figure 1), corresponding to approximately 50% inhibition at 25 µM (Figures 6A and B). Niclosamide exhibited a potent antiproliferative effect, with an IC50 value of 1.910 µM (95% CI: 1.419 to 2.624) at 24 h (Supplementary Figure 2). Notably, treatment with 5 µM niclosamide resulted in a marked reduction in cellular proliferation, consistent with its high cytotoxic potency (Figure 6C, D and Supplementary Figure 3). The results from the 24-h observation were consistent with the findings at 72 h. After 72 h incubation of cells with amitriptyline, the effect on cellular viability remained the same, whereas for niclosamide, cellular proliferation was further decreased.
 |
Figure 6 Viability analysis and fluorescence microscopy of MCF-7 cells following treatment with amitriptyline and niclosamide at 24 h and 72 h. (A) Cell viability profiles of amitriptyline-treated cells at 24 h and 72 h. (B) Representative fluorescence microscopy images of amitriptyline-treated MCF-7 cells at 24 h and 72 h. (C) Cell viability profiles of niclosamide-treated cells at 24 h and 72 h. (D) Representative fluorescence microscopy images of niclosamide-treated MCF-7 cells at 24 h and 72 h. Error bars represent the standard error of the mean (SEM) from two independent experiments (n = 2), each performed with three technical replicates. Statistical significance was determined using one-way ANOVA (*p < 0.05, **p < 0.01, ***p < 0.001, ****p<0.0001). Scale bar: 50 µM. |
To assess potential synergistic effects between these two drugs, the MCF-7 cells were treated with these drugs in combination at critical concentrations. The combined treatment model was employed to potentiate therapeutic efficacy using niclosamide and amitriptyline at concentrations of 1:25 µM and 5:25 µM, respectively. Under the fluorescence microscope, the morphology of the cells and relative fluorescence units (RFUs) were consistent with the cellular viability results. As a result, the higher treatment potential of the drugs against BC was confirmed.
Determination of Synergistic Effects of the Drugs
The interaction between niclosamide and amitriptyline was initially evaluated using the Bliss independence model. According to the Bliss definition formula: MA + MB – MA x MB= MAB, where Niclosamide: MA and Amitriptyline: MB,
- for the niclosamide on day 1: at 1 µM viability percentage is 72.43%, and MA= 27.57%
- for the amitriptyline on day 1: at 25 µM viability percentage is 50.17%, and MB= 49.83%
- 0.27 + 0.49 – (0.27 X 0.49) =0.62 (Expected Value)
- for the niclosamide on day 1: at 5 µM viability percentage is 23.35%, and MA= 76.65%
- for the amitriptyline on day 1, at 25 µM viability percentage is 50.17%, and MB = 49.83%
- 0.76 + 0.49 – (0.76 X 0.49) = 0. 88 (Expected Value)
The expected effect value of the two drug concentrations at 1:25 µM is 62%, and the expected effect at 5:25 µM is 60%. The measured cytotoxicity levels were lower than the predicted values for 1:25 and 5:25 µM drug concentrations, indicating that the expected level is not reached. The graphical representation of the synergistic effects of the drugs was shared in Figure 7A and B (Fluorescence intensity of cellular images was indicated in Supplementary Figures 3 and 4). The results imply that the combinatorial treatment fails to achieve the anticipated additive cytotoxicity, suggesting a possible antagonistic interaction between niclosamide and amitriptyline at both tested ratios.
 |
Figure 7 Bliss Independence analysis of drug combinations in MCF-7 cells. (A) Mortality rates of single and combined drug treatments at two different concentrations (5:25 μM and 1:25 μM. (B) Representative fluorescence images of MCF-7 cells under combined drug treatment. Scale bar: 50 µm. |
The interaction profile was quantified further using the Chou–Talalay combination index (CI). The calculated CI value (>1) suggests that the two compounds interact antagonistically at this effect level. The 95% confidence interval ranged from 2.04 to 5.82, indicating the robustness of this finding. Analysis by the Chou-Talalay method. The CI was calculated specifically to determine the nature of the interaction at the corresponding level of effect.54,87,88
Using the (Chou-Talalay) Equation:

D1 and D2 represent the doses of each drug used in combination, while (Dₓ)1 and (Dₓ)2 correspond to the doses of each drug alone required to produce the same effect level (e.g., 50% inhibition).
For the tested condition:
D1 (Amitriptyline) = 25 µM, (Dₓ)1 = 43.12 µM, D2 (Niclosamide) = 5 µM, (Dₓ)2 = 1.91 µM
The combination index (CI) was calculated as:
- CI = (25 / 43.12) + (5 / 1.91) = 3.19
One possible explanation is that overlapping or competing molecular targets may diminish the efficacy of each compound when applied together. Alternatively, differences in pharmacodynamics, such as variations in drug uptake, metabolism, or intracellular bioavailability, may account for the reduced cytotoxic response. It is also conceivable that compensatory signaling pathways are activated under combined treatment, thereby attenuating the expected cytotoxic impact. These findings highlight the necessity for further mechanistic studies, including pathway-specific analyses and dose response modeling, to clarify the interaction profile and optimize combinatorial regimens.
Discussion
Over the past decades, the therapeutic landscape for BC has undergone substantial evolution, shifting from localized interventions toward a more integrated, multimodal paradigm aimed at controlling both locoregional disease and distant metastases. More recently, the convergence of high-throughput omics technologies and computational biology has fostered the emergence of drug repositioning as a promising therapeutic avenue.
To identify therapeutic targets and transcriptional patterns, we compared 104 BC samples to 17 normal breast biopsies. We detected a total of 4266 DEGs, of which 2171 were upregulated, whereas 2095 of them were downregulated. Around these DEGs, biological network constructions revealed 37 BC-specific network signatures that provide insights into potential disease mechanism(s). Among these 37 network signatures, survival analysis revealed the potential BC-specific prognostic biomarkers, including AGR2, ANLN, AR, BCL2, CALM1, CANX, CDH1, CXCL8, E2F1, EGR1, ERBB2, ESR1, EZH2, FASN, FOS, IGF1R, IL6, KRAS, MIDN, MMP9, MOV10, NFKB1, NPM1, PPARG, PTGS2, RECQL4, RELA, SNCA, SOX4, SQSTM1, STAT3, TP53, TRIM25, TXNIP, UBN2, VAV3, and XPO1 (Figure 4, Supplementary Figure 5 and 6).
Although several prioritized signatures (ESR1, BCL2, KRAS, PTGS2, and IL6) identified in this study have previously been implicated in BC biology, their recovery through the present multilayer network-based framework supports the biological robustness and internal consistency of the analytical strategy. Importantly, the integration of transcriptomic alterations with multiple regulatory interaction layers may facilitate the prioritization of functionally connected neighboring signatures that might remain undetected under conventional single-threshold differential expression analyses. In addition, the incorporation of survival-based prioritization and drug repositioning analyses extends the utility of the framework beyond mechanistic interpretation toward translational therapeutic candidate identification. Among these network signatures, 11 of them showed a statistically significant impact on the survival probabilities of BC patients. To demonstrate the discrimination ability of these 11 prognostic biomarkers regarding the healthy and disease states of the samples, PCA analysis was carried out and showed separating ability of BC cancer patients and healthy controls above a variance of 50% levels (Figure 5). Independent datasets were primarily used to assess the consistency of the findings rather than to provide full external validation. Differences in platform technologies may also introduce variability that could not be completely accounted for across independent datasets.
The 11-gene signature identified in this study should currently be interpreted as an exploratory and biologically prioritized molecular signature rather than a clinically validated diagnostic, prognostic, or treatment-guiding panel. In the present framework, these genes contributed to expression-based sample separation, showed survival-associated patterns, and served as transcriptomic inputs for drug repositioning analysis. After revealing these potential molecular signatures, a drug repositioning analysis was conducted to reverse the scenario of BC pathogenesis by targeting and reversing the gene expression profiles of all diagnostic signatures. Drug repositioning analysis revealed specific small molecules that have the potential to treat BC. In this study, 8 potential drug candidates (Table 3) were identified through drug repositioning based on gene expression profiles associated with breast cancer. Potential drug candidates were identified based on significant overlap values, including niclosamide, emetine hydrochloride, cycloheximide, periplocymarin, narciclasine, anisomycin, penfluridol, and ouabain. Although several identified compounds (cycloheximide, periplocymarin, narciclasine, anisomycin, ouabain) remain investigational or are not currently approved for oncology-related clinical use, previous studies have demonstrated potential anticancer activities for some of these molecules in experimental cancer models.
Narciclasine has been reported to induce autophagy-dependent apoptosis and inhibit STAT3-associated signaling in breast cancer-related systems, whereas anisomycin has shown anti-proliferative and pro-apoptotic activity across multiple cancer models.89,90 In addition, several investigational compounds identified in the repositioning analysis have previously demonstrated experimentally supported anticancer activities. Periplocymarin, a cardiac glycoside-derived natural compound, has been reported to inhibit tumor proliferation, induce apoptosis, and modulate glycolysis and mitochondrial oxidative phosphorylation pathways in multiple cancer models through PI3K/AKT and MAPK/ERK signaling regulation.91 Similarly, ouabain has been shown to exert antiproliferative and pro-apoptotic effects in BC and other malignancies through modulation of Na+/K+-ATPase-associated signaling, ERK1/2 activation, STAT3 suppression, and cell-cycle regulatory pathways.92 Cycloheximide has also been widely used in experimental oncology studies because of its potent inhibition of protein synthesis, despite its limited clinical applicability due to toxicity concerns.93 Therefore, these compounds were retained primarily as biologically informative computational outputs rather than immediately translatable therapeutic candidates. Among the identified compounds, niclosamide emerged as a prioritized candidate for further investigation based on its favorable overlap score, known pharmacological profile, and prior FDA approval status.
Niclosamide is an anthelmintic drug used to treat parasitic infections, and it was approved by the FDA in 1982.94 Niclosamide is a member of the weakly acidic lipophilic group which is known as salicylanilides.95 The salicylanilides disrupt the synthesis of adenosine triphosphate by uncoupling the oxidative phosphorylation in the cell mitochondria; therefore, the motility of parasites and perhaps other functions as well are impaired.96 The mechanism of action of niclosamide is thought to work against parasites by inhibiting the oxidative phosphorylation of mitochondria and the formation of anaerobic ATP, and glucose uptake.97,98 Niclosamide is the potent mitochondrial uncoupler class73 with the function of inhibiting various biological processes and signaling pathways, including mTORC1, nuclear factor-κB (NF-κB), Wnt/β-catenin, Notch, and signal transducer/activator of transcription 3 (STAT3).23,71–74 Over the past few years, increasing data suggest that niclosamide is a multi-functional drug, raising the possibility that it could be developed as a new treatment for conditions other than helminthic diseases.99 Wu et al demonstrated that niclosamide might be repositioned in colorectal cancer treatment.100
Amitriptyline was included as a literature-supported compound with previously reported cytotoxic and mitochondrial regulatory effects in BC cells to provide an additional comparative perspective in the experimental phase. Amitriptyline, a tricyclic antidepressant, was approved as a drug by the FDA in 1961 under the brand name Elavil®,101 and is used for the treatment of major depressive disorder (MDD) in adults.86 The function of amitriptyline is a reuptake inhibitor of serotonin and norepinephrine, exerting significant effects on the serotonin transporter and mild effects on the norepinephrine transporter.102,103 It has also been used to treat post-COVID headaches.104 Amitriptyline, a tertiary amine, blocks serotonin and norepinephrine reuptake and has strong binding affinities for muscarinic (M1), histamine (H1), and alpha-adrenergic receptors.105 Amitriptyline is used to treat depression in most breast cancer patients.25 The cytotoxic effect of amitriptyline on the viability of MCF7 breast cancer cells was examined in vitro, and as a result, it was determined that amitriptyline had a significant cytotoxic effect on these cells.106 The computational analyses were performed without subtype-specific stratification and therefore reflect molecular signatures associated with breast cancer at a broader level. MCF-7 cells were selected for experimental validation because they are a well-established ER+ breast cancer model. Consequently, while the identified biomarkers emerged from non-stratified breast cancer datasets, the in vitro validation findings should be interpreted within an ER+ cellular context. MCF-7 cells are characterized by ESR1 expression and hormone-responsive behavior, making it highly suitable for investigating ESR1-associated pathways and therapeutic responses.107 However, since different molecular subtypes of breast cancer exhibit distinct biological characteristics, the direct generalization of these findings to other subtypes, such as triple-negative or HER2+ breast cancer, may be limited. Therefore, further validation in additional breast cancer models representing different molecular subtypes will be necessary in future studies.
Given their reported involvement in mitochondrial regulation and inflammatory signaling, niclosamide and amitriptyline were considered biologically relevant compounds for exploratory combination assessment. According to studies, niclosamide decreases ATP production by interfering with oxidative phosphorylation in the mitochondria. In this connection, amitriptyline is known as non-selective monoamine reuptake inhibitors (NSMRIs),26 which inhibit ATP production and NADH oxidation, which are traits of uncouplers of oxidative phosphorylation.108 Amitriptyline significantly inhibits mitochondrial complex I-II-linked respiration activity.26
Both drugs have been reported to modulate inflammatory responses. Recent studies in experimental animals and human models of acute inflammation have shown that amitriptyline has anti-inflammatory properties in addition to its therapeutic uses as an analgesic and antidepressant.109 Scheuermann et al indicated that amitriptyline efficiently inhibits inflammation in the mouse sponge model.110 Niclosamide has been shown to directly inhibit the DNA-binding domain of STAT3, thereby modulating key cellular processes such as proliferation and apoptosis, while also suppressing NFĸB signaling, downregulating Wnt, mTOR, and STAT3 pathway proteins, and consequently attenuating inflammatory responses, reducing macrophage-induced viability and cytokine/chemokine secretion in human endometriotic stromal cells, and markedly inhibiting tumor cell growth in both a mouse model of endometriosis and ovarian cancer models [94–96]. Niclosamide may cause acute myeloid leukemia (AML) blast cells to undergo apoptosis by inhibiting the NFκB pathway and raising the reactive oxygen species (ROS) production.74 It has been proven as a result of an in vitro study with astroglial cell lines from mice that amitriptyline inhibits NF-κB translocation and decreases IL-1β.111
Along with the literature, the findings of this study indicate that the combinatorial regimen did not achieve the anticipated additive cytotoxicity, suggesting a potential antagonistic interaction between niclosamide and amitriptyline at both tested ratios. Similar outcomes have been documented in drug combination studies, where non-additive or antagonistic effects arose due to overlapping or competing molecular targets that limited therapeutic efficacy when agents were co-administered.112,113 Both compounds have previously been associated with modulation of mitochondrial oxidative phosphorylation and cellular energy metabolism, raising the possibility that simultaneous mitochondrial stress induction may activate adaptive metabolic compensation mechanisms that partially preserve cellular viability. In addition, mitochondrial dysfunction-induced stress responses may trigger compensatory survival-associated pathways, including PI3K/AKT, MAPK/ERK, autophagy-related signaling, or redox-regulatory processes that attenuate the expected additive cytotoxic effect. Another possibility is that alterations in ATP availability, mitochondrial membrane potential, or ROS dynamics may differentially influence the cellular responses to combined treatment conditions. Another plausible explanation may lie in pharmacodynamic discrepancies, including altered uptake, metabolism, or intracellular bioavailability, all of which are known to critically influence drug–drug interactions in breast cancer and other malignancies.114,115 Furthermore, combined therapies have been reported to activate compensatory signaling cascades such as PI3K/AKT or MAPK pathways, that counteract intended cytotoxic effects and attenuate overall treatment efficacy.116–118 Collectively, these findings highlight the need for further mechanistic studies such as pathway-specific analyses and dose–response modeling, mitochondrial functional assays, apoptosis profiling, ROS quantification, metabolic flux analyses, and pathway-specific transcriptomic or proteomic studies to clarify the molecular basis of the observed antagonistic interaction and to refine combinatorial strategies for translational application in BC. Also, the selectivity of the combinatorial regimen should be thought about carefully because the best treatment plan should focus on cancer cells and not harm normal cells as much as possible. The observed combination’s lack of selectivity may make it even less useful in the clinic, especially when it comes to antagonistic interactions.
The observed IC50 values indicate that niclosamide exerted a comparatively stronger antiproliferative response than amitriptyline under identical experimental conditions, although these concentration-dependent effects should be interpreted cautiously due to the use of a single MCF-7 cell model. Since MCF-7 cells represent a luminal ER+ subtype, the present in vitro findings remain preliminary and cannot be directly generalized to other molecular forms of breast cancer without further validation. A limitation of this study is the lack of subtype-specific stratification (eg, ER, HER2, and TNBC status, as well as clinical variables), which may mask subtype-dependent molecular differences and influence therapeutic interpretation.
The present findings should be interpreted within the context of current BC therapeutic strategies. Niclosamide and amitriptyline are not proposed as replacements for established standard-of-care therapies such as endocrine treatment, CDK4/6 inhibition, or HER2-targeted approaches. Instead, these compounds may represent exploratory repositioning candidates with potential adjunctive or combinatorial relevance, particularly in luminal/ER+ BC models such as MCF-7. Given the known involvement of inflammatory signaling, mitochondrial metabolism, and proliferation-associated pathways in therapeutic resistance, further studies may help determine whether these agents could function as sensitizers or complementary therapeutic components alongside existing treatment regimens.
Despite the promising transcriptomic and in vitro findings observed in the present study, important translational limitations should be considered. The clinical implementation of given 11-gene signatures would require a stepwise validation pathway, including ROC/AUC-based diagnostic performance assessment, multivariable prognostic modeling, subtype-specific validation, prospective cohort evaluation, and direct testing of whether the signature predicts therapeutic response to prioritized repositioning candidates. Therefore, the present findings provide a hypothesis-generating basis for future biomarker and therapeutic validation studies rather than an immediately applicable clinical decision tool. In addition, niclosamide is known to exhibit poor aqueous solubility, limited oral bioavailability, and low systemic exposure,99 all of which substantially restrict its clinical applicability despite its broad-spectrum anticancer activity in preclinical models. Several studies have therefore focused on improving niclosamide pharmacokinetics through nanoformulations, prodrug approaches, and alternative delivery systems designed to enhance systemic absorption and tissue distribution.119 In parallel, amitriptyline is associated with dose-dependent central nervous system and anticholinergic adverse effects, including sedation, dizziness, dry mouth, constipation, and cognitive impairment, which may limit tolerability at concentrations potentially required for anticancer applications.105,120 Therefore, the present findings should currently be interpreted as exploratory repositioning evidence rather than immediate clinical treatment recommendations. Consequently, additional mechanistic investigations, including pathway-targeted gene/protein expression analyses, metabolic profiling, mitochondrial function assays, and subtype-specific validation experiments will be required to clarify the molecular basis of the observed antiproliferative effects. Future translational studies may require optimized formulation strategies, targeted delivery systems, dose-adjustment approaches, or combination-based regimens to improve therapeutic feasibility and safety profiles.
Conclusion
Integrating omics-level data analysis, network construction, and a drug repositioning framework enabled the identification of BC-associated candidate biomarkers, including CDH1, ESR1, KRAS, RECQL4, TRIM25, PTGS2, BCL2, CXCL8, EGR1, FOS, and IL6 genes, with potential biological and prognostic relevance. These biomarkers were associated with survival outcomes and contributed to expression-based separation between breast cancer and normal samples, suggesting potential biological relevance that warrants further investigation. Niclosamide was prioritized as a repositioned candidate through transcriptomic signature-reversal analysis and demonstrated preliminary antiproliferative activity in MCF-7 cells. Given its reported effects on inflammation, proliferation, and oxidative phosphorylation pathways substantially, it was selected for in vitro evaluation and demonstrated cytotoxic effects on MCF7 cells (24 h, 5 µM). Based on previously reported similarities in mitochondrial and inflammatory pathway modulation, amitriptyline was additionally evaluated as a comparative compound in the same experimental conditions. Amitriptyline also showed dose-dependent cytotoxic activity (24 h, 25 µM), although at a higher IC50 concentration than niclosamide. Overall, these findings support niclosamide emerged as a highly prioritized candidate and demonstrated preliminary antiproliferative activity in the MCF-7 BC model; however, thorough validation across additional BC subtypes and normal breast epithelial cell models, mechanistic and in-depth in vivo studies are required before translational interpretation.
Abbreviations
adj. p-value, adjusted p-value; AKT, protein kinase B; AML, acute myeloid leukemia; AMPK, AMP-activated protein kinase; AR, androgen receptor; ATP, adenosine triphosphate; BC, breast cancer; BioGRID, biological general repository for interaction datasets; BSA, bovine serum albumin; CDK4/6, cyclin-dependent kinase 4/6; CO2, carbon dioxide; COPD, chronic obstructive pulmonary disease; cos2, squared cosine; DEGs, differentially expressed genes; DMEM, Dulbecco’s modified Eagle medium; DNA, deoxyribonucleic acid; EGFR, epidermal growth factor receptor; ER, estrogen receptor; FDA, Food and Drug Administration; FBS, fetal bovine serum; GEO, Gene Expression Omnibus; GO, Gene Ontology; HER2, human epidermal growth factor receptor 2; HR, hazard ratio; hsa-miR, Homo sapiens microRNA; IC50, half maximal inhibitory concentration; ICMJE, International Committee of Medical Journal Editors; IL, interleukin; KM, Kaplan-Meier; KEGG, Kyoto Encyclopedia of Genes and Genomes; log2FC, log2 fold change; MA, Bliss model additive effect; MB, Bliss model baseline effect; MAB, Bliss model combination effect; MAPK, mitogen-activated protein kinase; MCF-7, Michigan Cancer Foundation-7 breast cancer cell line; miRNA, microRNA; mRNA, messenger RNA; mTOR, mechanistic target of rapamycin; mTORC1, mechanistic target of rapamycin complex 1; NCATS, National Center for Advancing Translational Sciences; NCBI, National Center for Biotechnology Information; NF-κB, nuclear factor kappa B; NLM, National Library of Medicine; NSMRIs, non-selective monoamine reuptake inhibitors; OS, overall survival; PCA, principal component analysis; PC1, principal component 1; PC2, principal component 2; PI3K, phosphoinositide 3-kinase; PPAR, peroxisome proliferator-activated receptor; PPI, protein-protein interaction; PR, progesterone receptor; RFU, relative fluorescence unit; RNA, ribonucleic acid; STAT3, signal transducer and activator of transcription 3; TCGA, The Cancer Genome Atlas; TF, transcription factor; TNBC, triple-negative breast cancer; TRRUST, transcriptional regulatory relationships unraveled by sentence-based text mining; WHO, World Health Organization; Wnt, wingless/integrated signaling pathway.
Data Sharing Statement
The datasets that were used in this article are available in the Gene Expression Omnibus (GEO) repository: GSE42568 (https://www.ncbi.nlm.nih.gov/geo/query/acc.cgi?acc=GSE42568), GSE22820 (https://www.ncbi.nlm.nih.gov/geo/query/acc.cgi?acc=GSE22820), and GSE113865 (https://www.ncbi.nlm.nih.gov/geo/query/acc.cgi?acc=GSE113865).
Ethics Approval and Informed Consent
This study was conducted using publicly available, anonymized transcriptomic datasets obtained from the Gene Expression Omnibus (GEO) database. No new biological samples were collected, and no direct interaction with human participants was involved. Since the study was based solely on secondary analysis of de-identified public data, informed consent was not required. The study protocol and exemption status were reviewed and approved by Research Ethics Committee of Konya Food and Agriculture University.
Author Contributions
All authors made a significant contribution to the work reported, whether that is in the conception, study design, execution, acquisition of data, analysis and interpretation, or in all these areas; took part in drafting, revising or critically reviewing the article; gave final approval of the version to be published; have agreed on the journal to which the article has been submitted; and agree to be accountable for all aspects of the work.
Funding
This research did not receive any specific grant from funding agencies in the public, commercial, or not-for-profit sectors.
Disclosure
The authors declare that they have no conflicts of interest in this work.
References
1. Stingl J, Caldas C. Molecular heterogeneity of breast carcinomas and the cancer stem cell hypothesis. Nat Rev Cancer. 2007;7(10):791–24. doi:10.1038/nrc2212
2. Siegel RL, Giaquinto AN, Jemal A. Cancer statistics, 2024. CA Cancer J Clin. 2024;74(1):12–49. doi:10.3322/caac.21820
3. Tan PH, Ellis I, Allison K, et al. The 2019 World Health Organization classification of tumours of the breast. Histopathology. 2020;77(2):181–185. doi:10.1111/his.14091
4. Kinsella MD, Nassar A, Siddiqui MT, Cohen C. Estrogen receptor (ER), progesterone receptor (PR), and HER2 expression pre- and post- neoadjuvant chemotherapy in primary breast carcinoma: a single institutional experience. Int J Clin Exp Pathol. 2012;5(6):530–536.
5. Perou CM, Sørlie T, Eisen MB, et al. Molecular portraits of human breast tumours. Nature. 2000;406(6797):747–752. doi:10.1038/35021093
6. Soule HD, Vazguez J, Long A, Albert S, Brennan M. A human cell line from a pleural effusion derived from a breast carcinoma. J Natl Cancer Inst. 1973;51(5):1409–1416. doi:10.1093/jnci/51.5.1409
7. Holliday DL, Speirs V. Choosing the right cell line for breast cancer research. Breast Cancer Res. 2011;13(4):215. doi:10.1186/bcr2889
8. Griseri P, Pagès G. Regulation of the mRNA half-life in breast cancer. World J Clin Oncol. 2014;5(3):323–334. doi:10.5306/wjco.v5.i3.323
9. Ratti M, Lampis A, Ghidini M, et al. MicroRNAs (miRNAs) and long non-coding RNAs (lncRNAs) as new tools for cancer therapy: first steps from bench to bedside. Target Oncol. 2020;15(3):261–278. doi:10.1007/s11523-020-00717-x
10. Albitar M, Goy A, Pecora A, et al. The use of transcriptomic data in developing biomarkers in breast cancer. ImmunoMedicine. 2024;4(1):e1051. doi:10.1002/imed.1051
11. Murugesan M, Premkumar K. Integrative miRNA-mRNA functional analysis identifies miR-182 as a potential prognostic biomarker in breast cancer. Mol Omi. 2021;17(4):533–543. doi:10.1039/d0mo00160k
12. Balasundaram A, Mitra TS, Tayubi IA, Zayed H, Doss GPC. Deciphering the miRNA–mRNA interaction landscape between breast cancer and triple-negative breast cancer: an integrated bioinformatics approach. ACS Omega. 2024;9(23):24379–24395. doi:10.1021/acsomega.4c00011
13. Zhou H, Liu H, Yu Y, Yuan X, Xiao L. Informatics on drug repurposing for breast cancer. Drug Des Devel Ther. 2023;17(null):1933–1943. doi:10.2147/DDDT.S417563
14. Li J, Zheng S, Chen B, Butte AJ, Swamidass SJ, Lu Z. A survey of current trends in computational drug repositioning. Brief Bioinform. 2016;17(1):2–12. doi:10.1093/bib/bbv020
15. Alaimo S, Pulvirenti A. Network-based drug repositioning: approaches, resources, and research directions. In: Vanhaelen Q, editor. Computational Methods for Drug Repurposing. Springer New York; 2019:97–113. doi:10.1007/978-1-4939-8955-3_6
16. Chong CR, Sullivan DJ. New uses for old drugs. Nature. 2007;448(7154):645–646. doi:10.1038/448645a
17. Xue H, Li J, Xie H, Wang Y. Review of drug repositioning approaches and resources. Int J Biol Sci. 2018;14(10):1232–1244. doi:10.7150/ijbs.24612
18. Lee KL, Sule AA, Lai HX, Ng QX, Goh SSN. Cryotherapy as a surgical de-escalation strategy in breast cancer: techniques, complications, and oncological outcomes. Biomedicines. 2025;13(12):2987. doi:10.3390/biomedicines13122987
19. Srirangam A, Mitra R, Wang M, et al. Effects of HIV protease inhibitor ritonavir on akt-regulated cell proliferation in breast cancer. Clin Cancer Res. 2006;12(6):1883–1896. doi:10.1158/1078-0432.CCR-05-1167
20. Zakikhani M, Dowling R, Fantus IG, Sonenberg N, Pollak M. Metformin is an AMP kinase–dependent growth inhibitor for breast cancer cells. Cancer Res. 2006;66(21):10269–10273. doi:10.1158/0008-5472.CAN-06-1500
21. Lu W, Lin C, Roberts MJ, Waud WR, Piazza GA, Li Y. Niclosamide suppresses cancer cell growth by inducing Wnt co-receptor LRP6 degradation and inhibiting the Wnt/β-catenin pathway. PLoS One. 2011;6(12):e29290. doi:10.1371/journal.pone.0029290
22. Osada T, Chen M, Yang XY, et al. Antihelminth compound niclosamide downregulates Wnt signaling and elicits antitumor responses in tumors with activating APC mutations. Cancer Res. 2011;71(12):4172–4182. doi:10.1158/0008-5472.CAN-10-3978
23. Ren X, Duan L, He Q, et al. Identification of niclosamide as a new small-molecule inhibitor of the STAT3 signaling pathway. ACS Med Chem Lett. 2010;1(9):454–459. doi:10.1021/ml100146z
24. Lei B, Xu L, Zhang X, Peng W, Tang Q, Feng C. The proliferation effects of fluoxetine and amitriptyline on human breast cancer cells and the underlying molecular mechanisms. Environ Toxicol Pharmacol. 2021;83:103586. doi:10.1016/j.etap.2021.103586
25. Fisch M. Treatment of depression in cancer. J Natl Cancer Inst Monogr. 2004;2004(32):105–111. doi:10.1093/jncimonographs/lgh011
26. Cikánková T, Fišar Z, Hroudová J. In vitro effects of antidepressants and mood-stabilizing drugs on cell energy metabolism. Naunyn Schmiedebergs Arch Pharmacol. 2020;393(5):797–811. doi:10.1007/s00210-019-01791-3
27. Chen HR, Sherr DH, Hu Z, DeLisi C. A network based approach to drug repositioning identifies plausible candidates for breast cancer and prostate cancer. BMC Med Genomics. 2016;9(1):51. doi:10.1186/s12920-016-0212-7
28. Yu K, Basu A, Yau C, et al. Computational drug repositioning for the identification of new agents to sensitize drug-resistant breast tumors across treatments and receptor subtypes. Front Oncol. 2023;13:1192208. doi:10.3389/fonc.2023.1192208
29. Barabási AL, Gulbahce N, Loscalzo J. Network medicine: a network-based approach to human disease. Nat Rev Genet. 2011;12(1):56–68. doi:10.1038/nrg2918
30. Pushpakom S, Iorio F, Eyers PA, et al. Drug repurposing: progress, challenges and recommendations. Nat Rev Drug Discov. 2019;18(1):41–58. doi:10.1038/nrd.2018.168
31. Clough E, Barrett T, Wilhite SE, et al. NCBI GEO: archive for gene expression and epigenomics data sets: 23-year update. Nucleic Acids Res. 2024;52(D1):D138–D144. doi:10.1093/nar/gkad965
32. Clarke C, Madden SF, Doolan P, et al. Correlating transcriptional networks to breast cancer survival: a large-scale coexpression analysis. Carcinogenesis. 2013;34(10):2300–2308. doi:10.1093/carcin/bgt208
33. Krishnan P, Ghosh S, Wang B, et al. Genome-wide profiling of transfer RNAs and their role as novel prognostic markers for breast cancer. Sci Rep. 2016;6:32843. doi:10.1038/srep32843
34. Kumaran M, Cass CE, Graham K, et al. Germline copy number variations are associated with breast cancer risk and prognosis. Sci Rep. 2017;7(1):14621. doi:10.1038/s41598-017-14799-7
35. Liu RZ, Graham K, Glubrecht DD, Germain DR, Mackey JR, Godbout R. Association of FABP5 expression with poor survival in triple-negative breast cancer: implication for retinoic acid therapy. Am J Pathol. 2011;178(3):997–1008. doi:10.1016/j.ajpath.2010.11.075
36. Wuest M, Kuchar M, Sharma SK, et al. Targeting lysyl oxidase for molecular imaging in breast cancer. Breast Cancer Res. 2015;17(1):107. doi:10.1186/s13058-015-0609-9
37. Pandya V, Glubrecht D, Vos L, et al. The pro-apoptotic paradox: the BH3-only protein Bcl-2 interacting killer (Bik) is prognostic for unfavorable outcomes in breast cancer. Oncotarget. 2016;7(22):33272–33285. doi:10.18632/oncotarget.8924
38. Garcia-Moreno A, López-Domínguez R, Villatoro-García JA, et al. Functional enrichment analysis of regulatory elements. Biomedicines. 2022;10(3):590. doi:10.3390/biomedicines10030590
39. Kanehisa M, Furumichi M, Tanabe M, Sato Y, Morishima K. KEGG: new perspectives on genomes, pathways, diseases and drugs. Nucleic Acids Res. 2017;45(D1):D353–D361. doi:10.1093/nar/gkw1092
40. Ashburner M, Ball CA, Blake JA, et al. Gene ontology: tool for the unification of biology. Nat Genet. 2000;25(1):25–29. doi:10.1038/75556
41. Oughtred R, Rust J, Chang C, et al. The BioGRID database: a comprehensive biomedical resource of curated protein, genetic, and chemical interactions. Protein Sci. 2021;30(1):187–200. doi:10.1002/pro.3978
42. Huang HY, Lin YCD, Cui S, et al. miRTarBase update 2022: an informative resource for experimentally validated miRNA-target interactions. Nucleic Acids Res. 2022;50(D1):D222–D230. doi:10.1093/nar/gkab1079
43. Han H, Cho JW, Lee S, et al. TRRUST v2: an expanded reference database of human and mouse transcriptional regulatory interactions. Nucleic Acids Res. 2018;46(D1):D380–D386. doi:10.1093/nar/gkx1013
44. Shannon P, Markiel A, Ozier O, et al. Cytoscape: a software environment for integrated models of biomolecular interaction networks. Genome Res. 2003;13(11):2498–2504. doi:10.1101/gr.1239303
45. Chin CH, Chen SH, Wu HH, Ho CW, Ko MT, Lin CY. cytoHubba: identifying hub objects and sub-networks from complex interactome. BMC Syst Biol. 2014;8(4):S11. doi:10.1186/1752-0509-8-S4-S11
46. Assenov Y, Ramírez F, Schelhorn SE, Lengauer T, Albrecht M. Computing topological parameters of biological networks. Bioinformatics. 2008;24(2):282–284. doi:10.1093/bioinformatics/btm554
47. Győrffy B. Survival analysis across the entire transcriptome identifies biomarkers with the highest prognostic power in breast cancer. Comput Struct Biotechnol J. 2021;19:4101–4109. doi:10.1016/j.csbj.2021.07.014
48. Hou GX, Liu P, Yang J, Wen S. Mining expression and prognosis of topoisomerase isoforms in non-small-cell lung cancer by using Oncomine and Kaplan–Meier plotter. PLoS One. 2017;12(3):e0174515. doi:10.1371/journal.pone.0174515
49. Duan Q, Reid SP, Clark NR, et al. L1000CDS2: LINCS L1000 characteristic direction signatures search engine. Npj Syst Biol Appl. 2016;2(1):16015. doi:10.1038/npjsba.2016.15
50. Wishart DS, Feunang YD, Guo AC, et al. DrugBank 5.0: a major update to the DrugBank database for 2018. Nucleic Acids Res. 2018;46(D1):D1074–D1082. doi:10.1093/nar/gkx1037
51. Siramshetty VB, Grishagin I, Nguyễn ÐT, et al. NCATS inxight drugs: a comprehensive and curated portal for translational research. Nucleic Acids Res. 2022;50(D1):D1307–D1316. doi:10.1093/nar/gkab918
52. Zarin DA, Tse T, Williams RJ, Califf RM, Ide NC. The ClinicalTrials.gov Results Database — update and key issues. N Engl J Med. 2011;364(9):852–860. doi:10.1056/NEJMsa1012065
53. Gülseren G, Demirsoy Z, Şeker M, Büyükünal OM. Exploring bimetallic nanoparticles in alzheimer’s therapy: a novel bio-assisted synthesis with multitarget potential. Mol Pharm. 2024;21(6):3006–3016. doi:10.1021/acs.molpharmaceut.4c00175
54. Demidenko E, Miller TW. Statistical determination of synergy based on Bliss definition of drugs Independence. PLoS One. 2019;14(11):e0224137. doi:10.1371/journal.pone.0224137
55. Foucquier J, Guedj M. Analysis of drug combinations: current methodological landscape. Pharmacol Res Perspect. 2015;3(3):e00149. doi:10.1002/prp2.149
56. Kønig SM, Rissler V, Terkelsen T, Lambrughi M, Papaleo E. Alterations of the interactome of Bcl-2 proteins in breast cancer at the transcriptional, mutational and structural level. PLoS Comput Biol. 2019;15(12):e1007485. doi:10.1371/journal.pcbi.1007485
57. Huang R, Ding P, Yang F. Clinicopathological significance and potential drug target of CDH1 in breast cancer: a meta-analysis and literature review. Drug Des Devel Ther. 2015;9:5277–5285. doi:10.2147/DDDT.S86929
58. Liu Q, Li A, Tian Y, et al. The CXCL8-CXCR1/2 pathways in cancer. Cytokine Growth Factor Rev. 2016;31:61–71. doi:10.1016/j.cytogfr.2016.08.002
59. Saha SK, Islam SMR, Saha T, et al. Prognostic role of EGR1 in breast cancer: a systematic review. BMB Rep. 2021;54(10):497–504. doi:10.5483/BMBRep.2021.54.10.087
60. Clatot F, Perdrix A, Beaussire L, et al. Risk of early progression according to circulating ESR1 mutation, CA-15.3 and cfDNA increases under first-line anti-aromatase treatment in metastatic breast cancer. Breast Cancer Res. 2020;22(1):56. doi:10.1186/s13058-020-01290-x
61. Babu RL, Naveen Kumar M, Patil RH, Devaraju KS, Ramesh GT, Sharma SC. Effect of estrogen and tamoxifen on the expression pattern of AP-1 factors in MCF-7 cells: role of c-Jun, c-Fos, and Fra-1 in cell cycle regulation. Mol Cell Biochem. 2013;380(1):143–151. doi:10.1007/s11010-013-1667-x
62. Dethlefsen C, Højfeldt G, Hojman P. The role of intratumoral and systemic IL-6 in breast cancer. Breast Cancer Res Treat. 2013;138(3):657–664. doi:10.1007/s10549-013-2488-z
63. Hwang KT, Kim BH, Oh S, et al. Prognostic role of KRAS mRNA expression in breast cancer. J Breast Cancer. 2019;22(4):548–561. doi:10.4048/jbc.2019.22.e55
64. Omene C, Ma L, Moore J, et al. Aggressive mammary cancers lacking lymphocytic infiltration arise in irradiated mice and can be prevented by dietary intervention. Cancer Immunol Res. 2020;8(2):217–229. doi:10.1158/2326-6066.CIR-19-0253
65. Langsenlehner U, Yazdani-Biuki B, Eder T, et al. The cyclooxygenase-2 (PTGS2) 8473T>C polymorphism is associated with breast cancer risk. Clin Cancer Res. 2006;12(4):1392–1394. doi:10.1158/1078-0432.CCR-05-2055
66. Gao J, Ke Q, Ma HX, et al. Functional polymorphisms in the cyclooxygenase 2 (COX-2) gene and risk of breast cancer in a Chinese population. J Toxicol Environ Health A. 2007;70(11):908–915. doi:10.1080/15287390701289966
67. Xu H, Xu Y, Ouyang T, et al. Low expression of RECQL is associated with poor prognosis in Chinese breast cancer patients. BMC Cancer. 2018;18(1):662. doi:10.1186/s12885-018-4585-1
68. Cybulski C, Carrot-Zhang J, Kluźniak W, et al. Germline RECQL mutations are associated with breast cancer susceptibility. Nat Genet. 2015;47(6):643–646. doi:10.1038/ng.3284
69. Sun J, Wang Y, Xia Y, et al. Mutations in RECQL gene are associated with predisposition to breast cancer. PLoS Genet. 2015;11(5):e1005228. doi:10.1371/journal.pgen.1005228
70. Walsh LA, Alvarez MJ, Sabio EY, et al. An integrated systems biology approach identifies TRIM25 as a key determinant of breast cancer metastasis. Cell Rep. 2017;20(7):1623–1640. doi:10.1016/j.celrep.2017.07.052
71. Fonseca BD, Diering GH, Bidinosti MA, et al. Structure-activity analysis of niclosamide reveals potential role for cytoplasmic ph in control of mammalian target of rapamycin complex 1 (mTORC1) signaling*. J Biol Chem. 2012;287(21):17530–17545. doi:10.1074/jbc.M112.359638
72. Chen M, Wang J, Lu J, et al. The anti-helminthic niclosamide inhibits Wnt/Frizzled1 signaling. Biochemistry. 2009;48(43):10267–10274. doi:10.1021/bi9009677
73. Williamson RL, Metcalf RL. Salicylanilides: a new group of active uncouplers of oxidative phosphorylation. Science. 1967;158(3809):1694–1695. doi:10.1126/science.158.3809.1694
74. Jin Y, Lu Z, Ding K, et al. Antineoplastic mechanisms of niclosamide in acute myelogenous leukemia stem cells: inactivation of the NF-kappaB pathway and generation of reactive oxygen species. Cancer Res. 2010;70(6):2516–2527. doi:10.1158/0008-5472.CAN-09-3950
75. Kim JH, Cho EB, Lee J, et al. Emetine inhibits migration and invasion of human non-small-cell lung cancer cells via regulation of ERK and p38 signaling pathways. Chem Biol Interact. 2015;242:25–33. doi:10.1016/j.cbi.2015.08.014
76. Scholar E. Emetine. In: Enna SJ, Bylund DB, editors. xPharm: TCPR. Elsevier; 2009:1–4. doi:10.1016/B978-008055232-3.61675-7
77. Baliga BS, Pronczuk AW, Munro HN. Mechanism of cycloheximide inhibition of protein synthesis in a cell-free system prepared from rat liver. J Biol Chem. 1969;244(16):4480–4489. doi:10.1016/S0021-9258(18)94343-7
78. Yun W, Qian L, Cheng Y, Tao W, Yuan R, Xu H. Periplocymarin Plays an efficacious cardiotonic role via promoting calcium influx. Front Pharmacol. 2020;11. doi:10.3389/fphar.2020.01292
79. Van Goietsenoven G, Hutton J, Becker JP, et al. Targeting of eEF1A with Amaryllidaceae isocarbostyrils as a strategy to combat melanomas. FASEB J. 2010;24(11):4575–4584. doi:10.1096/fj.10-162263
80. Wang M, Liang L, Wang R, et al. Narciclasine, a novel topoisomerase I inhibitor, exhibited potent anti-cancer activity against cancer cells. Nat Products Bioprospect. 2023;13(1):27. doi:10.1007/s13659-023-00392-1
81. Barbacid M, Vazquez D. [3H]anisomycin binding to eukaryotic ribosomes. J Mol Biol. 1974;84(4):603–623. doi:10.1016/0022-2836(74)90119-3
82. Shintomi K, Yamamura M. Effects of penfluridol and other drugs on apomorphine-induced stereotyped behavior in monkeys. Eur J Pharmacol. 1975;31(2):273–280. doi:10.1016/0014-2999(75)90049-7
83. Santi CM, Cayabyab FS, Sutton KG, et al. Differential inhibition of T-type calcium channels by neuroleptics. J Neurosci. 2002;22(2):396–403. doi:10.1523/JNEUROSCI.22-02-00396.2002
84. Schiebinger RJ, Cragoe EJ, Ouabain. A stimulator of atrial natriuretic peptide secretion and its mechanism of action. Circ Res. 1993;72(5):1035–1043. doi:10.1161/01.RES.72.5.1035
85. Thour A, Marwaha R. Amitriptyline. 2026.
86. Dopheide JA. Recognizing and treating depression in children and adolescents. Am J Heal. 2006;63(3):233–243. doi:10.2146/ajhp050264
87. Fu J, Zhang N, Chou JH, et al. Drug combination in vivo using combination index method: taxotere and T607 against colon carcinoma HCT-116 xenograft tumor in nude mice. Synergy. 2016;3(3):15–30. doi:10.1016/j.synres.2016.06.001
88. Chou TC. Drug combination studies and their synergy quantification using the Chou-Talalay method. Cancer Res. 2010;70(2):440–446. doi:10.1158/0008-5472.CAN-09-1947
89. Cao C, Huang W, Zhang N, et al. Narciclasine induces autophagy-dependent apoptosis in triple-negative breast cancer cells by regulating the AMPK-ULK1 axis. Cell Prolif. 2018;51(6):e12518. doi:10.1111/cpr.12518
90. Ye W, Ni Z, Yicheng S, et al. Anisomycin inhibits angiogenesis in ovarian cancer by attenuating the molecular sponge effect of the lncRNA‑Meg3/miR‑421/PDGFRA axis. Int J Oncol. 2019;55(6):1296–1312. doi:10.3892/ijo.2019.4887
91. Han L, Xiang X, Fu Y, et al. Periplcymarin targets glycolysis and mitochondrial oxidative phosphorylation of esophageal squamous cell carcinoma: implication in anti-cancer therapy. Phytomedicine. 2024;128:155539. doi:10.1016/j.phymed.2024.155539
92. Du J, Jiang L, Chen F, Hu H, Zhou M. Cardiac glycoside ouabain exerts anticancer activity via downregulation of STAT3. Front Oncol. 2021;11:684316. doi:10.3389/fonc.2021.684316
93. Miao Y, Du Q, Zhang HG, Yuan Y, Zuo Y, Zheng H. Cycloheximide (CHX) chase assay to examine protein half-life. Bio-Protocol. 2023;13(11):e4690. doi:10.21769/BioProtoc.4690
94. Katz M. Anthelmintics. Current concepts in the treatment of helminthic infections. Drugs. 1986;32(4):358–371. doi:10.2165/00003495-198632040-00004
95. Thakare R, Kaul G, Shukla M, et al. Chapter 5 - Repurposing nonantibiotic drugs as antibacterials. In: Kesharwani P, Chopra S, Dasgupta A, editors. Drug Discovery Targeting Drug-Resistant Bacteria. Academic Press; 2020:105–138. doi:10.1016/B978-0-12-818480-6.00005-9
96. Vardanyan R, Hruby V. Chapter 36 - Anthelmintics. In: Vardanyan R, Hruby V, editors. Synthesis of Best-Seller Drug. Academic Press; 2016:749–764. doi:10.1016/B978-0-12-411492-0.00036-5
97. Zhang JL, Si HF, Shang XF, et al. New life for an old drug: in vitro and in vivo effects of the anthelmintic drug niclosamide against Toxoplasma gondii RH strain. Int J Parasitol Drugs Drug Resist. 2019;9:27–34. doi:10.1016/j.ijpddr.2018.12.004
98. Pan JX, Ding K, Wang CY. Niclosamide, an old antihelminthic agent, demonstrates antitumor activity by blocking multiple signaling pathways of cancer stem cells. Chin J Cancer. 2012;31(4):178–184. doi:10.5732/cjc.011.10290
99. Chen W, Mook RAJ, Premont RT, Wang J. Niclosamide: beyond an antihelminthic drug. Cell Signal. 2018;41:89–96. doi:10.1016/j.cellsig.2017.04.001
100. Wu MM, Zhang Z, Tong CWS, Yan VW, Cho WCS, KKW T. Repurposing of niclosamide as a STAT3 inhibitor to enhance the anticancer effect of chemotherapeutic drugs in treating colorectal cancer. Life Sci. 2020;262:118522. doi:10.1016/j.lfs.2020.118522
101. Fangmann P, Assion HJ, Juckel G, González CÁ, López-Muñoz F. Half a century of antidepressant drugs: on the clinical introduction of monoamine oxidase inhibitors, tricyclics, and tetracyclics. part II: tricyclics and tetracyclics. J Clin Psychopharmacol. 2008;28(1):1–4. doi:10.1097/jcp.0b013e3181627b60
102. Barbui C, Hotopf M. Amitriptyline v. the rest: still the leading antidepressant after 40 years of randomised controlled trials. Br J Psychiatry. 2001;178:129–144. doi:10.1192/bjp.178.2.129
103. Blier P, El Mansari M. Serotonin and beyond: therapeutics for major depression. Philos Trans R Soc London Ser B. 2013;368(1615):20120536. doi:10.1098/rstb.2012.0536
104. Gonzalez-Martinez A, Guerrero-Peral ÁL, Arias-Rivas S, et al. Amitriptyline for post-COVID headache: effectiveness, tolerability, and response predictors. J Neurol. 2022;269(11):5702–5709. doi:10.1007/s00415-022-11225-5
105. Gillman PK. Tricyclic antidepressant pharmacology and therapeutic drug interactions updated. Br J Pharmacol. 2007;151(6):737–748. doi:10.1038/sj.bjp.0707253
106. Dehghani A, Tabaku A, Eshghjoo S. The tricyclic antidepressant amitriptyline is cytotoxic to hjuman breast cancer (MCF7) cells. J Biol Stud. 2022;5(1 SE–Articles):85–92. doi:10.62400/jbs.v5i1.6381
107. Yang S, Manna C, Manna PR. Harnessing the role of ESR1 in breast cancer: correlation with microRNA, lncRNA, and methylation. Int J Mol Sci. 2025;26(7):3101. doi:10.3390/ijms26073101
108. Weinbach EC, Costa JL, Nelson BD, et al. Effects of tricyclic antidepressant drugs on energy-linked reactions in mitochondria. Biochem Pharmacol. 1986;35(9):1445–1451. doi:10.1016/0006-2952(86)90108-5
109. Casas J, Gibert-Rahola J, Chover AJ, Mico JA. Test-dependent relationship of the antidepressant and analgesic effects of amitriptyline. Methods Find Exp Clin Pharmacol. 1995;17(9):583–588.
110. Scheuermann K, Orellano LAA, Viana CTR, et al. Amitriptyline downregulates chronic inflammatory response to biomaterial in mice. Inflammation. 2021;44(2):580–591. doi:10.1007/s10753-020-01356-0
111. Valera E, Ubhi K, Mante M, Rockenstein E, Masliah E. Antidepressants reduce neuroinflammatory responses and astroglial alpha-synuclein accumulation in a transgenic mouse model of multiple system atrophy. Glia. 2014;62(2):317–337. doi:10.1002/glia.22610
112. Hałasa M, Łuszczki JJ, Dmoszyńska-Graniczka M, et al. Antagonistic interaction between histone deacetylase inhibitor: cambinol and cisplatin-an isobolographic analysis in breast cancer in vitro models. Int J Mol Sci. 2021;22(16):8573. doi:10.3390/ijms22168573
113. Osborne CK, Kitten L, Arteaga CL. Antagonism of chemotherapy-induced cytotoxicity for human breast cancer cells by antiestrogens. J Clin Oncol. 1989;7(6):710–717. doi:10.1200/JCO.1989.7.6.710
114. Choi YH, Yu AM. ABC transporters in multidrug resistance and pharmacokinetics, and strategies for drug development. Curr Pharm Des. 2014;20(5):793–807. doi:10.2174/138161282005140214165212
115. Sideras K, Ingle JN, Ames MM, et al. Coprescription of tamoxifen and medications that inhibit CYP2D6. J Clin Oncol. 2010;28(16):2768–2776. doi:10.1200/JCO.2009.23.8931
116. O’Reilly KE, Rojo F, She QB, et al. mTOR inhibition induces upstream receptor tyrosine kinase signaling and activates Akt. Cancer Res. 2006;66(3):1500–1508. doi:10.1158/0008-5472.CAN-05-2925
117. Carracedo A, Ma L, Teruya-Feldstein J, et al. Inhibition of mTORC1 leads to MAPK pathway activation through a PI3K-dependent feedback loop in human cancer. J Clin Invest. 2008;118(9):3065–3074. doi:10.1172/JCI34739
118. Chandarlapaty S, Sawai A, Scaltriti M, et al. AKT inhibition relieves feedback suppression of receptor tyrosine kinase expression and activity. Cancer Cell. 2011;19(1):58–71. doi:10.1016/j.ccr.2010.10.031
119. Tao H, Zhang Y, Zeng X, Shulman GI, Jin S. Niclosamide ethanolamine-induced mild mitochondrial uncoupling improves diabetic symptoms in mice. Nat Med. 2014;20(11):1263–1269. doi:10.1038/nm.3699
120. Lawson K. A brief review of the pharmacology of amitriptyline and clinical outcomes in treating fibromyalgia. Biomedicines. 2017;5(2):24. doi:10.3390/biomedicines5020024
 © 2026 The Author(s). This work is published and licensed by Dove Medical Press Limited. The
full terms of this license are available at https://www.dovepress.com/terms
and incorporate the Creative Commons Attribution
- Non Commercial (unported, 4.0) License.
By accessing the work you hereby accept the Terms. Non-commercial uses of the work are permitted
without any further permission from Dove Medical Press Limited, provided the work is properly
attributed. For permission for commercial use of this work, please see paragraphs 4.2 and 5 of our Terms.
© 2026 The Author(s). This work is published and licensed by Dove Medical Press Limited. The
full terms of this license are available at https://www.dovepress.com/terms
and incorporate the Creative Commons Attribution
- Non Commercial (unported, 4.0) License.
By accessing the work you hereby accept the Terms. Non-commercial uses of the work are permitted
without any further permission from Dove Medical Press Limited, provided the work is properly
attributed. For permission for commercial use of this work, please see paragraphs 4.2 and 5 of our Terms.
Recommended articles

Dual-Channel Detection of Breast Cancer Biomarkers CA15-3 and CEA in Human Serum Using Dialysis-Silicon Nanowire Field Effect Transistor
Li H, Wang S, Li X, Cheng C, Shen X, Wang T
International Journal of Nanomedicine 2022, 17:6289-6299
Published Date: 13 December 2022
CXCL12 and CXCR4 as Potential Early Biomarkers for Luminal A and Luminal B Subtypes of Breast Cancer
Motyka J, Gacuta E, Kicman A, Kulesza M, Malinowski P, Ławicki S
Cancer Management and Research 2023, 15:573-589
Published Date: 4 July 2023
Clinical Value of Serum sTim-3, CEA, CA15-3 for Postoperative Recurrence of Breast Cancer
Shen T, Fang H, Wu J, Qin Y, Zhou X, Zhao X, Huang B, Gao H
Cancer Management and Research 2025, 17:517-526
Published Date: 11 March 2025

Heterogeneity Assessment of Breast Cancer Tumor Microenvironment: Multiparametric Quantitative Analysis with DCE-MRI and Discovery of Radiomics Biomarkers
Ma W, Yang L, Zhang Y, Gao Y, Jie H, Huang C
Breast Cancer: Targets and Therapy 2025, 17:573-581
Published Date: 8 July 2025
Hematologic Glyco-Signatures: Emerging Blood-Based Sugar Codes Linked to Hyper-Aggressive Breast Cancer
Obeagu EI
Breast Cancer: Targets and Therapy 2026, 18:603801
Published Date: 1 May 2026