
Back to Journals » International Journal of Women's Health » Volume 18
Integrative Mendelian Randomization and Whole-Blood Transcriptomic Analysis Implicate a Myeloid–Inflammation Axis in Polycystic Ovary Syndrome
Received 24 October 2025
Accepted for publication 25 December 2025
Published 14 January 2026 Volume 2026:18 576568
DOI https://doi.org/10.2147/IJWH.S576568
Checked for plagiarism Yes
Review by Single anonymous peer review
Peer reviewer comments 2
Editor who approved publication: Dr Vinay Kumar
Yiman Fu,* Weihao Li,* Lin Ma
Laboratory for Assisted Reproduction and Reproductive Genetics, The Reproductive Medical Center, The Seventh Affiliated Hospital of Sun Yat-Sen University, Shenzhen, Guangdong, People’s Republic of China
*These authors contributed equally to this work
Correspondence: Lin Ma, Email [email protected]
Background: Immune dysregulation and low-grade inflammation are central to the pathophysiology of polycystic ovary syndrome (PCOS). However, putative causal relationships inferred from genetic instruments and their consistency with transcriptomic readouts remain underexplored.
Methods: We conducted two-sample Mendelian randomization (MR) to estimate potential causal relationships between 731 immune immunophenotypes and PCOS. In an independent, small whole-blood transcriptomic dataset (Gene Expression Omnibus [GEO]: GSE54248; PCOS n=4, controls n=4), we applied gene-signature–based deconvolution (xCell and Microenvironment Cell Populations-counter [MCP-counter]) and single-sample pathway scoring to profile myeloid cell composition and IL-6/JAK/STAT3 and tumor necrosis factor-α/nuclear factor κB (TNF-α/NF-κB) pathway activity. Robustness of the MR findings was examined by standard sensitivity analyses.
Results: MR indicated opposite-direction associations for key myeloid traits: higher absolute monocyte count was inversely associated with PCOS risk (odds ratio [OR] per standard deviation [SD] increase 0.52, 95% confidence interval [CI] 0.39– 0.69, P=6.21x10− 6, false discovery rate [FDR] q=0.002), whereas higher CD33+HLA-DR+ absolute count was positively associated with PCOS (OR per SD 1.61, 95% CI 1.27– 2.03, P=6.39x10− 5, FDR q=0.024). In the exploratory GSE54248 dataset, transcriptomic deconvolution suggested myeloid enrichment in PCOS, with tendencies toward higher signatures of monocytes, macrophages (M1/M2), and myeloid dendritic cells (DCs) and higher composite myeloid scores versus controls. Single-sample pathway analyses were consistent with increased IL-6/JAK/STAT3 and TNF-α/NF-κB activities in PCOS, with large effect sizes (Cohen’s d=2.27 and 2.16, respectively) but modest P-values (Wilcoxon P=0.057; Benjamini–Hochberg FDR q=0.143 for both pathways).
Conclusion: Genetic and transcriptomic evidence jointly support the concept of a myeloid–inflammation axis in PCOS. The inverse MR association for absolute monocyte count alongside positive risk for CD33+HLA-DR+ compartments, together with cross-cohort evidence of myeloid enrichment and inflammatory pathway activation, is compatible with a potential mechanistic link between immune imbalance and PCOS and provides a hypothesis-generating framework for future therapeutic investigation.
Keywords: polycystic ovary syndrome, immune cells, immunophenotypes, Mendelian randomization, inflammation, transcriptomics, myeloid cells
Introduction
Polycystic ovary syndrome (PCOS) is the most common endocrine disorder in women of reproductive age, affecting ~5%–20% globally and characterized by anovulatory infertility, hyperandrogenism, obesity, and insulin resistance (IR).1,2 Beyond reproductive manifestations, PCOS confers increased risks of type 2 diabetes mellitus (T2DM), cardiovascular disease, and endometrial cancer, underscoring its systemic nature.3 Converging evidence indicates that chronic low-grade inflammation is a hallmark of PCOS and interfaces with metabolic and reproductive phenotypes to drive disease progression.
Observational and epidemiologic studies link immune dysregulation to multiple clinical features of PCOS.4,5 Hyperandrogenism has been proposed to prime innate immune activation—facilitating monocyte recruitment and pro-inflammatory cytokine release—while IR and adiposity amplify systemic inflammation through adipose-tissue immune remodeling.4–7 Expanded neutrophil, macrophage, and T-cell populations have been reported in adipose depots, with adipokines (eg, leptin) and macrophage-derived mediators contributing to endocrine–immune crosstalk.6,7 Clinically, PCOS is associated with elevated circulating cytokines, including interleukin-6 (IL-6), interleukin-1 (IL-1), interleukin-17 (IL-17), interleukin-18 (IL-18), and tumor necrosis factor-α (TNF-α), consistent with activation of canonical inflammatory axes.5 Collectively, these observations support a working model in which immune and cytokine disturbances are integral—not merely epiphenomenal—to PCOS pathophysiology,8,9 yet the specific immune cell compartments that mediate this chronic inflammatory state remain incompletely defined.
Recent immunologic work has begun to dissect which leukocyte compartments are perturbed in PCOS. Detailed phenotyping in blood, adipose tissue, and ovarian samples indicates broad activation of both innate and adaptive arms of the immune system, with particular involvement of myeloid lineages. Women with PCOS exhibit higher circulating monocyte and neutrophil counts, increased infiltration and activation of macrophages and dendritic cells in ovarian and adipose tissues, and androgen-sensitive shifts in B-cell subsets.9–11 These observations support the notion that myeloid-biased inflammation may be a key mediator of metabolic and reproductive dysfunction in PCOS and motivate a systematic evaluation of immune cell subgroups in relation to PCOS risk. Notably, a recent MR study has reported potential causal associations between genetically proxied immune cell traits and PCOS,12 but systematic integration of detailed immunophenotypes with transcriptomic signatures of myeloid activation remains limited.
Observational associations are vulnerable to confounding and reverse causation and therefore cannot establish directionality. MR addresses this limitation by leveraging germline variants as instrumental variables to estimate putative causal effects under explicit assumptions, providing quasi-experimental evidence for risk factor–disease relationships.13 Because genetic variants are fixed at conception and are generally not influenced by environmental exposures or disease status, MR can help disentangle whether immune perturbations are more likely to represent upstream determinants or downstream consequences of PCOS. This design is particularly valuable in PCOS, where adiposity, insulin resistance, and inflammatory markers are tightly correlated and difficult to separate in conventional observational cohorts. Recent immunogenomic resources quantify hundreds of circulating immunophenotypes, enabling systematic interrogation of immune traits in complex disease,14,15 while GWAS and biobank-scale datasets provide well-powered outcome statistics for PCOS.16 Together, these advances enable movement beyond correlation to prioritize immune cell features with potential causal relevance to PCOS.
Building on this rationale, we conducted a two-sample MR analysis of 731 immunophenotypes to test their effects on PCOS risk, using independent European-ancestry datasets for exposures and outcomes.14–16 For orthogonal validation beyond genetic instrumentation, we analyzed an external whole-blood transcriptomic cohort (GSE54248) and inferred cell-type signals using complementary deconvolution frameworks—xCell17 and MCP-counter18 —which offer distinct modeling biases. We then quantified single-sample pathway activities with singscore,19 focusing on Molecular Signatures Database (MSigDB) Hallmark collections relevant to inflammation, including IL-6/JAK/STAT3 and TNF-α/NF-κB.20 This integrated strategy was designed to (i) reduce confounding through genetic instrumentation, (ii) cross-validate with physiologic transcriptomic readouts, and (iii) converge on cell-type and pathway-level mechanisms that may underpin immune–metabolic coupling in PCOS. In doing so, we sought to delineate a myeloid–inflammation axis in PCOS that is grounded in both genetic and transcriptomic evidence.
Materials and Methods
Two-Sample MR Analyses
Data Sources of Immunity
For each immune trait, datasets at the summary level were retrieved from a catalog of large-scale GWAS (accession numbers from GCST0001391 to GCST0002121).14 The datasets recruited 3735 European individuals with approximately 22 million single-nucleotide polymorphisms (SNPs).15 A total of 731 immunophenotypes were identified, including median fluorescence intensities (MFI) reflecting surface antigen levels (n = 389), relative cell (RC) counts (n = 192), absolute cell (AC) counts (n = 118), and morphological parameters (MP) counts (n = 32). More specifically, the MFI, RC, and AC features contained measurements for B cells, mature T cell stages, conventional dendritic cells (DCs), monocytes, myeloid cells, TBNK (T cells, B cells, natural killer cells), and regulatory T cells (Tregs) panels. The MP features contained CDC and TBNK panels. Genetic associations were adjusted for sex, and age.
Data Sources of PCOS
The summary-level datasets regarding PCOS were collected from Apollo (https://doi.org/10.17863/CAM.27720), which is the largest GWAS meta-analysis of PCOS in 10,074 PCOS cases and 103, 164 controls of European ancestry.16 Diagnosis of PCOS was based on National Institutes of Health (NIH) criteria, the Rotterdam criteria, or self-report questionnaire. Age in the cohort was adjusted for genetic associations. The other PCOS datasets were obtained from the FinnGen study (https://finngen.gitbook.io/documentation/), including 118,870 European participants (642 cases, 118,228 controls) and 16,379,676 genotyped SNPs in total. All PCOS cases were defined on the basis of clinically diagnosed from hospital discharge registries and cause of death registries using female-specific clinical endpoints (ICD-10: E282, ICD-8: 25,690). All GWAS summary statistics represent cross-sectional genetic associations and therefore do not provide direct temporal information on disease progression.
Genetic Instrument Selection
Given the large number of SNPs, the significance threshold for instrument variables (IVs) associated with immune traits was set to 5×10⁻⁶. Independent SNPs were obtained using an r2 threshold < 0.001 and 1000 kb clumping window, with the 1000 Genomes Project as a reference. To avoid weak IVs, the results of F-statistics21 were calculated for each IV. IVs with F-statistics < 10, indicating insufficient strength22 were excluded. For each immunophenotype, we documented the number of conditionally independent instruments retained after clumping and weak-instrument filtering; traits instrumented by only one or two SNPs were a priori flagged as lower-confidence exposures whose MR estimates would be interpreted in an exploratory, hypothesis-generating manner. Furthermore, MR Pleiotropy Residual Sum and Outlier (MR-PRESSO) analysis was performed to evaluate significant SNPs while accounting for possible pleiotropy.23 The IVs for GWAS and FinnGen were shown in Supplementary Table 1 and Supplementary Table 2, respectively.
Statistical Analyses
The inverse-variance-weighted (IVW) approach was applied for the main MR estimates to approximate the causal associations in this study. We used fixed effects IVW assuming that neither heterogeneity nor pleiotropy were observed. If the null hypothesis is rejected, random effects IVW was used instead of fixed effects IVW.13 Despite less efficient test power, MR-Egger, and weighted median (WM) were also used as a complementary set of estimators for IVW estimates, since these approaches might take advantage of more robust estimates when analyzing in a broader set of scenarios (wider CIs). P<0.05 represented statistical significance. The causal effect estimates, equivalent to β coefficients, were calculated and then transformed to odds ratios. Multiple comparisons were adjusted using theFDR (Benjamini and Hochberg). The analyses were carried out using “TwoSampleMR”, “MRPRESSO” in the R software (version 4.3.1, The R Foundation, Vienna, Austria).
Sensitivity Analyses
Cochran Q–derived P<0.05 from the IVW and MR-Egger approaches were used to represent potential heterogeneity. To exclude the effect of horizontal pleiotropy, MR-Egger was applied, which is an indicator if its intercept term is significant.23 Furthermore, PhenoScanner (http://www.phenoscanner.medschl.cam.ac.uk/) was used to determine all SNPs with positive results whether there were potential confounders. MR-PRESSO was performed to exclude possible horizontal pleiotropic outliers. Additionally, we used a funnel plot to show heterogeneity and leave-one-out (LOO) analysis was performed to evaluate whether the MR estimate was driven or biased by a single SNP. All sensitivity analyses were pre-specified and used primarily to assess robustness. MR results showing substantial heterogeneity, evidence of directional pleiotropy, or reliance on a very small number of instruments were treated as less reliable and emphasized as exploratory.
Transcriptomic Validation Cohort
Dataset and Preprocessing
To cross-validate the MR-prioritized immune signals, we analyzed an independent whole-blood microarray/RNA-seq cohort from GEO dataset (https://www.ncbi.nlm.nih.gov/) GSE54248 (Illumina HumanHT-12 v4 microarray) that included PCOS (n=4) and control (n=4). Given the small, cross-sectional sample, all transcriptomic analyses were prespecified and treated as exploratory, with emphasis on effect-size patterns and internal consistency rather than on definitive hypothesis testing. Probe intensities were background-corrected, between-array normalized, log2-transformed, and mapped to gene symbols; multiple probes per gene were collapsed by variance. Differential expression used limma with Benjamini–Hochberg (BH) FDR control. Because detailed clinical metadata on medication use, diet, body mass index, smoking, and other lifestyle or treatment-related factors were not consistently available, no additional covariates beyond case–control status were modeled, and residual confounding of transcriptomic differences by such factors cannot be excluded.
Cell-Type Deconvolution
We inferred immune cell signatures using two complementary frameworks with distinct modeling assumptions: xCell (gene-signature based) and MCP-counter (marker-based). For each method, we computed per-sample enrichment scores for myeloid and lymphoid lineages relevant to PCOS pathophysiology. Concordance between methods was evaluated qualitatively (direction) and quantitatively (correlation of score differences). Given the limited sample size, deconvolution outputs were interpreted as descriptive indicators of relative myeloid and lymphoid enrichment.
Pathway Activity Scoring
Single-sample pathway activities were quantified using singscore, a rank-based approach robust to platform differences. We focused on MSigDB Hallmark collections with a priori relevance to immuno-metabolic coupling in PCOS (eg, IL-6/JAK/STAT3, TNF-α/NF-κB). Pathway scores were compared between PCOS and control groups and correlated with deconvolved immune signatures where appropriate to characterize patterns of inflammatory signaling associated with PCOS.
Summary Indices and Statistics
A curated CD33+HLA-DR+ myeloid gene signature was z-scored and averaged per sample. Composite myeloid scores were computed as the first principal component (PC1) from principal component analysis (PCA) and as the mean of z-scores. Group differences used the Wilcoxon rank-sum test; effect sizes were reported as Cohen’s d. Robustness employed label permutation (empirical P) and leave-one-out analysis. Correlations used Spearman coefficients, and we refrained from drawing strong conclusions based solely on P-values from these tests.
Results
Two-Sample MR Analyses
Genetic Instrument Variables for Immunophenotypes
The study workflow is summarized in Figure 1. After quality control and linkage disequilibrium (LD) clumping, a set of genome-wide significant and mutually independent SNPs was retained as instruments for each immunophenotype. Per-trait instrument counts and F-statistics are summarized in; Supplementary Tables 1–2; Table 1 (GWAS meta-analysis) and Table 2 (FinnGen) report the MR results. Palindromic and strand-ambiguous variants were excluded prior to harmonization.
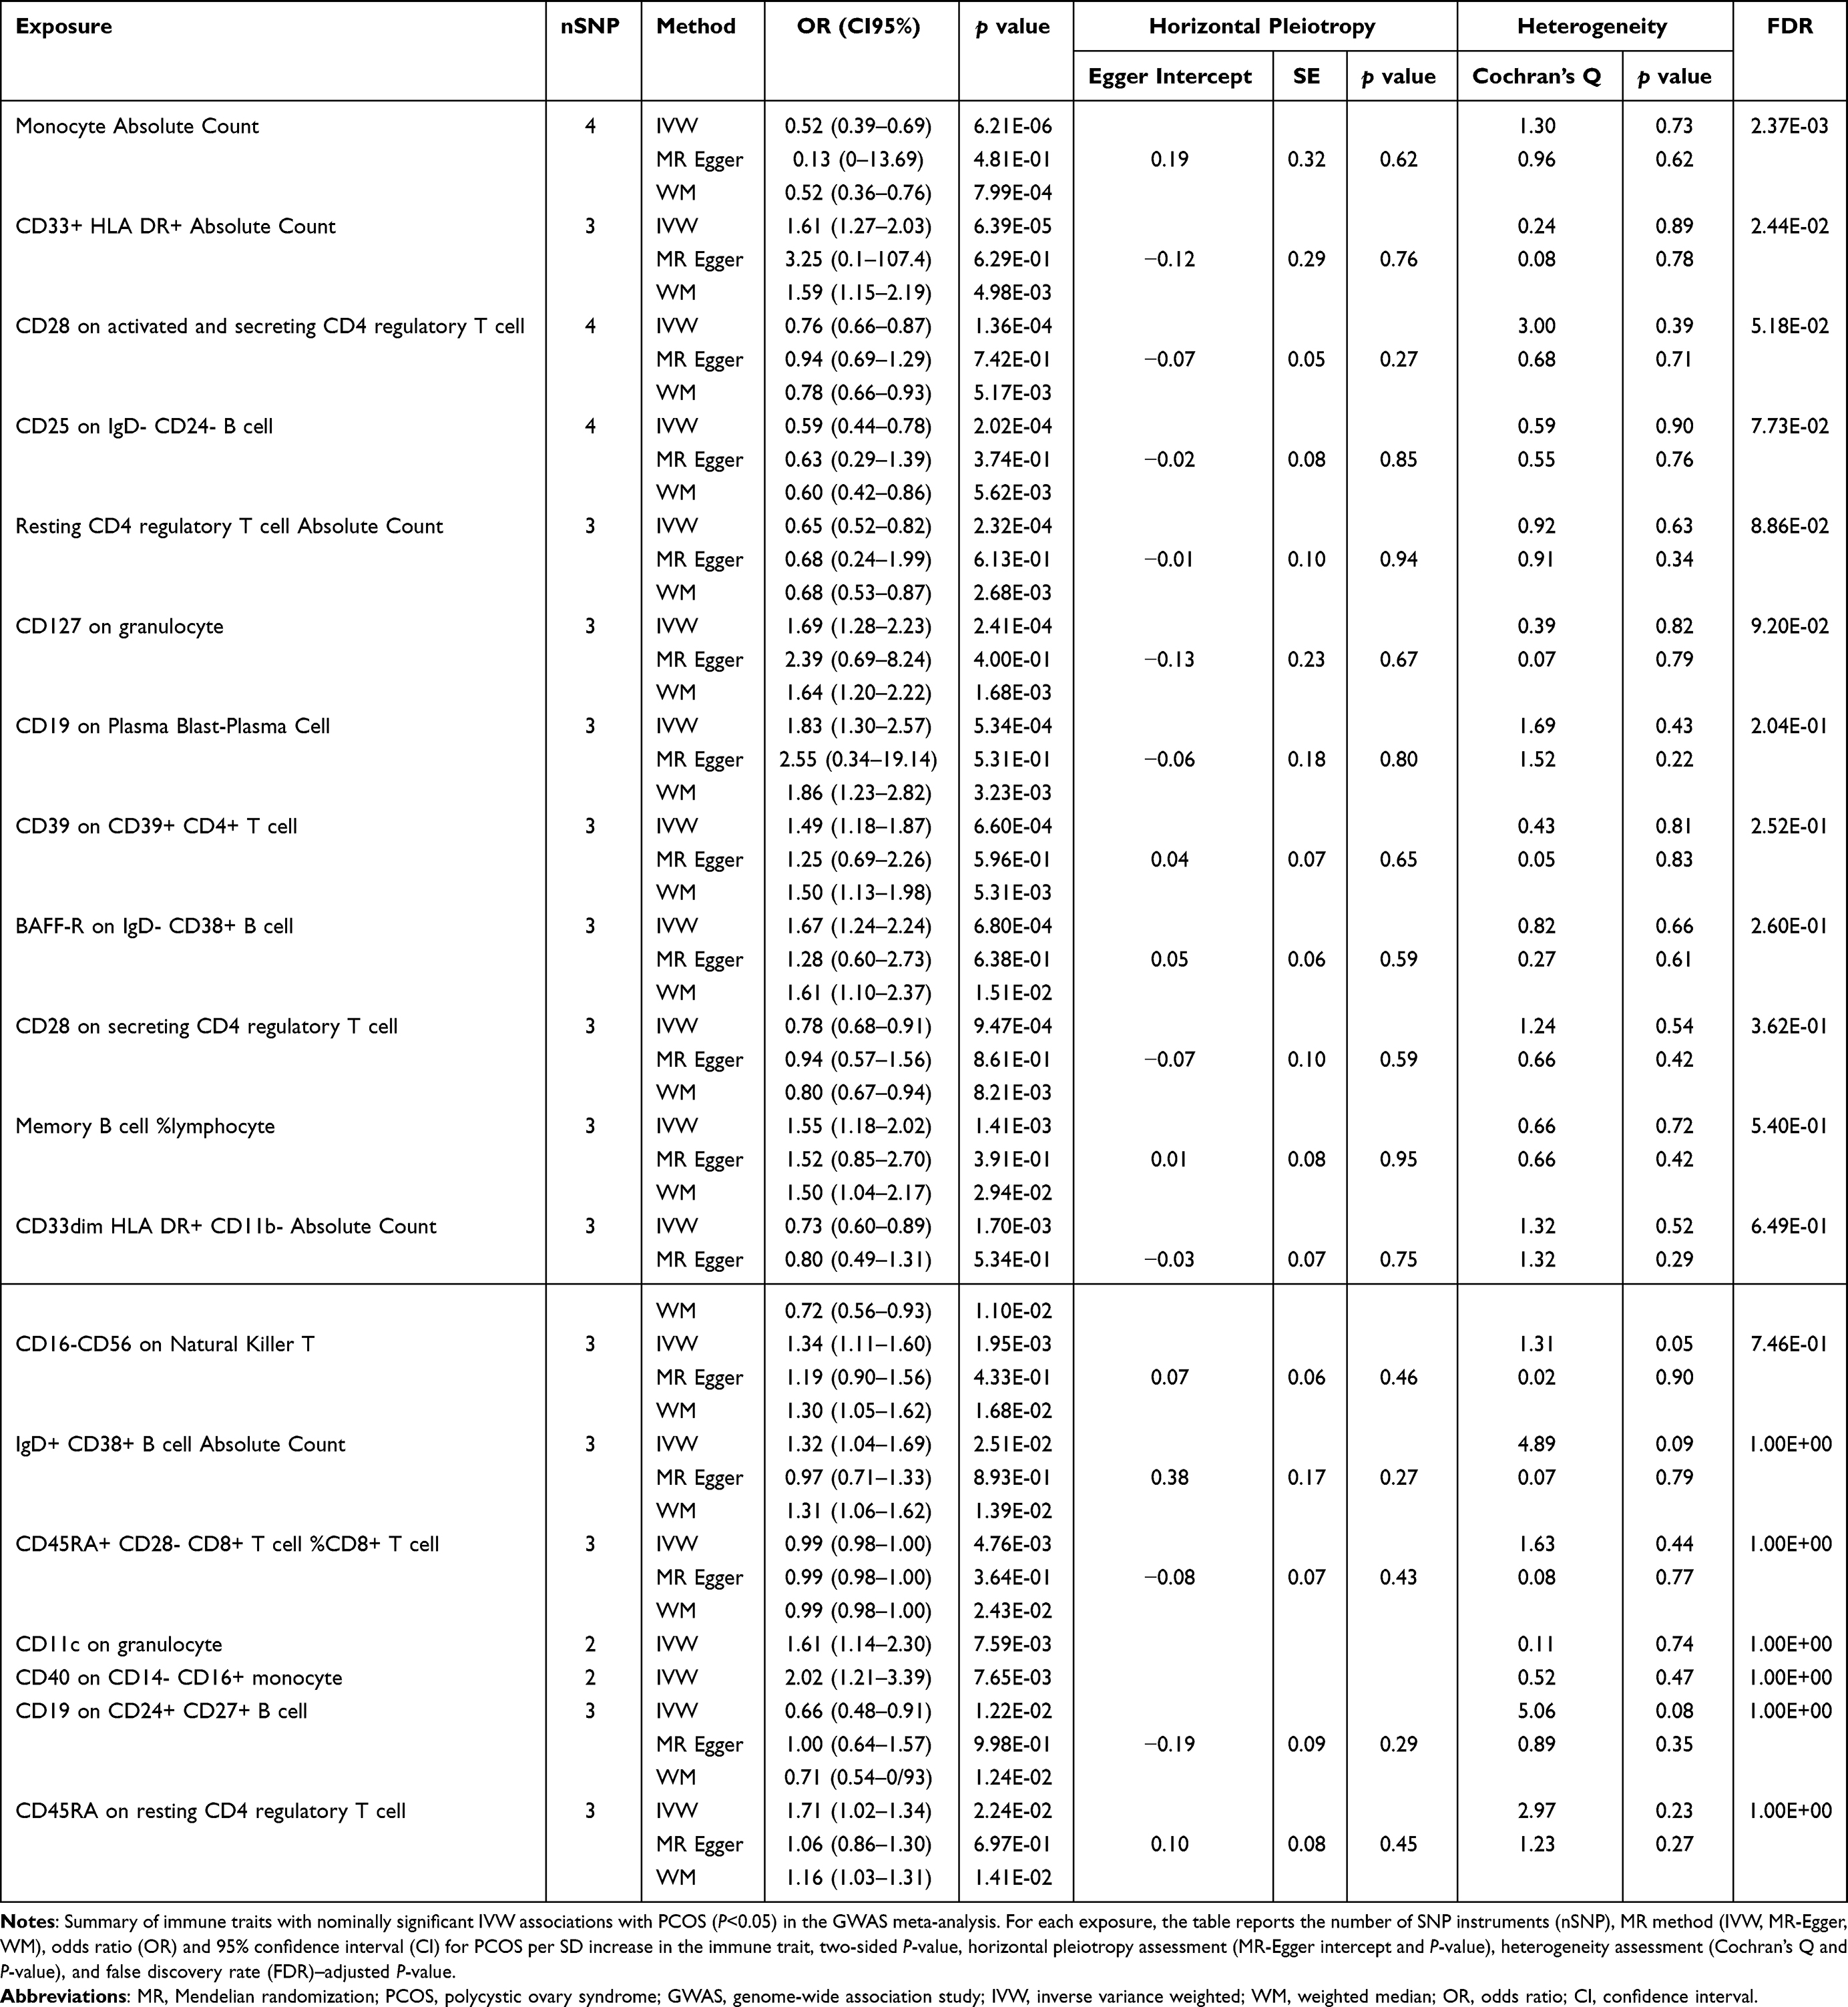 |
Table 1 Mendelian Randomization Associations Between Immunophenotypes and PCOS in the GWAS Meta-Analysis Dataset |
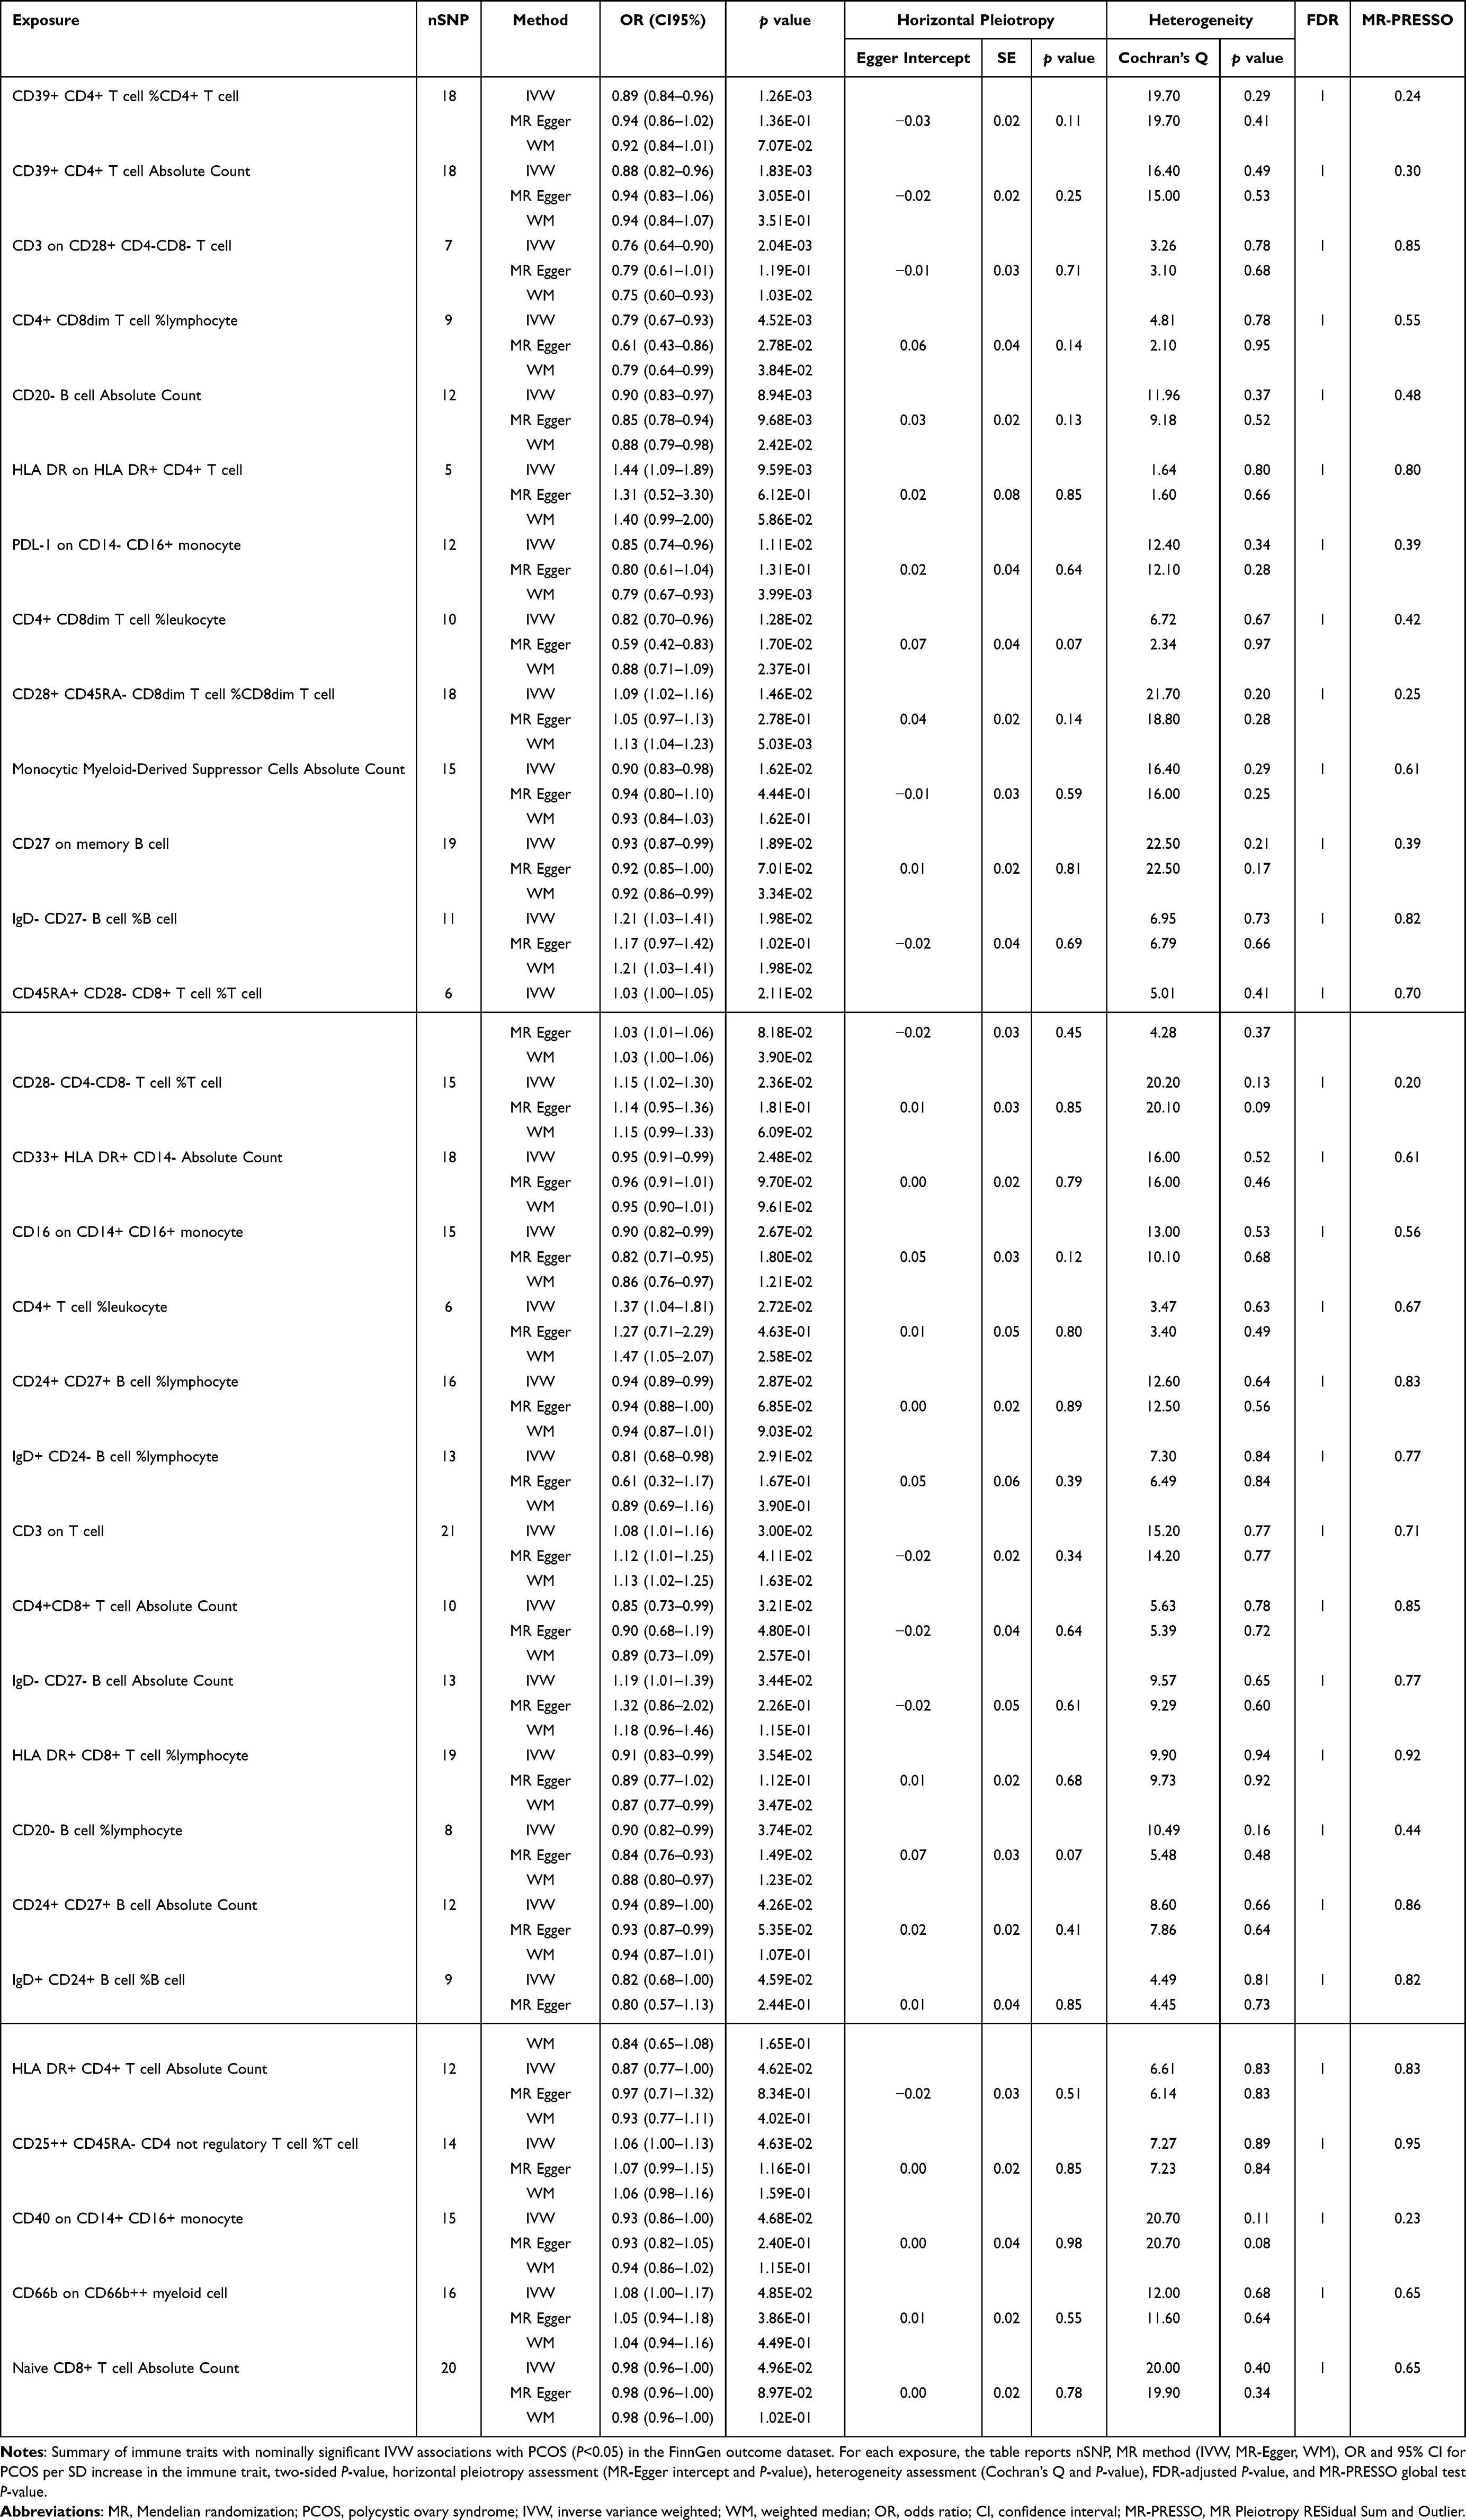 |
Table 2 Mendelian Randomization Associations Between Immunophenotypes and PCOS in the FinnGen Replication Dataset |
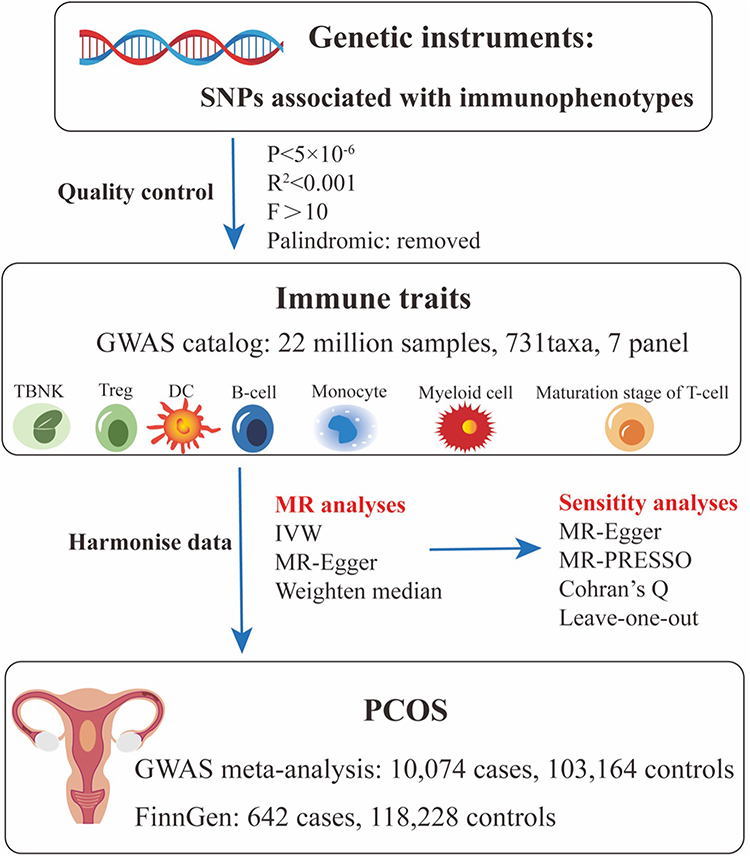 |
Figure 1 Study design of the two-sample Mendelian randomization (MR) analyses evaluating associations between genetically proxied immune traits and polycystic ovary syndrome (PCOS). Single nucleotide polymorphisms (SNPs) associated with 731 immunophenotypes (P<5×10−⁶, linkage disequilibrium r²<0.001 within a 1000-kb window, F-statistic>10, palindromic variants removed) were selected as genetic instruments from a genome-wide association study (GWAS) catalog of 3735 European individuals (~22 million SNPs across seven immunophenotype panels: TBNK, Treg, dendritic cells [DCs], B cells, monocytes, myeloid cells, and T-cell maturation stages). Harmonized exposure and outcome summary statistics were combined with PCOS data from a GWAS meta-analysis (10,074 cases, 103,164 controls) and from FinnGen (642 cases, 118,228 controls). Main MR analyses used the inverse-variance–weighted (IVW) estimator, with MR-Egger and weighted median (WM) as sensitivity estimators and MR Pleiotropy RESidual Sum and Outlier (MR-PRESSO) for outlier and pleiotropy detection. |
Causal Effects of the Genetically Predicted Immunophenotypes on PCOS in GWAS Meta-Analysis Datasets
As depicted in Figure 2, 19 immunophenotypes reached suggestive evidence of association with PCOS, of which 2 in the Monocyte panel, 2 in the Myeloid cell panel, 5 in Treg panel, 3 in the Maturation stages of T-cell panel, 4 in the DC Panel, and 3 in the B-cell panel. After multiple test adjustment based on the FDR method, 2 immune traits including monocyte absolute count and CD33+ HLA DR+ absolute count remained statistically significant at the level of P<0.05. We found protective effects of 8 immunophenotypes on PCOS, and 11 immunophenotypes increasing the risk of PCOS. All immune traits were observed to have consistent results by using MR-Egger and WM, except for IgD+ CD38+ B cell absolute count and CD19 on CD24+ CD27+ B cell (Figure 3). Heterogeneity was not detected in sensitivity analysis. The intercept of MR-Egger did not detect potential horizontal pleiotropy (Table 1). Global test of MR-PRESSO for monocyte absolute count (P=0.82), CD28 on activated and secreting CD4 regulatory T cell (P=0.47), and CD25 on IgD− CD24− B cell (P=0.90) also did not show potential horizontal pleiotropy. In addition, funnel plots and leave-one-out analysis indicated the stability of the results (Supplementary file 1−2), highlighting a pattern in which higher genetically proxied monocyte absolute count is associated with lower PCOS risk, whereas higher CD33+ HLA DR+ absolute count is associated with increased risk.
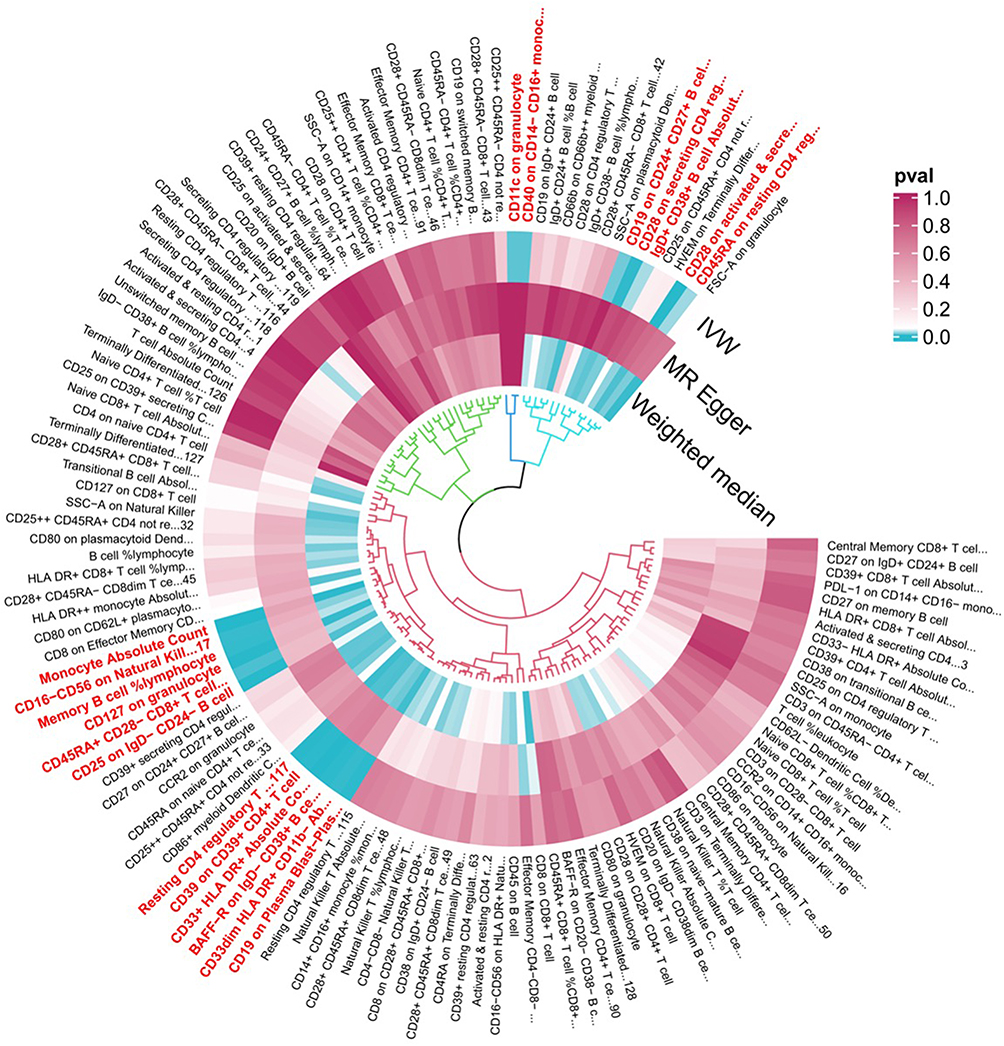 |
Figure 2 Mendelian randomization P-values for associations between genetically proxied immune traits and PCOS in the GWAS meta-analysis dataset. Each radial position corresponds to one immunophenotype. From outside to inside, the three concentric rings display two-sided P-values for the IVW, MR-Egger, and WM estimators, respectively. The color scale reflects P-values (0.0–1.0), with darker tiles indicating stronger evidence for an association between higher genetically proxied trait levels and PCOS risk; the direction (risk-increasing vs risk-decreasing) is given by the sign of the corresponding IVW log-odds ratio (see Figures 3 and 4). The underlying GWAS meta-analysis comprises 10,074 PCOS cases and 103,164 controls of European ancestry. Abbreviations: PCOS, polycystic ovary syndrome; MR, Mendelian randomization; IVW, inverse variance weighted; WM, weighted median. |
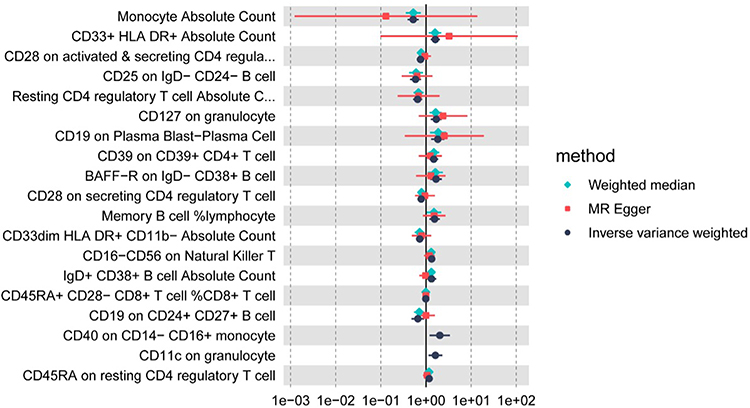 |
Figure 3 Causal effect estimates for immune traits associated with PCOS in the GWAS meta-analysis dataset. Each row represents one immunophenotype that showed a nominally significant IVW association with PCOS (P<0.05) in the discovery GWAS meta-analysis. Points denote odds ratios (ORs) and 95% confidence intervals (CIs) for PCOS per standard deviation (SD) increase in the corresponding immune trait, estimated using IVW (black), MR-Egger (red), and WM (green) methods in 10,074 PCOS cases and 103,164 controls. ORs>1 indicate that higher genetically proxied trait levels are associated with increased PCOS risk, whereas ORs<1 indicate inverse (putatively protective) associations. |
Causal Effects of the Genetically Predicted Immunophenotypes on PCOS in FinnGen Datasets
Replication in the independent FinnGen outcome dataset yielded convergent results (Figure 4). By the IVW method, 31 immunophenotypes reached suggestive evidence of association with PCOS, predominantly mapping to monocyte/macrophage lineages and antigen-presenting cell signatures. Sensitivity estimators (weighted median and MR-Egger) generally supported the direction of effects, and pleiotropy/heterogeneity diagnostics were broadly consistent with those in the discovery analysis (Supplementary file 3). Leave-one-out analyses corroborated the robustness of the replicated signals (Supplementary file 4). These replicated patterns reinforce a myeloid-oriented signal for PCOS risk, although validation in additional cohorts will be important for confirming individual trait associations.
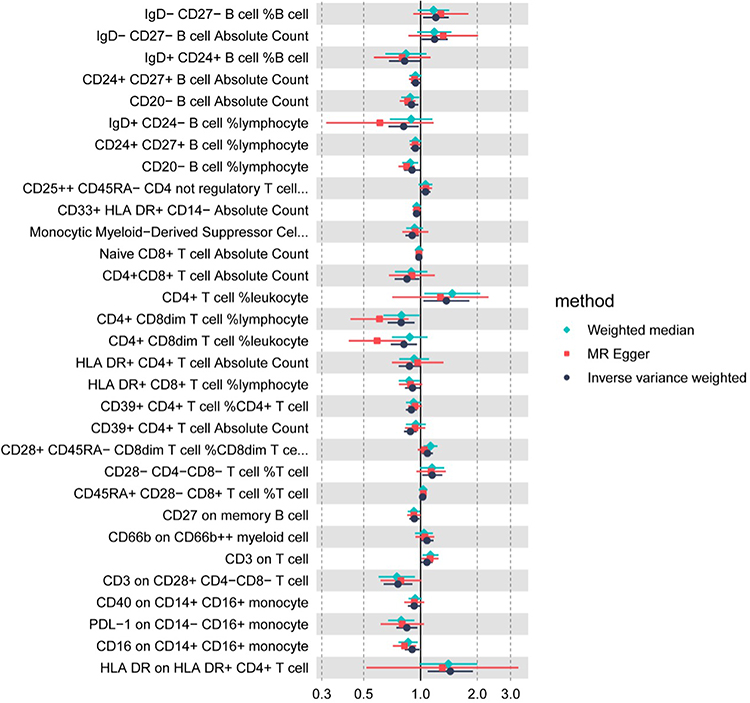 |
Figure 4 Causal effect estimates for immune traits associated with PCOS in the FinnGen outcome dataset. Each row represents one immunophenotype that showed a nominally significant IVW association with PCOS (P<0.05) in the FinnGen replication analysis. Points denote ORs and 95% CIs for PCOS per SD increase in the corresponding immune trait, estimated using IVW (black), MR-Egger (red), and WM (green) methods in 642 PCOS cases and 118,228 controls. ORs>1 indicate that higher genetically proxied trait levels are associated with increased PCOS risk, whereas ORs<1 indicate inverse associations. |
Transcriptomic Validation Supports a Blood Myeloid–Inflammation Axis
Cell-Type Signals
In the external whole-blood cohort (GSE54248), 4 PCOS and 4 controls, analyzed as an exploratory validation dataset, deconvolution with two complementary frameworks showed a concordant increase of myeloid signatures in PCOS versus controls. By xCell, enrichment scores trended higher for monocytes (Wilcoxon P=0.460, BH-FDR q=0.643, Cohen’s d=0.71), macrophage M1 (P=0.886, q=0.886, d=0.21), macrophage M2 (P=0.408, q=0.643, d=0.85), and myeloid dendritic cells— aDC (P=0.343, q=0.643, d=0.71) in PCOS, whereas iDC was lower in PCOS (P=0.114, q=0.643, d=−2.23) (Figure 5A). MCP-counter reproduced elevations in the monocytic lineage (P=0.057, q=0.086, d=1.61) and showed higher myeloid dendritic cells (P=0.686, q=0.686, d=0.75) in PCOS (Figure 5B). In contrast, neutrophil signals were not consistently increased across methods: xCell showed no difference (P=0.772, q=0.886, d=0.71), whereas MCP-counter indicated higher neutrophils in PCOS (P=0.029, q=0.086, d=3.25). Taken together, method-level agreement for monocytic/myeloid DC features, the less consistent pattern for neutrophils, and the large effect sizes despite wide confidence intervals are consistent with a myeloid shift in PCOS in this small cohort, while formal statistical significance is limited by sample size.
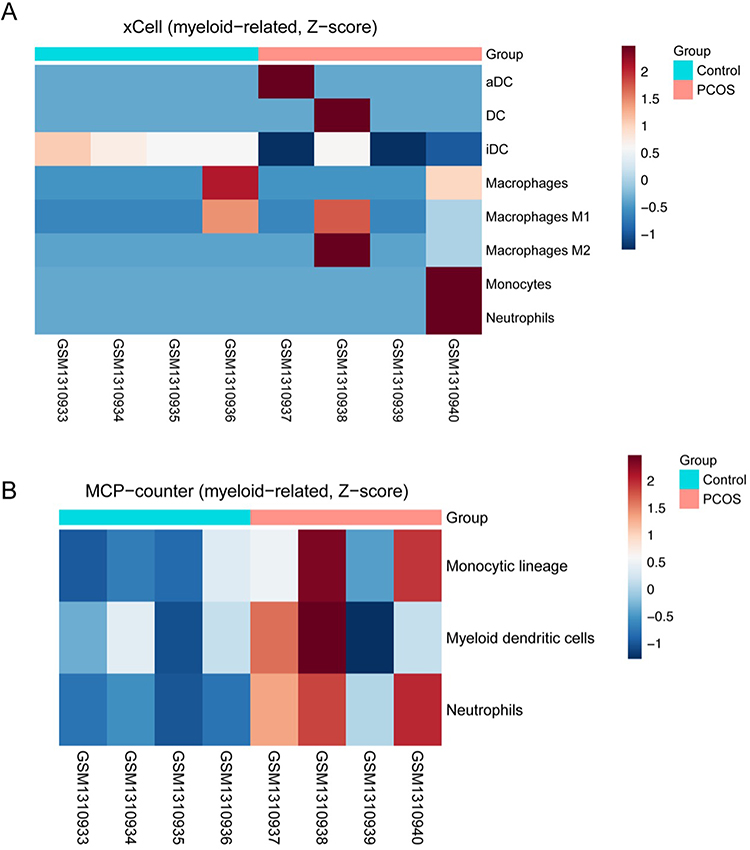 |
Figure 5 Myeloid-related enrichment scores inferred from xCell and Microenvironment Cell Populations-counter (MCP-counter) in PCOS and control whole blood. (A) xCell myeloid-related heatmap showing enrichment scores for monocyte, macrophage (total, M1, and M2), and myeloid dendritic cell (activated dendritic cells [aDCs], immature dendritic cells [iDCs], and DCs) signatures in PCOS (n=4) and control (n=4) samples. (B) MCP-counter myeloid heatmap summarizing monocytic lineage, myeloid dendritic cell, and neutrophil signatures in the same samples. Rows are scaled to Z-scores; higher values indicate higher relative enrichment within each signature, and each column represents one individual sample. Group differences were evaluated using Wilcoxon rank-sum tests (see main text for detailed statistics). |
Myeloid–Inflammation Axis
Both the PCA-derived PC1 and the z-score–mean composite myeloid scores were elevated in PCOS (Figure 6A and B), consistent with a global myeloid shift. Single-sample pathway activities also trended higher in PCOS with large effects: IL-6/JAK/STAT3 (Cohen’s d=2.27, Wilcoxon P=0.057, BH-FDR q=0.143) and TNF-α/NF-κB (d=2.16, P=0.057, q=0.143) (Supplementary Figure 1). Robustness checks supported these findings: label-permutation tests yielded empirical Pperm=0.048 for IL-6/JAK/STAT3 and 0.050 for TNF-α/NF-κB, and leave-one-out analyses preserved the effect direction with LOO P ranges of 0.057–0.114 for both pathways. Across samples, myeloid metrics—including the curated CD33+HLA-DR+ signature and the composite scores—showed positive rank correlations with IL-6/JAK/STAT3 (ρ=0.619, P=0.102, q=0.183) and TNF-α/NF-κB (ρ=0.524, P=0.183, q=0.183) activities, providing exploratory support for a unified myeloid–inflammation axis in PCOS while recognizing the limited power of this small external cohort.
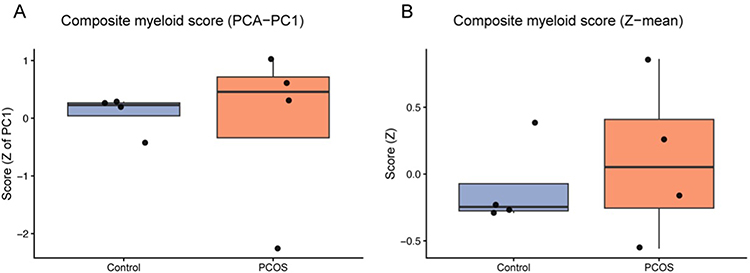 |
Figure 6 Composite myeloid scores in PCOS and control whole blood. (A) Composite myeloid score derived from the first principal component (PCA–PC1) of selected myeloid-related signatures. (B) Composite myeloid score computed as the mean of Z-scored myeloid signatures (z-mean). Boxplots show the distribution of composite scores in PCOS (n=4) and control (n=4) samples; higher scores indicate greater inferred myeloid enrichment. Group differences were assessed using Wilcoxon rank-sum tests (see main text for detailed statistics). |
Discussion
This study integrates two-sample MR with an independent, small whole-blood transcriptomic cohort to probe the immune–inflammatory architecture of PCOS in a complementary manner. Across 731 immunophenotypes, MR highlighted myeloid-skewed traits—particularly absolute monocyte counts and CD33+HLA-DR+ absolute count—with statistically robust associations with PCOS risk in the primary GWAS meta-analysis. Orthogonal analysis in GSE54248 suggested higher enrichment of monocytes, macrophage M1/M2, and myeloid dendritic cells in PCOS compared with controls, and composite myeloid scores (PCA-PC1 and z-score mean) were elevated and positively aligned with IL-6/JAK/STAT3 and TNF-α/NF-κB pathway activities in this exploratory dataset. Together, these multilayer signals are consistent with a peripheral myeloid–inflammation axis, in keeping with the immunometabolic heterogeneity of PCOS and with blood-based reports of inflammatory gene-expression changes and elevated circulating cytokines (eg, TNF-α, IL-6),24 as well as links between peripheral myeloid activation and cardiometabolic burden in PCOS.25,26
Monocytes constitute ~3–8% of circulating leukocytes and are central to innate–adaptive crosstalk.27 Although hyperandrogenism and pro-inflammatory polarization link monocytes to systemic inflammation, oxidative stress, and cardiometabolic risk in PCOS,28,29 our MR indicates that higher absolute monocyte count associates with lower PCOS risk, which at first glance appears to contrast with the myeloid enrichment and inflammatory pathway activation observed in the GEO dataset. This apparent discrepancy can be partly explained by several factors. First, absolute monocyte count in MR aggregates heterogeneous subsets with distinct functions (eg, classical, intermediate, and non-classical monocytes), and the genetic instruments may preferentially capture variation in specific compartments or homeostatic turnover rather than the activated myeloid states detected by bulk transcriptomics.30 Second, the expression cohort is small and cross-sectional, likely reflecting established disease with context-dependent inflammatory activation, whereas MR estimates life-long genetically proxied differences under key instrumental-variable assumptions.31,32 Under this framework, expansion of certain monocyte compartments could, in some individuals, represent a compensatory or surveillance-oriented response, while other, more pathogenic myeloid states are captured in the transcriptomic signal. Residual bias or non-linear relationships in either data source also cannot be fully excluded despite sensitivity analyses. Thus, rather than a simple contradiction, the protective MR association for total monocyte count and the transcriptomic evidence of myeloid activation should be viewed as pointing to subset- and state-specific myeloid heterogeneity that warrants dedicated mechanistic dissection. In this context, the myeloid enrichment observed in GSE54248 is most plausibly interpreted as reflecting shifts toward activated and inflammatory myeloid states rather than a simple increase in total monocyte number, which helps reconcile the inverse MR association with the expression-based evidence of myeloid activation. In aggregate, the directional MR signal and the exploratory GEO patterns support a working hypothesis that myeloid balance contributes to PCOS susceptibility, but they stop short of proving a single, unified causal mechanism.
DCs orchestrate antigen capture and T-cell priming in secondary lymphoid organs.33,34 Prior studies report reduced DC proportions and altered HLA-DR maturation indices in PCOS follicles.35,36 Extending this, our instruments showed divergent risks: CD33+ HLA-DR+ absolute count associated with higher PCOS risk, whereas CD33dim HLA-DR+ CD11b− absolute count associated with lower risk—consistent with functional heterogeneity among myeloid antigen-presenting cells (pro-inflammatory versus more regulatory/maturation-skewed compartments). Importantly, CD33+ HLA-DR+ cells are antigen-presenting myeloid populations rather than classical myeloid-derived suppressor cells (MDSCs), which are typically CD33+ HLA-DRlow/−.37 Concordant GEO signals (myeloid features plus pathway activation) may provide a phenotypic bridge that helps link genetically influenced shifts in DC/monocyte pools to differences in disease susceptibility, although functional studies are needed to test this model directly. Notably, we identified seven DC-panel immunophenotypes linked to PCOS across GWAS and FinnGen, genetically prioritizing discrete DC/monocyte states as hypothesis-generating candidates for future mechanistic follow-up rather than implying that any single marker is itself causal.
Beyond these aggregate markers, functional heterogeneity within myeloid lineages is likely central to PCOS pathogenesis. Classical CD14++CD16− monocytes and inflammatory macrophages are key producers of IL-6 and TNF-α in metabolic disease and can exacerbate insulin resistance, oxidative stress, and lipotoxicity in target tissues, whereas non-classical CD14+CD16++ monocytes and more regulatory macrophage/DC subsets may participate in tissue surveillance and resolution.27,30 In the ovary and adipose tissue, distinct macrophage and DC subsets differentially modulate steroidogenesis, follicular development, and adipose remodeling, suggesting that the balance between pro-inflammatory and pro-resolving myeloid states could shape both reproductive and metabolic phenotypes in PCOS. Our divergent genetic associations for CD33+ HLA-DR+ versus CD33dim HLA-DR+ CD11b− compartments are compatible with such heterogeneity and support the notion that specific myeloid activation states, rather than total myeloid abundance, may be most relevant to disease risk.
Beyond myeloid antigen-presenting cells (APCs), endometrial and peripheral T-cell dysregulation in PCOS includes Th1/Th2 imbalance, expansion of CD4+CD28− cytotoxic-like T cells, and altered Treg tone.38,39 Our genetic screen similarly implicated T-cell immunophenotypes spanning Treg and maturation states with bidirectional associations with PCOS risk. Rather than enumerating markers, the pattern is most parsimoniously interpreted at the pathway level: risk-increasing instruments cluster in activation/effector-skewed compartments, whereas risk-decreasing instruments index regulatory/resting states. This is compatible with GEO pathway readouts (IL-6/JAK/STAT3 and TNF-α/NF-κB up-shift), raising the possibility that genetically influenced tilts in T-cell maturation/regulation may manifest as inflammatory activation detectable in bulk blood.
Macrophage/natural killer (NK) context also fits this framework. The literature reports increased macrophages and reduced NK (CD56+/CD56bright) in PCOS, with macrophage cytokines (TNF-α, IL-6, IL-10, IL-18) engaging NF-κB and supporting chronic low-grade inflammation.40,41 Hormone-responsive uterine NK (uNK) dynamics may also be perturbed in PCOS.40,42 In our data, myeloid enrichment (GEO) together with myeloid-linked MR instruments aligns with macrophage-centric inflammation, whereas NK alterations—less uniformly captured by whole-blood deconvolution—likely represent compartment-specific changes warranting targeted validation.
From a mechanistic perspective, the IL-6/JAK/STAT3 and TNF-α/NF-κB pathways highlighted in our pathway analyses are well positioned to mediate crosstalk between myeloid cells and ovarian and metabolic phenotypes. IL-6, TNF-α, and related cytokines can impair insulin signaling, enhance oxidative stress, and alter steroidogenic enzyme expression in granulosa and theca cells, thereby perturbing follicular development and oocyte competence.4,5,10 Recent work in women undergoing IVF further suggests that anti-Müllerian hormone (AMH) may act as a surrogate marker of follicular oxidative stress in PCOS, linking hormonal readouts to oocyte quality and embryo development.43 Integrating systemic myeloid-inflammatory signatures with follicular hormonal and oxidative markers, including AMH, may therefore help delineate multi-level pathways by which myeloid activation contributes to ovarian dysfunction in PCOS and underscores the value of multi-omic approaches that combine genetics, immunophenotyping, transcriptomics, and follicular fluid biomarkers.
Taken together, the MR analyses provide genetically anchored evidence on the direction of association between selected immune traits and PCOS under standard instrumental-variable assumptions, while the GEO data illustrate how a myeloid-skewed inflammatory milieu may manifest at the bulk-blood level. The observed coupling of composite myeloid scores with IL-6/JAK/STAT3 and TNF-α/NF-κB activities offers a plausible functional bridge between myeloid traits and clinical outcomes, but this should be interpreted as supportive of a mechanistic model rather than as proof of a fully resolved causal chain. The triangulation across genetic instruments, inferred cell composition, and pathway activity across two independent outcome datasets and multiple algorithms makes a purely artefactual explanation (eg, batch effects alone) less likely, although it cannot be definitively excluded.
Several limitations merit emphasis. First, the external validation cohort is small (n=4 PCOS vs n=4 controls), severely limiting probe-level statistical power and the precision of deconvolution. Accordingly, we focus on effect directions, cross-method concordance, and composite indices, and regard all transcriptomic findings as exploratory. Future validation in larger, independent, preferably RNA-seq–based whole-blood and tissue cohorts with richer clinical annotation will be essential to confirm and refine the patterns described here. Second, bulk whole-blood profiles conflate changes in cell proportions with within-cell activation states. Resolving classical versus non-classical monocytes and dendritic-cell subsets, and distinguishing circulating from tissue-resident compartments, will require single-cell RNA-seq, high-dimensional cytometry, or sorted multi-omics approaches. We also lacked detailed information on concomitant medications, dietary patterns, physical activity, or other lifestyle factors in GSE54248, all of which can modulate peripheral gene expression and may partially confound some of the observed transcriptomic differences. Third, both the immunophenotype GWAS and PCOS GWAS are largely restricted to individuals of European ancestry and rely on cross-sectional designs, which may limit generalizability and preclude direct temporal inference. Fourth, some MR estimates are based on a relatively small number of genetic instruments or explain only a modest proportion of trait variance; even with F-statistic filtering, pleiotropy-robust estimators, and sensitivity analyses, residual pleiotropy or weak-instrument bias remain possible.31,32,44 Finally, while MR strengthens causal interpretation at the level of risk factors, a complete mediation chain has not been demonstrated. Multivariable and mediation MR, colocalization, and experimental perturbation will be needed to bridge GWAS loci, myeloid gene expression, and clinical manifestations of PCOS. Building on these findings, future studies should combine high-dimensional immune profiling (eg, single-cell RNA-seq and mass cytometry of blood and follicular compartments), longitudinal designs that track myeloid and cytokine signatures across the reproductive and metabolic course of PCOS, and interventional trials testing whether targeted modulation of myeloid-inflammatory pathways can improve ovarian function, metabolic parameters, or treatment responses. Integrative multi-omic frameworks that link genetics, detailed immunophenotyping, transcriptomics, and follicular fluid biomarkers (including oxidative and hormonal markers such as AMH) will be particularly informative for refining PCOS endotypes and identifying patients most likely to benefit from specific immunomodulatory strategies.
Overall, integrating genetic instruments with cross-cohort transcriptomic evidence, including the GEO datasets, supports a coherent working model of myeloid-driven inflammation in PCOS and delineates concrete, testable avenues for replication, mechanistic dissection, and eventual clinical translation.
Conclusion
By combining two-sample MR with an exploratory GEO whole-blood transcriptomic cohort, we propose a myeloid–inflammation axis in PCOS: genetically proxied myeloid traits show directionally consistent patterns with myeloid enrichment and higher IL-6/JAK/STAT3 and TNF-α/NF-κB activity in these datasets. This cross-layer concordance—genetic instruments, cell-composition estimates, and pathway readouts—supports a working mechanistic model rather than a fully established causal chain and suggests tractable translational metrics for risk stratification, endotyping, and pharmacodynamic monitoring. Given the limited transcriptomic sample size (4 PCOS vs 4 controls), these expression-based findings should be regarded as hypothesis-generating and require confirmation in larger, independent cohorts. Priorities now include colocalization analyses and transcriptome-wide association studies (TWAS) to anchor PCOS loci within myeloid regulatory networks, single-cell resolution mapping of myeloid subsets, and preclinical and clinical studies testing whether attenuation of myeloid-inflammatory signaling improves ovarian and metabolic outcomes within multi-omic frameworks that also incorporate follicular hormonal and oxidative stress markers.
Abbreviations
PCOS, Polycystic ovary syndrome; MR, Mendelian randomization; MFI, median fluorescence intensities; RC, relative cell; AC, absolute cell; MP, morphological parameters; IVW, Inverse variance weighting; FDR, false discovery rate; IR, insulin resistance; T2DM, type 2 diabetes mellitus; IL-6, interleukin-6; IL-1, interleukin-1; IL-17, interleukin-17; IL-18, interleukin-18; TNF-α, tumor necrosis factor-α; GWAS, genome-wide association studies; CDCs, conventional dendritic cells; Tregs, regulatory T cells; SNPs, single-nucleotide polymorphisms; IVs, instrumental variables; MR-PRESSO, MR Pleiotropy Residual Sum and Outlier; WM, weighted median; HLA-DR, human leukocyte antigen-DR; GEO, Gene Expression Omnibus; xCell, a gene-signature-based cell-type inference method; MCP-counter, Microenvironment Cell Populations-counter; aDC, Activated dendritic cells; iDC, Immature dendritic cells; DC, Dendritic cells; AMH, anti-Müllerian hormone; IVF, in vitro fertilization; uNK, uterine natural killer cells; MSigDB, Molecular Signatures Database; NK, natural killer; MDSCs, myeloid-derived suppressor cells; APCs, antigen-presenting cells; TWAS, transcriptome-wide association studies.
Data Sharing Statement
All data used in the current study are publicly available GWAS, FinnGen, and GEO summary data.
Ethics Approval and Consent to Participate
This study is based entirely on secondary analyses of de-identified, publicly available human data. Two-sample Mendelian randomization analyses used summary-level GWAS data and the FinnGen datasets from published consortia and open-access repositories, and external validation was performed using an anonymized whole-blood transcriptome dataset (GEO: GSE54248); the original studies had obtained ethics approval and informed consent as reported in their primary publications.
No new participant recruitment, clinical intervention, or access to identifiable information was involved. Under the Measures for Ethical Review of Life Science and Medical Research Involving Human Subjects (China, 18 February 2023), Article 32 items (1) and (2), secondary research using legally obtained public information and fully anonymized, non–re-identifiable human data may be exempt from additional institutional ethics review. In light of these provisions, we judged that this analysis meets the criteria for exemption, and no additional IRB approval was sought at the Seventh Affiliated Hospital of Sun Yat-sen University.
Acknowledgment
The authors express sincere gratitude to the GWAS datasets, the FinnGen datasets, and GEO datasets, which was instrumental in conducting this study.
Author Contributions
All authors made a significant contribution to the work reported, whether that is in the conception, study design, execution, acquisition of data, analysis and interpretation, or in all these areas; took part in drafting, revising or critically reviewing the article; gave final approval of the version to be published; have agreed on the journal to which the article has been submitted; and agree to be accountable for all aspects of the work.
Funding
This work was supported by Basic Research Fund in Shenzhen Natural Science Foundation (Grant No. JCYJ20230807110317036 to LM), and the Seventh Affiliated Hospital of Sun Yat-sen University (Grant No. ZSQY202473524 to LM).
Disclosure
The authors declare no competing interests.
References
1. Joham AE, Norman RJ, Stener-Victorin E, et al. Polycystic ovary syndrome. Lancet Diabetes Endocrinol. 2022;10(9):668–19. doi:10.1016/S2213-8587(22)00163-2
2. Escobar-Morreale HF. Polycystic ovary syndrome: definition, aetiology, diagnosis and treatment. Nat Rev Endocrinol. 2018;14(5):270–284. doi:10.1038/nrendo.2018.24
3. Palomba S, de Wilde MA, Falbo A, Koster MPH, La Sala GB, Fauser BCJM. Pregnancy complications in women with polycystic ovary syndrome. Hum Reprod Update. 2015;21(5):575–592. doi:10.1093/humupd/dmv029
4. Luan -Y-Y, Zhang L, Peng Y-Q, Li -Y-Y, Liu R-X, Yin C-H. Immune regulation in polycystic ovary syndrome. Clin Chim Acta. 2022;531:265–272. doi:10.1016/j.cca.2022.04.234
5. Rostamtabar M, Esmaeilzadeh S, Tourani M, et al. Pathophysiological roles of chronic low-grade inflammation mediators in polycystic ovary syndrome. J Cell Physiol. 2021;236(2):824–838. doi:10.1002/jcp.29912
6. Yong W, Wang J, Leng Y, Li L, Wang H. Role of obesity in female reproduction. Int J Med Sci. 2023;20(3):366–375. doi:10.7150/ijms.80189
7. Trim WV, Lynch L. Immune and non-immune functions of adipose tissue leukocytes. Nat Rev Immunol. 2022;22(6):371–386. doi:10.1038/s41577-021-00635-7
8. Hu C, Pang B, Ma Z, Yi H. Immunophenotypic profiles in polycystic ovary syndrome. Mediators Inflamm. 2020;2020:5894768. doi:10.1155/2020/5894768
9. Wang J, Yin T, Liu S. Dysregulation of immune response in PCOS organ system. Front Immunol. 2023;14:1169232. doi:10.3389/fimmu.2023.1169232
10. Rudnicka E, Suchta K, Grymowicz M, et al. Chronic low grade inflammation in pathogenesis of PCOS. Int J Mol Sci. 2021;22(7):3789. doi:10.3390/ijms22073789
11. Banerjee S, Cooney LG, Stanic AK. Immune dysfunction in polycystic ovary syndrome. Immunohorizons. 2023;7(5):323–332. doi:10.4049/immunohorizons.2200033
12. Aru N, Yang C, Chen Y, Liu J. Causal association of immune cells and polycystic ovarian syndrome: a Mendelian randomization study. Front Endocrinol. 2023;14:1326344. doi:10.3389/fendo.2023.1326344
13. Burgess S, Small DS, Thompson SG. A review of instrumental variable estimators for Mendelian randomization. Stat Methods Med Res. 2017;26(5):2333–2355. doi:10.1177/0962280215597579
14. Orrù V, Steri M, Sidore C, et al. Complex genetic signatures in immune cells underlie autoimmunity and inform therapy. Nat Genet. 2020;52(10):1036–1045. doi:10.1038/s41588-020-0684-4
15. Sidore C, Busonero F, Maschio A, et al. Genome sequencing elucidates Sardinian genetic architecture and augments association analyses for lipid and blood inflammatory markers. Nat Genet. 2015;47(11):1272–1281. doi:10.1038/ng.3368
16. Day F, Karaderi T, Jones MR, et al. Large-scale genome-wide meta-analysis of polycystic ovary syndrome suggests shared genetic architecture for different diagnosis criteria. PLoS Genet. 2018;14(12):e1007813. doi:10.1371/journal.pgen.1007813
17. Aran D, Hu Z, Butte AJ. xCell: digitally portraying the tissue cellular heterogeneity landscape. Genome Biol. 2017;18(1):220. doi:10.1186/s13059-017-1349-1
18. Becht E, Giraldo NA, Lacroix L, et al. Estimating the population abundance of tissue-infiltrating immune and stromal cell populations using gene expression. Genome Biol. 2016;17(1):218. doi:10.1186/s13059-016-1070-5
19. Zhao Y, Wang J, Liang F, et al. NucMap: a database of genome-wide nucleosome positioning map across species. Nucleic Acids Res. 2019;47(D1):D163–9. doi:10.1093/nar/gky980
20. Liberzon A, Birger C, Thorvaldsdóttir H, Ghandi M, Mesirov JP, Tamayo P. The molecular signatures database (MSigDB) hallmark gene set collection. Cell Syst. 2015;1(6):417–425. doi:10.1016/j.cels.2015.12.004
21. GBD 2016 Headache Collaborators; Stovner LJ, Nichols E, Steiner TJ. Global, regional, and national burden of migraine and tension-type headache, 1990-2016: a systematic analysis for the global burden of disease study 2016. Lancet Neurol. 2018;17(11):954–976. doi:10.1016/S1474-4422(18)30322-3
22. Chen L, Yang H, Li H, He C, Yang L, Lv G. Insights into modifiable risk factors of cholelithiasis: a Mendelian randomization study. Hepatology. 2022;75(4):785–796. doi:10.1002/hep.32183
23. Verbanck M, Chen C-Y, Neale B, Do R. Detection of widespread horizontal pleiotropy in causal relationships inferred from Mendelian randomization between complex traits and diseases. Nat Genet. 2018;50(5):693–698. doi:10.1038/s41588-018-0099-7
24. Gao L, Gu Y, Yin X. High serum tumor necrosis factor-alpha levels in women with polycystic ovary syndrome: a meta-analysis. PLoS One. 2016;11(10):e0164021. doi:10.1371/journal.pone.0164021
25. Gao L, Zhao Y, Wu H, et al. Polycystic ovary syndrome fuels cardiovascular inflammation and aggravates ischemic cardiac injury. Circulation. 2023;148(24):1958–1973. doi:10.1161/CIRCULATIONAHA.123.065827
26. Usta A, Avci E, Bulbul CB, Kadi H, Adali E. The monocyte counts to HDL cholesterol ratio in obese and lean patients with polycystic ovary syndrome. Reprod Biol Endocrinol. 2018;16(1):34. doi:10.1186/s12958-018-0351-0
27. Auffray C, Sieweke MH, Geissmann F. Blood monocytes: development, heterogeneity, and relationship with dendritic cells. Annu Rev Immunol. 2009;27(1):669–692. doi:10.1146/annurev.immunol.021908.132557
28. Shabbir S, Khurram E, Moorthi VS, Eissa YTH, Kamal MA, Butler AE. The interplay between androgens and the immune response in polycystic ovary syndrome. J Transl Med. 2023;21(1):259. doi:10.1186/s12967-023-04116-4
29. Johnsen SH, Fosse E, Joakimsen O, et al. Monocyte count is a predictor of novel plaque formation: a 7-year follow-up study of 2610 persons without carotid plaque at baseline the Tromsø Study. Stroke. 2005;36(4):715–719. doi:10.1161/01.STR.0000158909.07634.83
30. Ziegler-Heitbrock L, Ancuta P, Crowe S, et al. Nomenclature of monocytes and dendritic cells in blood. Blood. 2010;116(16):e74–80. doi:10.1182/blood-2010-02-258558
31. Burgess S, Timpson NJ, Ebrahim S, Davey Smith G. Mendelian randomization: where are we now and where are we going? Int J Epidemiol. 2015;44(2):379–388. doi:10.1093/ije/dyv108
32. Davey Smith G, Hemani G. Mendelian randomization: genetic anchors for causal inference in epidemiological studies. Hum Mol Genet. 2014;23(R1):R89–98. doi:10.1093/hmg/ddu328
33. Balan S, Saxena M, Bhardwaj N. Dendritic cell subsets and locations. Int Rev Cell Mol Biol. 2019;348:1–68. doi:10.1016/bs.ircmb.2019.07.004
34. Zhang W, Ding Y, Sun L, et al. Bone marrow-derived inflammatory and steady state DCs are different in both functions and survival. Cell Immunol. 2018;331:100–109. doi:10.1016/j.cellimm.2018.06.001
35. Senju S, Matsunaga Y, Fukushima S, et al. Immunotherapy with pluripotent stem cell-derived dendritic cells. Semin Immunopathol. 2011;33(6):603–612. doi:10.1007/s00281-011-0263-y
36. Zhang T, Tian F, Huo R, Tang A, Zeng Y, Duan Y-G. Detection of dendritic cells and related cytokines in follicular fluid of patients with polycystic ovary syndrome. Am J Reprod Immunol. 2017;78(3). doi:10.1111/aji.12717
37. Hassan M, Raslan HM, Eldin HG, Mahmoud E, Elwajed HAA. CD33+ HLA-DR– myeloid-derived suppressor cells are increased in frequency in the peripheral blood of type1 diabetes patients with predominance of CD14+ subset. Open Access Maced J Med Sci. 2018;6(2):303–309. doi:10.3889/oamjms.2018.080
38. Furusawa Y, Obata Y, Fukuda S, et al. Commensal microbe-derived butyrate induces the differentiation of colonic regulatory T cells. Nature. 2013;504(7480):446–450. doi:10.1038/nature12721
39. Moro F, Morciano A, Tropea A, et al. Effects of drospirenone-ethinylestradiol and/or metformin on CD4(+)CD28(null) T lymphocytes frequency in women with hyperinsulinemia having polycystic ovary syndrome: a randomized clinical trial. Reprod Sci. 2013;20(12):1508–1517. doi:10.1177/1933719113488444
40. Matteo M, Serviddio G, Massenzio F, et al. Reduced percentage of natural killer cells associated with impaired cytokine network in the secretory endometrium of infertile women with polycystic ovary syndrome. Fertil Steril. 2010;94(6):
41. Khashchenko E, Vysokikh M, Uvarova E, et al. Activation of systemic inflammation and oxidative stress in adolescent girls with polycystic ovary syndrome in combination with metabolic disorders and excessive body weight. J Clin Med. 2020;9(5):1399. doi:10.3390/jcm9051399
42. Kitaya K, Yamaguchi T, Honjo H. Central role of interleukin-15 in postovulatory recruitment of peripheral blood CD16(-) natural killer cells into human endometrium. J Clin Endocrinol Metab. 2005;90(5):2932–2940. doi:10.1210/jc.2004-2447
43. Vale-Fernandes E, Moreira MV, Rodrigues B, et al. Anti-Müllerian hormone a surrogate of follicular fluid oxidative stress in polycystic ovary syndrome? Front Cell Dev Biol. 2024;12:1408879. doi:10.3389/fcell.2024.1408879
44. Bowden J, Davey Smith G, Burgess S. Mendelian randomization with invalid instruments: effect estimation and bias detection through Egger regression. Int J Epidemiol. 2015;44(2):512–525. doi:10.1093/ije/dyv080
 © 2026 The Author(s). This work is published and licensed by Dove Medical Press Limited. The
full terms of this license are available at https://www.dovepress.com/terms
and incorporate the Creative Commons Attribution
- Non Commercial (unported, 4.0) License.
By accessing the work you hereby accept the Terms. Non-commercial uses of the work are permitted
without any further permission from Dove Medical Press Limited, provided the work is properly
attributed. For permission for commercial use of this work, please see paragraphs 4.2 and 5 of our Terms.
© 2026 The Author(s). This work is published and licensed by Dove Medical Press Limited. The
full terms of this license are available at https://www.dovepress.com/terms
and incorporate the Creative Commons Attribution
- Non Commercial (unported, 4.0) License.
By accessing the work you hereby accept the Terms. Non-commercial uses of the work are permitted
without any further permission from Dove Medical Press Limited, provided the work is properly
attributed. For permission for commercial use of this work, please see paragraphs 4.2 and 5 of our Terms.
Recommended articles

The Emerging Role of Immune Cells and Targeted Therapeutic Strategies in Diabetic Wounds Healing
Song J, Hu L, Liu B, Jiang N, Huang H, Luo J, Wang L, Zeng J, Huang F, Huang M, Cai L, Tang L, Chen S, Chen Y, Wu A, Zheng S, Chen Q
Journal of Inflammation Research 2022, 15:4119-4138
Published Date: 20 July 2022
The Role of Inflammation in Cholestatic Liver Injury
Chen J, Zhang S
Journal of Inflammation Research 2023, 16:4527-4540
Published Date: 13 October 2023
Semaglutide Alleviates Ovary Inflammation via the AMPK/SIRT1/NF‑κB Signaling Pathway in Polycystic Ovary Syndrome Mice
Liu M, Guo S, Li X, Tian Y, Yu Y, Tang L, Sun Q, Zhang T, Fan M, Zhang L, Xu Y, An J, Gao X, Han L, Zhang L
Drug Design, Development and Therapy 2024, 18:3925-3938
Published Date: 4 September 2024
Screening and Validation of Potential Biomarkers of Immune Cells in Childhood Asthma Patients via Mendelian Randomization and Machine Learning
Zhang Y, Hai Y, Song B, Xu J, Cao L, Yasen R, Xu W, Zhang J, Hu J
Journal of Inflammation Research 2025, 18:2583-2600
Published Date: 21 February 2025
The Mediation Role of Insulin Resistance and Chronic Systemic Inflammation in the Association Between Obesity and NAFLD: Two Cross-Sectional and a Mendelian Randomization Study
Huang X, Chen Q, Su Q, Gong J, Wu L, Xiang L, Li W, Chen J, Zhao H, Huang W, Du S, Ye W
Clinical Epidemiology 2025, 17:287-302
Published Date: 24 March 2025