Back to Journals » International Journal of General Medicine » Volume 16
Construction and Assessment of a Prognostic Risk Model for Cervical Cancer Based on Lactate Metabolism-Related lncRNAs
Authors Gao Y, Liu H, Wan J, Chang F, Zhang L, Wang W, Zhang Q, Feng Q
Received 20 March 2023
Accepted for publication 8 June 2023
Published 11 July 2023 Volume 2023:16 Pages 2943—2960
DOI https://doi.org/10.2147/IJGM.S411511
Checked for plagiarism Yes
Review by Single anonymous peer review
Peer reviewer comments 2
Editor who approved publication: Dr Scott Fraser
Ya Gao,1,* Hongyang Liu,1,* Junhu Wan,2 Fenghua Chang,1 Lindong Zhang,1 Wenjuan Wang,1 Qinshan Zhang,1 Quanling Feng1
1Department of Obstetrics and Gynecology, The Third Affiliated Hospital of Zhengzhou University, Zhengzhou, Henan, People’s Republic of China; 2Department of Clinical Laboratory, Key Clinical Laboratory of Henan Province, The First Affiliated Hospital of Zhengzhou University, Zhengzhou, Henan, People’s Republic of China
*These authors contributed equally to this work
Correspondence: Quanling Feng, Department of Obstetrics and Gynecology, The Third Affiliated Hospital of Zhengzhou University, Zhengzhou, Henan, People’s Republic of China, Tel +86-18638963361, Email [email protected]
Purpose: Cervical cancer (CC) has the fourth highest incidence and mortality rate among female cancers. Lactate is a key regulator promoting tumor progression. Long non-coding RNAs (lncRNAs) are closely associated with cervical cancer (CC). The study was aimed to develop a prognostic risk model for cervical cancer based on lactate metabolism-associated lncRNAs and to determine their clinical prognostic value.
Patients and Methods: In this study, CESC transcriptome data were obtained from the TCGA database. 262 lactate metabolism-associated genes were extracted from MsigDB (Molecular Characterization Database). Then, correlation analysis was used to identify LRLs. Univariate Cox regression analysis was performed afterwards, followed by least absolute shrinkage and selection operator (LASSO) regression analysis and multiple Cox regression analysis. 10 lncRNAs were finally identified to construct a risk score model. They were divided into two groups of high risk and low risk according to the median of risk scores. The predictive performance of the models was assessed by Kaplan-Meier (K-M) analysis, subject work characteristics (ROC) analysis, and univariate and multivariate Cox analyses. To assess the clinical utility of the prognostic model, we performed functional enrichment analysis, immune microenvironment analysis, mutation analysis, and column line graph generation.
Results: We constructed a prognostic model consisting of 10 LRLs at CC. We observed that high-risk populations were strongly associated with poor survival outcomes. Risk score was an independent risk factor for CC prognosis and was strongly associated with immune microenvironment analysis and tumor mutational load.
Conclusion: We developed a risk model of lncRNAs associated with lactate metabolism and used it to predict prognosis of CC, which could guide and facilitate the progress of new treatment strategies and disease monitoring in CC patients.
Keywords: cervical cancer, lactate metabolism, long non-coding RNA, bioinformatics, prognostic model
Introduction
Cervical cancer (CC) is the fourth most common cancer in women, with most patients diagnosed between the ages of 15 and 45. It is estimated that up to 310,000 women die from cervical cancer each year, with more than two-thirds of the cases occurring in developing countries1 posing a severe threat to women’s physical and mental health. Early-stage cervical cancer can be treated well and minimize complications, with an overall survival rate of 70–90% over five years.2 However, patients with advanced cervical cancer are usually resistant to radiotherapy and chemotherapy,3 presenting a high risk of metastasis, poor prognosis, and shorter disease-free and overall survival.4 The occurrence and development of cervical cancer is a complicated, multi-stage, and multi-gene-regulated process, which indicates that it is necessary to search for effective biomarkers and construct a new prognostic model for early identification and prognostic evaluation of CC.
Lactate, as the end product of glycolysis, has been considered a mere metabolic by-product and not biologically active. This view has recently changed, and it has been found that lactate can act as a signaling molecule with intracellular and extracellular functions.5 Moreover, recruiting and inducing the activity of immunosuppressive cells and molecules6 plays a key role in promoting tumor progression, including tumor invasion, metastasis, and angiogenesis.7 Lactate acts as a signaling molecule and fuel source for cancer cells in a glucose-restricted environment.8 Extracellularly, lactate levels can be sensed by cancer cells, T cells, NK cells, dendritic cells, and macrophages, triggering intracellular signals that regulate cellular behavior and strongly influence their function in the tumor microenvironment. Moreover, the lactate produced by cancer cells is secreted into the extracellular space, promoting cancer progression by creating an active ecological niche that shapes tumorigenesis and evolution.9
Long non-coding RNAs (lncRNAs) are RNAs with transcripts longer than 200 nucleotides and do not encode proteins with unique characteristics and tissue specificity.10 Studies have shown that lncRNAs are involved in the up-regulation and down-regulation of gene expression at the transcriptional and post-transcriptional levels of all essential cellular processes (proliferation, differentiation, development, immunity, metabolic alterations, and signaling, including the cancer state).11 In recent years, more and more studies have shown that lncRNAs are highly associated with CC tumorigenesis, development, and metastasis. For example, lncRNA SCIRT promotes cervical cancer cell proliferation, migration, and invasive properties through upregulation of MMP-2/-9;12 lncRNALINC00707 promotes cervical cancer cell proliferation through miR-374c-5p/SDC4 axis13 and so on. Therefore, lncRNAs can be considered potential biomarkers for the treatment and prognosis of CC. However, there are limited studies on lactate metabolism off lncRNAs (LRLs) in CC, and further studies on key LRLs with prognostic significance in CC patients are still needed.
Through bioinformatics research, we analyzed the characteristics of lactate metabolism-related lncRNAs (LRLs) and developed a prognostic model in CC. To explore the predictive ability of lactate metabolization-related models for the prognosis of CC patients and the independent prognostic value of the model. Based on this model, a risk score for each CC patient was determined for immune prediction, mutation analysis, etc. Our study can improve the accuracy of prognostic prediction, contribute to the personalized treatment of CC, and prolong the overall survival (OS) of CC patients.
Materials and Methods
Download of Data
The TCGA database (https://portal.gdc.cancer.gov/) collects CESC sequencing and clinical data. RNA expression data and clinical data of 304 cervical cancer cases were downloaded from TCGA database. Case inclusion criteria: complete RNA expression data and complete survival time data were available. Duplicate data were excluded. 262 lactate metabolism-related genes (LRGs) were extracted from MsigDB (https://www.gsea-msigdb.org/gsea/index.jsp).
Screening lncRNAs Associated with Lactate Metabolism
Based on the data obtained from the TCGA database, the lncRNAs related to lactate metabolism were identified by Pearson correlation analysis according to the cut-off value (|PearsonR|>0.5, P<0.001). The co-expression network of lactate metabolism-related genes and lncRNAs was constructed using the R package “igraph”. 20 LRLs with potential prognostic relevance to CC were identified by univariate Cox regression analysis and forest mapping. In order to show the differences in LRLs between normal and CC tissues, heat map and box plots were created using the “limma”, “pheatmap”, “reshape2”, and “ggpubr” packages with the criteria of |log2FC|>1 and FDR<0.05.
Consensus Clustering Analysis of Lactate Metabolism-Associated lncRNAs
To gain a preliminary understanding of the biological mechanisms of lactate metabolism-related lncRNAs, CC patients were grouped into clusters using the “ConsensusClusterPlus” software package. Based on the similarity of LRLs expression levels and the ratio of fuzzy clustering measurements,14 when they are divided into three clusters, that is, when k=3, the cluster shows the best stability. A total of 304 CC patients were divided into three clusters: cluster 1 (n=215), cluster 2 (n=62), and cluster 3 (n=27). Survival analysis, clinical relevance, and differences in immune cell content were analyzed in these three clusters.
Construction and Evaluation of the Prognostic Model and Nomogram
We randomly divided the entire dataset (n = 304) into training (n = 152) and testing (n = 152) subsets in a 1:1 ratio. The least absolute shrinkage and selection operator (LASSO) Cox regression was performed using the R package “glmnet” to reduce the dimensionality of the high-latitude data. Ten-fold cross-validation was used to avoid overfitting problems and the penalty parameter (λ) was selected according to the minimum criterion.15 Then, multivariate Cox regression analysis was performed to determine prognostic characteristics. The risk score was calculated as follows: (survival coefficient of lncRNA1) x (expression of lncRNA1) + (survival coefficient of lncRNA2) x (expression of lncRNA2) +.+ (survival coefficient of lncRNAn) x (lncRNAn) expression. CC patients were divided into two subgroups according to the median score of the risk score obtained from the prognostic model: high-risk and low-risk subgroups. The time-dependent receiver operating characteristic (ROC) curve of survival time and the area under the curve (AUC) value were used to evaluate the predictive ability of the prognostic model. Univariate and multivariate Cox regression analyses were used to evaluate the independent prognostic value of the risk score. In addition, a nomogram was generated based on risk scores and clinical indicators to predict the 1 -, 3 -, and 5-year OS of CC patients. Then, the reliability of the identified nomogram was checked using calibration curves of the data.
Functional Enrichment Analysis of Lactate Metabolism-Related lncRNAs
The Kyoto Encyclopedia of Genes and Genomes (KEGG) pathway was identified using Gene Set Enrichment Analysis (GSEA). Based on the risk scoring model, the whole group of samples was divided into a high-risk group and a low-risk group, and the KEGG pathways with significant differences between the high and low-risk groups were determined. The biological functions, cellular components, and molecular functions of the two groups were compared. Conducted using the GSEA4.3.2 version, biological processes with normalized (NOM) P values < 0.05 and false discovery rate (FDR) q values < 0.05 were considered to be significantly enriched.
Assessment of Tumor Mutational Burden
Mutation data obtained from TCGA (data category = copy number variation; “maf” file) were processed by applying VarScan software to measure tumor mutation burden (TMB) using the “maftools” package in the R package. According to the median TMB score as the cut-off value, all CC patients were divided into a high TMB subtype group and a low TMB subtype group, and a waterfall plot of the top 20 visualized mutant genes was drawn. The survival differences and correlations with risk scores between the high TMB subtype group and the low TMB subtype group were analyzed, among others.
Assessment of Tumor Immune Microenvironment
Based on TCGA RNA sequencing data, the CIBERSORT tool was used to analyze 22 immune cell components, including B cells, T cells, natural killer cells, macrophages, and dendritic cells in medium tumor samples.16 The p<0.05 indicated that the cell components inferred from the samples had high credibility. Pearson analysis was performed to correlate different immune cells and risk scores. Immune scores (including immune score, stromal score, and ESTIMATE score) were calculated using the ESTIMATE algorithm. To perform ssGSEA, we used the “GSVA” package to calculate the scores of infiltrating immune cells.
Quantitative Real-Time PCR Was Used for Experimental Verification
The cancer tissues and matched adjacent tissues of 11 CC patients were obtained from the Third Affiliated Hospital of Zhengzhou University. All CC patients signed informed consent before surgery, and the diagnosis of the tissue was confirmed by pathology after surgery. In addition, the patient did not receive radiotherapy or chemotherapy three months before surgery and did not have other malignant tumors or immune system diseases. The fresh tissue obtained was immediately stored at − 80 °C in a refrigerator for subsequent studies. The Medical Ethics Committee of the Third Affiliated Hospital of Zhengzhou University approved this study. Total RNA was extracted by TRIZOL reagent (Invitrogen) according to the manufacturer’s instructions. cDNA was obtained from purified RNA using the PrimeScript RT kit (Takara). Quantitative real-time PCR was performed using SYBR premix ExTaq (Takara) according to the manufacturer’s instructions. This study conforms to the Declaration of Helsinki.
Statistical Analysis
All statistical analyses were performed using Perl data language, R software v4.2.2. The differences between survival curves were constructed by Kaplan-Meier and compared by the Log rank test. Cox regression analysis was used to analyze prognostic influences. A parametric test (Pearson’s correlation) was used for standard data, and a nonparametric test (Wilcoxon’s test or Spearman correlation) was used for nonnormal data. A p-value of less than 0.05 was considered to indicate statistical significance.
Results
Screening of Lactate Metabolism-Associated lncRNAs with Prognostic Value
To explore the role of lncRNAs associated with lactate metabolism-related genes (LRGs) in the development of cervical cancer, We downloaded 304 RNA-seq with complete expression data and survival time from TCGA. 262 lactate metabolism-related genes were downloaded from the MsigDB and identified 549 lactic acid metabolism-related lncRNAs (using the Pearson correlation analysis |Pearson R| > 0.5 and p < 0.001). We developed a flow chart to systematically describe our study (Figure 1). We first mapped co-expression networks based on co-expression relationships constructed between lactate metabolism-related genes and lactate metabolism-related lncRNAs, which were used to show the interactions between LRGs and LRLs (Figure 2A). Univariate Cox regression analysis was then performed to filter out 20 prognosis-associated LRLs from 549 lncRNAs, and forest plots showed the risk ratios and 95% confidence intervals (all p<0.05) for the 20 lactate metabolism-associated lncRNAs (Figure 2B). The heat map and box plots were plotted for visualization to show the difference in the expression of LRLs in CC versus normal tissues (Figure 2C and D).
 |
Figure 1 Flow chart for characterization of lactate metabolism-related lncRNAs. |
 |
Figure 2 Screening of lactate metabolism-related lncRNAs (LRLs) with prognostic value. (A) Pearson correlation analysis established a co-expression network of lactate metabolism-associated genes (LRG) and lncRNAs. (B) Forest plot of 20 lncRNAs identified as prognostic lactate metabolism-associated lncRNAs in univariate Cox regression analysis. (C) Heat map of the expression of prognosis-related lactate metabolism-related lncRNAs in CC and normal tissues. (D) Box plots of 20 differentially expressed lncRNAs related to lactate metabolism between CC and normal tissues. Normal tissues are shown in blue and tumor tissues are shown in red. (*p < 0.05, **p < 0.01). |
Consensus Clustering Analysis
In order to determine whether CC patients could be stratified, the “ConsensusClusterPlus” software package was used to divide CC patients into different clusters for consensus clustering analysis. Based on the similarity of the expression levels of LRLs and the ratio of fuzzy clustering measures, we found that the consensus matrix plot showed clear boundaries for k = 3, which was the optimal value (Figure 3A–D). Survival analysis was then performed on the patients, and the prognosis of the three groups was statistically significant (P=0.004), among which cluster 1 had the worst prognosis (Figure 3E). The heat map showed the differences in lactate metabolism-related lncRNAs and clinicopathological characteristics such as age, tumor grade, and pathological TNM stage among the three groups (Figure 3F). We next analyzed differences in the content of T cells follicular helper, T cells CD8, T cells CD4 memory resting, and B cells memory within the clusters (Figure 3G–J).
 |
Figure 3 Classification of CC by consensus clustering. (A) The cumulative distribution function (CDF) plot shows the cumulative distribution function of the consistency matrix for k values (indicated by different colors) between 2 and 9. (B and C) Relative change in area under the CDF curve (B) and trace plot (C) depending on the different k values. (D) The clustering is most stable when k=3. (E) Survival analysis of the three clusters. (F) Heat map and difference analysis of clinicopathological characteristics among the three clusters (including age, T, M, N status, and grading). (G–J) Shows the differences in the content of T cells follicular helper (G), T cells CD8 (H), T cells CD4 memory resting (I), and B cells memory (J) in the three clusters. |
Construction and Evaluation of the Prognostic Model
To further identify more effective prognosis-related lactate metabolism-related lncRNAs and build prognostic models, we used the LASSO Cox regression model to analyze the above 20 prognosis-related lncRNAs and used ten-fold cross-validation to overcome overfitting. Subsequently, prognostic models were constructed by multivariate Cox regression analysis. The results showed that 10 LRLs significantly associated with prognosis were identified, namely AC009097.2, CHRM3-AS2, AL365226.2, LINC01943, AC145343.1, AC100793.4, AC243829.4, LINC02004, AC106782.6, NCK1-DT. AL365226.2 was a risk factor (HR>1), and other lncRNAs had protective effects (HR< 1). Next, the risk score (RS) of CC patients was calculated based on the expression levels of 10 candidate lncRNAs and their Cox coefficients as follows: Risk score = (−1.077*AC009097.2) + (−1.915*CHRM3-AS2) + (0.036*AL365226.2) + (- 0.0154*LINC01943) + (−0.135*AC145343.1) + (−0.245*AC100793.4) + (−1.542*AC243829.4) + (−0.020*LINC02004) + (−3.234*AC106782.6) + (−0.016*NCK1 -DT). Patients were divided into two risk subgroups based on median risk scores: high-risk and low-risk groups. The lactate metabolism-related risk distribution maps, survival status maps, and LRLs expression levels in the TCGA dataset are shown in the figure (Figure 4A–C). Survival analysis showed that the high-risk group had a shorter survival time than the low-risk group (Figure 4D). We used the “pheatmap” package to map the heat map of these ten lncRNAs and found that the risk scores correlated with clinicopathological characteristics such as age, cluster, and T-stage (Figure 4E). Subsequently, the ROC analysis of the prediction model with clinicopathological parameters allowed us to observe an AUC value of 0.741 for the ROC in the 5-year survival risk score, which was significantly higher than the AUC values for age (0.580), grade (0.507), staging (0.634), T-staging (0.693), M-staging (0.484), and N-staging (0.496) (Figure 4F). Furthermore, the ROC curves for 1-year, 3-year, and 5-year survival rates were plotted in the TCGA cohort (Figure 4G). In addition, the risk score was found to be an independent prognostic factor for CC patients using univariate and multifactorial Cox regression analysis (Figure 5A and B). Finally, we divided the 304 CC patients with complete survival-related and clinical information of TCGA in a 1:1 ratio and subsequently into two cohorts: the Testing group and the Training group. Risk profiles, survival plots, LRLs expression levels, and AUC values from risk scores describing patients in the two cohorts are included in the Supplementary Material (Supplementary Figure 1A–J). Consistent with the overall TCGA for survival analysis, both cohorts showed shorter survival times in the high-risk group compared with the low-risk group. The AUC of the testing cohort was 0.708 while this of the training cohort was 0.752. The above results suggest that the prognostic model of lactate metabolism-associated lncRNAs performs better in predicting the prognosis of CC patients.
 |
Figure 4 Construction and assessment of risk models for lactate metabolism-associated lncRNAs. (A) A risk score of the prognostic model for the whole cohort of TCGA CC. (B) Scatter plot of survival of CC patients. (C) Heat map showing the expression levels of lactate metabolism-associated lncRNAs in the high-risk and low-risk groups. (D) Kaplan-Meier survival analysis between the high-risk and low-risk groups. (E) Heat map between the risk score and clinicopathological features of the risk model based on the ten lncRNAs related to lactate metabolism. (F) Comparison between risk model and clinicopathological characteristics by 1-year area under the ROC curve (AUC) values. (G) AUC values for overall survival prediction at 1, 3, and 5 years for the entire dataset.(*p < 0.05, ***p < 0.001). |
 |
Figure 5 Independent prognostic value of the risk model and construction and evaluation of the nomogram. (A and B) Forest plots based on univariate (A) and multivariate (B) Cox regression analyses were performed in the entire cohort of TCGA CC. (C) Nomogram to estimate 1 -, 3 -, and 5-year survival rates. (D) Calibration curve of the nomogram. |
Identification and Validation of a Nomogram
Considering the complexity of formulas for risk characteristics, the nomogram can be applied visually in clinical work. We can use risk scores and clinical parameters to draw column line diagrams and score risk levels and clinical risk characteristics so that risk characteristics can be adequately applied in the diagnosis, treatment, and prognosis of CC patients. The nomogram can be constructed to estimate the survival rate of patients with CC at 1, 3, and 5 years (Figure 5C). Furthermore, the calibration curves for 1-year, 3-year, and 5-year OS showed that the nomogram was reliable and accurate in predicting prognostic characteristics (Figure 5D).
Stratification Analysis
To determine whether the risk score could accurately predict patients’ overall survival (OS), we performed a stratified analysis of the entire group according to the clinicopathological characteristics of CC (eg gender, age, stage, and grade). It could be found that CC patients with age >65 years, T3-4 stage had higher risk scores, and patients with cluster 1 also had higher risk scores (Figure 6A–C). Next, a comparison of Kaplan-Meier survival curves between the low- and high-risk groups with different clinicopathological stratification revealed that patients in the high-risk group had a worse prognosis compared to those in the low-risk group: age > 65 years (p=0.020), age <= 65 years (p<0.001), lower grade G1-2 (p<0.001), higher grade G3 (p<0.001), M0 (p<0.001), M1 (p=0.049), N0 (p<0.001), N1-3 (p=0.010), and T1-2 (p<0.001) (Figure 6D–L). These results further confirm the good prognostic value of the risk score of CC patients in combination with clinicopathological features.
 |
Figure 6 Association between risk characteristics and clinicopathological parameters. (A) Age, (B) Risk scores of patients in categories 1, 2, and 3, and (C) T-stage of these patients with different clinicopathological stratification. (D–L) Kaplan-Meier survival curves for low and high-risk groups of CC patients with (D) Age > 65 years, (E) Age <= 65 years, (F) G1-2, (G) G3, (H) M0, (I) M1, (J) N0, (K) N1-3 and (L) T1-2. |
Biological Function and Pathway Analysis
Patients with CC in TCGA were divided into high-risk and low-risk groups according to median risk scores. The lncRNAs that were significantly up-regulated (fold change > 1 and P < 0.05) or significantly down-regulated (fold change <-1 and P < 0.05) were selected for Gene Ontology (GO), Kyoto Encyclopedia of Genes and Genomes (KEEG) pathway and Gene Set Enrichment Analysis (GSEA).17 GSEA was used to investigate the differences in pathway enrichment between high- and low-risk groups. ECM-receptor interactions, TGF-β signaling pathway, adherens junction, thyroid cancer, and WNT signaling pathways were enriched in the high-risk group (Figure 7A). Allograft rejection, alzheimer’s disease, antigen processing and presentation, autoimmune thyroid disease, intestinal immune network for iga production, oxidative phosphorylation, parkinson’s disease, systemic lupus erythematosus, and type 1 diabetes mellitus were enriched in the low-risk group (Figure 7B). GSEA results showed that patients in the low-risk group were associated with immune-related pathways. In contrast, patients in the high-risk group were associated with tumor-associated pathways, which may explain the different survival rates in the two risk groups. Then, GO and KEGG enrichment analyses were performed to explore the biological functions and pathways between the two risk groups. It was found that LRLs were mainly involved in many biological effects and signaling pathways. For example, BP contains cellular component disassembly, ameboid−type cell migration, epithelial cell migration, wound healing, monosaccharide metabolism process, and response to hypoxia. CC contains focal adhesion, cell−substrate junction, collagen-containing extracellular matrix, secretory granule lumen, and ficolin−1−rich granule lumen. MF includes cadherin binding (Figure 7C and D). Furthermore, KEGG analysis showed that LRLs were enriched in tumor-related pathways, such as the TNF signaling pathway, biogenesis-reactive oxygen species, biosynthesis of amino acids, and AGE−RAGE signaling pathway in diabetic complications (Figure 7E and F).
 |
Figure 7 Biological function and pathway analysis of lactate metabolism-related lncRNAs. (A and B) Enrichment analysis of GSEA pathways in high-risk (A) and low-risk (B) groups. (C and D) Bar and bubble plots of Gene Ontology (GO). (E and F) Bar and bubble plots of the Kyoto Encyclopedia of Genes and Genomes (KEEG) pathway. |
Mutation Analysis
TMB, defined as the number of somatic mutations per million bases of the genomic sequence, varies in different malignancies. It has been shown that TMB is a promising predictive biomarker that can predict clinical response and prognostic outcome of immunotherapy.18 Patients are assigned to different subtypes at the TMB immune setpoint line.19 Firstly, the distribution of somatic mutations in different risk score subtypes was drawn by a waterfall plot. The mutation landscape of the high-risk group is depicted in Figure 8A, and it can be observed that TTN has the highest mutation rate. Figure 8B depicts the mutation landscape in the low-risk group, where TTN has the highest mutation rate. In addition, we performed a survival analysis, and it can be observed that the low TMB subtype group has a lower survival rate than the high TMB subtype group (Figure 8C). In order to further verify the effectiveness of the risk score and its synergistic effect on prognostic stratification, we divided it into four groups: high -TMB + high-risk score group, high-TMB + low-risk score group, low-TMB+ high-risk score group, and low-TMB + low-risk score group to draw stratified survival curves. If the stratified survival curve showed significant differences in overall survival between different groups of patients, and the low TMB+ high-risk score group had the worst prognosis (P<0.001 Figure 8D).
 |
Figure 8 Analysis of tumor mutations between different risk groups. Waterfall plots of the top 20 most commonly mutated genes in the high-risk group (A) and low-risk group (B). (C) Survival analysis of CC patients between the high TMB group and low TMB group. (D) Survival analysis of patients with TMB combined with a risk score. |
Immune Microenvironment Analysis and Immunotherapy
The immune microenvironment affects the occurrence and development of tumors and can provide a reference for tumor immunotherapy. First, the differences in the levels of immune cell infiltration were depicted in the form of box plots. They showed differences between the high-risk and low-risk groups in the levels of T cells CD8, T cells CD4 memory resting, T cells regulatory(Tregs), Macrophages M0, Mast cells activated, Eosinophils, and Neutrophils (Figure 9A). Next, the ESTIMATE algorithm was used to assess the stromal, immune and estimation scores in TME in CC. The results revealed significantly higher immunity and estimation scores in the low-risk group compared to the high-risk group (Figure 9B). Then, to further explore the underlying mechanisms and immune pathways in the high- and low-risk subgroups, the RNA-seq data from TCGA were processed using the “GSVA” package. The enrichment scores of immune cell subsets and their associated functions were quantified using the “ssGSEA” package, and the heat map and box plots were generated (Figure 9C and D). Because of the importance of checkpoint inhibitor-based immunotherapy, we further explored the differences in immune checkpoint expression between the two groups.20 There were significant differences in the expression of GFM1, NDUFA4, DNM1L, POMK, and other essential indicators between the two groups (P < 0.05 Supplementary Figure 2). In addition, targeted checkpoints activated by immune cells are the most effective way to activate anti-tumor immune responses. Cytotoxic T lymphocyte-associated protein 4 (CTLA-4) and programmed cell death protein 1 (PD-1), two joint inhibitory checkpoints commonly found on activated T cells, have been found to be the most reliable targets for the treatment of cancer.21 It has been found that anti-PD-1 mainly induces the expansion of specific tumor-infiltrating depleted-like CD8 T-cell subsets. Anti-CTLA-4 induces the expansion of ICOS Th1-like CD4 effector cell populations and participates in specific subsets of depleted-like CD8 T cells.22 In an analysis of the differential response to immunotherapy according to the risk-score group, anti-PD-1 and anti-CTLA-4 immunotherapies were associated with more effective responses in the low-risk group (Figure 9E and F).
 |
Figure 9 Analysis of differential immune infiltration in the low- and high-risk groups. (A) Analysis of the content of 22 immune cells in the high-risk and low-risk groups. (B) Analysis of the differences in stromal scores, immune scores, and estimated scores between the high- and low-risk groups. (C) Box plots showing the differentiation of the two risk groups for immune-related signal enrichment. (D) Heat map depicting the distribution of immune cells between the low- and high-risk groups using ssGSEA. (E and F) Response to anti-CTLA-4 and anti-PD-1 treatment in different risk score groups.(*p < 0.05, **p < 0.01, ***p < 0.001). |
Finally, Pearson correlation analysis was performed on different immune cells and risk scores. It was found that Eosinophils, Macrophages M0, Macrophages M2, Mast cells activated, Neutrophils, and T cells CD4 memory resting were positively correlated with risk scores (P<0.05). Mast cells resting, T cells CD8 and T cells regulatory(Tregs) were negatively correlated with the risk score (P<0.05). This phenomenon indicates that higher risk scores are associated with poorer antitumor immunity (Figure 10A–I).23
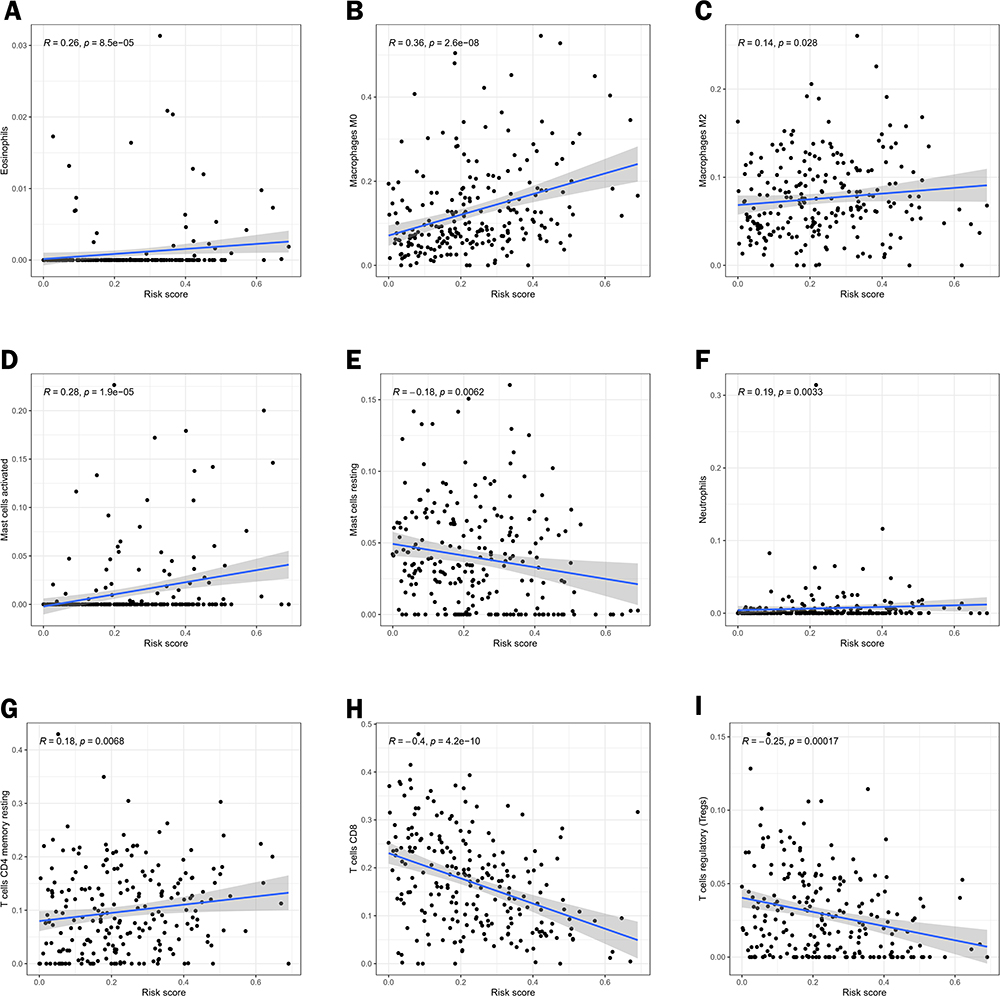 |
Figure 10 Correlation analysis of different immune cells and risk scores. Pearson correlation analysis between (A) Eosinophils, (B) Macrophages M0, (C) Macrophages M2, (D) Mast cells activated, (E) Mast cells resting, (F) Neutrophils, (G) T cells CD4 memory resting, (H) T cells CD8 and (I) T cells regulatory (Tregs). |
 |
Figure 11 To verify the expression levels of lncRNAs related to lactate metabolism in tumor tissues and adjacent tissues. (A–F) performed the expression of six candidate lncRNAs between cervical tumor tissues and paracancerous tissues.(nsp>0.05,*p < 0.05, **p < 0.01, ***p < 0.001). |
Validation of a Risk Model for Lactate Metabolism-Associated lncRNAs
In order to verify the bioinformatics analysis, six lncrnas related to lactate metabolism commonly used in CC tissues and adjacent tissues in the risk model were selected for analysis, including AC009097.2, CHRM3-AS2, LINC01943, AC145343.1, AC243829.4 and NCK1 -DT. In addition, the primer sequence numbers of AL365226.2, AC100793.4, LINC02004, and AC106782.6 were not found in the literature and databases, so they could not be verified for the time being. The results showed that the expression levels of LINC01943, CHRM3-AS2, NCK1 -DT, AC009097.2 and AC243829.4 were up-regulated in the tumor tissue samples compared with the standard tissue samples in 11 pairs of CC tissues and adjacent tissues, which was consistent with the analysis of lncRNAs in TCGA database. However, AC145343.1 did not show a statistically significant difference, which should be due to the small sample size in this study (Figure 11).
Discussion
Although the incidence and mortality associated with cervical cancer are gradually decreasing after the large-scale implementation of cervical cancer cell screening programs,24 cervical cancer is still the fourth most common cancer among women worldwide.25 For the treatment of cervical cancer, radical resection and pelvic lymphadenectomy are usually used for early-stage patients, and radiotherapy and chemotherapy are used for advanced-stage patients.26 Despite the progress made in the treatment of cervical cancer, due to the heterogeneity of tumors, there are significant differences in prognosis even among patients with similar clinical characteristics, which indicates that the existing classification and clinicopathological characteristics are insufficient to predict the prognosis of patients.27 As cervical cancer is a highly preventable tumor, there is a great need for more effective biomarkers to more accurately determine which treatments patients will benefit most from.28
Lactate has long been considered a metabolic waste product, but recent studies have found that lactate tightly links two fundamental hallmarks of cancer: immune evasion and metabolic reprogramming.7 Moreover, there is evidence that even when tumor cells are oxygen-rich, they may produce large amounts of lactic acid through glycolysis. Lactate content was higher in tumor tissues than in normal tissues. Therefore, lactic acid is essential for tumor development.29 Lactate is a critical metabolic participant in the tumor immune response because its oversecretion favors the polarization of tumor-associated macrophages to an immunosuppressive phenotype while impeding tumor infiltration by cytotoxic T lymphocytes, thereby exacerbating tumor immune escape.30 LncRNAs have been shown to play an essential role in cancer by regulating cellular signaling cascade responses.31 An increasing number of studies have shown that lncRNAs are involved in developing CC and are good prognostic indicators for CC patients.32–34 To the best of our knowledge, this is the first study to investigate the correlation between lactate metabolism-related lncRNAs and prognosis in CC patients. These results indicate that lactate metabolism plays an important role in the progression of CC and may be useful in predicting the clinical outcome and survival prognosis of CC patients.
This paper explores the significance of LRLs in CC through a comprehensive bioinformatics analysis. Univariate Cox regression analysis on TCGA CESC data showed that 20 LRLs were related to prognosis. Subsequently, consensus cluster analysis showed that the prognosis-related LRLs could divide CC patients into 3 clusters. Then, using LASSO regression and multivariate Cox analysis, 10 LRLs were identified as independent prognostic factors to construct a prognostic risk-related model. CC patients can be divided into high-risk and low-risk groups according to the median risk score, and the survival rate of the low-risk group is higher than that of the high-risk group. Nomogram is increasingly used to evaluate tumor prognosis. It can tailor risk assessment to patients based on their clinical or disease characteristics.35 Building a nomogram to predict a patient’s 1 -, 3 -, and 5-year survival is clinically applicable. This study provides a prognostic model based on LRLs for CC patients. The AUC value is more significant than 0.7, which can accurately classify patients into different prognostic groups and facilitate the identification and early intervention of high-risk populations. Therefore, this predictive model can be used to identify novel biomarkers for subsequent studies. Moreover, the risk score of lncRNAs related to lactate metabolism in cervical cancer was observed to be correlated with immune cell infiltration and tumor microenvironment.
Our study identified ten prognostic markers of CC associated with lactate metabolism: AC009097.2, CHRM3-AS2, AL365226.2, LINC01943, AC145343.1, AC100793.4, AC243829.4, LINC02004, AC106782.6, and NCK1-DT, which have been tentatively shown to be associated with tumors in studies. Lang et al found that AC009097.2 is a novel prognostic marker for cervical cancer that may be associated with fatty acid metabolism.36 It was also found to be a new marker of 9 lncRNAs related to pyroptosis, which can be used as biomarkers to evaluate the prognosis and immunotherapy of EC.37 CHRM3-AS2 has been demonstrated: silencing of CHRM3-AS2 expression inhibits the malignant progression of gliomas by regulating the expression of miR-370-5p/KLF438 and is a prognostic marker for ovarian cancer.39 AC145343.1 was found to be a risk factor for ex vivo HCC in GILncSig.40 Wang et al found that AC243829.4 could be used as a prognostic marker of renal cell carcinoma when studying immune subtyping related lncRNAs in clear renal cell carcinoma. The corresponding lncRNA-mRNA network was also created,41 which can also be used as lncRNAs related to prognostic ferroptosis associated with immunotherapy and chemotherapy response in gastric cancer patients.42 In addition, NCK1-DT is considered a prognostic marker in colon cancer,43 and NCK1-DT acts as an oncogene to promote gastric cancer progression through miR-22-3p / BCL9-Wnt/β-catenin signaling pathway.44 However, AL365226.2, AC100793.4, LINC02004, and AC106782.6 have been less studied in cancer. In this study, we identified a possible association between ten lncRNAs and lactate metabolism and provided evidence for their importance in CC prognosis. Among these ten LRLs, AL365226.2 was the risk factor, while AC009097.2, CHRM3-AS2, LINC01943, AC145343.1, AC100793.4, AC243829.4, LINC02004, AC106782.6 and NCK1 -DT are favorable prognostic factors for CC.
TMB can be used as an effective biomarker to predict the response to immunotherapy.45 We evaluated the characteristics of TMB in different risk groups of CC patients and found that TTN was the gene with the highest mutation frequency. In addition, the probability of survival was lower in the high-risk group than in the low-risk group, regardless of the TMB level. It has been shown that solid infiltration of memory CD8 T cells, NK cells, and Th1 cells is associated with a good prognosis.46 In this study, ssGSEA showed that as the risk score increased, the infiltration of CD8+T cells, NK cells, and Th1 cells decreased, indicating that patients in the high-risk group had a worse prognosis than those in the low-risk group. Moreover, when the risk score increased, the immune characteristics such as APC _co_inhibition, Type_I_IFN_ Response, MHC_class_I, T_cell_co-inhibition, and T_cell_co-stimulation were significantly decreased. Overall, risk models constructed based on lactate metabolism-associated lncRNAs can reveal statistical differences in tumor mutation burden (TMB), immune cell infiltration, and immunotherapy between high and low-risk groups, which may have implications for guiding the treatment of CC patients.
This study also has certain limitations. Firstly, the data used to construct the risk model were only obtained from the TCGA database. This risk model of lactate metabolism-associated lncRNAs and its clinical utility must be cross-validated using perspective and real-world data. In addition, as some of the lncRNAs screened in this study have not been analyzed previously, their regulatory mechanisms need further investigation. The mechanism of the relationship between lactate metabolism-related lncRNAs and CC prognosis remains unclear and needs to be explored experimentally.
Conclusion
In this study, we constructed that a risk model based on lactate metabolism-associated lncRNAs can be used to predict the survival of CC patients, providing a new approach for risk stratification and biomarkers of CC patients. In addition, we systematically analyzed the relationship between the characteristics, mutational analysis, functional enrichment analysis, and immune microenvironment of lactate-related lncRNAs, which may help to provide new ideas for the detection and individualized treatment of CC patients.
Abbreviations
CC, Cervical cancer; TCGA, The Cancer Genome Atlas; LncRNAs, Long non-coding RNAs; GO, Gene Ontology; OS, Overall survival; ROC, Receiver operating characteristic; GSEA, Gene set enrichment analysis; KEGG, Kyoto Encyclopedia of Genes and Genomes; LASSO, Least absolute shrinkage and selection operator; ssGSEA, Single sample gene set enrichment analysis.
Data Sharing Statement
The datasets analyzed for this study can be found in the TCGA database (https://portal.gdc.cancer.gov/). The names of the repository/repositories and accession number(s) can be found in the article and its Supplementary Material.
Acknowledgments
We thank TCGA and the Molecular Signatures Database for enabling contributors to upload their meaningful data sets on their platforms for great support of our study.
Author Contributions
All authors made a significant contribution to the work reported, whether that is in the conception, study design, execution, acquisition of data, analysis and interpretation, or in all these areas; took part in drafting, revising or critically reviewing the article; gave final approval of the version to be published; have agreed on the journal to which the article has been submitted; and agree to be accountable for all aspects of the work.
Funding
There is no funding to report.
Disclosure
The authors declare that the research was conducted in the absence of any commercial or financial relationships that could be construed as a potential conflict of interest.
References
1. Bray F, Ferlay J, Soerjomataram I, et al. Global cancer statistics 2018: GLOBOCAN estimates of incidence and mortality worldwide for 36 cancers in 185 countries. CA Cancer J Clin. 2018;68(6):394–424. doi:10.3322/caac.21492
2. Guimarães YM, Godoy LR, Longatto-Filho A, et al. Management of early-stage cervical cancer: a literature review. Cancers. 2022;14(3):575. doi:10.3390/cancers14030575
3. Seol HJ, Ulak R, Ki KD, Lee JM. Cytotoxic and targeted systemic therapy in advanced and recurrent cervical cancer: experience from clinical trials. Tohoku J Exp Med. 2014;232(4):269–276. doi:10.1620/tjem.232.269
4. Cohen PA, Jhingran A, Oaknin A, et al. Cervical cancer. Lancet. 2019;393(10167):169–182. doi:10.1016/S0140-6736(18)32470-X
5. Zhu D, Jiang Y, Cao H, et al. Lactate: a regulator of immune microenvironment and a clinical prognosis indicator in colorectal cancer. Front Immunol. 2022;13:876195. doi:10.3389/fimmu.2022.876195
6. Zhou HC, Yan X-Y, Yu WW, et al. Lactic acid in macrophage polarization: the significant role in inflammation and cancer. Int Rev Immunol. 2022;41(1):4–18. doi:10.1080/08830185.2021.1955876
7. Chen L, Huang L, Gu Y, Cang W, Sun P, Xiang Y. Lactate-lactylation hands between metabolic reprogramming and immunosuppression. Int J Mol Sci. 2022;23(19):11943. doi:10.3390/ijms231911943
8. Jedlička M, Feglarová T, Janstová L, Hortová-Kohoutková M, Frič J. Lactate from the tumor microenvironment - A key obstacle in NK cell-based immunotherapies. Front Immunol. 2022;13:932055.
9. Certo M, Tsai CH, Pucino V, Ho PC, Mauro C. Lactate modulation of immune responses in inflammatory versus tumour microenvironments. Nat Rev Immunol. 2021;21(3):151–161. doi:10.1038/s41577-020-0406-2
10. Aalijahan H, Ghorbian S. Long non-coding RNAs and cervical cancer. Exp Mol Pathol. 2019;106(106):7–16. doi:10.1016/j.yexmp.2018.11.010
11. Dinescu S, Ignat S, Lazar AD, Constantin C, Neagu M, Costache M. Epitranscriptomic Signatures in lncRNAs and Their Possible Roles in Cancer. Genes. 2019;10(1):52. doi:10.3390/genes10010052
12. Guan C, Wang B, Dong Q, Yang D-H. The IncRNA SCIRT promotes the proliferative, migratory, and invasive properties of cervical cancer cells by upregulating MMP-2/-9. J Oncol. 2022;2022:3448224. doi:10.1155/2022/3448224
13. Fang F, Guo C, Zheng W, Li Q, Shen Y. LINC00707 promotes cell proliferation in cervical cancer via the miR-374c-5p/SDC4 axis. Biomed Res Int. 2022;2022:5793912. doi:10.1155/2022/5793912
14. Lin Y, Xiao Y, Liu S, et al. Role of a lipid metabolism-related lncRNA signature in risk stratification and immune microenvironment for colon cancer. BMC Med Genomics. 2022;15(1):221. doi:10.1186/s12920-022-01369-8
15. Xu Y, Wang C, Li S, Zhou H, Feng Y. Prognosis and immune response of a cuproptosis-related lncRNA signature in low grade glioma. Front Genet. 2022;13:975419. doi:10.3389/fgene.2022.975419
16. Huang G, Huang Y, Zhang C, et al. Identification of cuproptosis-related long noncoding RNA signature for predicting prognosis and immunotherapy response in bladder cancer. Sci Rep. 2022;12(1):21386. doi:10.1038/s41598-022-25998-2
17. Liu H, Wan J, Feng Q, et al. Long non-coding RNA SOS1-IT1 promotes endometrial cancer progression by regulating hypoxia signaling pathway. J Cell Commun Signal. 2022;16(2):253–270. doi:10.1007/s12079-021-00651-1
18. Sha D, Jin Z, Budczies J, et al. Tumor mutational burden as a predictive biomarker in solid tumors. Cancer Discov. 2020;10(12):1808–1825. doi:10.1158/2159-8290.CD-20-0522
19. Cao J, Yang X, Chen S, et al. The predictive efficacy of tumor mutation burden in immunotherapy across multiple cancer types: a meta-analysis and bioinformatics analysis. Transl Oncol. 2022;20:101375. doi:10.1016/j.tranon.2022.101375
20. Ju L, Shi Y, Liu G. Identification and validation of a ferroptosis-related lncRNA signature to robustly predict the prognosis, immune microenvironment, and immunotherapy efficiency in patients with clear cell renal cell carcinoma. PeerJ. 2022;10:e14506. doi:10.7717/peerj.14506
21. Rotte A. Combination of CTLA-4 and PD-1 blockers for treatment of cancer. J Exper Clin Cancer Res. 2019;38(1):255. doi:10.1186/s13046-019-1259-z
22. Wei SC, Levine JH, Cogdill AP, et al. Distinct cellular mechanisms underlie anti-CTLA-4 and anti-PD-1 checkpoint blockade. Cell. 2017;170(6):1120–1133.e17. doi:10.1016/j.cell.2017.07.024
23. Jiang ZR, Yang LH, Jin LZ, et al. Identification of novel cuproptosis-related lncRNA signatures to predict the prognosis and immune microenvironment of breast cancer patients. Front Oncol. 2022;12:988680. doi:10.3389/fonc.2022.988680
24. Collins Y, Holcomb K, Chapman-Davis E, Khabele D, Farley JH. Gynecologic cancer disparities: a report from the health disparities taskforce of the Society of Gynecologic Oncology. Gynecol Oncol. 2014;133(2):353–361. doi:10.1016/j.ygyno.2013.12.039
25. Arbyn M, Weiderpass E, Bruni L, et al. Estimates of incidence and mortality of cervical cancer in 2018: a worldwide analysis. Lancet Global Health. 2020;8(2):e191–e203. doi:10.1016/S2214-109X(19)30482-6
26. Ronsini C, De Franciscis P, Carotenuto RM, et al. The oncological implication of sentinel lymph node in early cervical cancer: a meta-analysis of oncological outcomes and type of recurrences. Medicina. 2022;58(11):1539. doi:10.3390/medicina58111539
27. Liu X, Zhou L, Gao M, Dong S, Hu Y, Hu C. Signature of seven cuproptosis-related lncRNAs as a novel biomarker to predict prognosis and therapeutic response in cervical cancer. Front Genet. 2022;13:989646. doi:10.3389/fgene.2022.989646
28. Gennigens C, Jerusalem G, Lapaille L, et al. Recurrent or primary metastatic cervical cancer: current and future treatments. ESMO open. 2022;7(5):100579. doi:10.1016/j.esmoop.2022.100579
29. Gao Y, Zhou H, Liu G, et al. Tumor microenvironment: lactic acid promotes tumor development. J Immunol Res. 2022;2022:3119375. doi:10.1155/2022/3119375
30. Tian LR, Lin MZ, Zhong HH, et al. Nanodrug regulates lactic acid metabolism to reprogram the immunosuppressive tumor microenvironment for enhanced cancer immunotherapy. Biomater Sci. 2022;10(14):3892–3900. doi:10.1039/D2BM00650B
31. Sanchez Calle A, Kawamura Y, Yamamoto Y, Takeshita F, Ochiya T. Emerging roles of long non-coding RNA in cancer. Cancer Sci. 2018;109(7):2093–2100. doi:10.1111/cas.13642
32. Salinas-Montalvo AM, Supramaniam A, McMillan NA, Idris A. RNA-based gene targeting therapies for human papillomavirus driven cancers. Cancer Lett. 2021;523:111–120. doi:10.1016/j.canlet.2021.10.005
33. Cáceres-Durán MÁ, Ribeiro-Dos-Santos Â, Vidal AF. Roles and mechanisms of the long noncoding RNAs in cervical cancer. Int J Mol Sci. 2020;21(24):24 9742. doi:10.3390/ijms21249742
34. Sun W, Shen NM, Fu SL. Involvement of lncRNA-mediated signaling pathway in the development of cervical cancer. Eur Rev Med Pharmacol Sci. 2019;23(9):3672–3687. doi:10.26355/eurrev_201905_17791
35. Iasonos A, Schrag D, Raj GV, Panageas KS. How to build and interpret a nomogram for cancer prognosis. J Clin Oncol. 2008;26(8):1364–1370. doi:10.1200/JCO.2007.12.9791
36. Lang X, Huang C, Cui H, Wang F. Prognosis analysis and validation of fatty acid metabolism-related lncRNAs and tumor immune microenvironment in cervical cancer. J Immunol Res. 2022;2022:4954457. doi:10.1155/2022/4954457
37. Liang D, Hu M, Tang Q, Huang M, Tang L. Nine pyroptosis-related lncRNAs are identified as biomarkers for predicting the prognosis and immunotherapy of endometrial carcinoma. Int J Gen Med. 2021;14:8073–8085. doi:10.2147/IJGM.S338298
38. Wang D, Chen Q, Liu J, Liao Y, Jiang Q. Silencing of lncRNA CHRM3-AS2 expression exerts anti-tumour effects against glioma via targeting microRNA-370-5p/KLF4. Front Oncol. 2022;12:856381. doi:10.3389/fonc.2022.856381
39. Li Y, Huo FF, Wen YY, Jiang M. Screening and identification of an immune-associated lncRNA prognostic signature in ovarian carcinoma: evidence from bioinformatic analysis. Biomed Res Int. 2021;2021:6680036. doi:10.1155/2021/6680036
40. Huang DP, Liao MM, Tong JJ, et al. Construction of a genome instability-derived lncRNA-based risk scoring system for the prognosis of hepatocellular carcinoma. Aging. 2021;13(22):24621–24639. doi:10.18632/aging.203698
41. Wang Z, Chen Z, Guo T, et al. Identification and verification of immune subtype-related lncRNAs in clear cell renal cell carcinoma. Front Oncol. 2022;12:888502. doi:10.3389/fonc.2022.888502
42. Lai D, Tan L, Zuo X, et al. Prognostic ferroptosis-related lncRNA signatures associated with immunotherapy and chemotherapy responses in patients with stomach cancer. Front Genet. 2022;12:798612. doi:10.3389/fgene.2021.798612
43. Cai HJ, Zhuang ZC, Wu Y, et al. Development and validation of a ferroptosis-related lncRNAs prognosis signature in colon cancer. Bosnian J Basic Med Sci. 2021;21(5):569–576. doi:10.17305/bjbms.2020.5617
44. Guan B, Ma J, Yang Z, Yu F, Yao J. LncRNA NCK1-AS1 exerts oncogenic property in gastric cancer by targeting the miR-22-3p/BCL9 axis to activate the Wnt/β-catenin signaling. Environ Toxicol. 2021;36(8):1640–1653. doi:10.1002/tox.23160
45. Gandara DR, Paul SM, Kowanetz M, et al. Blood-based tumor mutational burden as a predictor of clinical benefit in non-small-cell lung cancer patients treated with atezolizumab. Nat Med. 2018;24(9):1441–1448. doi:10.1038/s41591-018-0134-3
46. Barnes TA, Amir E. HYPE or HOPE: the prognostic value of infiltrating immune cells in cancer. Br J Cancer. 2017;117(4):451–460. doi:10.1038/bjc.2017.220
 © 2023 The Author(s). This work is published and licensed by Dove Medical Press Limited. The
full terms of this license are available at https://www.dovepress.com/terms
and incorporate the Creative Commons Attribution
- Non Commercial (unported, 3.0) License.
By accessing the work you hereby accept the Terms. Non-commercial uses of the work are permitted
without any further permission from Dove Medical Press Limited, provided the work is properly
attributed. For permission for commercial use of this work, please see paragraphs 4.2 and 5 of our Terms.
© 2023 The Author(s). This work is published and licensed by Dove Medical Press Limited. The
full terms of this license are available at https://www.dovepress.com/terms
and incorporate the Creative Commons Attribution
- Non Commercial (unported, 3.0) License.
By accessing the work you hereby accept the Terms. Non-commercial uses of the work are permitted
without any further permission from Dove Medical Press Limited, provided the work is properly
attributed. For permission for commercial use of this work, please see paragraphs 4.2 and 5 of our Terms.
Recommended articles
Network Analysis of Osteoarthritis Progression Using a Steiner Minimal Tree Algorithm
Xie Y, Shao F, Ji Y, Feng D, Wang L, Huang Z, Wu S, Sun F, Jiang H, Miyamoto A, Wang H, Zhang C
Journal of Inflammation Research 2024, 17:3201-3209
Published Date: 18 May 2024
Predicting the Impact of ARHGAP33 Gene on Liver Cancer Prognosis Based on Multi-Algorithm Model
Zhao Y, Wang C, Shen X, Cao X, Wang Z, Jiang H, Chen X, Wu X
International Journal of General Medicine 2026, 19:571357
Published Date: 10 January 2026
Integrated Multi-Omics Analysis Constructs an Intratumoral Heterogeneity-Corrected Prognostic Signature for Cervical Cancer
Tang X, Zheng Q, Li X, Wang K
International Journal of General Medicine 2026, 19:593477
Published Date: 31 March 2026
Development and Validation of a Prognostic Model for Cervical Cancer Based on Chlamydia trachomatis-Associated Transcriptional Signatures
Wang M, Xiong S, Qiu X, Hu Z, Xie L, Zhao H, You C
International Journal of Women's Health 2026, 18:611743
Published Date: 9 July 2026