")
Back to Journals » Nature and Science of Sleep » Volume 12
Increased Gray Matter Density and Functional Connectivity of the Pons in Restless Legs Syndrome
Authors Xu Z, Han T, Li T , Zhang X, Huang Z, Zhan S, Liu C, Xu J, Wang Y
Received 24 November 2019
Accepted for publication 7 March 2020
Published 24 March 2020 Volume 2020:12 Pages 221—230
DOI https://doi.org/10.2147/NSS.S239852
Checked for plagiarism Yes
Review by Single anonymous peer review
Peer reviewer comments 4
Editor who approved publication: Dr Steven A Shea
Zhexue Xu,1,2,* Tao Han,1,2,* Tian Li,3 Xiaodong Zhang,3 Zhaoyang Huang,1,2 Shuqin Zhan,1,2 Chunyan Liu,1,2 Jinping Xu,3 Yuping Wang1,2
1Department of Neurology, Xuanwu Hospital, Capital Medical University, Beijing 100053, People’s Republic of China; 2Beijing Key Laboratory of Neuromodulation, Beijing 100053, People’s Republic of China; 3Institute of Biomedical and Health Engineering, Shenzhen Institutes of Advanced Technology, Chinese Academy of Sciences, Shenzhen 518055, People’s Republic of China
*These authors contributed equally to this work
Correspondence: Chunyan Liu
Department of Neurology, Xuanwu Hospital, Capital Medical University, 45 Changchun Street, Beijing 100053, People’s Republic of China
Email [email protected]
Jinping Xu
Institute of Biomedical and Health Engineering, Shenzhen Institutes of Advanced Technology, Chinese Academy of Sciences, Shenzhen 518055, People’s Republic of China
Email [email protected]
Background: Neurophysiological and radiological studies provide accumulating evidence for the involvement of the brainstem in the pathogenesis of restless legs syndrome (RLS). The analysis of the various subregions of the brainstem may help us better understand the pathophysiological mechanisms underlying the disorder. In this study, we investigated the structural and functional changes in the various subregions of the brainstem in RLS patients.
Methods: The subregional changes in gray matter density and functional connectivity in the brainstem were analyzed in 20 drug-naive idiopathic RLS patients, as well as 18 normal control (NC) subjects for comparison. Correlation analyses and multivariate pattern analyses using linear support vector machine (SVM) were conducted.
Results: We found significantly increased gray matter density in two clusters in the pons (designated pons_1 and pons_2) and in one cluster in the midbrain in RLS patients compared with NC subjects. Further functional connectivity analyses revealed significantly decreased functional connectivity between the midbrain and the right middle occipital gyrus, between pons_1 and the right orbital part of the superior frontal gyrus, and between pons_2 and the right parahippocampus in RLS compared with NC. Moreover, the functional connectivity between pons_2 and the right supplementary motor area (SMA) was significantly increased in RLS compared with NC. This change in RLS was marginally correlated with RS_RLS scores in the RLS patients. SVM-based classification showed an AUC of 0.955 using gray matter density of pons_2, and functional connectivity between pons_2 and SMA as features.
Conclusion: Collectively, our findings suggest that changes in gray matter density and functional connectivity in the pons may play a pathologic role in RLS. Furthermore, these abnormal changes in the pons might help to discriminate RLS from healthy subjects.
Keywords: restless legs syndrome, gray matter density, brainstem, multivariate pattern analysis
Introduction
Restless legs syndrome (RLS) is a sensorimotor disorder characterized by sensation of discomfort in the legs, usually occurring at rest prior to sleep onset or overnight, resulting in an irresistible urge to move the legs, which partially or fully relieves the discomfort by movements.1,2 Conventional pathophysiology of RLS is result from unbalanced dopaminergic system and genetic factors, in susceptibility to restless legs syndrome is well documented. Furthermore, brain iron deficiency and peripheral and central hypoxic pathways have also been demonstrated involved in pathophysiology of RLS.3 Thus far, the pathophysiology of restless legs syndrome remains a complex mystery. Although brain imaging studies have been performed on RLS patients, the findings remain controversial, especially structural studies. No gross changes in brain structure have been found in these patients, and findings on microstructural changes have been inconsistent.4–15 The discordance may be caused by differences in patient selection, sample size and/or technical parameters. Some new strategy, like segment brain structures in pain research, could enlighten us in RLS research.
Neuroimaging studies of pain16,17 have relied on segmentation of brain structures. These studies demonstrate that it is feasible and beneficial to perform an accurate segmentation of brain structures in subjects. Noninvasive tools for accurate brain segmentation are essential for a better understanding of brain structure and function,18 not only in pain, but also for other diseases associated with sensory and motor dysfunction, such as RLS.
A lesion in the brainstem was reported to be related to the development of secondary RLS.19 Neurophysiological and radiological studies have also demonstrated the involvement of brainstem pattern generators in the pathology of RLS.20 In addition, we previously found significantly abnormal gray matter volume in the brainstem in patients with RLS.21 However, these previous investigations examined the brainstem as a whole, although it is a complex brain structure consisting of long fiber bundles and scattered brain nuclei, each with distinct functions. Therefore, segmentation of brainstem structures may provide insight into their individual roles in RLS.
In this study, we performed segmentation of the brainstem into the midbrain, pons, medulla and superior cerebellar peduncle based on data from normal controls (NC).22 These subregions of the brainstem were used to accurately evaluate the anatomical location of significant differences in gray matter density between RLS patients and NC subjects. Then, subregions showing significant changes in gray matter density were selected as seed regions for whole brain functional connectivity (FC) studies in both groups. Furthermore, we conducted correlation analysis between the mean gray matter density/FC and clinical symptom scores for each patient. Finally, multivariate pattern analysis, extracting abnormal features using linear support vector machine (SVM), was used to test whether these altered features involving the pathophysiologic process and can help distinguish RLS patients from NC subjects.
Materials and Methods
Participants
A total of 20 drug-naive idiopathic RLS patients were recruited, based on the International Restless Legs Syndrome Study Group (IRLSSG) diagnostic criteria,23 from January 2013 to May 2017. The subjects in this study were the same as in our previous report.21 RLS patients were recruited from the Sleep center clinic of Xuanwu Hospital and all patients were evaluated by at least two neurologists who were expert in sleep disorders according to IRLSSG diagnostic criteria. None of the idiopathic RLS patients was considered to have any other specific background disease or condition that could be causing their RLS, including inquiry of medical history and family history, using neurological examinations and laboratory test to exclude secondary RLS. Both IRLSSG Rating Scale and Johns Hopkins Restless Legs Severity Scale were used to evaluate the severity of the disease. The Pittsburgh Sleep Quality Index (PSQI) was used to assess sleep quality. The Hamilton Anxiety Rating Scale (HAM-A) and Hamilton Depression Rating Scale (HAM-D) were used to exclude patients with serious anxiety (score >21) or depression (score >20). Patients with a history of alcohol or drug abuse, anemia, renal disease, diabetes, spinal cord or nerve root injury, or other neuropathies or sleep disorders were also excluded. Routine laboratory test results (including serum levels of hemoglobin, iron/ferritin, urea, creatinine, vitamin B12, folic acid, thyroid hormone, and HbA1c) and neurological examinations were normal. No patients had taken psychotropic medications. A total of 18 age-, gender-matched NC subjects were recruited through the community and health examination center. The NC subjects had no history of nervous system disease, mental illness, or RLS family history. All patients and NC subjects were righthanded. The Medical Ethics Committee at Xuan Wu Hospital of Capital Medical University approved our study. The study was conducted in accordance with the Declaration of Helsinki. The RLS patients and NC subjects signed informed consent. The demographic characteristics, clinical scales, and laboratory tests are shown in Table 1, and a Flowchart regarding screening RLS patients and fMRI analysis process was attached in Supplementary Material.
 |
Table 1 Demographic Characteristics, Clinical Scales and Laboratory Tests |
MRI Acquisition
MRI data acquisition was performed on a Siemens Trio 3-Tesla scanner (Siemens, Erlangen, Germany). Foam padding and headphones were used to limit head motion and reduce scanner noise. Three-dimensional T1-weighted magnetization-prepared rapid gradient echo (MPRAGE) sagittal images were collected using the following parameters: repetition time (TR) = 1900 ms; echo time (TE) = 2.2 ms; inversion time (TI) = 900 ms; flip angle (FA) = 9°; matrix size = 256 × 256; slices = 176; thickness = 1.0 mm; and voxel size = 1 × 1 × 1 mm3. Resting-state functional images were acquired using standard echo planar imaging (EPI) sequence. Parameter settings were: repetition time/echo time ratio = 2000/40 ms; 239 volumes; flip angle = 90°; 28 slices; thickness/gap = 4.0/1.0 mm; voxel size = 3.75 × 3.75 × 4.00 mm3; matrix size = 64 × 64.
Subregions of the Brainstem
We generated an automated segmentation of four different brainstem structures from the T1 images across the NC group using Freesurfer 6.0 (http://surfer.nmr.mgh.harvard.edu/fswiki/BrainstemSubstructures). The maximum probability map was used in further analyses. The researcher conducting data analysis was blinded for the condition of the collected data.
Gray Matter Density in Subregions of the Brainstem
To accurately assess the anatomical location of significant differences in gray matter density in the brainstem, data from our previous VBM study and the subregions of brainstem were integrated into the current analyses. We calculated the mean gray matter density of these brain regions in the RLS and NC groups. Finally, two-sample t-test was performed between the groups, with a significance level set at p < 0.05/3 = 0.0167 (Bonferroni correction).
Resting-State Functional MRI (rs-fMRI) Data Preprocessing
The preprocessing of the rs-fMRI data was conducted using DPABI toolbox. The first 10 volumes were discarded to allow for magnetization equilibrium. The slice timing for the remaining images was corrected and realigned to the first volume to account for head motion. Participants who showed a maximum displacement of more than 3 mm and an angular motion of more than 3° were excluded. MNI template was adopted to normalize images, and images were resampled to 3 × 3 × 3 mm3. We used a Gaussian kernel of 6 mm (full width at half maximum) to smooth the functional images, and filtered them with a temporal band-path of 0.01–0.1 Hz. Finally, we regressed out six motion parameters, white matter signals, cerebrospinal fluid signals, and global mean signal.
FC Analyses
To assess FC changes in RLS patients, the seed regions were resampled to 3-mm3 voxels in standard MNI space. Then, correlation of mean time series between seeds and voxels was calculated using Pearson correlation analysis, and then z-values were adopted to improve normality by Fisher’s z-transformation. Significantly altered FC between seeds and brain regions were tested by two-sample t-tests at the group level. Gaussian random field (GRF) correction was used to determine significance at voxel level (p < 0.01) and cluster level (p < 0.05). To eliminate false positives, Bonferroni correction (p < 0.05/4 = 0.0125) was performed.
Correlation Analyses
To clarify whether the neuroimaging changes were related to symptoms of the disease, we performed correlation analyses between mean gray matter density/functional connectivity and the clinical score for each patient (RS_RLS, PSQI scores, and durations). These analyses were performed using SPSS 19.0 (SPSS Inc., IL., USA).
Multivariate Pattern Analysis by SVM
To clarify whether the identified abnormal features might have potential power for diagnosing RLS, we performed a linear SVM approach within LIBSVM in MATLAB.24 Because only functional connectivity between pons_2 and the right supplementary motor area (SMA) was correlated with RS_RLS scores, the mean gray matter density of pons_2, and the functional connectivity between pons_2 and SMA were extracted as features for classification. A leave-one-out cross-validation strategy was used to estimate the generalization ability of our classifier because of the limited number of subjects in our study. The potency of a classifier was assessed using the classification accuracy, specificity, and precision based on the results of the cross-validation. Then, we mapped the receiver operating characteristic (ROC) curves and calculated the area under the curve (AUC).
Results
Subregions of the Brainstem
Using T1 images from the NC group, we identified the following four subregions of the brainstem: the midbrain, pons, medulla oblongata, and superior cerebellar peduncle (Figure 1).
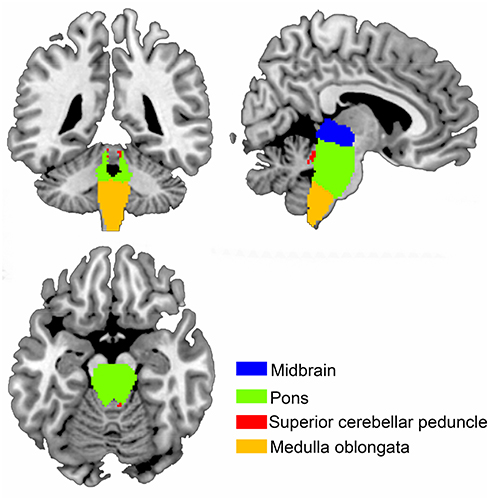 |
Figure 1 Four subregions of brainstem including midbrain, pons, medulla oblongata, and superior cerebellar peduncle were identified from the T1 images across the normal controls (NC) using Freesurfer 6.0 (http://surfer.nmr.mgh.harvard.edu/fswiki/BrainstemSubstructures). |
Changes in Gray Matter Density in the Subregions of the Brainstem
Using VBM analysis for the four subregions of the brainstem, we identified two clusters in the pons (pons_1 and pons_2) and one cluster in the midbrain that showed significantly increased gray matter density in the RLS patients compared with the NC subjects (Figure 2).
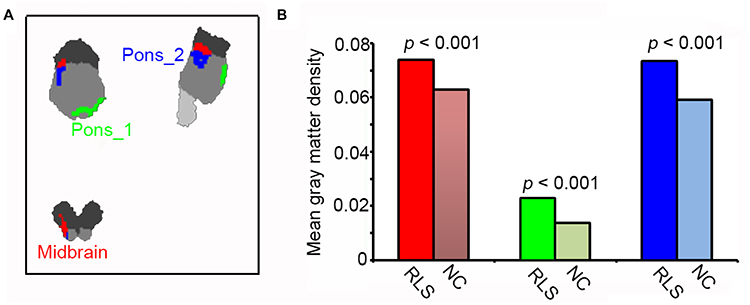 |
Figure 2 Subregions of brainstem which showed altered gray matter density in patients with restless legs syndrome (RLS). (A) The changed gray matter density of brainstem was localized by the VBM analysis, resulting in 2 clusters in the pons and 1 cluster in the midbrain. (B) The mean gray matter density of altered brain regions in NC and RLS were compared using two sample t-tests. |
Altered Functional Connectivity Patterns in the Subregions of the Brainstem
Significantly decreased functional connectivity was found between the midbrain and right middle occipital gyrus, between pons_1 and the right orbital part of the superior frontal gyrus, and between pons_2 and the right parahippocampus in the RLS patients compared with the NC subjects. Moreover, functional connectivity between pons_2 and the right SMA was significantly increased in the RLS group compared with the NC group (Figure 3A and B).
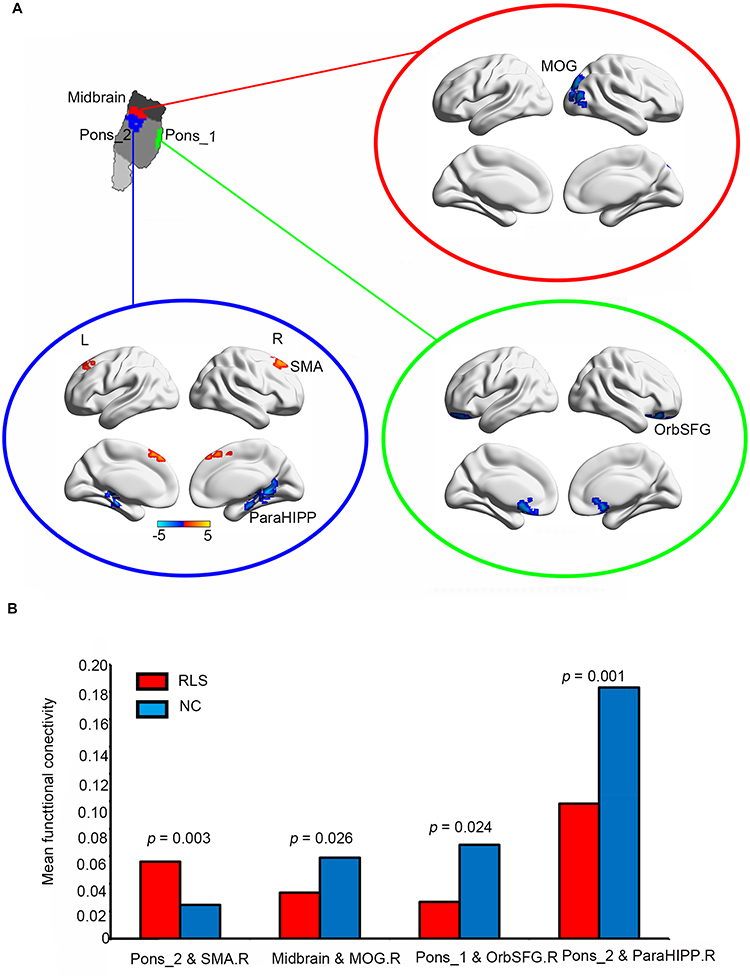 |
Figure 3 Altered functional connectivity patterns in patients with RLS compared to NC. (A) Brain regions which showed altered functional connectivity with midbrain (red), pons_1 (green), and pons_2 (blue) in patients with RLS. (B) The mean functional connectivity of altered brain regions in NC and RLS were compared using two sample t-tests. |
Correlation Analyses
Mean functional connectivity between pons_2 and SMA was marginally correlated with RS_RLS scores in patients with RLS (Figure 4).
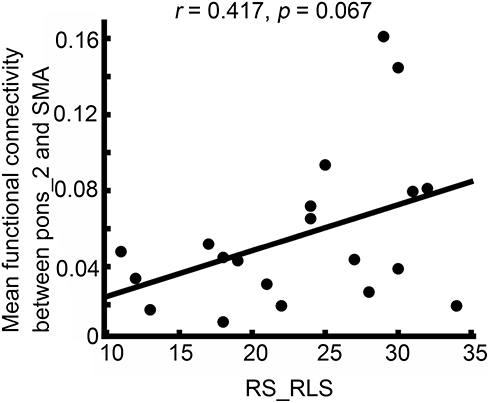 |
Figure 4 Correlation between mean functional connectivity between pons_2 and SMA and RS_RLS in patients with RLS. |
Classification Results
Using features of gray matter density in pons_2, and functional connectivity between pons_2 and SMA, the linear SVM classifiers achieved an accuracy of 84.21%, a specificity of 90%, a precision of 87.5% (Figure 5A), and an AUC of 0.955 (Figure 5B).
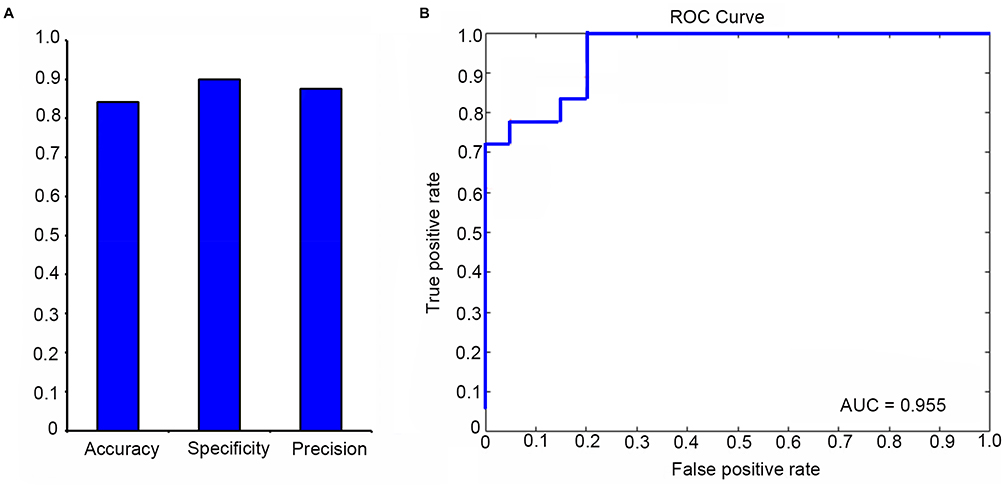 |
Figure 5 Multivariate pattern analysis using support vector machine (SVM) was applied to provide provisional evidence to determine whether identified neural indices might serve to distinguish RLS patients from NC. (A) We used a leave-one-out cross-validation strategy to estimate the generalization ability of our classifier. Features of gray matter density in pons_2, and functional connectivity between pons_2 and SMA were used. The classification accuracy, specificity, and precision were showed. (B) The receiver operating characteristic (ROC) curve. AUC, area under the curve. |
Discussion
In this study, we found significant changes in subregional gray matter density in the brainstem, mainly in the pons and midbrain, in the RLS patients compared with NC subjects. Significantly decreased functional connectivity between the midbrain and right middle occipital gyrus, between pons_1 and the right orbital part of the superior frontal gyrus, and between pons_2 and the right parahippocampus were also found in the RLS group compared with the NC group. Moreover, the functional connectivity between pons_2 and the right SMA was significantly increased in RLS patients compared with NC subjects, and this change was marginally correlated with RS_RLS scores in the RLS patients. SVM-based classification achieved an AUC of 0.955 using gray matter density of pons_2, and functional connectivity between pons_2 and SMA as features.
The pathophysiology and pathoanatomy of RLS are still unclear. fMRI studies on RLS patients show activations in the red nuclei and brainstem close to the reticular formation during the symptomatic period, suggesting that subcortical structures are involved in the pathogenesis of RLS.25 In addition, significantly reduced mean [11C] raclopride binding potential in the mesolimbic dopaminergic region in RLS patients was reported using PET.26 This binding was negatively correlated with clinical severity score and positively correlated with the degree of improvement after dopamine administration.26 Furthermore, a SPECT study using the tracer [123I] βCIT showed that serotonin transporter availability in the pons and medulla was similar in both the RLS and control groups, but was negatively correlated with disease severity in the former.27 Furthermore, iron-sensitive MRI studies have also reported reduced iron content in the substantia nigra in RLS patients.28 These studies suggest that RLS might be associated with abnormalities in the brainstem.
The human brainstem is a complex brain structure comprising the midbrain, pons and medulla oblongata. Using the whole brainstem region to assess its function may overlook subregional differences. Automated segmentation of the brainstem structures can potentially improve our understanding of the role that they play in different functions and how they are affected by the disease. In the present study, we used a supervised segmentation method based on a probabilistic atlas and Bayesian inference for the midbrain, pons, medulla and superior cerebellar peduncle22 to accurately identify the anatomical locations of significant differences in gray matter density in the brainstem between RLS patients and controls.
Lee et al29 investigated the lesion sites of infarction-related RLS, and found that 4 out of their 18 patients had ischemic lesions in the pontine. In the current study, we found changes in gray matter density in the dorsolateral pontine tegmentum (pons_2), which is situated next to the midbrain. The medial lemniscus and the lateral spinothalamic tract go through this region, conveying somatosensory information for the trunk and limbs, including deep sensation and pain-temperature sensation. Peripheral sensory thresholds of RLS patients have been reported to be normal.30,31 Thus, altered central processing rather than enhanced peripheral detection may underlie the sensation of limb discomfort in RLS. The increased gray matter density in pons_2 may be associated with sensory sensitivity. In Tourette’s syndrome, deficiency of gating mechanisms for sensory inputs and a disorder of synaptic inhibition have been suggested to contribute to the urge for tics.32,33 Some studies suggest that abnormal sensorimotor integration might cause the urge phenomenon.34,35 Thus, the movement that follows and temporarily relieves an urge might be an involuntary response to an inner feeling.36 An important clinical diagnostic feature of RLS is that the unpleasant sensations are partially or totally relieved by continuous movements such as walking and stretching,2 suggesting that RLS is a sensorimotor disorder in which the sensation is relieved by movement, similar to tics. Reduced short-latency afferent inhibition, which is associated with sensorimotor integration, has been found in RLS patients by transcranial magnetic stimulation.37 Interestingly, we found enhanced functional connectivities between pons_2 and the SMA, which was positively correlated with RLS severity scale scores. This suggests that the increased functional connectivity between pons_2 and SMA may contribute to the irresistible urge to move when unpleasant leg sensations occur. These neural structural and functional changes may be involved in the pathophysiology of RLS and may have the potential for distinguishing RLS from healthy subjects and patients with other disorders.
In this study, we also found increased gray matter volume in the ventral basal pontine (pons_1), through which the pyramidal tract traverses in its trajectory towards the lower limb. Therefore, dysfunction in this area may cause abnormal sensorimotor functioning of the lower limbs. A possible contributing factor is the loss of cortical or subcortical inhibition.38 A suprasegmental release of inhibition from descending inhibitory pathways involving dopaminergic, gabaergic, adrenergic and opiate systems might therefore be involved in RLS pathogenesis.39,40
Regional brain iron concentration has been evaluated using different MRI sequences in RLS patients, revealing decreased iron content in the midbrain and a correlation with the severity of RLS.28 Voxel-wise comparison of fractional anisotropy maps in the brainstem shows significant microstructural alterations in the bilateral midbrain.14 Here, we also found abnormal microstructure of the midbrain in RLS patients by subregional VBM analysis. The clusters were located in the midbrain tegmentum, close to the area of the substantia nigra and red nucleus. The midbrain is very close to the hypothalamic A11 cell group, which is the main source of descending dopaminergic input to the spinal cord. The dopaminergic A11 neurons project to the midbrain/brainstem and further to the spinal cord, which is considered to be involved in the pathogenesis of RLS.41 Although this theory was developed in animal models, it was not proved in humans. Earley et al did not find alterations in A11 area in the study of postmortem brains of humans.42
The structural abnormalities identified here may reflect subtle primary changes in RLS patients, but may also arise from brain changes caused by chronic activation or deactivation of brain networks. So it is necessary to study the relationship between these structural and connected changes. The decreased functional connectivity was found between midbrain and right middle occipital gyrus, between pons_1 and right orbital part of superior frontal gyrus, and between pons_2 and right parahippocampus in the RLS compared to NC belonging to limbic networks. Dysregulation of limbic networks in RLS has been found by MRS,43,44 SPECT,45 PET,46,47 and structural and functional MRI studies. Abnormal communication between the limbic and sensorimotor systems may underlie RLS signs and symptoms. Limbic dysfunction may also contribute to the greater tendency of RLS patients to develop depressive and anxiety disorders,48–51 mild cognitive deficits,51–54 and sympathetic hyperactivity.55
Disease-related spatial covariance patterns obtained by linear SVM classifiers have shown to be helpful for differential diagnosis. Demonstrating various morphological abnormalities and their association with clinical symptoms, SVM classification may be furthermore useful for identifying pathologic changes in RLS.56 Using this technique, we found that gray matter density in pons_2, and functional connectivity between pons_2 and SMA together have the potential to discriminate RLS patients from healthy subjects with high power.
There are a number of limitations to this study. First, only 20 drug-naive patients were recruited to investigate brainstem changes in RLS. Our findings should therefore be validated using a larger number of patients. Second, it is unclear whether the changes in gray matter volume and functional connectivity are pathophysiologically causative or secondary compensatory changes. In the future, we can choose drug therapy or effective neuromodulation treatment to observe the correlation between the improvement of symptoms in restless leg symptoms and the abnormal structural/functional changes, which may help to solve this puzzle. Nonetheless, our study provides insight into the brainstem changes in RLS, and should help advance the diagnosis and treatment of this disorder.
Conclusion
We identified subtle morphological changes in the brainstem in RLS patients. VBM detection of structural changes and FC analysis combined with SVM classification may improve the clinical diagnosis and treatment of RLS.
Acknowledgments
This study was supported by the National Key R&D Program (No. 2018YFC1314500), the National Natural Science Foundation of China (No. 81701297), and the Natural Science Foundation of Guangdong Province (No. 2017A030313744).
Disclosure
None of the authors have any conflict of interest to disclose.
References
1. Ito E, Inoue Y. [The international classification of sleep disorders, third edition. American Academy of Sleep Medicine. Includes bibliographies and index]. Nihon Rinsho. 2015;73(6):916–923. Japanese.
2. Allen RP, Picchietti D, Hening WA, Trenkwalder C, Walters AS, Montplaisi J. Restless legs syndrome: diagnostic criteria, special considerations, and epidemiology. A report from the restless legs syndrome diagnosis and epidemiology workshop at the National Institutes of Health. Sleep Med. 2003;4(2):101–119. doi:10.1016/S1389-9457(03)00010-8
3. Trenkwalder C, Allen R, Hogl B, et al. Comorbidities, treatment, and pathophysiology in restless legs syndrome. Lancet Neurol. 2018;17(11):994–1005. doi:10.1016/S1474-4422(18)30311-9
4. Etgen T, Draganski B, Ilg C, et al. Bilateral thalamic gray matter changes in patients with restless legs syndrome. Neuroimage. 2005;24(4):1242–1247. doi:10.1016/j.neuroimage.2004.10.021
5. Celle S, Roche F, Peyron R, et al. Lack of specific gray matter alterations in restless legs syndrome in elderly subjects. J Neurol. 2010;257(3):344–348. doi:10.1007/s00415-009-5320-2
6. Comley RA, Cervenka S, Palhagen SE, et al. A comparison of gray matter density in restless legs syndrome patients and matched controls using voxel-based morphometry. J Neuroimaging. 2012;22(1):28–32. doi:10.1111/jon.2012.22.issue-1
7. Rizzo G, Manners D, Vetrugno R, et al. Combined brain voxel-based morphometry and diffusion tensor imaging study in idiopathic restless legs syndrome patients. Eur J Neurol. 2012;19(7):1045–1049. doi:10.1111/ene.2012.19.issue-7
8. Belke M, Heverhagen JT, Keil B, et al. DTI and VBM reveal white matter changes without associated gray matter changes in patients with idiopathic restless legs syndrome. Brain Behav. 2015;5(9):e00327. doi:10.1002/brb3.2015.5.issue-9
9. Unrath A, Juengling FD, Schork M, Kassubek J. Cortical grey matter alterations in idiopathic restless legs syndrome: an optimized voxel-based morphometry study. Mov Disord. 2007;22(12):1751–1756. doi:10.1002/(ISSN)1531-8257
10. Hornyak M, Ahrendts JC, Spiegelhalder K, et al. Voxel-based morphometry in unmedicated patients with restless legs syndrome. Sleep Med. 2007;9(1):22–26. doi:10.1016/j.sleep.2006.09.010
11. Connor JR, Ponnuru P, Lee BY, et al. Postmortem and imaging based analyses reveal CNS decreased myelination in restless legs syndrome. Sleep Med. 2011;12(6):614–619. doi:10.1016/j.sleep.2010.10.009
12. Chang Y, Chang HW, Song H, et al. Gray matter alteration in patients with restless legs syndrome: a voxel-based morphometry study. Clin Imaging. 2015;39(1):20–25. doi:10.1016/j.clinimag.2014.07.010
13. Unrath A, Muller HP, Ludolph AC, Riecker A, Kassubek J. Cerebral white matter alterations in idiopathic restless legs syndrome, as measured by diffusion tensor imaging. Mov Disord. 2008;23(9):1250–1255. doi:10.1002/mds.22074
14. Lindemann K, Muller HP, Ludolph AC, Hornyak M, Kassubek J. Microstructure of the midbrain and cervical spinal cord in idiopathic restless legs syndrome: a diffusion tensor imaging study. Sleep. 2016;39(2):423–428. doi:10.5665/sleep.5456
15. Jimenez-Jimenez FJ, Alonso-Navarro H, Garcia-Martin E, Agundez JAG. Neurochemical features of idiopathic restless legs syndrome. Sleep Med Rev. 2019;45:70–87. doi:10.1016/j.smrv.2019.03.006
16. Hadjipavlou G, Dunckley P, Behrens TE, Tracey I. Determining anatomical connectivities between cortical and brainstem pain processing regions in humans: a diffusion tensor imaging study in healthy controls. Pain. 2006;123(1–2):169–178. doi:10.1016/j.pain.2006.02.027
17. Dunckley P, Wise RG, Fairhurst M, et al. A comparison of visceral and somatic pain processing in the human brainstem using functional magnetic resonance imaging. J Neurosci. 2005;25(32):7333–7341. doi:10.1523/JNEUROSCI.1100-05.2005
18. Tracey I, Iannetti GD. Brainstem functional imaging in humans. Suppl Clin Neurophysiol. 2006;58:52–67.
19. Ferini-Strambi L, Filippi M, Martinelli V, et al. Nocturnal sleep study in multiple sclerosis: correlations with clinical and brain magnetic resonance imaging findings. J Neurol Sci. 1994;125(2):194–197. doi:10.1016/0022-510X(94)90035-3
20. Kim JS, Lee SB, Park SK, Han SR, Kim YI, Lee KS. Periodic limb movement during sleep developed after pontine lesion. Mov Disord. 2003;18(11):1403–1405. doi:10.1002/mds.10517
21. Li T, Liu C, Lyu H, et al. Alterations of sub-cortical gray matter volume and their associations with disease duration in patients with restless legs syndrome. Front Neurol. 2018;9:1098. doi:10.3389/fneur.2018.01098
22. Iglesias JE, Van Leemput K, Bhatt P, et al. Bayesian segmentation of brainstem structures in MRI. Neuroimage. 2015;113:184–195. doi:10.1016/j.neuroimage.2015.02.065
23. Allen RP, Picchietti DL, Garcia-Borreguero D, et al. Restless legs syndrome/Willis-Ekbom disease diagnostic criteria: updated International Restless Legs Syndrome Study Group (IRLSSG) consensus criteria – history, rationale, description, and significance. Sleep Med. 2014;15(8):860–873. doi:10.1016/j.sleep.2014.03.025
24. Chang -C-C, Lin C-J. LIBSVM: a library for support vector machines. ACM Trans Intell Syst Technol. 2011;2(3):27.
25. Bucher SF, Seelos KC, Oertel WH, Reiser M, Trenkwalder C. Cerebral generators involved in the pathogenesis of the restless legs syndrome. Ann Neurol. 1997;41(5):639–645. doi:10.1002/(ISSN)1531-8249
26. Oboshi Y, Ouchi Y, Yagi S, et al. In vivo mesolimbic D2/3 receptor binding predicts posttherapeutic clinical responses in restless legs syndrome: a positron emission tomography study. J Cereb Blood Flow Metab. 2012;32(4):654–662. doi:10.1038/jcbfm.2011.201
27. Jhoo JH, Yoon IY, Kim YK, et al. Availability of brain serotonin transporters in patients with restless legs syndrome. Neurology. 2010;74(6):513–518. doi:10.1212/WNL.0b013e3181cef824
28. Allen RP, Barker PB, Wehrl FW, Song HK, Earley CJ. MRI measurement of brain iron in patients with restless legs syndrome. Neurology. 2001;56(2):263–265. doi:10.1212/WNL.56.2.263
29. Lee SJ, Kim JS, Song IU, An JY, Kim YI, Lee KS. Poststroke restless legs syndrome and lesion location: anatomical considerations. Mov Disord. 2009;24(1):77–84. doi:10.1002/mds.22303
30. Seok HY, Do SY, Motamedi GK, Cho YW. Symptom-related changes in current perception threshold of restless legs syndrome. J Sleep Res. 2019;25:e12890.
31. Lim YM, Chang SE, Chung S, Kang BH, Kim KK. Small fiber function in drug naive patients with idiopathic restless legs syndrome. J Clin Neurosci. 2012;19(5):702–705. doi:10.1016/j.jocn.2011.07.043
32. Michael O, Alexander M. Transcranial magnetic stimulation studies of sensorimotor networks in Tourette syndrome. Behav Neurol. 2013;27(1):57–64.
33. Sutherland Owens AN, Miguel EC, Swerdlow NR. Sensory gating scales and premonitory urges in Tourette syndrome. Sci World J. 2011;11:736–741. doi:10.1100/tsw.2011.57
34. Ondo WG, Jankovic J, Simpson R, Jimenez-Shahed J. Globus pallidus deep brain stimulation for refractory idiopathic restless legs syndrome. Sleep Med. 2012;13(9):1202–1204. doi:10.1016/j.sleep.2012.06.007
35. Mazzone SB, McGovern AE, Yang SK, et al. Sensorimotor circuitry involved in the higher brain control of coughing. Cough. 2013;9(1):7. doi:10.1186/1745-9974-9-7
36. Harbourne RT, Stergiou N. Movement variability and the use of nonlinear tools: principles to guide physical therapist practice. Phys Ther. 2009;89(3):267–282. doi:10.2522/ptj.20080130
37. Rizzo V, Arico I, Liotta G, et al. Impairment of sensory-motor integration in patients affected by RLS. J Neurol. 2010;257(12):1979–1985. doi:10.1007/s00415-010-5644-y
38. Kang SY, Sohn YH, Lee IK, Kim JS. Unilateral periodic limb movement in sleep after supratentorial cerebral infarction. Parkinsonism Relat Disord. 2004;10(7):429–431. doi:10.1016/j.parkreldis.2004.04.009
39. Bara-Jimenez W, Aksu M, Graham B, Sato S, Hallett M. Periodic limb movements in sleep: state-dependent excitability of the spinal flexor reflex. Neurology. 2000;54(8):1609–1616. doi:10.1212/WNL.54.8.1609
40. Magalhaes SC, Queiroz de Paiva JP, Kaelin-Lang A, et al. Short-interval intracortical inhibition is decreased in restless legs syndrome across a range of severity. Sleep Med. 2019;62:34–42. doi:10.1016/j.sleep.2019.03.021
41. Trenkwalder C, Paulus W. Restless legs syndrome: pathophysiology, clinical presentation and management. Nat Rev Neurol. 2010;6(6):337–346. doi:10.1038/nrneurol.2010.55
42. Earley CJ, Allen RP, Connor JR, Ferrucci L, Troncoso J. The dopaminergic neurons of the A11 system in RLS autopsy brains appear normal. Sleep Med. 2009;10(10):1155–1157. doi:10.1016/j.sleep.2009.01.006
43. Rizzo G, Tonon C, Testa C, et al. Abnormal medial thalamic metabolism in patients with idiopathic restless legs syndrome. Brain. 2012;135(12):3712–3720. doi:10.1093/brain/aws266
44. Winkelman JW, Schoerning L, Platt S, Jensen JE. Restless legs syndrome and central nervous system gamma-aminobutyric acid: preliminary associations with periodic limb movements in sleep and restless leg syndrome symptom severity. Sleep Med. 2014;15(10):1225–1230. doi:10.1016/j.sleep.2014.05.019
45. San Pedro EC, Mountz JM, Mountz JD, Liu HG, Katholi CR, Deutsch G. Familial painful restless legs syndrome correlates with pain dependent variation of blood flow to the caudate, thalamus, and anterior cingulate gyrus. J Rheumatol. 1998;25(11):2270–2275.
46. Cervenka S, Palhagen SE, Comley RA, et al. Support for dopaminergic hypoactivity in restless legs syndrome: a PET study on D2-receptor binding. Brain. 2006;129(Pt 8):2017–2028. doi:10.1093/brain/awl163
47. Von Spiczak S, Whone AL, Hammers A, et al. The role of opioids in restless legs syndrome: an [11C]diprenorphine PET study. Brain. 2005;128(Pt 4):906–917. doi:10.1093/brain/awh441
48. Winkelmann J, Prager M, Lieb R, et al. “Anxietas tibiarum”. Depression and anxiety disorders in patients with restless legs syndrome. J Neurol. 2005;252(1):67–71. doi:10.1007/s00415-005-0604-7
49. Cho SJ, Hong JP, Hahm BJ, et al. Restless legs syndrome in a community sample of Korean adults: prevalence, impact on quality of life, and association with DSM-IV psychiatric disorders. Sleep. 2009;32(8):1069–1076.
50. Hornyak M. Depressive disorders in restless legs syndrome: epidemiology, pathophysiology and management. CNS Drugs. 2010;24(2):89–98. doi:10.2165/11317500-000000000-00000
51. Celle S, Roche F, Kerleroux J, et al. Prevalence and clinical correlates of restless legs syndrome in an elderly French population: the synapse study. J Gerontol Biol Sci Med Sci. 2010;65A(2):167–173. doi:10.1093/gerona/glp161
52. Pearson VE, Allen RP, Dean T, Gamaldo CE, Lesage SR, Earley CJ. Cognitive deficits associated with restless legs syndrome (RLS). Sleep Med. 2006;7(1):25–30. doi:10.1016/j.sleep.2005.05.006
53. Gamaldo CE, Benbrook AR, Allen RP, Oguntimein O, Earley CJ. A further evaluation of the cognitive deficits associated with restless legs syndrome (RLS). Sleep Med. 2008;9(5):500–505. doi:10.1016/j.sleep.2007.07.014
54. Fulda S, Beitinger ME, Reppermund S, Winkelmann J, Wetter TC. Short-term attention and verbal fluency is decreased in restless legs syndrome patients. Mov Disord. 2010;25(15):2641–2648. doi:10.1002/mds.23353
55. Walters AS, Rye DB. Review of the relationship of restless legs syndrome and periodic limb movements in sleep to hypertension, heart disease, and stroke. Sleep. 2009;32(5):589–597. doi:10.1093/sleep/32.5.589
56. Rizzo G, Li X, Galantucci S, Filippi M, Cho YW. Brain imaging and networks in restless legs syndrome. Sleep Med. 2017;31:39–48. doi:10.1016/j.sleep.2016.07.018
 © 2020 The Author(s). This work is published and licensed by Dove Medical Press Limited. The full terms of this license are available at https://www.dovepress.com/terms.php and incorporate the Creative Commons Attribution - Non Commercial (unported, v3.0) License.
By accessing the work you hereby accept the Terms. Non-commercial uses of the work are permitted without any further permission from Dove Medical Press Limited, provided the work is properly attributed. For permission for commercial use of this work, please see paragraphs 4.2 and 5 of our Terms.
© 2020 The Author(s). This work is published and licensed by Dove Medical Press Limited. The full terms of this license are available at https://www.dovepress.com/terms.php and incorporate the Creative Commons Attribution - Non Commercial (unported, v3.0) License.
By accessing the work you hereby accept the Terms. Non-commercial uses of the work are permitted without any further permission from Dove Medical Press Limited, provided the work is properly attributed. For permission for commercial use of this work, please see paragraphs 4.2 and 5 of our Terms.