Back to Journals » Diabetes, Metabolic Syndrome and Obesity » Volume 19
Incorporating Insulin Resistance Biomarkers into Machine Learning Models Enhances Diagnostic Accuracy for Metabolic Dysfunction–Associated Steatotic Liver Disease
Authors Nie J, Zhou J ![]() , Hu Y, Zhang C, Yu P, Lei X
, Hu Y, Zhang C, Yu P, Lei X ![]()
Received 24 December 2025
Accepted for publication 5 May 2026
Published 4 June 2026 Volume 2026:19 590383
DOI https://doi.org/10.2147/DMSO.S590383
Checked for plagiarism Yes
Review by Single anonymous peer review
Peer reviewer comments 3
Editor who approved publication: Professor Jae Woong Sull
Jingyuan Nie,1,* Jing Zhou,1,* Yuanjia Hu,1 Changhong Zhang,1 Pingping Yu,2 Xun Lei1
1Department of Epidemiology and Health Statistics, School of Public Health, Chongqing Medical University, Chongqing, 400016, People’s Republic of China; 2Health Medical Center, The Second Affiliated Hospital of Chongqing Medical University, Chongqing, 400010, People’s Republic of China
*These authors contributed equally to this work
Correspondence: Xun Lei, Email [email protected] Pingping Yu, Email [email protected]
Introduction: Metabolic dysfunction–associated steatotic liver disease (MASLD) has emerged as the most prevalent chronic liver disorder worldwide. Despite its increasing prevalence, MASLD is often asymptomatic in its early course, leading to considerable underdiagnosis. Insulin resistance (IR) plays a key role in MASLD development; however, the incremental value of IR-related biomarkers in machine learning (ML) diagnostic models for MASLD has not been fully investigated.
Methods: This retrospective single-center study included 18,535 adults (5992 with MASLD and 12,543 without MASLD) undergoing routine health examinations at our research center. Two feature sets were created: Set 1 included demographic, anthropometric, clinical, and biochemical indicators, while Set 2 further incorporated IR-related biomarkers, including triglyceride–glucose (TyG)–based indices and the metabolic score for insulin resistance (METS-IR). Six ML algorithms were used to develop diagnostic models. Model performance was assessed using sensitivity, specificity, F1-score, and area under the curve (AUC) on the training and validation sets, with clinical utility evaluated using decision curve analysis (DCA). Model interpretability was further explored using Shapley Additive exPlanations (SHAP).
Results: All six ML models demonstrated a statistically significant improvement in AUC values after incorporating IR-related biomarkers (all P < 0.05). In the validation set, the extremely randomized trees (ERT) model with Set 2 achieved the highest AUC (0.901). DCA further indicated that models incorporating IR-related biomarkers generally provided a higher net clinical benefit. Overall, the ERT model provided the most favorable combination of discrimination and clinical utility. SHAP analysis further emphasized the important role of IR-related biomarkers in MASLD diagnosis.
Conclusion: Incorporating IR-related biomarkers into ML diagnostic models improved the accuracy and clinical utility of MASLD detection without increasing testing costs or patient burden. These findings highlight the incremental diagnostic value of IR-related biomarkers in ML models and support their use as a decision-support tool for MASLD screening in general populations.
Keywords: metabolic dysfunction-associated steatotic liver disease, insulin resistance, machine learning, diagnostic model
Introduction
Metabolic dysfunction–associated steatotic liver disease (MASLD)—a term adopted in 2023 to replace non-alcoholic fatty liver disease (NAFLD) and better reflect its metabolic drivers—is a hepatic disorder closely associated with metabolic dysregulation and pathologically characterized by excessive hepatic lipid accumulation linked to insulin resistance.1 With the worldwide increase in obesity and metabolic conditions, the prevalence of MASLD has been steadily rising, making it the most common chronic liver disease globally.2 From 1991 to 2019, the global prevalence of MASLD grew from 22% to 37%, affecting more than one-third of adults globally, and is projected to continue increasing over the next decade.3,4 In individuals with MASLD, the buildup of excessive and dysfunctional fat tissue drives metabolic problems and inflammatory responses, which worsen liver damage and lead to advanced liver diseases such as fibrosis, cirrhosis, and hepatocellular carcinoma.5,6
Given the asymptomatic nature of MASLD, its low diagnosis rate remains a key barrier to effective treatment and prevention of related complications.7 Liver biopsy remains the reference standard for hepatic lipid quantification; however, its use in large-scale screening is limited by its invasive nature, sampling heterogeneity, and reduced feasibility. Although imaging modalities such as magnetic resonance imaging (MRI), ultrasound, and computed tomography (CT) can detect and assess hepatic steatosis, their high cost and limited accessibility make it challenging to provide these services to the vast population affected by MASLD.8 In addition, cost-effective non-invasive scores such as the fibrosis-4 index (FIB-4) are used for risk stratification in suspected MASLD; however, among other limitations, its performance is influenced by age, which can limit diagnostic accuracy.9,10 Therefore, building diagnostic models for MASLD using routinely collected clinical indicators has become a common approach in clinical practice, and several models have already demonstrated reasonable diagnostic performance.11,12
As a core driver of MASLD, insulin resistance (IR) underpins its pathogenesis by disrupting systemic metabolic pathways and dysregulating lipid metabolism.13,14 Several easily accessible biomarkers of IR, such as the triglyceride-glucose index (TyG)15 and its anthropometry-based derivatives, as well as the metabolic score for insulin resistance (METS-IR),16 have already been widely investigated as predictors of MASLD in conventional regression-based models.17,18 However, as composite variables derived from routinely measured indices, they tend to have additional collinearity with the original variables, which may make it harder for traditional linear models to reflect their contribution to prediction entirely and may reduce the model’s ability to generalize to new data, thereby underestimating their predictive value and clinical utility for MASLD.
With advancements in artificial intelligence, machine learning (ML) has demonstrated advantages in disease diagnosis by integrating routinely collected clinical variables to generate individualized probability estimates, thereby supporting MASLD detection and clinical decision-making.19 Compared with traditional linear models, ML algorithms can detect non-linear and interactive patterns within complex feature spaces and are generally more tolerant of collinearity among predictors, thereby potentially exploiting more of the information embedded in IR-related biomarkers. This may improve diagnostic performance and support more accurate identification of individuals with MASLD in primary care and screening settings, enabling timely clinical attention and intervention. Some studies have begun to incorporate IR-related biomarkers into ML models for MASLD diagnosis.20–22 Still, prior ML studies have rarely isolated and quantified the incremental value of IR-related biomarkers beyond routine clinical variables; their additional predictive value beyond routine clinical variables has not yet been systematically evaluated.
This study developed multiple models using six ML algorithms and two feature sets differing in the inclusion of IR–related biomarkers. The objective was to assess and compare the diagnostic performance and clinical utility of these models and, through interpretability analyses, to quantify the potential incremental value of incorporating IR-related biomarkers, thereby informing the development of a more accurate tool to support MASLD screening.
Method
Study Design and Participants
This retrospective observational study used routine health examination data from individuals who underwent screening at a tertiary hospital-based health screening centre in Chongqing. Inclusion criteria were: (1) having undergone liver Doppler ultrasonography, and (2) completing a health examination between July 2017 and January 2025. Exclusion criteria were: (1) age <18 years, and (2) incomplete clinical data. Ultimately, 18,535 participants were included in the analysis (Figure 1). The study was approved by the Ethics Committee of the Second Affiliated Hospital of Chongqing Medical University (No.2023–45). Informed consent was obtained from all participants. All study procedures were conducted in accordance with applicable ethical regulations and the Declaration of Helsinki.
 |
Figure 1 Study flowchart. |
Data Collection
All participants underwent a physical examination, hepatic ultrasonography, and venipuncture for laboratory testing. Blood biochemical tests were performed using a Hitachi automatic biochemistry analyzer, while height and weight were measured using an Omron digital weight scale. Waist circumference (WC), hip circumference (HC), systolic blood pressure (SBP), and diastolic blood pressure (DBP) were all measured in accordance with international guidelines.23,24
Lifestyle information for the preceding three months (smoking, alcohol consumption, and physical activity) was obtained via participants’ self-reports during routine physician interviews at the health check-up. Alcohol consumption was categorized as nondrinkers (0 g/day), light drinkers (0–30 g/day for men and 0–20 g/day for women), and heavy drinkers (men ≥30 g/day; women ≥20 g/day). Physical activity level was defined as no exercise, occasional exercise (less than 3 times per week), or regular exercise (more than 3 times per week).25
The diagnosis of MASLD followed the latest clinical practice guidelines for its management and was defined as ultrasonography-confirmed hepatic steatosis in the presence of at least one metabolic risk factor (see Supplementary Table S1).26 All IR‑related biomarkers analysed in this study were calculated using the formulas provided in Supplementary Table S2.
Feature Selection
To mitigate the impact of collinearity, we applied a correlation-based screening procedure to all continuous candidate predictors, including both clinical indicators and IR-related biomarkers, collected as described above. Pearson correlation coefficients were calculated, and hierarchical clustering was performed using 1−|r| as the distance metric, with |r| ≥ 0.7 considered indicative of high correlation. Within each high-correlation cluster, we retained 1–2 clinically interpretable representative variables and excluded the remaining ones. Details of the correlation structure and clustering results are provided in Supplementary Table S3.
Finally, we constructed two feature sets for model development to evaluate the incremental value of IR-related biomarkers. Feature set 1 (Set 1) included: age, gender, height, weight, WC, smoking status, physical activity level, alcohol consumption, SBP, triglycerides (TG), fasting plasma glucose (FPG), and high-density lipoprotein cholesterol (HDL-C). Feature set 2 (Set 2) was developed by adding two IR-related biomarkers to Set 1, including the TyG index–waist-to-height ratio product (TyG-WHtR) and METS-IR. The variance inflation factor (VIF) was calculated for each clinical indicator, and all VIF values were below 10.
Model Development and Statistical Analysis
To ensure a thorough evaluation, this study used six ML algorithms with different learning principles and robustness to collinearity: extremely randomized trees (ERT), extreme gradient boosting (XGBoost), support vector machine (SVM), multilayer perceptron (MLP), k-nearest neighbors (KNN), and Gaussian naïve Bayes (GNB). All algorithms underwent hyperparameter tuning through grid search, with the parameter search ranges for each algorithm detailed in Supplementary Table S4.
Data were analyzed using R software (version 4.3.3; R Foundation for Statistical Computing, Vienna, Austria). Continuous variables were summarized as mean ± standard deviation (SD), and categorical variables as counts (percentages). Between-group differences in clinical variables were evaluated with the chi-square test (for categorical variables), the Wilcoxon rank-sum test (for non-normally distributed or ordinal variables), and the independent-samples t-test (for continuous variables).
Model Evaluation and Interpretability
Model performance was assessed using metrics, including Sensitivity, Specificity, F1-score, and the area under the curve (AUC), on both the training and validation sets. The DeLong test was used to determine whether differences in AUC between models were statistically significant. Decision curve analysis (DCA) was performed to evaluate the net clinical benefit of each model in the validation set. All statistical tests were two-sided, and a p-value < 0.05 was considered statistically significant.
To enhance interpretability, we applied SHapley Additive exPlanations (SHAP) to ML models and generated SHAP-based feature-importance rankings, waterfall plots, and force plots to quantify the contribution of each predictor and illustrate how individual features influence the model output.
Results
Patient Characteristics
A total of 18,535 participants were included, consisting of 9087 men (49.03%) and 9448 women (50.97%). The prevalence of MASLD in the cohort was 32.33%. Clinical characteristics of participants with and without MASLD are summarized in Table 1. Results showed that MASLD cases had a higher proportion of males and a higher average age. Additionally, the prevalence of smoking, heavy alcohol use, and inadequate physical activity was also greater among MASLD cases compared to non-MASLD individuals. Furthermore, MASLD cases exhibited an adverse metabolic profile, with higher TG and FPG levels and lower HDL-C compared with non-MASLD individuals.
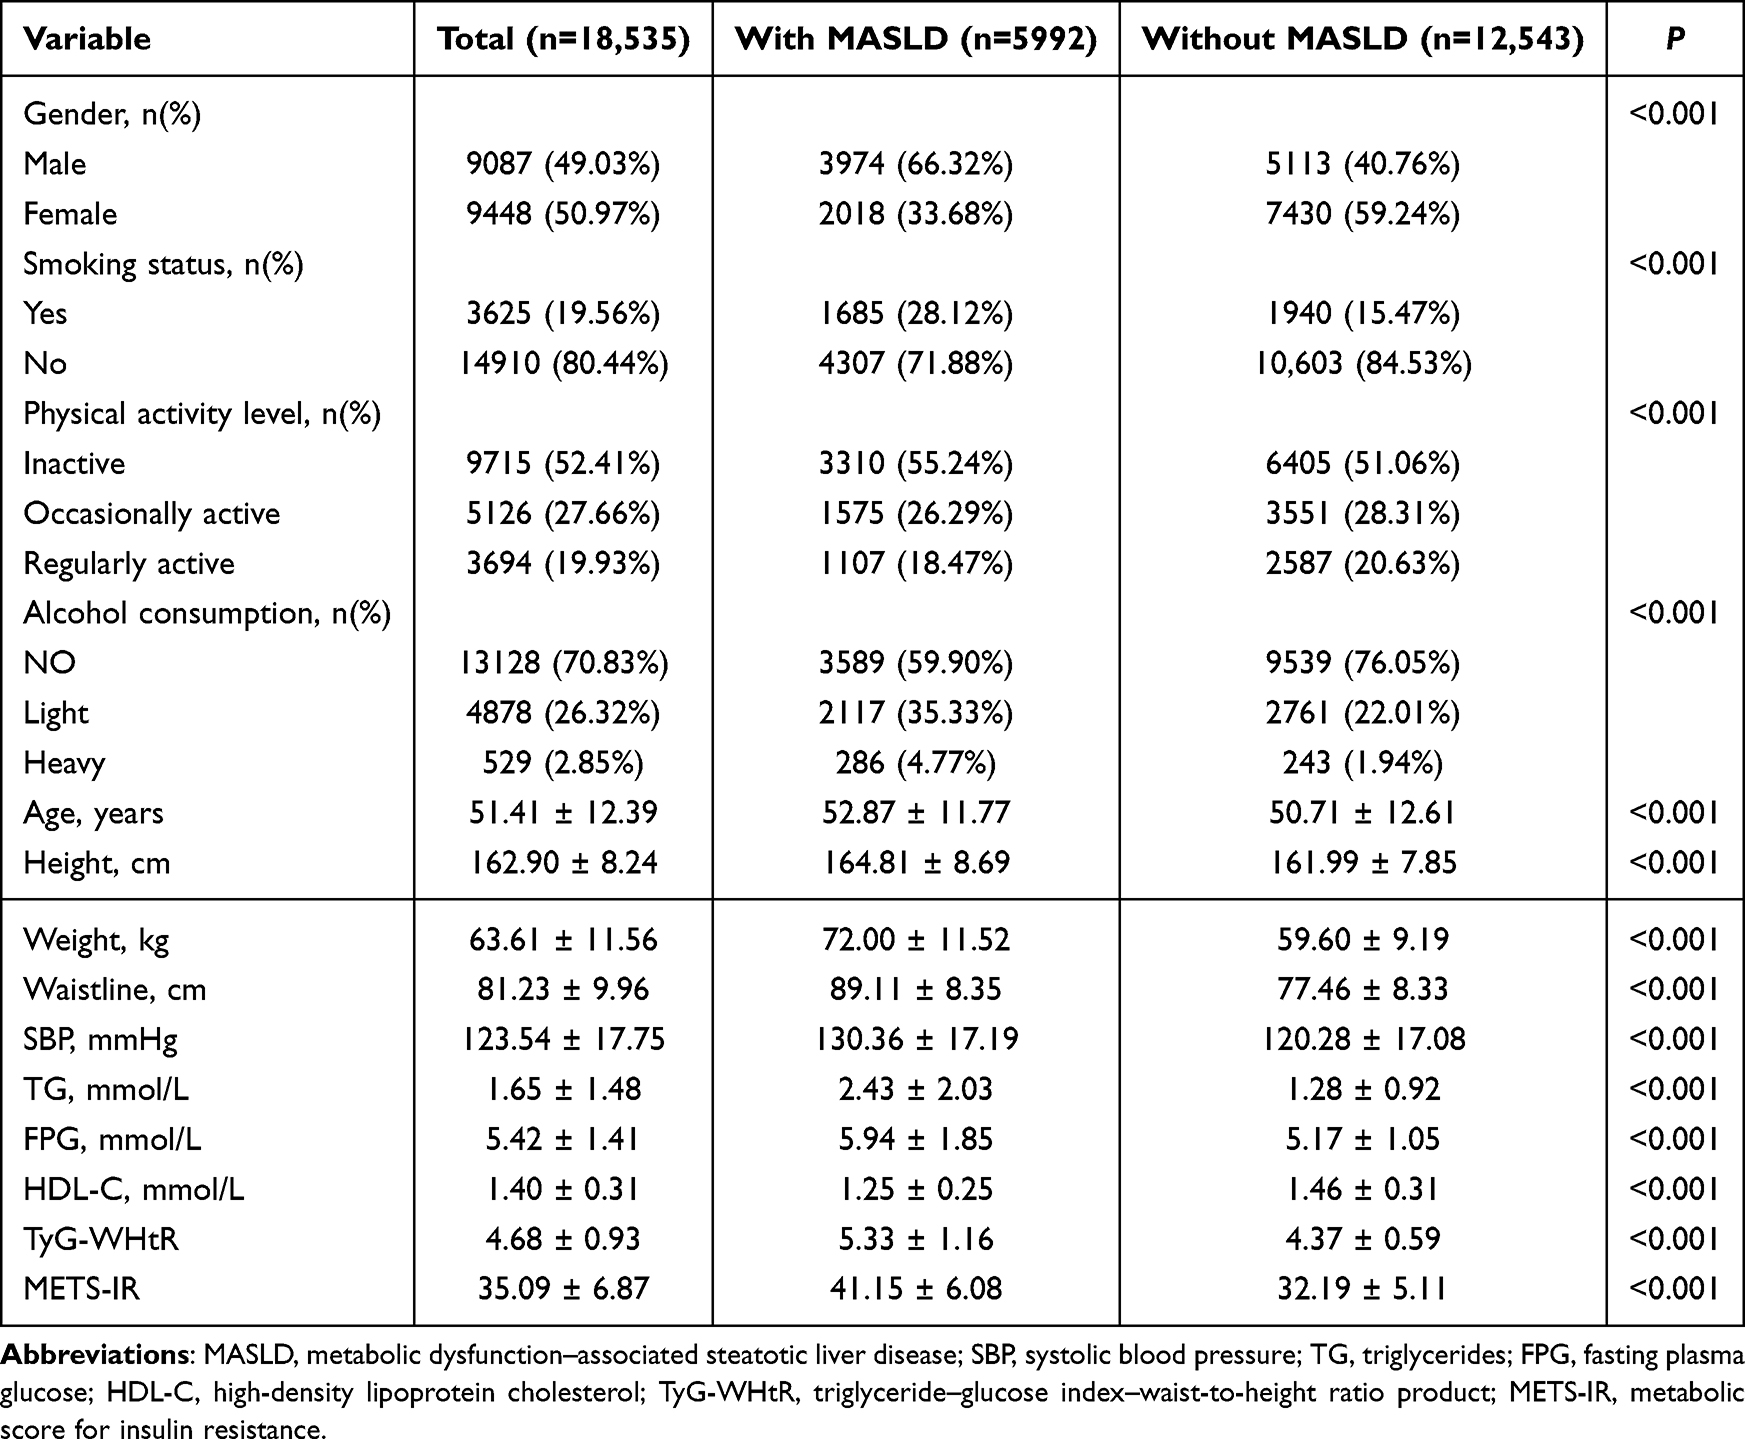 |
Table 1 Comparison of Demographic and Clinical Characteristics Between Non-MASLD and MASLD Cohorts Among All Participants |
Model Construction and Performance Evaluation
To prevent data leakage and objectively evaluate model generalizability, the original dataset was split into a training set and a validation set at a 7:3 ratio. The training set was used for model development with 10-fold cross-validation, while the validation set was reserved solely for testing the extrapolation performance.
Twelve diagnostic models were constructed by combining two feature sets (Set 1: routinely collected clinical variables; Set 2: Set 1 plus IR-related biomarkers) with six ML algorithms (ERT, XGBoost, SVM, MLP, KNN, and GNB), covering diverse ML algorithms to ensure a comprehensive performance assessment. Diagnostic performance was evaluated using sensitivity, specificity, F1-score, and AUC in both datasets (Table 2), and ROC curves are shown in Figure 2.
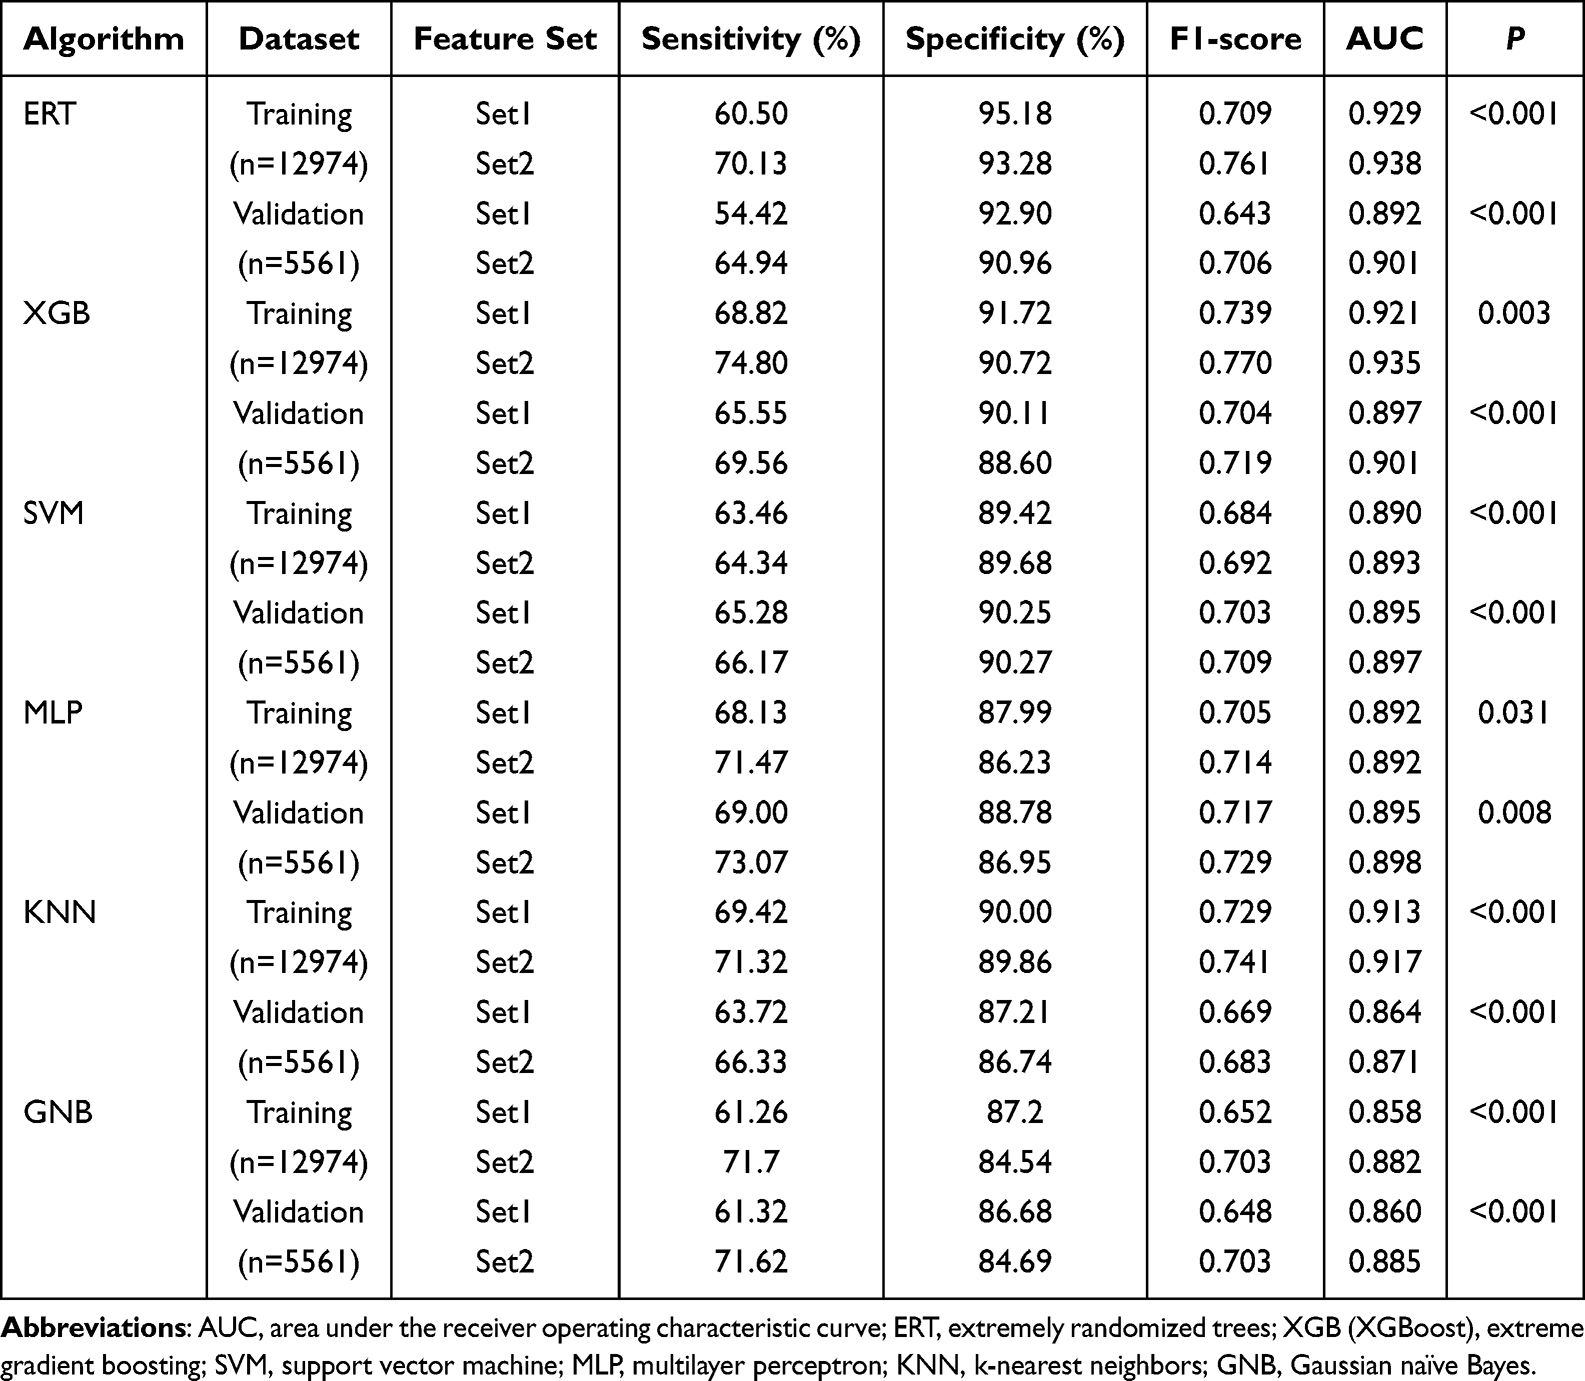 |
Table 2 Diagnostic Performance of Various Models on Training and Validation Sets |
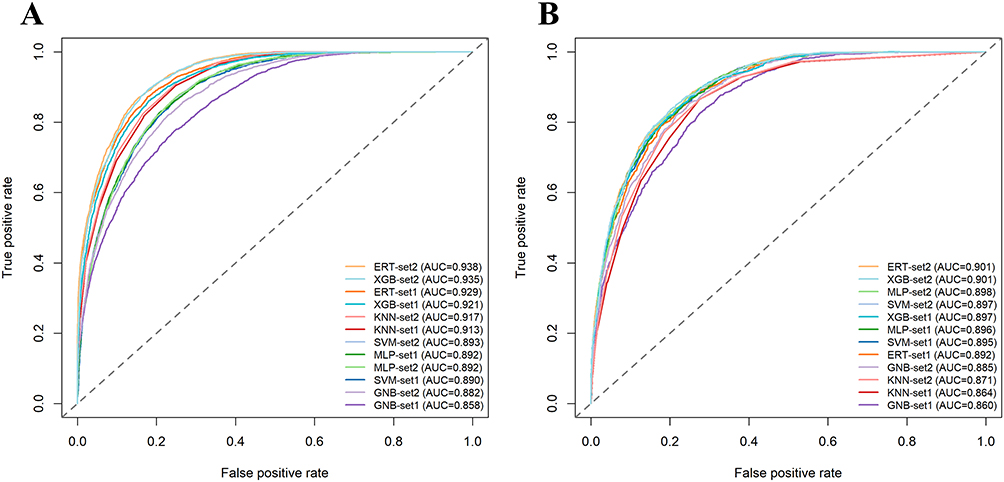 |
Figure 2 ROC curves of different ML models with Feature Set 1 and Feature Set 2 on the training set (A) and validation set (B). |
Across both the training and validation sets, all six algorithms achieved higher AUCs and F1-scores with Set 2 than with Set 1. In the training set, the best-performing Set 2 models were ERT (AUC = 0.938) and XGBoost (AUC = 0.935); in the validation set, ERT and XGBoost again yielded the highest AUCs (both AUC = 0.901). The largest incremental gain in discrimination from Set 1 to Set 2 was observed for GNB in both datasets (training: ΔAUC = 0.024; validation: ΔAUC = 0.025), followed by XGBoost and ERT in the training set (ΔAUC = 0.014 and 0.009, respectively) and by ERT and KNN in the validation set (ΔAUC = 0.009 and 0.007, respectively). DeLong’s tests confirmed that, for each algorithm, the AUC of the Set 2 model was significantly higher than that of its Set 1 counterpart (all P < 0.05) in the validation set. Overall, these results indicate that incorporating IR-related biomarkers provides a consistent incremental diagnostic benefit, improving discrimination and potentially supporting more accurate identification of individuals with MASLD in clinical practice.
Clinical Utility Analysis
To further evaluate the potential clinical utility of each model, decision curve analysis was performed in the validation set (Figure 3). Overall, models based on Set 2 provided greater net benefit than their Set 1 counterparts across a wide range of clinically relevant threshold probabilities. In particular, the ERT model using Set 2 showed the most pronounced gain in net benefit, with its curve lying above both the corresponding Set 1 model and most other algorithms across much of the threshold range. KNN and GNB with Set 2 also demonstrated higher net benefit than their Set 1 counterparts, whereas the XGBoost, SVM, and MLP models showed only minimal differences between the two feature sets. Considering all performance metrics, the ERT model demonstrated the most favorable overall performance and potential clinical applicability and was therefore considered the most suitable model in this study.
 |
Figure 3 DCA of various ML models comparing Feature Set 1 and Feature Set 2 on the validation set ((A) ERT; (B) XGBoost; (C) SVM; (D) MLP; (E) KNN; (F) GNB). The horizontal axis shows the threshold probability and the vertical axis shows the standardized net benefit. “All” and “None” denote the reference strategies of intervening in all individuals versus intervening in none, respectively. |
Model Interpretability Analysis
Interpreting ML models is essential for translating them into clinical practice. To further interpret the results of the six models, we used SHAP analysis to identify and rank the 10 most influential features for each algorithm in the validation set (Figure 4). Notably, in all models except MLP, the top-ranked predictor was an IR-related biomarker.
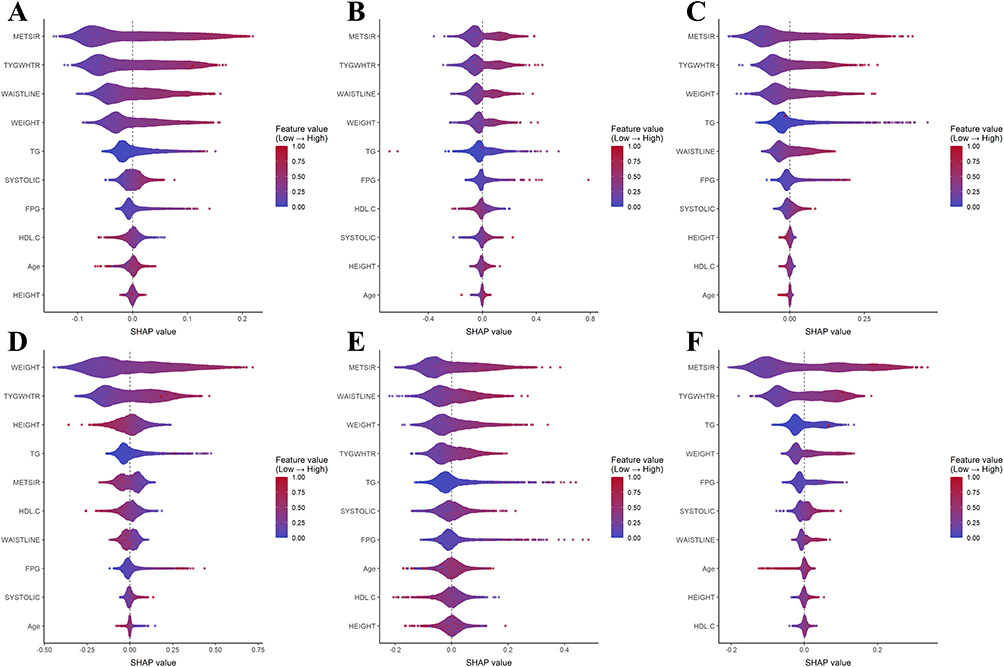 |
Figure 4 SHAP feature importance of the top 10 features for different ML models with Feature Set 2 on the validation set ((A) ERT; (B) XGBoost; (C) SVM; (D) MLP; (E) KNN; (F) GNB). Each dot represents one participant, with its position on the x-axis indicating the SHAP value: positive SHAP values shift the prediction toward MASLD, whereas negative values shift the prediction away from MASLD; the vertical reference line at 0 indicates no contribution. Dot color reflects the original feature value for that participant (red = higher; blue/purple = lower), and vertical stacking indicates the density of observations. |
To illustrate individual-level explanations, we randomly selected one MASLD-positive case and one MASLD-negative case from the validation set and generated SHAP waterfall and force plots for the ERT model. For each individual, we generated SHAP waterfall and force plots (Figure 5) to visualize the prediction process. The waterfall plot begins with the model’s baseline prediction and then adds the SHAP value of each feature in sequence, illustrating how the final predicted probability is constructed. The force plot provides an intuitive visual summary of how all features jointly influence the prediction, highlighting which variables increase or decrease the predicted MASLD risk for the selected individual.
 |
Figure 5 SHAP-based single-sample explanations for the ERT model in two randomly selected cases (A) SHAP waterfall plot for a MASLD-positive individual; (B) SHAP force plot for a MASLD-positive individual; (C) SHAP waterfall plot for a MASLD-negative individual; (D) SHAP force plot for a MASLD-negative individual). (A and C) show SHAP waterfall plots, where feature contributions are accumulated to move from a baseline prediction to the final prediction for the individual case. (B and D) show SHAP force plots summarizing the same contributions. Yellow features increase the model output and shift the prediction toward MASLD, whereas purple features decrease the model output and shift the prediction away from MASLD. |
Discussion
Using real-world health examination data, we developed twelve diagnostic models for MASLD by combining two distinct feature sets with six ML algorithms. Overall, the present study demonstrates that IR-related biomarkers are key contributors to ML-based diagnosis of MASLD and that incorporating them into ML models yields improvements in diagnostic performance without increasing testing costs or patient burden.
MASLD has become a major global health issue, with its prevalence steadily increasing worldwide.27 However, the often asymptomatic presentation of MASLD and the lack of routine screening in the general population mean that it remains substantially underdiagnosed, thereby increasing the risk of delayed intervention and adverse clinical outcomes.28,29 These gaps underscore the need for straightforward, low-cost screening tools that can be integrated into routine health check-ups.
As a core manifestation of metabolic dysfunction, insulin resistance (IR) reflects impaired insulin signaling and contributes to MASLD development and progression by promoting hepatic lipid accumulation and disrupting metabolic homeostasis, including impaired glucose uptake and reduced HDL levels.30–32 In this study, we focused on two IR-related biomarkers, TyG-WHtR and METS-IR, which combine lipid and glycemic markers with anthropometric measures (WHtR and BMI, respectively), providing a comprehensive reflection of IR and metabolic abnormalities. Both have been shown to be important predictors of MASLD in previous studies.33,34
ML is a class of techniques that automatically learn patterns from data to construct predictive models. By integrating information from multiple variables, ML can more effectively capture non-linear relationships and interactions among features, which may improve predictive performance compared with conventional diagnostic models.35 In our study, the ERT and XGBoost models achieved the highest AUC on the validation set when using Feature Set 2 (Set 2), which incorporated IR-related biomarkers (AUC = 0.901 for both models). This finding is consistent with results from other related studies.36–39 These included a prior pediatric survey, in which the AUC of METS-IR for the diagnosis of MASLD was 0.85 in the US cohort and 0.90 in the Chinese cohort.36 Another adult study used multiple IR-related indices to predict MASLD, among which the random forest (RF) model achieved the best performance, with an AUC of 0.915.37 A further cross-sectional study constructed prediction models for MASLD based on multiple variables, including IR-related biomarkers, with the best-performing model yielding an AUC of 0.90 in internal validation.38 Finally, a European population-based study developed an XGBoost-based diagnostic model for MASLD using metabolic and anthropometric indicators, achieving an AUC of 0.899.39
In the validation set, the improvement in discrimination, as measured by ΔAUC between Set 2 and Set 1, ranged from 0.002 to 0.025 across the six algorithms (ERT, 0.009; MLP, 0.003; SVM, 0.002; XGBoost, 0.004; KNN, 0.007; and GNB, 0.025). Taken together, the statistically significant AUC improvements observed across all six algorithms after adding IR-related biomarkers (all P < 0.05) indicate a modest but consistent incremental gain in discrimination. Mechanistically, IR-related composite indices summarize several correlated metabolic risk dimensions closely linked to hepatic steatosis, including dysglycemia, atherogenic dyslipidemia, and adiposity.40–42 Under realistic constraints of sample size and model complexity, this compression of multi-dimensional metabolic information may help ML models capture latent patterns of metabolic derangement, thereby improving discriminative performance.
Nevertheless, although the ΔAUC values were small, changes in AUC should not be equated directly with clinical significance. Our subsequent decision curve analysis in the validation set further supports this conclusion by demonstrating the potential clinical net benefit of incorporating IR-related biomarkers. Given that incorporating these indices does not increase testing costs or patient burden, they may be practical to integrate into screening or primary care workflows to support more accurate identification of individuals who may have MASLD.
In clinical research, enhancing model interpretability helps clinicians understand the basis of predictions, thereby promoting clinical adoption.43 To ensure a consistent interpretability approach across all models, we adopted a model-agnostic framework based on SHAP values to measure and compare the contribution of individual predictors. Additionally, for the ERT model, we generated SHAP waterfall and force plots for randomly selected MASLD-positive and MASLD-negative individuals to visualize the prediction process at the individual level. These explainability analyses highlight the substantial contribution of TyG-WHtR and METS-IR to MASLD risk estimation, improving transparency and making the models easier for clinicians and researchers to scrutinize and trust.
This study has several limitations. First, it was a single-center study, with all samples collected from a health screening center in Southwest China, which may limit the applicability of our findings to other populations. External validation using multi-center, large-scale datasets is needed to further assess generalizability. Second, this was a cross-sectional study, and all participants were drawn from individuals undergoing routine health check-ups at a single centre between 2017 and 2025. As a result, the data may be subject to temporal and selection bias, and cannot support causal inference regarding the relationship between IR-related biomarkers and MASLD. Future studies should validate and refine these models in prospective cohorts with longer follow-up and repeated assessments. Third, in this study, the diagnosis of hepatic steatosis was based on ultrasonography rather than on liver biopsy or MRI. In addition, some other potential causes of hepatic steatosis (eg, viral hepatitis and harmful alcohol intake) could not be fully excluded. Future studies should aim to incorporate more comprehensive and accurate data to develop more precise diagnostic models.
Conclusion
In conclusion, we evaluated the performance of feature sets that included IR-related biomarkers across six ML algorithms and identified the ERT model as the best approach for MASLD detection in our dataset. SHAP-based interpretability analyses further supported our findings. Our results indicate that incorporating IR-related biomarkers can improve diagnostic performance and clinical utility without increasing testing costs or patient burden. Given that the features used in the model can be obtained rapidly and at low cost, with further sensitivity optimization and external validation, this model has the potential to serve as a decision-support tool for population-based screening.
Data Sharing Statement
The datasets analyzed during this study are not publicly available due to patient privacy, but are available from the corresponding author on reasonable request.
Ethics Approval
The study was approved by the Ethics Committee of the Second Affiliated Hospital of Chongqing Medical University (No. 2023–45). Informed consent was obtained from all participants. All study procedures were conducted in accordance with applicable ethical regulations and the Declaration of Helsinki.
Author Contributions
Jingyuan Nie: Conceptualization, Data curation, Formal analysis, Writing – Original Draft, Writing – Review & Editing; Jing Zhou: Methodology, Visualization, Writing – Original Draft; Yuanjia Hu: Formal analysis, Software, Visualization, Data curation, Writing – Review & Editing; Changhong Zhang: Methodology, Validation, Writing – Review & Editing; Pingping Yu: Resources, Supervision, Data curation, Writing – Original Draft, Writing – Review & Editing; Xun Lei: Conceptualization, Funding acquisition, Supervision, Writing – Review & Editing.
All authors took part in drafting, revising or critically reviewing the article; gave final approval of the version to be published; have agreed on the journal to which the article has been submitted; and agree to be accountable for all aspects of the work.
Funding
This study was supported by the National Natural Science Foundation of China (No. 72174033).
Disclosure
The authors declare that they have no competing interests.
References
1. Targher G, Byrne CD, Tilg H. MASLD: a systemic metabolic disorder with cardiovascular and malignant complications. Gut. 2024;73(4):691–12. doi:10.1136/gutjnl-2023-330595
2. Miao L, Targher G, Byrne CD, Cao YY, Zheng MH. Current status and future trends of the global burden of MASLD. Trends Endocrinol Metab. 2024;35(8):697–707. doi:10.1016/j.tem.2024.02.007
3. Chan W-K, Chuah K-H, Rajaram RB, et al. Metabolic dysfunction-associated steatotic liver disease (MASLD): a state-of-the-art review. J Obes Metab Syndr. 2023;32(3):197. doi:10.7570/jomes23052
4. Lin Z, Zhang R, Ren S, et al. Global burden of metabolic dysfunction-associated steatotic liver disease from 1990 to 2021 and the prediction for the next 10 years. Prev Med Rep. 2025;59:103248. doi:10.1016/j.pmedr.2025.103248
5. Hagstrom H, Shang Y, Hegmar H, Nasr P. Natural history and progression of metabolic dysfunction-associated steatotic liver disease. Lancet Gastroenterol Hepatol. 2024;9(10):944–956. doi:10.1016/S2468-1253(24)00193-6
6. Celsa C, Pennisi G, Tulone A, et al. Risk of hepatic and extrahepatic outcomes associated with metabolic dysfunction-associated steatotic liver disease and metabolic dysfunction and alcohol-associated steatotic liver disease: a systematic review and meta-analysis. Lancet Gastroenterol Hepatol. 2025;10(11):998–1012. doi:10.1016/S2468-1253(25)00188-8
7. Chew NWS, Mehta A, Goh RSJ, et al. Cardiovascular-liver-metabolic health: recommendations in screening, diagnosis, and management of metabolic dysfunction-associated steatotic liver disease in cardiovascular disease via modified delphi approach. Circulation. 2025;151(1):98–119. doi:10.1161/CIRCULATIONAHA.124.070535
8. Ajmera V, Loomba R. Imaging biomarkers of NAFLD, NASH, and fibrosis. Mol Metab. 2021;50:101167. doi:10.1016/j.molmet.2021.101167
9. Graupera I, Thiele M, Serra-Burriel M, et al. Low accuracy of FIB-4 and NAFLD fibrosis scores for screening for liver fibrosis in the population. Clin Gastroenterol Hepatol. 2022;20(11):2567–76.e6. doi:10.1016/j.cgh.2021.12.034
10. McPherson S, Hardy T, Dufour J-F, et al. Age as a confounding factor for the accurate non-invasive diagnosis of advanced NAFLD fibrosis. Off J Amer Colle Gastroenterol. 2017;112(5):740–751. doi:10.1038/ajg.2016.453
11. Kotronen A, Peltonen M, Hakkarainen A, et al. Prediction of non-alcoholic fatty liver disease and liver fat using metabolic and genetic factors. Gastroenterology. 2009;137(3):865–872. doi:10.1053/j.gastro.2009.06.005
12. Eslami M, Ou F-S, Canning R, et al. Mo1673: body roundness index vs. traditional anthropometric measures: which better predicts masld and at-risk mash? Gastroenterology. 2025;169(1):S–1160. doi:10.1016/S0016-5085(25)03573-5
13. Perry RJ, Samuel VT, Petersen KF, Shulman GI. The role of hepatic lipids in hepatic insulin resistance and type 2 diabetes. Nature. 2014;510(7503):84–91. doi:10.1038/nature13478
14. Gastaldelli A, Cusi K. From NASH to diabetes and from diabetes to NASH: mechanisms and treatment options. JHEP Rep. 2019;1(4):312–328. doi:10.1016/j.jhepr.2019.07.002
15. Simental-Mendía LE, Rodríguez-Morán M, Guerrero-Romero F. The product of fasting glucose and triglycerides as surrogate for identifying insulin resistance in apparently healthy subjects. Metab Syndr Relat Disord. 2008;6(4):299–304. doi:10.1089/met.2008.0034
16. Bello-Chavolla OY, Almeda-Valdes P, Gomez-Velasco D, et al. METS-IR, a novel score to evaluate insulin sensitivity, is predictive of visceral adiposity and incident type 2 diabetes. Eur J Endocrinol. 2018;178(5):533–544. doi:10.1530/EJE-17-0883
17. Song K, Lee E, Lee HS, et al. Identification of pediatric MASLD using insulin resistance indices. JHEP Rep. 2025;7(7):101419. doi:10.1016/j.jhepr.2025.101419
18. Wang J, Yan S, Cui Y, et al. The diagnostic and prognostic value of the triglyceride-glucose index in metabolic dysfunction-associated fatty liver disease (MAFLD): a systematic review and meta-analysis. Nutrients. 2022;14(23):4969. doi:10.3390/nu14234969
19. Zhang H, Wu X, Ni W, et al. Application of machine learning and deep learning in metabolic dysfunction-associated steatotic liver disease: a systematic review and meta-analysis. J Adv Res. 2025. doi:10.1016/j.jare.2025.08.042
20. Liu H, Chen J, Qin Q, et al. Association between TyG index trajectory and new-onset lean NAFLD: a longitudinal study. Front Endocrinol. 2024;15:1321922. doi:10.3389/fendo.2024.1321922
21. Zeng Y, Yang C, Yang X, Zhang X, Xia G. Predicting the risk of metabolic-associated fatty liver disease in the elderly population in China: construction and evaluation of interpretable machine learning models. Front Med. 2025;12:1678076. doi:10.3389/fmed.2025.1678076
22. Wang -Q-Q, Zhang N, Xu X, et al. The role of triglyceride glucose-waist circumference (TyG_WC) in predicting metabolic dysfunction-associated steatotic liver disease among individuals with hyperuricemia. BMC Gastroenterol. 2025;25(1):220. doi:10.1186/s12876-025-03786-2
23. Consultation W. Waist circumference and waist-Hip ratio. Report of a WHO expert consultation geneva. World Health Organ. 2008;2008:8–11.
24. Sever P. New hypertension guidelines from the national institute for health and clinical excellence and the british hypertension society. J Renin Angiotensin Aldosterone Syst. 2006;7(2):61–63. doi:10.3317/jraas.2006.011
25. Reimers CD, Knapp G, Reimers AK. Does physical activity increase life expectancy? A review of the literature. J Aging Res. 2012;2012(1):243958. doi:10.1155/2012/243958
26. Liver EAftSot. Diabetes EAftSo. EASL-EASD-EASO clinical practice guidelines on the management of metabolic dysfunction-associated steatotic liver disease (MASLD). Obes Facts. 2024;17(4):374–444. doi:10.1159/000539371.
27. Younossi ZM, Kalligeros M, Henry L. Epidemiology of metabolic dysfunction-associated steatotic liver disease. Clin Mol Hepatol. 2024;31(Suppl):S32. doi:10.3350/cmh.2024.0431
28. Lazarus JV, Brennan PN, Mark HE, et al. A call for doubling the diagnostic rate of at-risk metabolic dysfunction-associated steatohepatitis. Lancet Reg Health Eur. 2025;54:101320. doi:10.1016/j.lanepe.2025.101320
29. Li W, Alazawi W, Loomba R. Current and emerging therapeutic landscape for metabolic dysfunction-associated steatohepatitis. Lancet Gastroenterol Hepatol. 2025;10(2):108–109. doi:10.1016/S2468-1253(25)00260-2
30. Sakurai Y, Kubota N, Yamauchi T, Kadowaki T. Role of insulin resistance in MAFLD. Int J Mol Sci. 2021;22(8):4156. doi:10.3390/ijms22084156
31. Engin A. Non-alcoholic fatty liver disease. Adv Exp Med Biol. 2017;960:443–467. doi:10.1007/978-3-319-48382-5_19
32. Bansal SK, Bansal MB. Pathogenesis of MASLD and MASH–role of insulin resistance and lipotoxicity. Aliment Pharmacol Ther. 2024; 59:S10–S22. doi:10.1111/apt.17930
33. Lee J-H, Park K, Lee HS, et al. The usefulness of metabolic score for insulin resistance for the prediction of incident non-alcoholic fatty liver disease in Korean adults. Clin Mol Hepatol. 2022;28(4):814. doi:10.3350/cmh.2022.0099
34. Peng H, Pan L, Ran S, et al. Prediction of MAFLD and NAFLD using different screening indexes: a cross-sectional study in U.S. adults. Front Endocrinol. 2023;14:1083032. doi:10.3389/fendo.2023.1083032
35. Rajkomar A, Dean J, Kohane I. Machine learning in medicine. New Engl J Med. 2019;380(14):1347–1358. doi:10.1056/NEJMra1814259
36. Zou H, Ma X, Zhang F, Xie Y. Comparison of the diagnostic performance of twelve noninvasive scores of metabolic dysfunction-associated fatty liver disease. Lipids Health Dis. 2023;22(1):145. doi:10.1186/s12944-023-01902-3
37. Chen H, Zhang J, Chen X, et al. Development and validation of machine learning models for MASLD: based on multiple potential screening indicators. Front Endocrinol. 2024;15:1449064. doi:10.3389/fendo.2024.1449064
38. Yang B, Lu H, Ran Y. Advancing non-alcoholic fatty liver disease prediction: a comprehensive machine learning approach integrating SHAP interpretability and multi-cohort validation. Front Endocrinol. 2024;15:1450317. doi:10.3389/fendo.2024.1450317
39. McTeer M, Applegate D, Mesenbrink P, et al. Machine learning approaches to enhance diagnosis and staging of patients with MASLD using routinely available clinical information. PLoS One. 2024;19(2):e0299487. doi:10.1371/journal.pone.0299487
40. Samuel VT, Shulman GI. Mechanisms for insulin resistance: common threads and missing links. Cell. 2012;148(5):852–871. doi:10.1016/j.cell.2012.02.017
41. Ramírez-Manent JI, Martínez-Almoyna E, López C, et al. Relationship between insulin resistance risk scales and non-alcoholic fatty liver disease and liver fibrosis scales in 219,477 Spanish workers. Metabolites. 2022;12(11):1093. doi:10.3390/metabo12111093
42. Xie J, Pei X, Zhu S, et al. Association of triglyceride-glucose-related indices with adverse clinical outcomes in individuals with normal body mass index. Front Cardiovasc Med. 2025;12:1570239. doi:10.3389/fcvm.2025.1570239
43. Tonekaboni S, Joshi S, McCradden MD, Goldenberg A. editors. What clinicians want: contextualizing explainable machine learning for clinical end use.
 © 2026 The Author(s). This work is published and licensed by Dove Medical Press Limited. The
full terms of this license are available at https://www.dovepress.com/terms
and incorporate the Creative Commons Attribution
- Non Commercial (unported, 4.0) License.
By accessing the work you hereby accept the Terms. Non-commercial uses of the work are permitted
without any further permission from Dove Medical Press Limited, provided the work is properly
attributed. For permission for commercial use of this work, please see paragraphs 4.2 and 5 of our Terms.
© 2026 The Author(s). This work is published and licensed by Dove Medical Press Limited. The
full terms of this license are available at https://www.dovepress.com/terms
and incorporate the Creative Commons Attribution
- Non Commercial (unported, 4.0) License.
By accessing the work you hereby accept the Terms. Non-commercial uses of the work are permitted
without any further permission from Dove Medical Press Limited, provided the work is properly
attributed. For permission for commercial use of this work, please see paragraphs 4.2 and 5 of our Terms.
Recommended articles
Simple Method to Predict Insulin Resistance in Children Aged 6–12 Years by Using Machine Learning
Zhang Q, Wan NJ
Diabetes, Metabolic Syndrome and Obesity 2022, 15:2963-2975
Published Date: 27 September 2022
Cuproptosis-Related Biomarkers and Characterization of Immune Infiltration in Sepsis
Wang Y, Qiu X, Liu J, Liu X, Pan J, Cai J, Liu X, Qu S
Journal of Inflammation Research 2024, 17:2459-2478
Published Date: 22 April 2024
Identification of Mitophagy-Associated Genes for the Prediction of Metabolic Dysfunction-Associated Steatohepatitis Based on Interpretable Machine Learning Models
Deng B, Chen Y, He P, Liu Y, Li Y, Cai Y, Dong W
Journal of Inflammation Research 2024, 17:2711-2730
Published Date: 3 May 2024
Identification of Senescence-Related Genes for the Prediction of Ulcerative Colitis Based on Interpretable Machine Learning Models
Ma J, Chen C, Wang N, Fang T, Liu Y, He P, Dong W
Journal of Inflammation Research 2025, 18:3431-3447
Published Date: 10 March 2025
Identification of Disulfidptosis-Related Genes and Molecular Subgroups in Rheumatoid Arthritis for Diagnostic Model and Patient Stratification
Liu X, Wang S, Du X, Wang Y, Mo L, Li H, Qu Z, Wang X, Sun J, Li Y, Wang J
Journal of Inflammation Research 2025, 18:4157-4175
Published Date: 19 March 2025