Back to Journals » OncoTargets and Therapy » Volume 14
ILT4 in Colorectal Cancer Cells Induces Suppressive T Cell Contexture and Disease Progression
Authors Yang Z, Gao A, Shi W, Wang J, Zhang X, Xu Z, Xu T, Zheng Y, Sun Y ![]() , Yang F
, Yang F
Received 9 November 2020
Accepted for publication 16 June 2021
Published 20 July 2021 Volume 2021:14 Pages 4239—4254
DOI https://doi.org/10.2147/OTT.S290348
Checked for plagiarism Yes
Review by Single anonymous peer review
Peer reviewer comments 3
Editor who approved publication: Dr Sanjeev K. Srivastava
Zijiang Yang,1,* Aiqin Gao,2,* Wenjing Shi,1 Jingnan Wang,1 Xianchao Zhang,3 Zhengyan Xu,3 Tingting Xu,3 Yan Zheng,4 Yuping Sun,5 Fei Yang3
1Department of Oncology, Jinan Central Hospital, Cheeloo College of Medicine, Shandong University, Jinan, Shandong, 250013, People’s Republic of China; 2Department of Thoracic Radiation Oncology, Shandong Cancer Hospital and Institute, Jinan, Shandong, 250117, People’s Republic of China; 3Department of Pathology, Jinan Central Hospital, Cheeloo College of Medicine, Shandong University, Jinan, Shandong, 250013, People’s Republic of China; 4Research Center of Translational Medicine, Jinan Central Hospital Affiliated to Shandong First Medical University, Jinan, Shandong, 250013, People’s Republic of China; 5Proton Center, Shandong Cancer Hospital and Institute, Jinan, Shandong, 250117, People’s Republic of China
*These authors contributed equally to this work
Correspondence: Fei Yang
Department of Pathology, Jinan Central Hospital, Cheeloo College of Medicine, Shandong University, Jinan, Shandong, 250013, People’s Republic of China
Tel +86 13370586609
Email [email protected]
Purpose: Immune checkpoint blockade (ICB) therapy shows little or no clinical benefit in most colorectal cancer (CRC) patients, due to the immunosuppressive T cell contexture in the tumor microenvironment (TME). Immunoglobulin-like transcript (ILT) 4 is an immunosuppressive molecule in myeloid cells. ILT4 is enriched in solid tumor cells, facilitating their proliferation, invasion, and metastasis. However, the regulatory role of ILT4 in T cell immunity of CRC is still undetermined. Here, we aimed to explore how tumor cell-derived ILT4 orchestrates T cell infiltration, subset distribution, and function in CRC.
Methods: A total of 145 paraffin-embedded cancer tissues and the corresponding clinicopathological information were collected from CRC patients. Immunohistochemical (IHC) staining and public database analyses determined the correlation of ILT4 expression with different T cell subset densities, IFN-γ levels, and patient outcomes. Paired Ig-like receptor B (PIR-B, ILT4 mouse ortholog)-overexpressing/-downregulated MC38 cells were subcutaneously injected into C57BL/6 mice as a CRC transplantation model. The frequencies, subsets, and IFN-γ levels of T cells in mouse blood and spleens were determined using flow cytometry and immunohistochemistry, respectively.
Results: High ILT4 expression in CRC cells was associated with decreased T cell infiltration, disease progression, and poor patient survival. T cell subset analyses indicated that ILT4-high patients showed reduced CD8+ T cell but elevated FOXP3+ regulatory T (Treg) cell frequencies in the TME. High ILT4 levels predicted lower IFN-γ production by tumor-infiltrating lymphocytes (TILs), especially by CD8+T cells in human CRC tissues. Moreover, PIR-B overexpression accelerated MC38 growth in mice, decreased CD3+/CD8+/IFN-γ+ T cell densities, and elevated Treg infiltration in the TME, blood, and spleens. PIR-B knockdown had the opposite effects.
Conclusion: ILT4 in CRC cells induced immunosuppressive T cell subset infiltration and impaired IFN-γ production in TILs, suggesting that ILT4 might be a potential immunotherapeutic target and prognostic biomarker.
Keywords: immunoglobulin-like transcript 4, colorectal cancer, T cell subsets, IFN-γ, immunosuppression
Introduction
Colorectal cancer (CRC) is the fourth most frequent and the second most deadly cancer worldwide, with an estimated 1.8 million new cases and 0.86 million deaths in 2018.1 Its incidence is still increasing and is predicted to reach 2.5 million cases in 2035.2 More than 60% of CRC patients are diagnosed at the stages of regional or distant metastasis, which are often incurable despite dramatic progress in comprehensive surgery, radiotherapy, and systemic treatment.3,4 Immune checkpoint blockade (ICB), which targets the immunosuppressive PD-1/PD-L1/CTLA-4 pathway to resurrect T cell-mediated cancer killing, is the latest revolution in cancer therapy. Due to its durable response observed in multiple tumors, ICB is considered to be a potential curative strategy for malignancies.5 However, only 4–5% of advanced CRC patients who have deficient mismatch repair (dMMR) or high microsatellite instability (MSI-H) may benefit from ICB.6 The majority of CRCs are mismatch-repair-proficient (pMMR) or have low levels of microsatellite instability (MSI-L), and are intrinsically resistant to ICB treatment. According to previous studies, several mechanisms are responsible for the immune tolerance of pMMR or MSI-L tumors to ICB therapy: (i) low tumor mutations and neoantigens prevent the recognition of tumor cells by T cells, (ii) insufficient T cell infiltration into the tumor core decreases ICB targets, and (iii) an immunosuppressive tumor microenvironment (TME) created by inhibitory immunocytes, cytokines, and metabolites restricts the killing ability of T cells.7,8 Therefore, the identification of alternative and novel immunotargets to increase T cell infiltration and switch the immunosuppressive contexture is essential to improve the efficacy of ICB in CRC patients.
Immunoglobulin-like transcript (ILT) 4, also known as lymphocyte immunoglobulin-like receptor B (LILRB) 2, monocyte/macrophage immunoglobulin-like receptor 10 (MIR-10), or CD85d, is an immunosuppressive receptor with a classic type I transmembrane protein structure.9 It is mainly expressed in myeloid cells, including dendritic cells (DCs), neutrophils, macrophages, myeloid-derived suppressor cells (MDSCs), and platelets.9,10 Furthermore, ILT4 expression can be induced in activated T cells.11 By engaging with its ligands HLA-G, CD1d, semaphorin-4A, or angiopoietin-like proteins, ILT4 inhibits the maturation and antigen presentation of DCs, decreases phagocytosis of neutrophils, polarizes M2-like phenotype of macrophages and MDSCs, drives Th2 differentiation of activated CD4+ T cells, and prevents platelet aggregation.11–13 In addition to immune cells, tumor cells also show abundant ILT4 expression. In 2008, our group reported for the first time that ILT4 was enriched in solid tumor cells and that it indicated an advanced disease in non-small cell lung cancer.14 Afterward, we and others identified that ILT4 was highly expressed in multiple solid tumor cells and promoted cell biological functions such as proliferation, invasion, and metastasis.12,15,16 These studies highlighted the role of ILT4 as a tumor driver in various malignancies, including CRC. More recently, we found that tumor-derived ILT4 induced infiltration and M2-like polarization of tumor-associated macrophages (TAMs), and led to T cell senescence and dysfunction, mediating immune escape in lung cancers. However, whether ILT4 modulates T cell infiltration and function in CRC is still undetermined.
Here, we report that the overexpression of ILT4 in CRC cells directs immunosuppressive T cell infiltration in the TME and predicts disease progression. Further subset analysis revealed that ILT4 decreased the infiltration of CD3+, CD8+, and IFN-γ+ T cells but elevated that of FOXP3+ (a lineage-specific marker for Treg) regulatory T (Treg) cells in the TME. Our results indicate that ILT4 in CRC cells modulate immunosuppressive T cell subset infiltration and tumor immune escape, and provide a novel immunotarget to reverse the inhibitory immune contexture and enhance ICB efficacy in CRC patients.
Materials and Methods
Patients and Tissue Samples
On the approval of the review board and the ethics committee, 145 pathologically confirmed cancer tissues were collected from CRC patients admitted to Jinan Central Hospital between May 2013 and November 2015, and corresponding adjacent normal tissues for each patient were collected simultaneously. All the patients received primary surgery without preoperative chemotherapy, radiotherapy, or targeted therapy. The demographic and clinicopathological characteristics of patients are shown in Table S1.
Immunohistochemical Analysis
ILT4 expression and T cell subset infiltrates in paraffin-embedded human CRC cancer and in normal tissues were determined using immunohistochemical staining, as described previously.17 Primary antibodies against the following were used: ILT4 (1:50, Origene, Cat# TA323297), PIR-B (1:100, Immunoway, Cat# YN1914), CD3 (ready-to-use, Fuzhou Maixin, Cat# Kit-0003; 1:100, CST, Cat# 85061), CD4 (ready-to-use, Fuzhou Maixin, Cat# RMA-0620; 1:800, Abcam, Cat# ab183685), CD8 (ready-to-use, Fuzhou Maixin, Cat# MAB-0021; 1:500, Abcam, Cat# ab217344), FOXP3 (1:200, Abcam, Cat# ab215206), and IFN-γ (1:400, Abcam, Cat# ab231036; 1:50, Affinity, Cat# DF6045). Sections incubated with mouse or rabbit anti-IgG antibody were used as negative controls. Primary antibodies were detected by the general-purpose SP method, using the mouse/rabbit Streptomyces Obobicin Detection System (ZhongShan JinQiao Biotechnology Co., Cat# SP-9000).
For each slide, at least five fields were randomly selected and evaluated by two independent investigators at 400× magnification. The results were determined based on both the staining intensity and the percentage of positive cells. The staining intensity was defined as follows: 0 = none; 1 = weak; 2 = intermediate; 3 = strong. The percentage of positive cells was scored as follows: 0 (≤5%), 1 (6–25%), 2 (26–50%), 3 (51–75%) and 4 (≥76%). The final scores for the slides were determined by the product of the two scores. A final score of <6 was defined as low expression, and the rest of the slides were marked as high expression. Different T cell subgroups were determined by the frequencies of CD3+/CD4+/CD8+/FOXP3+ T cells in total lymphocytes. High and low T cell subsets were divided based on the median.
Tumor Cell Line and PIR-B Overexpression/Knockdown
Mice CRC cell line MC38 was purchased from the Cell Resource Center of the Chinese Academy of Sciences (Beijing, China). The cell line was cultured in RPMI-1640 supplemented with 10% fetal bovine serum and 1% penicillin streptomycin.
Lentiviruses for PIR-B overexpression or knockdown were purchased from Genechem Inc. MC38 cells were seeded in 6-well plates at an initial density of 1×10⁵ cells/mL/well one day before transfection, and then one milliliter of fresh medium containing lentivirus (MOI: 5–10) was added to each well. At 72 h after lentivirus transfection, MC38 cells were selected with 2 μg/mL puromycin for five days to obtain PIR-B-overexpressing/knockdown MC38 cells.
Western Blot Analysis
PIR-B-overexpressing/knockdown MC38 cells were collected and lysed with RIPA buffer containing protease inhibitor. The protein concentration of the cell lysate was determined using a BCA protein assay kit (P0010S, Biyuntian, China). A total of 20 μg protein was resolved by a 10% SDS polyacrylamide gel, and then was transferred to a PVDF membrane. The PVDF membrane was blocked with 5% skim milk for one hour at room temperature, and then was incubated overnight with anti-PIR-B antibody (1:1000; Immunoway; Cat# YN1914) or anti-GAPDH antibody (1:10,000; Wuhan Sanying Biotechnology; Cat# 10494-1-AP) at 4 °C. Subsequently, the membranes were washed three times and incubated with horseradish peroxidase-conjugated secondary goat anti-rabbit antibodies (1:10,000; Wuhan Sanying Biotechnology; Cat# SA00001-2) for 2 h at room temperature. Protein bands were visualized with enhanced chemiluminescence (ECL) detection reagents (CWBIO, Beijing, China) using an ECL assay. The relative protein levels were analyzed using Image J software (National Institutes of Health, Bethesda, MD, USA).
RNA Extraction and Real-Time Polymerase Chain Reaction
PIR-B-overexpressing/knockdown MC38 cells were collected and total RNA was extracted using an RNAfast200 RNA extraction kit (Fastagen, Shanghai, China) according to the manufacturer’s instructions. cDNA synthesis was performed using 2 μg of total RNA using the HiScript III RT SuperMix for quantitative polymerase chain reaction (PCR; Vazyme; Cat# R323-01). Relative PIR-B mRNA expression level was analyzed according to the comparative Ct method and normalized to that of GAPDH. All experiments were performed in triplicate. The specific primers for PIR-B were as follows: forward, ACCCAGGAAGAAAGCCTATATG; reverse, GTTCAGTTGTTCCCTTGACATG.
In vivo Studies
Female C57BL/6 mice (6–8 weeks old) were purchased from the Beijing Viewsolid Biotech Company (Beijing, China) and raised in specific pathogen-free conditions. To determine the effect of the PIR-B on tumor growth and immune infiltration, the mice were randomly divided into two groups and injected subcutaneously with MC38 cells (1×10⁷ cells/mouse, n=6 mice/group) that had been infected with control lentivirus or PIR-B overexpression/knockdown lentivirus. Tumor sizes were measured every two or three days and tumor volumes were calculated as 0.5 × length × width2.
When tumors grew to the size limit (length of 20 mm), all mice were euthanized, and the tumors were separated, photographed, and weighed. Peripheral blood and splenocytes were isolated to determine different T cell subset frequencies using flow cytometric analysis. Immunohistochemical analyses were performed on sections of paraffin-embedded tumor tissues. All animal experimental protocols were reviewed and approved by the Animal Care Committee of the Cheeloo College of Medicine, and conducted in accordance with the NIH animal use guidelines and current Chinese regulations and standards for laboratory animal use.
Flow Cytometric Analysis
The surface and intracellular markers of mouse T cells were stained with different fluorescent-conjugated antibodies. For the intracellular staining of IFN-γ, erythrocyte-excluded blood and spleen cells were first incubated with Cell Stimulation Cocktail plus protein transport inhibitors (eBioscience; Cat# 4975–03) at 37 °C under 5% CO2 for 5 h. The following mouse antibodies were used: FITC-anti-CD3 (Cat# 100204), Percp5.5-anti-CD4 (Cat# 100434), APC-anti-CD8 (Cat# 100712), PE-anti-CD45 (Cat# 147712), PE-anti-FOXP3 (Cat# 320008), and PE-anti-IFN-γ (Cat# 505808). All the antibodies were purchased from Biolegend. The stained cells were analyzed on a FACS Calibur flow cytometer (BD Bioscience) and data were analyzed using FlowJo 10 software (Tree Star, Inc., Ashland, OR, USA).
Analysis of the Correlation Between ILT4 Expression and Patient Survival/Treg Infiltration Using Public Datasets
Gene expression profiles of patients were downloaded from a GEO dataset (GSE33113). Gene annotation of GSE33113 was based on the microarray platform GPL570 and 89 colon cancer samples were used in progression-free survival (PFS) analysis.
The correlation between ILT4 expression and FOXP3 and IFN-γ levels in The Cancer Genome Atlas (TCGA) database was determined using the online tool GEPIA (http://gepia.cancer-pku.cn/). The Spearman correlation coefficient was calculated to evaluate the relevance in both colon adenocarcinoma and rectum adenocarcinoma datasets.
TCGA cohort was used to analyze the correlation between ILT4 levels and Treg infiltration. RNASeq pan-cancer data were downloaded from UCSC xena (https://xenabrowser.net/datapages/). In total, 458 samples were enrolled in this cohort. The Treg infiltration value was calculated using the quanTIseq method, which estimates cell fractions from total cells.18 The Spearman correlation coefficient was calculated to evaluate the relation between ILT4 expression and Treg frequency.
Survival Follow-Up and Statistical Analysis
The survival duration data was obtained by telephonic follow-up of all the patients. The date of last follow-up was August 20, 2020. Statistical analysis was performed using GraphPad Prism 8.0 software (GraphPad Software Inc., USA). The association of ILT4 expression with clinicopathological features was analyzed using Fisher’s exact test, and the differences between the two groups were assessed by unpaired Student’s t-test. Kaplan-Meier and Log rank tests were used to plot the survival curves. Statistical significance was set at P<0.05.
Results
Increased ILT4 Expression in CRC Cells Predicted Disease Progression
We collected 145 pairs of paraffin-embedded tumor tissues and adjacent normal tissues from CRC patients and determined ILT4 expression. Tumor cells in CRC tissues showed markedly higher ILT4 levels than did normal epithelial cells (Figure 1A and B). ILT4 expression was mainly observed on the membrane and in the cytoplasm of CRC cells (Figure 1A), consistent with its structure as a transmembrane protein. To delineate the clinical significance of ILT4 expression, we analyzed the correlation between ILT4 levels and different clinicopathological features. We found that patients with high ILT4 levels (ILT4-high) showed more frequent lymph node involvement and perineural invasion, as well as more advanced tumor stage, than the patients with low ILT4 expression (ILT4-low) (Figure 1C). Next, we analyzed the relation between ILT4 expression and patient overall survival (OS). As indicated in Figure 1D, patients with high ILT4 expression showed a significantly shorter OS. Using survival information from the GSE33113 dataset, we analyzed the correlation of ILT4 expression with patient PFS. The results showed that high ILT4 expression was associated with unfavorable PFS (Figure 1E). Collectively, these results suggested that ILT4 expression was increased in CRC cells, indicating disease progression and poor patient survival.
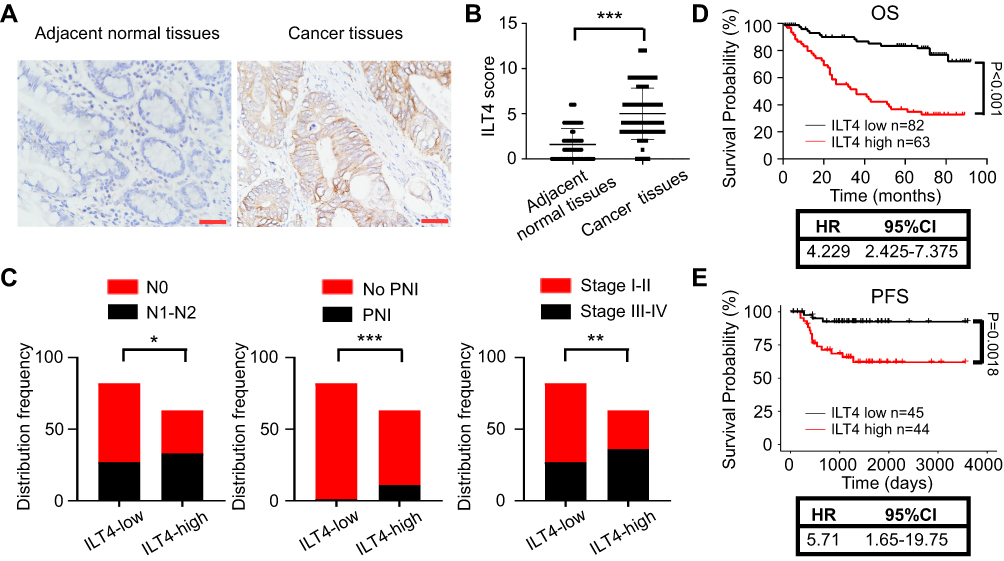 |
Figure 1 Increased ILT4 expression in CRC cells predicted disease progression. (A and B). ILT4 expression was increased in the tumor cells of CRC tissues relative to epithelial cells in the adjacent normal tissues. (A) Representative images of ILT4 expression in CRC tissues. Brown granules were defined as positive staining. ILT4 was mainly located in the cell membrane and cytoplasm. (B) The summarized results from 145 patients. Scale bar: 50 μm. (C) Patients with high ILT4 expression in CRC cells showed increased frequencies of lymph node involvement, perineural invasion, and advanced tumor stage than those with low ILT4 levels. The cutoff scores for high and low ILT4 expression were ≥ 6 and < 6, respectively. (D) Compared with patients in the ILT4-low group, those in the ILT4-high group showed markedly poor OS. (E) Compared with patients in the ILT4-low group, patients in the ILT4-high group displayed markedly poor PFS. A total of 89 patients from the GSE33113 dataset were included for PFS analysis. The cut-off value for high and low ILT4 expression was the median *p<0.05; **p<0.01; ***p<0.001. Abbreviations: HR, hazard ratio; PFS, progression-free survival; PNI, perineural invasion; OS, overall survival. |
ILT4 in CRC Cells Was Negatively Correlated with T Cell Infiltration in the TME
As a canonical suppressive receptor, ILT4 in myeloid cells negatively regulates the immune responses of DCs, TAMs, MDSCs, and neutrophils.12,13 However, the regulatory role of tumor cell-derived ILT4 in the immunosuppressive CRC microenvironment is still undetermined. Given the central role of T cells in anti-tumor immunity,19 we focused on ILT4-regulated T cell infiltration. CD3+ T cell densities in ILT4-high tissues were markedly lower than those in ILT4-low tissues (Figure 2A and B). To address the impact of T cell infiltration in the TME, we analyzed the relation between CD3+ T cell density and clinicopathological features and OS. We found that patients with high T cell infiltration in the TME showed a higher grade of cell differentiation (Figure 2C) and had superior OS (Figure 2D). Since the location of immune cells affects the outcome of CRC patients,20 we next determined the T cell densities in both the tumor centers and invasive margins. We found that high ILT4 expression was associated with decreased T cell frequency in both locations (Figure 2E). Taken together, these results showed that the high expression of ILT4 in CRC cells predicted reduced T cell infiltration in the TME, which impaired patient survival.
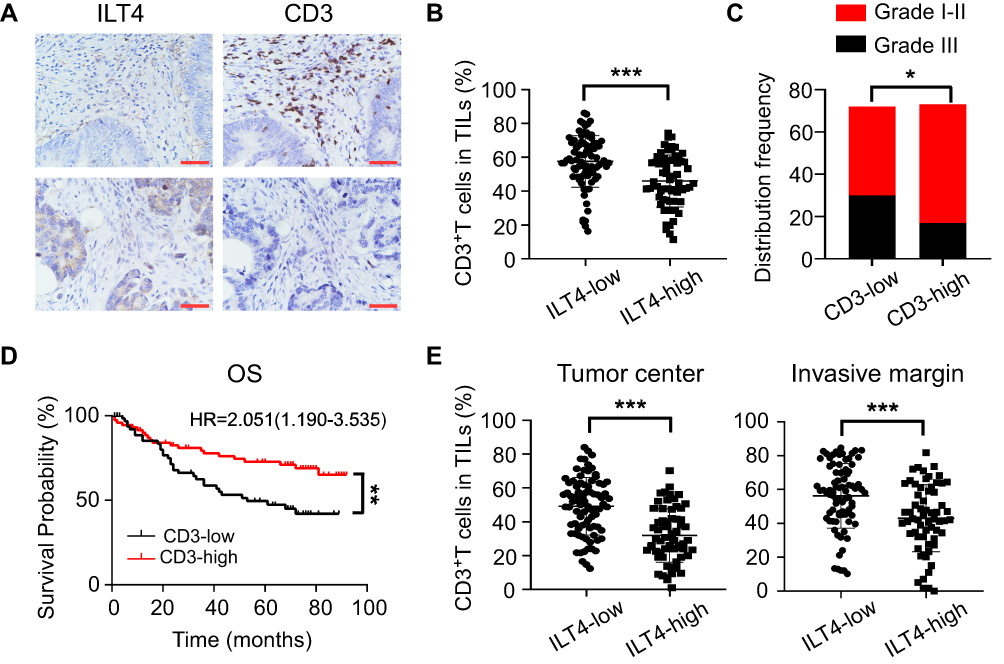 |
Figure 2 ILT4 levels in CRC cells were negatively correlated with T cell infiltration in the TME. (A and B) ILT4 expression was negatively correlated with the density of CD3+ T cells in the TME by IHC analysis. (A) Representative images of ILT4 expression and CD3+ T cell infiltration. Each paraffin-embedded tissue was sequentially sectioned for ILT4 or CD3 staining. (B) Statistical analysis of 145 patients. Scale bar: 50μm. (C). Patients with high CD3+ T cell infiltration had higher frequencies of high-grade cell differentiation than the CD3-low patients. A frequency of ≥median was considered CD3 high, otherwise CD3 low. (D) Patients with a high frequency of CD3+ T cell infiltration displayed favorable OS with respect to the CD3-low patients. (E) High ILT4 level was associated with decreased CD3+ T density in the tumor center and invasion margin of CRC tissues. The cutoff value for high and low ILT4 expression was the same as in Figure 1C. *p<0.05; **p<0.01; ***p<0.001. Abbreviations: HR, hazard ratio; OS, overall survival. |
Enriched ILT4 in CRC Cells Was Correlated with Decreased CD8+ T Cell and Increased Treg Cell Infiltration
Next, we wanted to assess the ILT4-directed T cell subset compositions and distributions. We detected the densities and spatial distributions of CD4+ T cells, CD8+ T cells, and FOXP3+ Treg cells, which play dominant roles in anti-tumor immunity,21 in patients with high and low ILT4 levels. Surprisingly, no difference was found in the CD4+ T cell frequencies between ILT4-high and -low groups (Figure 3A). This finding was further confirmed in the cancer centers and invasive margins of CRC tissues (Figure 3B). Notably, we observed significantly decreased CD8+ T cell and increased FOXP3+ Treg frequencies in the TMEs of ILT4-high patients, compared with their ILT4-low counterparts (Figures 3C–E). We also analyzed the correlation of ILT4 levels with FOXP3 expression and Treg abundance using TCGA database. As shown in Figures 3F and G, high ILT4 levels in CRC tissues were positively correlated with both FOXP3 levels and Treg accumulation. Next, we explored the spatial arrangement of CD8+ T cells and Treg cells by detecting their frequencies in the tumor centers and the invasive margins of CRC tissues. As expected, in both tumor centers and invasive margins, CD8+ T cell frequencies in the ILT4-high group were lower than those in the ILT4-low group (Figure 3H). However, the tumor centers but not the invasive margins of ILT4-high patients displayed markedly higher Treg densities than those of the ILT4-low group (Figure 3I). Altogether, our results suggested that high ILT4 expression in CRC cells was correlated with decreased CD8+ T cell but increased Treg cell infiltration, suggesting the functional role of ILT4 as a modulator of T cell immunity in CRC.
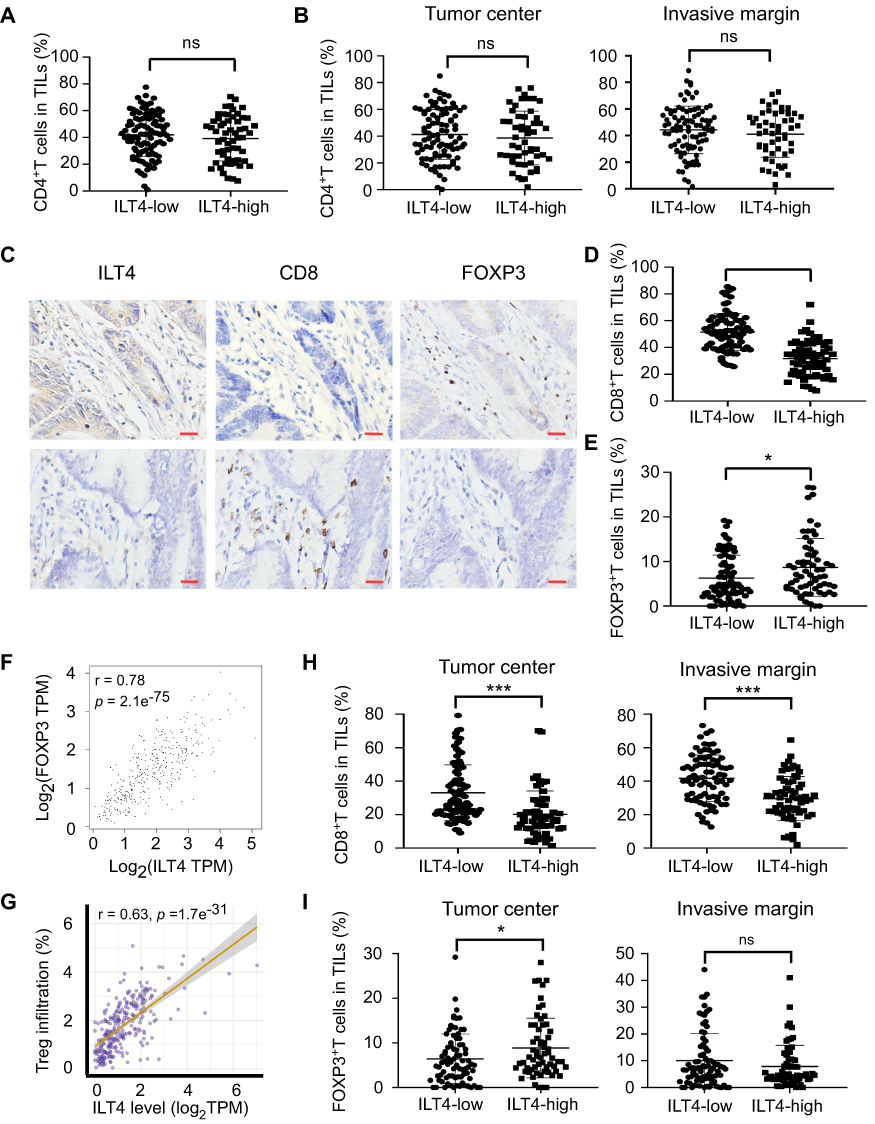 |
Figure 3 Enrichment of ILT4 in CRC cells was correlated with decreased CD8+ T cell but increased Treg cell infiltration. (A and B) ILT4 expression in CRC cells was not associated with CD4+ T cell density by IHC analysis. (A) Density of CD4+ T cell infiltrates, based on ILT4 expression in the overall tumor. (B) CD4+ T cell density in the tumor center and invasive margin of ILT4-low and ILT4-high patients. (C–E) High ILT4 expression in CRC cells was correlated with decreased CD8+ T cell but increased FOXP3+ Treg cell density by IHC analysis. (C) Representative images for ILT4 expression and CD8+ T/Treg cell infiltration. (D and E) Summarized results of CD8+ T cell and Treg cell frequencies from 145 patients based on ILT4 level. (F) ILT4 expression was positively associated with FOXP3 level (r = 0.78) in TCGA database. The online tool GEPIA was used to analyze the correlation between ILT4 and FOXP3 levels. (G) ILT4 level in CRC tissues was positively correlated with the fraction of tumor-infiltrating Treg cells (r = 0.63). TCGA database, containing 458 colon adenocarcinoma patients, was used for this analysis. (H) High ILT4 expression was correlated with declined CD8+ T cell densities in the tumor centers and invasive margins of CRC tissues by IHC assay. The cutoff score for high and low ILT4 levels was the same as in Figure 1C. (I) ILT4 expression was positively correlated with Treg cell density in the tumor center but not the invasive margin of CRC tissues. The cutoff scores for high and low ILT4 levels were the same as in Figure 1C. *p<0.05; ***p<0.001. Abbreviation: ns, not significant. |
ILT4-Directed Suppressive T Cell Subsets Predicted Poor Clinical Outcomes
We showed that increased expression of ILT4 in CRC cells was correlated with decreased CD8+ T cell and increased Treg cell infiltration. However, the significance of immunosuppressive T cell infiltration in CRC tissues was still unclear. We first explored the correlation of CD8+ T cell density with clinicopathological features and patient OS. Compared to patients with low CD8+ T cell infiltration, those with high CD8+ T cell density showed a prolonged OS (Figure 4A). In contrast, high Treg density in the TME was correlated with advanced lymph node metastasis and tumor stage (Figure 4B), as well as poor patient OS (Figure 4C). Next, we analyzed patient survival based on ILT4 expression and CD8+ T/Treg cell infiltration. We found that patients with high ILT4 levels and low CD8+ T cell densities showed more frequent lymph node involvement, perineural invasion, and advanced tumor stage compared to those with low ILT4 expression and high CD8+ T cell densities (Figure 4D). Unsurprisingly, high ILT4 level, combined with low CD8+ T cell infiltration, predicted poor patient OS (HR=4.78, Figure 4E) more strongly than did any individual marker (HR=4.23 for ILT4 and HR=2.80 for CD8). Similarly, synchronously elevated ILT4 and Treg levels in CRC tissues were positively correlated with lymph node metastasis, perineural invasion, advanced tumor stage (Figure 4F), and unfavorable OS (Figure 4G). Collectively, our results suggested that ILT4-impaired CD8+ T cell and ILT4-heightened Treg cell infiltration was a strong indicator for CRC progression and poor prognosis.
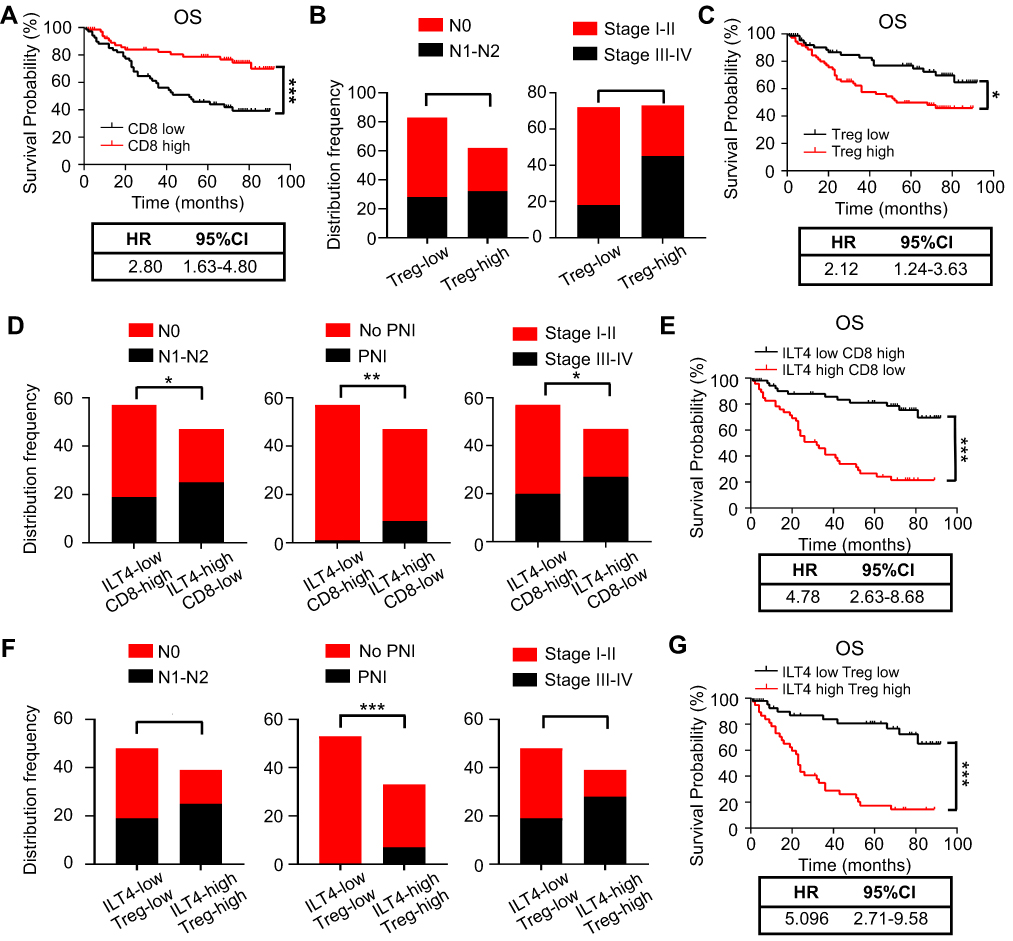 |
Figure 4 ILT4-directed suppressive T cell subsets predicted poor clinical outcomes. (A) Patients with high CD8+ T cell infiltration displayed good OS relative to those with low CD8+ T cell infiltration. The medium density of tumor-infiltrating CD8+ T cells was defined as the cutoff value for CD8-high and -low groups. (B) High Treg cell infiltration in CRC tissues was associated with advanced lymph node metastasis and tumor stages. The medium proportion of Treg cells in TILs was defined as the cutoff value for Treg-high and -low groups. (C) Patients with high frequency of Treg infiltration showed poor OS compared with those in the Treg-low group. The cutoff value for Treg-high and -low was the same as in (B and D). High ILT4 level in combination with low CD8+ T cell infiltration predicted more advanced lymph node involvement, perineural invasion, and tumor stage than those observed in the ILT4-low CD8-high group. (E) Patients in the ILT4-high CD8-low group showed significantly shorter OS than those in the ILT4-low CD8-high group. (F) Compared with the patients in the ILT4 and Treg double low group, those in the double high group were prone to lymph node metastasis, perineural invasion, and advanced tumor stage. (G) High ILT4 expression in combination with high Treg infiltration indicated poor patient OS, compared with the double low group. *p<0.05; **p<0.01; ***p<0.001. Abbreviations: HR, hazard ratio; PNI, perineural invasion; OS, overall survival. |
ILT4 in CRC Cells Was Inversely Correlated to IFN-γ Production in TILs
IFN-γ, mainly secreted by TILs, including T cells, natural killer cells, and B cells, is a central immune regulator of tumor progression.22 Therefore, we investigated the levels of IFN-γ in TILs from ILT4-high or -low patients. We found that IFN-γ levels in TILs of ILT4-high patients were markedly lower than those of ILT4-low patients (Figures 5A and B). Meanwhile, patients in the IFN-γ-low group showed notable lymph node metastasis, advanced tumor stage (Figure 5C), and unfavorable OS, compared with those in the IFN-γ-high group (Figure 5D). In addition, we determined IFN-γ levels in TILs from both tumor centers and invasive margins in ILT4-high and -low patients, and found that in the tumor centers (Figure 5E), but not invasive margins (Figure 5F), IFN-γ production in TILs in the ILT4-high group was lower than that in the ILT4-low group. Since Th1 and CD8+ T cells are the predominant IFN-γ-producing cells, we then analyzed the correlation of IFN-γ levels with CD4+ and CD8+ T cell densities. As shown in Figure 5G, patients with high CD8+, but not CD4+T cell infiltration showed remarkably augmented IFN-γ levels, suggesting that the elevated IFN-γ levels might be derived from the tumor-infiltrating CD8+ T cells. Using the patient information in TCGA database, we confirmed the positive correlation between CD8+ T cell density and IFN-γ levels in colon and rectum adenocarcinoma cohorts (Figure 5H). In addition, we compared the divergence of clinical characteristics and patient survival based on combined ILT4 and IFN-γ expression. As expected, patients with high ILT4 expression in CRC cells but low IFN-γ expression in TILs showed a higher probability for lymph node metastasis, perineural invasion, and tumor progression than did their ILT4-low IFN-γ-high counterparts (Figure 5I). More importantly, high ILT4 expression in tumor cells in combination with low IFN-γ levels in TILs was associated with poorer patient OS (Figure 5J). In summary, our results indicated that enrichment of ILT4 in CRC cells was related to diminished IFN-γ production in TILs, which might be attributed to decreased CD8+ T cell infiltration. ILT4 and IFN-γ levels more efficiently predicted patient outcomes in combination than as single individual markers.
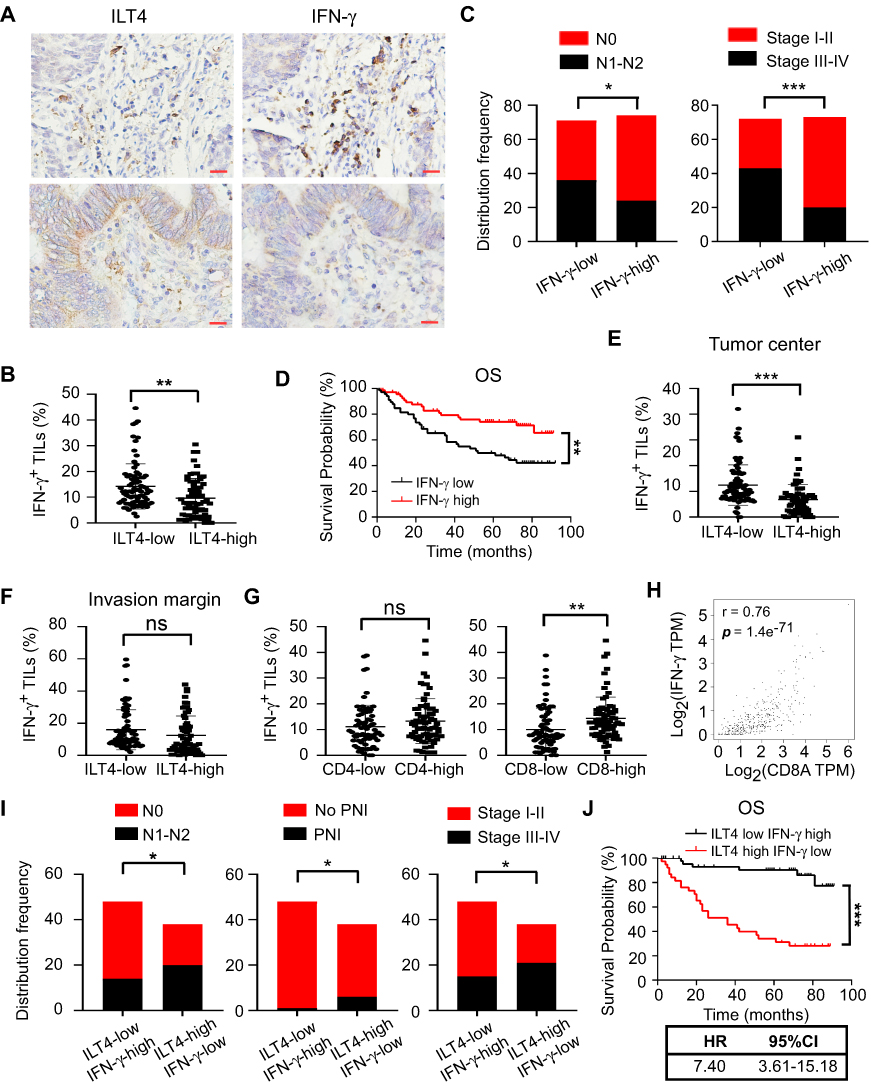 |
Figure 5 ILT4 in CRC cells was inversely correlated with IFN-γ production in TILs. (A and B) IHC analysis showed that CRC tissues with high ILT4 expression displayed lower IFN-γ levels in TILs, compared with the CRC tissues with low ILT4 expression. (A) Representative imaging of ILT4 and IFN-γ levels in CRC tissues and (B) the statistical results in 145 patients. Scale bar: 20μm. (C) High IFN-γ levels in TILs were correlated with decreased lymph node involvement and earlier tumor stage, compared with the IFN-γ-low group. The medium proportion of IFN-γ+ cells in TILs was used to discriminate IFN-γ-low and -high groups. (D) High IFN-γ expression in TILs was correlated with superior patient OS. The cutoff value for high and low IFN-γ was as described in (C). (E and F) IHC analysis showed that high ILT4 expression in CRC cells predicted declined IFN-γ+ TIL frequency in the tumor center (E) but not in the invasive margin (F). The cutoff score for high and low ILT4 groups was the same as in Figure 1C. (G) The frequency of IFN-γ+ TILs was positively correlated with CD8+ T but not CD4+ T cell density by IHC analysis. (H) IFN-γ expression was positively correlated with CD8 levels in CRC tissues by analyzing TCGA database. The online tool GEPIA was used to analyze the correlation between IFN-γ and CD8 levels. (I) Patients with high ILT4 and low IFN-γ levels showed more advanced lymph node involvement, perineural invasion, and tumor stage than those in the ILT4-low IFN-γ-high group. (J) High ILT4 in combination with low IFN-γ levels predicted poor patient OS relative to the ILT4-low IFN-γ-high counterpart. *p<0.05; **p<0.01; ***p<0.001. Abbreviations: HR, hazard ratio; ns, no significance; OS, overall survival; PNI, perineural invasion. |
PIR-B Induced Immunosuppressive T Cell Contexture and Tumor Progression in vivo
Our observations in human CRC tissues indicated that ILT4 expression was correlated with decreased T cell infiltration and an immunosuppressive T cell subset distribution. Next, we wanted to establish a causative link between ILT4 expression and impaired T cell immunity. We first up- and downregulated PIR-B expression in the murine CRC cell line MC38. The efficiency of the PIR-B overexpression and knockdown was determined by real-time PCR and Western blotting (Supplementary Figure A–C). Then, we established tumor growth models by the subcutaneous injection of PIR-B-overexpressing/knockdown MC38 into C57BL/6 mice. Next, tumor growth was evaluated. Tumors, blood, and spleens from the sacrificed mice were isolated to analyze the densities of different T cell subsets in these organs. We found that PIR-B overexpression remarkably accelerated tumor growth in vivo (Figure 6A). The final tumor sizes and weights from the PIR-B-overexpressing and the control groups displayed consistent results (Figure 6B and C). Then, we determined the densities of CD3+, CD4+, CD8+, FOXP3+, and IFN-γ+ T cells in tumor tissues from each group by IHC analysis. As shown in Figure 6D and E, tumor tissues with PIR-B overexpression showed significantly decreased CD3+, CD8+, and IFN-γ+ T cell infiltration, but had increased FOXP3+ T cell infiltration. We also analyzed the T cell subsets in the peripheral blood and spleens from each group. Similarly, we found that the CD3+ T cell frequencies in both blood and spleens from the PIR-B overexpression group were remarkably lower than those from the control group (Figure 6F). Although there were no significant differences in CD4+ T cell frequencies between the two groups (Figure 6G), we observed a substantial reduction of CD8+ T cell densities (Figure 6H), as well as an elevation of FOXP3+ T cell densities, in the PIR-B overexpression group (Figure 6I).
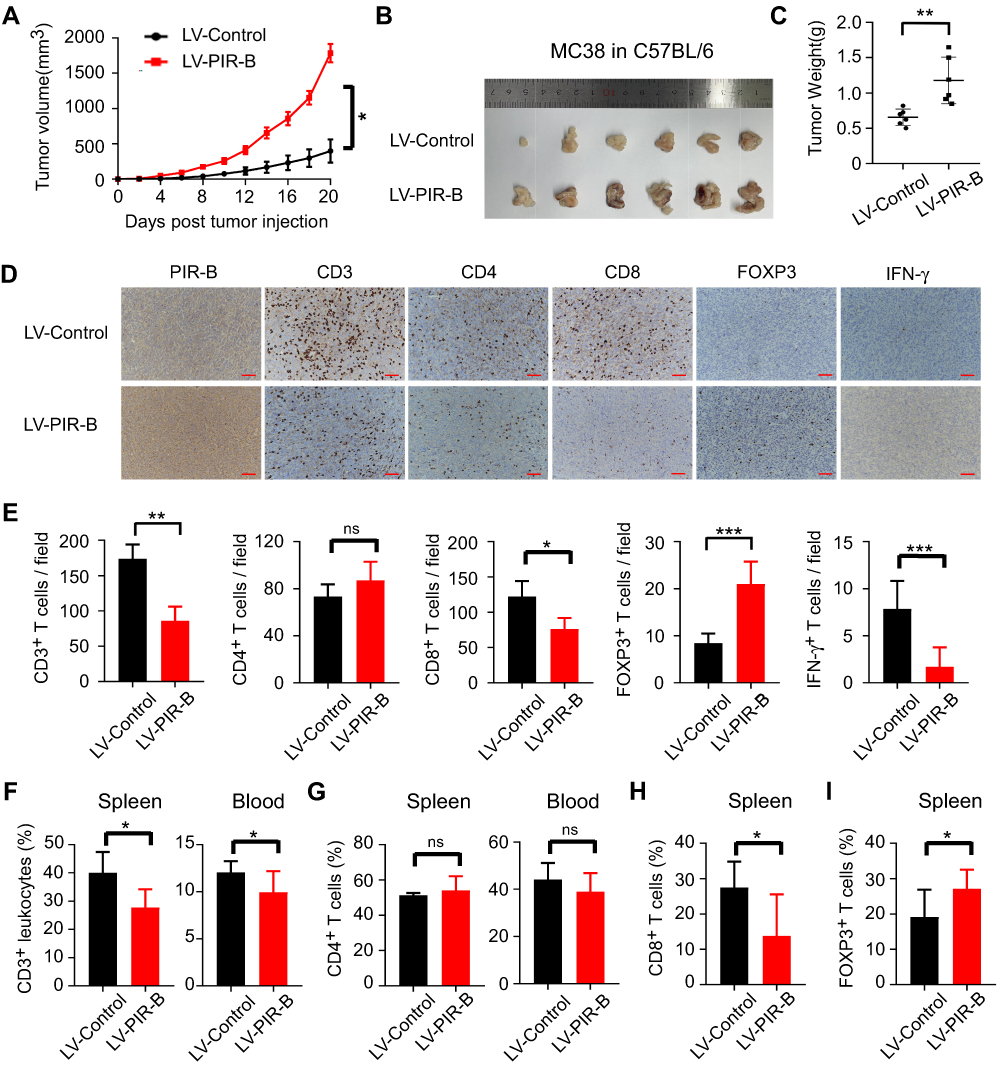 |
Figure 6 PIR-B overexpression induced immunosuppressive T cell contexture and tumor progression in vivo. (A) PIR-B overexpression markedly accelerated MC38 tumor growth in C57BL/6 mice. Mouse colon cancer cell line MC38 (1×10⁷ cells/mouse) infected with PIR-B overexpression or control lentivirus was subcutaneously inoculated into 6–8-week female C57BL/6 mice. Tumor sizes were measured every two days and are presented as mean ± SD (n = 6 mice/group). (B and C) PIR-B overexpression in MC38 cells markedly decreased final tumor sizes and weights of transplanted tumors. (B) Tumor sizes and (C) mean ± SD of tumor weights from each group at the endpoint of the experiments. (D and E) Tumor tissues in the PIR-B overexpression group showed significantly decreased CD3+, CD8+, and IFN-γ+ T cell infiltration, but increased FOXP3+ T cell infiltration, compared with those in the control group. The numbers of T cell subsets were determined by IHC analysis. (D) Representative images from IHC analysis. (E) Mean ± SD of different T cell subset infiltration in five random fields. (F) Flow cytometric analysis showed that blood and spleens from PIR-B-overexpressing mice had lower CD3+ T cell frequencies than those from the control group. The total leukocytes were calculated from the CD45+ cells in both organs. (G) Flow cytometric analysis showed that PIR-B overexpression had no impact on CD4+ T cell density in blood and spleens. (H and I) Flow cytometric analysis showed that spleens from PIR-B-overexpressing mice displayed significantly higher CD8+ T cell frequencies but lower FOXP3+ Treg frequencies. (H) The fraction of CD8+ T cells among CD3+ T cells. (I) The fraction of FOXP3+ T cells among CD3+ T cells. *p<0.05; **p<0.01; ***p<0.001. Abbreviations: LV-Control, MC38 cells transfected with control lentivirus; LV-PIR-B, MC38 cells transfected with PIR-B overexpression lentivirus. |
Then, we verified our results in tumor growth models injected with PIR-B knockdown MC38 cells. In contrast to PIR-B overexpression, PIR-B knockdown in MC38 profoundly limited tumor growth and generated markedly smaller tumor sizes and weights (Figures 7A–C). Using IHC analysis, we found that PIR-B knockdown tumor tissues displayed significantly increased CD3+, CD8+, and IFN-γ+ T cell densities, but decreased FOXP3+ T cell densities, relative to the control group (Figure 7D and E). Likewise, PIR-B knockdown in MC38 had no impact on CD4+ T cell infiltration (Figure 7F). However, PIR-B knockdown significantly heightened the frequencies of CD8+ T cells in blood, but diminished those of FOXP3+ T cells (Figure 7G and H). Furthermore, blood and spleens from PIR-B knockdown mice showed a greater IFN-γ+ T cell fraction (Figure 7I). Altogether, these results indicated that ILT4 in CRC cells restricted the infiltration and IFN-γ production of T cells, especially CD8+ T cells, but increased the infiltration of Treg cells, supporting our findings in human tissues.
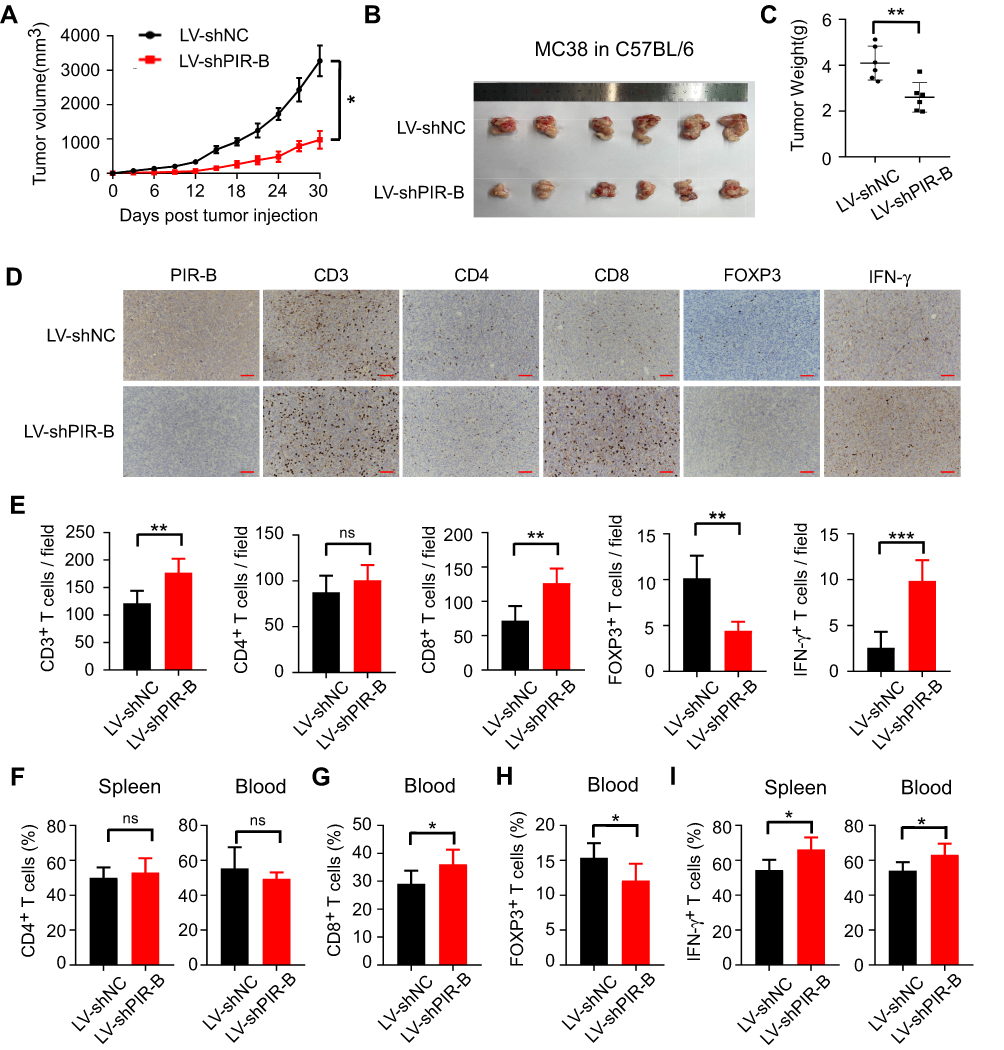 |
Figure 7 PIR-B knockdown inhibited immunosuppressive T cell contexture and tumor progression in vivo. (A) PIR-B knockdown profoundly slowed MC38 tumor growth in C57BL/6 mice. MC38 cells (1×10⁷ cells/mouse) infected with PIR-B knockdown or control lentivirus were subcutaneously inoculated into 6–8-week female C57BL/6 mice. Tumor sizes were measured every three days and are presented as mean ± SD (n = 6 mice/group). (B and C) PIR-B knockdown in MC38 cells markedly decreased final tumor sizes and weights of transplanted tumors. (B) Tumor sizes and (C) mean ± SD of tumor weights from each group at the endpoint of the experiments. (D and E) Tumor tissues with PIR-B knockdown displayed markedly higher CD3+, CD8+, and IFN-γ+ T cell densities, but lower FOXP3+ T cell densities than those in the control group. The numbers of T cell subsets were determined by IHC analysis. (D) Representative images of IHC analysis. (E) Mean ± SD of different T cell subset infiltration in five random fields. (F) Flow cytometric analysis showed that PIR-B knockdown did not affect CD4+ T cell frequency in mouse blood and spleens. (G and H) Flow cytometric analysis showed that PIR-B knockdown remarkably increased the frequency of CD8+ T cells but decreased that of FOXP3+ Tregs. (G) The fraction of CD8+ T cells among CD3+ T cells. (H) The fraction of FOXP3+ T cells among CD3+ T cells. (I) Flow cytometric analysis showed that the T cells from the spleens and blood of PIR-B knockdown mice produced markedly more IFN-γ than the spleens and blood of the control group mice. The total T cells were calculated from the CD3+ cells in both organs. *p<0.05; **p<0.01; ***p<0.001. Abbreviations: LV-shNC, MC38 cells transfected with lentiviruses carrying control shRNA; LV-shPIR-B, MC38 cells transfected with lentiviruses carrying specific PIR-B shRNA. |
Discussion
ICB has elicited tremendous excitement in cancer immunotherapy in the last decade due to its success in multiple solid tumors, such as melanoma and lung cancer.5 In CRC, ICB also received FDA approval for the treatment of dMMR or MSI-H tumors in 2017.23 However, only 15% of all CRCs are dMMR or MSI-H, with an even lower prevalence (4%) in patients with an advanced disease.24–26 For the vast majority of CRC patients who are pMMR or MSI-L, ICB showed little to no effect in clinical studies. In this subpopulation, the lack of immune cell infiltration and the T cell dysfunction induced by suppressive TMEs have been posited as major causes of immune resistance.7,8 Therefore, the identification of novel checkpoint molecules to improve immune infiltration and break hostile immune barriers represents a promising strategy to improve ICB efficacy in CRC patients. Here, we proposed ILT4 as a novel immunotarget to potentiate T cell infiltration and function in CRC. We found that high ILT4 expression in CRC cells predicted impaired T cell infiltration and poor clinical outcome. Further, T cell subset analysis revealed that the enrichment of tumor ILT4 resulted in decreased CD8+ T cell densities, but increased Treg accumulation in the TME. Meanwhile, ILT4 in CRC cells restricted IFN-γ production in tumor-infiltrating T cells, especially CD8+ T cells.
Previous studies from our group and others demonstrated that ILT4 is highly expressed in the tumor cells of multiple solid and hematopoietic malignancies.12,15,16 ILT4 in these tumor cells promoted malignant behaviors, including proliferation, invasion, and metastasis.15,27,28 These findings supported ILT4 as a tumor driver and negative prognostic biomarker. Recently, our group found that tumor-derived ILT4 orchestrated T cell senescence and TAM polarization in lung cancer and breast cancer, suggesting that tumor-derived ILT4 plays a role in inhibiting tumor immunity. However, whether ILT4 regulates T cell immunity in CRC is still unclear. Here, for the first time, we discovered that ILT4 in CRC cells controlled the number and profiles of T cell infiltrates. It is well-accepted that high densities of CD3+ and CD8+ T cells in CRC are associated with favorable patient survival.29–31 These findings led to the establishment and implementation of the immunoscore, based on the CD3+ and CD8+ T cell densities in the TME, as a prognostic biomarker for CRC patients.30,32,33 In our current study, the enrichment of ILT4 expression in CRC cells resulted in decreased CD3+ and CD8+ T cell numbers, suggesting that tumor cell-derived ILT4 might also act as a suppressor of T cell immunity and mediate the immune escape of CRC. In addition to regulating anti-tumor immunity and tumor progression, T cell infiltrates in the TME also determined the efficacy of ICB treatment. It has been reported that most pMMR or MSI-L CRCs are poorly infiltrated or non-infiltrated by T cells, which explains their immune resistance to ICB.34,35 Based on our findings, the blockade of ILT4 expression in these tumor cells might switch the immunosuppressive contexture into immune-component, and improve tumor cell sensitivity to ICB. Therefore, it is reasonable to assume that ILT4 blockade using specific neutralizing antibodies or inhibitors should be a potential combination strategy to overcome ICB resistance in pMMR or MSI-L CRCs, the dominant CRC subpopulations. Given that T cells infiltrating into the tumor center are often antigen-specific and display more powerful anti-tumor immune response effects than those in the invasive margin,36 we explored whether ILT4 directed the spatial arrangement of tumor-infiltrating T cells. We found that in both locations, ILT4 expression was similarly correlated to tumor-infiltrating CD3+/CD8+ T cell densities, suggesting that ILT4-orchestrated tumor eradication by T cells might not entirely rely on direct cell–cell contact.
Unlike CD3+/CD8+ T cells, the prognostic impact of Treg cell infiltration in CRC is still controversial. In some studies, high FOXP3+ Treg infiltration was an unfavorable indicator for patient survival.37–39 However, other reports came to the opposite conclusion.40–43 In our study, ILT4 was positively correlated with FOXP3+ Treg cell accumulation, which indicated poor patient OS. In fact, FOXP3+ Treg cells contain heterogeneous subsets, which contribute either to progression or to the inhibition of CRC.31,44 As such, using Treg densities in combination with their functional cytokines might be more effective to clearly determine the prognostic impact of Treg cells. However, as for the biological functions of the Treg subsets, most Treg cells are immunosuppressive, supporting their role in inhibiting anti-tumor immunity.45,46 According to previous studies, Treg cells in human tumors usually inhibit immune responses directly through cell-to-cell contacts or indirectly through the production of cytokines such as TGF-β and IL-10.45 Here, we found that the overexpression of ILT4 in CRC cells increased Treg densities in CRC, especially in tumor centers, suggesting that the contact-dependent inhibition of Treg cells plays a dominant role in ILT4-regulated tumor immune evasion.
In addition to cell quantities, functional cytokines also occupy an important position in T cell-mediated anti-tumor immunity. IFN-γ is among the most crucial cytokines secreted by activated CD4+ T cells and CD8+ cytotoxic T cells, which profoundly elicit tumor remission.47,48 TIL-derived IFN-γ not only directly induces tumor cell apoptosis, but also provokes several immunological processes, including macrophage activation, Treg cell inhibition, and Th1 and cytotoxic T lymphocyte (CTL) differentiation, for the effective rejection of solid tumors.49 Here, we verified the positive prognostic value of TIL-derived INF-γ and discovered a causative correlation between ILT4 expression and IFN-γ production by TILs, especially by CD8+ T cells. Our results suggested that in addition to preventing T cell infiltration, ILT4 in CRC cells also hindered T cell function via the destruction of effector cytokines. However, we did not explore the association of ILT4 expression with CTL-specific cytokines such as granzyme and perforin in the present study and will investigate the same in the subsequent studies.
Conclusion
ILT4 enrichment in CRC cells induces immunosuppressive T cell subset infiltration and impaired IFN-γ production in TILs. ILT4 might be a potential immunotherapeutic target and prognostic biomarker in CRC patients.
Abbreviations
ICB, immune checkpoint blockade; CRC, colorectal cancer; TME, tumor microenvironment; ILT4, immunoglobulin-like transcript 4; IHC, immunohistochemical; PIR-B, paired Ig-like receptor B; TIL, tumor-infiltrating lymphocyte; DC, dendritic cell;; dMMR, deficient mismatch repair; MSI-H, high microsatellite instability; pMMR, mismatch-repair-proficient; MSI-L, microsatellite instability; TAM, tumor-associated macrophage; PFS, progression-free survival; OS, overall survival; TCGA, The Cancer Genome Atlas.
Ethical Statement
This experiment was approved by the medical ethics committee of Jinan Central Hospital, Cheeloo College of Medicine, Shandong University (GZR2020-027-01).
Acknowledgments
We acknowledge Yuan Ma in the Department of Pathology of Jinan Central Hospital for helping the preparation of the tissue sections. We would like to thank Editage (www.editage.cn) for English language editing.
Author Contributions
All authors made a significant contribution to the work reported, whether that is in the conception, study design, execution, acquisition of data, analysis and interpretation, or in all these areas; took part in drafting, revising or critically reviewing the article; gave final approval of the version to be published; have agreed on the journal to which the article has been submitted; and agree to be accountable for all aspects of the work.
Funding
This work was partially supported by grants from the Jinan Science and Technology Development Program (201907110), National Major Science and Technology Project of China (2020ZX09201025), Shandong Provincial Natural Science Foundation (ZR2019MH042), and Academic Promotion Programme of Shandong First Medical University (2019QL025).
Disclosure
The authors declare that they have no conflict of interest.
References
1. Bray F, Ferlay J, Soerjomataram I, Siegel RL, Torre LA, Jemal A. Global cancer statistics 2018: GLOBOCAN estimates of incidence and mortality worldwide for 36 cancers in 185 countries. CA Cancer J Clin. 2018;68:394–424. doi:10.3322/caac.21492
2. Arnold M, Sierra MS, Laversanne M, Soerjomataram I, Jemal A, Bray F. Global patterns and trends in colorectal cancer incidence and mortalit. Gut. 2017;66:683–691. doi:10.1136/gutjnl-2015-310912
3. Siegel RL, Miller KD, Goding Sauer A, et al. Colorectal cancer statistics, 2020. CA Cancer J Clin. 2020;70:145–164. doi:10.3322/caac.21601
4. Dekker E, Tanis PJ, Vleugels JLA, Kasi PM, Wallace MB. Colorectal cancer. Lancet. 2019;394:1467–1480.
5. Ribas A, Wolchok JD. Cancer immunotherapy using checkpoint blockade. Science. 2018;359:1350–1355. doi:10.1126/science.aar4060
6. Overman MJ, McDermott R, Leach JL, et al. Nivolumab in patients with metastatic DNA mismatch repair-deficient or microsatellite instability-high colorectal cancer (CheckMate 142): an open-label, multicentre, Phase 2 study. Lancet Oncol. 2017;18:1182–1191. doi:10.1016/S1470-2045(17)30422-9
7. Ghiringhelli F, Fumet JD. Is there a place for immunotherapy for metastatic microsatellite stable colorectal cancer? Front Immunol. 2019;10:1816. doi:10.3389/fimmu.2019.01816
8. Catalano I, Grassi E, Bertotti A, Trusolino L. Immunogenomics of colorectal tumors: facts and hypotheses on an evolving saga. Trends Cancer. 2019;5:779–788. doi:10.1016/j.trecan.2019.10.006
9. Wagtmann N, Rojo S, Eichler E, Mohrenweiser H, Long EO. A new human gene complex encoding the killer cell inhibitory receptors and related monocyte/macrophage receptors. Curr Biol. 1997;7:615–618. doi:10.1016/S0960-9822(06)00263-6
10. Colonna M, Navarro F, Bellon T, et al. A common inhibitory receptor for major histocompatibility complex class I molecules on human lymphoid and myelomonocytic cells. J Exp Med. 1997;186:1809–1818. doi:10.1084/jem.186.11.1809
11. Lu N, Li Y, Zhang Z, et al. Human semaphorin-4A drives Th2 responses by binding to receptor ILT-4. Nat Commun. 2018;9:742. doi:10.1038/s41467-018-03128-9
12. Gao A, Sun Y, Peng G. ILT4 functions as a potential checkpoint molecule for tumor immunotherapy. Biochim Biophys Acta Rev Cancer. 2018;1869:278–285. doi:10.1016/j.bbcan.2018.04.001
13. Chen HM, van der Touw W, Wang YS, et al. Blocking immunoinhibitory receptor LILRB2 reprograms tumor-associated myeloid cells and promotes antitumor immunity. J Clin Invest. 2018;128:5647–5662. doi:10.1172/JCI97570
14. Sun Y, Liu J, Gao P, Wang Y, Liu C. Expression of Ig-like transcript 4 inhibitory receptor in human non-small cell lung cancer. Chest. 2008;134:783–788. doi:10.1378/chest.07-1100
15. Cai Z, Wang L, Han Y, et al. Immunoglobulinlike transcript 4 and human leukocyte antigenG interaction promotes the progression of human colorectal cancer. Int J Oncol. 2019;54:1943–1954. doi:10.3892/ijo.2019.4761
16. Shao H, Ma L, Jin F, Zhou Y, Tao M, Teng Y. Immune inhibitory receptor LILRB2 is critical for the endometrial cancer progression. Biochem Biophys Res Commun. 2018;506:243–250. doi:10.1016/j.bbrc.2018.09.114
17. Li Q, Li J, Wang S, et al. Overexpressed immunoglobulin-like transcript (ILT) 4 in lung adenocarcinoma is correlated with immunosuppressive T cell subset infiltration and poor patient outcomes. Biomark Res. 2020;8:11. doi:10.1186/s40364-020-00191-7
18. Solomon BJ, Mok T, Kim DWet al. First-line crizotinib versus chemotherapy in ALK-positive lung cancer. N Engl J Med. 2015;373:1582.
19. Ho PC, Kaech SM. Reenergizing T cell anti-tumor immunity by harnessing immunometabolic checkpoints and machineries. Curr Opin Immunol. 2017;46:38–44. doi:10.1016/j.coi.2017.04.003
20. Galon J, Costes A, Sanchez-Cabo F, et al. Type, density, and location of immune cells within human colorectal tumors predict clinical outcome. Science. 2006;313:1960–1964. doi:10.1126/science.1129139
21. Golubovskaya V, Wu L. Different subsets of T cells, memory, effector functions, and CAR-T immunotherapy. Cancers. 2016;8. doi:10.3390/cancers8030036
22. Castro F, Cardoso AP, Goncalves RM, Serre K, Oliveira MJ. Interferon-gamma at the crossroads of tumor immune surveillance or evasion. Front Immunol. 2018;9:847.
23. Le DT, Uram JN, Wang H, et al. PD-1 blockade in tumors with mismatch-repair deficiency. N Engl J Med. 2015;372:2509–2520. doi:10.1056/NEJMoa1500596
24. Boland CR, Goel A. Microsatellite instability in colorectal cancer. Gastroenterology. 2010;138:2073–2087 e3. doi:10.1053/j.gastro.2009.12.064
25. Hampel H, Frankel WL, Martin E, et al. Screening for the Lynch syndrome (hereditary nonpolyposis colorectal cancer). N Engl J Med. 2005;352:1851–1860. doi:10.1056/NEJMoa043146
26. Koopman M, Kortman GA, Mekenkamp L, et al. Deficient mismatch repair system in patients with sporadic advanced colorectal cancer. Br J Cancer. 2009;100:266–273. doi:10.1038/sj.bjc.6604867
27. Zhang P, Guo X, Li J, et al. Immunoglobulin-like transcript 4 promotes tumor progression and metastasis and up-regulates VEGF-C expression via ERK signaling pathway in non-small cell lung cancer. Oncotarget. 2015;6:13550–13563. doi:10.18632/oncotarget.3624
28. Liu X, Yu X, Xie J, et al. ANGPTL2/LILRB2 signaling promotes the propagation of lung cancer cells. Oncotarget. 2015;6:21004–21015. doi:10.18632/oncotarget.4217
29. Idos GE, Kwok J, Bonthala N, Kysh L, Gruber SB, Qu C. The prognostic implications of tumor infiltrating lymphocytes in colorectal cancer: a systematic review and meta-analysis. Sci Rep. 2020;10:3360. doi:10.1038/s41598-020-60255-4
30. Pagès F, Mlecnik B, Marliot F, et al. International validation of the consensus immunoscore for the classification of colon cancer: a prognostic and accuracy study. Lancet. 2018;391:2128–2139. doi:10.1016/S0140-6736(18)30789-X
31. Guo L, Wang C, Qiu X, Pu X, Chang P. Colorectal cancer immune infiltrates: significance in patient prognosis and immunotherapeutic efficacy. Front Immunol. 2020;11:1052. doi:10.3389/fimmu.2020.01052
32. Trabelsi M, Farah F, Zouari B, Jaafoura MH, Kharrat M. An immunoscore system based on CD3(+) and CD8(+) infiltrating lymphocytes densities to predict the outcome of patients with colorectal adenocarcinoma. Onco Targets Ther. 2019;12:8663–8673. doi:10.2147/OTT.S211048
33. Anitei MG, Zeitoun G, Mlecnik B, et al. Prognostic and predictive values of the immunoscore in patients with rectal cancer. Clin Cancer Res. 2014;20:1891–1899. doi:10.1158/1078-0432.CCR-13-2830
34. Ciardiello D, Vitiello PP, Cardone C, et al. Immunotherapy of colorectal cancer: challenges for therapeutic efficacy. Cancer Treat Rev. 2019;76:22–32. doi:10.1016/j.ctrv.2019.04.003
35. Ganesh K, Stadler ZK, Cercek A, et al. Immunotherapy in colorectal cancer: rationale, challenges and potential. Nat Rev Gastroenterol Hepatol. 2019;16:361–375. doi:10.1038/s41575-019-0126-x
36. Galon J, Bruni D. Approaches to treat immune hot, altered and cold tumours with combination immunotherapies. Nat Rev Drug Discov. 2019;18:197–218.
37. Yaqub S, Henjum K, Mahic M, et al. Regulatory T cells in colorectal cancer patients suppress anti-tumor immune activity in a COX-2 dependent manner. Cancer Immunol Immunother. 2008;57:813–821. doi:10.1007/s00262-007-0417-x
38. Zhuo C, Li Z, Xu Y, et al. Higher FOXP3-TSDR demethylation rates in adjacent normal tissues in patients with colon cancer were associated with worse survival. Mol Cancer. 2014;13:153. doi:10.1186/1476-4598-13-153
39. Saito T, Nishikawa H, Wada H, et al. Two FOXP3(+)CD4(+) T cell subpopulations distinctly control the prognosis of colorectal cancers. Nat Med. 2016;22:679–684. doi:10.1038/nm.4086
40. Salama P, Phillips M, Grieu F, et al. Tumor-infiltrating FOXP3+ T regulatory cells show strong prognostic significance in colorectal cancer. J Clin Oncol. 2009;27:186–192. doi:10.1200/JCO.2008.18.7229
41. Correale P, Rotundo MS, Del Vecchio MT, et al. Regulatory (FoxP3+) T-cell tumor infiltration is a favorable prognostic factor in advanced colon cancer patients undergoing chemo or chemoimmunotherapy. J Immunother. 2010;33:435–441. doi:10.1097/CJI.0b013e3181d32f01
42. Frey DM, Droeser RA, Viehl CT, et al. High frequency of tumor-infiltrating FOXP3(+) regulatory T cells predicts improved survival in mismatch repair-proficient colorectal cancer patients. Int J Cancer. 2010;126:2635–2643.
43. Yoon HH, Orrock JM, Foster NR, Sargent DJ, Smyrk TC, Sinicrope FA. Prognostic impact of FoxP3+ regulatory T cells in relation to CD8+ T lymphocyte density in human colon carcinomas. PLoS One. 2012;7:e42274.
44. Zhuo C, Xu Y, Ying M, et al. FOXP3+ Tregs: heterogeneous phenotypes and conflicting impacts on survival outcomes in patients with colorectal cancer. Immunol Res. 2015;61:338–347.
45. Zhang X, Kelaria S, Kerstetter J, Wang J. The functional and prognostic implications of regulatory T cells in colorectal carcinoma. J Gastrointest Oncol. 2015;6:307–313. doi:10.3978/j.issn.2078-6891.2015.017
46. Ladoire S, Martin F, Ghiringhelli F. Prognostic role of FOXP3+ regulatory T cells infiltrating human carcinomas: the paradox of colorectal cancer. Cancer Immunol Immunother. 2011;60:909–918. doi:10.1007/s00262-011-1046-y
47. Mucida D, Husain MM, Muroi S, et al. Transcriptional reprogramming of mature CD4(+) helper T cells generates distinct MHC class II-restricted cytotoxic T lymphocytes. Nat Immunol. 2013;14:281–289. doi:10.1038/ni.2523
48. Dunn GP, Koebel CM, Schreiber RD. Interferons, immunity and cancer immunoediting. Nat Rev Immunol. 2006;6:836–848. doi:10.1038/nri1961
49. Jorgovanovic D, Song M, Wang L, Zhang Y. Roles of IFN-gamma in tumor progression and regression: a review. Biomark Res. 2020;8:49.
 © 2021 The Author(s). This work is published and licensed by Dove Medical Press Limited. The
full terms of this license are available at https://www.dovepress.com/terms
and incorporate the Creative Commons Attribution
- Non Commercial (unported, 3.0) License.
By accessing the work you hereby accept the Terms. Non-commercial uses of the work are permitted
without any further permission from Dove Medical Press Limited, provided the work is properly
attributed. For permission for commercial use of this work, please see paragraphs 4.2 and 5 of our Terms.
© 2021 The Author(s). This work is published and licensed by Dove Medical Press Limited. The
full terms of this license are available at https://www.dovepress.com/terms
and incorporate the Creative Commons Attribution
- Non Commercial (unported, 3.0) License.
By accessing the work you hereby accept the Terms. Non-commercial uses of the work are permitted
without any further permission from Dove Medical Press Limited, provided the work is properly
attributed. For permission for commercial use of this work, please see paragraphs 4.2 and 5 of our Terms.