Back to Journals » International Journal of Nanomedicine » Volume 21
Identification of Bone Marrow and Peripheral Blood Plasma Extracellular Vesicle Protein Biomarker Signatures for Multiple Myeloma Diagnosis and Staging
Authors Cheryl A, Sheridan R, Brennan K, Bazou D, Matallanas D, O'Gorman P, Iglesias-Martinez LF, Mc Gee MM
Received 26 October 2025
Accepted for publication 25 February 2026
Published 23 June 2026 Volume 2026:21 576858
DOI https://doi.org/10.2147/IJN.S576858
Checked for plagiarism Yes
Review by Single anonymous peer review
Peer reviewer comments 3
Editor who approved publication: Dr Kamakhya Misra
Angelique Cheryl,1,* Rebecca Sheridan,1,* Kieran Brennan,1,2 Despina Bazou,1,3 David Matallanas,4 Peter O’Gorman,5 Luis F Iglesias-Martinez,4 Margaret M Mc Gee1,2
1School of Biomolecular and Biomedical Science, University College Dublin, Dublin, Ireland; 2Conway Institute of Biomolecular and Biomedical Research, University College Dublin, Dublin, Ireland; 3Department of Biology, Maynooth University, Maynooth, Ireland; 4Systems Biology Ireland, School of Medicine, University College Dublin, Dublin, Ireland; 5Department of Haematology, Mater Misericordiae University Hospital, Dublin, Ireland
*These authors contributed equally to this work
Correspondence: Margaret M Mc Gee, School of Biomolecular and Biomedical Science, University College Dublin, Dublin, Ireland, Email [email protected]
Purpose: Multiple myeloma (MM) is a hematological malignancy characterized by the clonal proliferation of abnormal plasma cells within the bone marrow (BM). Despite advances in treatment that have improved survival, the disease remains incurable. MM diagnosis requires invasive bone marrow biopsy to quantify the percentage of malignant plasma cells. In this study, the potential of extracellular vesicles (EVs) as a non-invasive liquid biopsy for MM diagnosis and staging was investigated, highlighting the diagnostic value of their proteomic biomarker cargo.
Patients and Methods: Plasma-derived EVs from peripheral blood and bone marrow of 33 MM patients and 12 healthy donors were isolated, and their proteomic content was profiled via mass spectrometry. Biomarker signatures were identified using supervised machine learning to predict monoclonal gammopathy of undetermined significance (MGUS), progression to symptomatic MM, and relapse. Their discriminatory power was further evaluated through receiver operating characteristic curve analysis, and complementary performance metrics, including accuracy, sensitivity, specificity, predictive values, and F1 score. Significantly altered proteins were additionally assessed for functional enrichment in relevant biological pathways.
Results: The analysis identified a six-protein biomarker signature, forming four optimal logistic regression diagnostic MM peripheral blood models with predictive accuracies of > 85% and areas under the curve of > 0.91. The signature was characterized by increased abundance of APOC1 and LGALS1 and decreased abundance of S100A7, CD226, ALAD, and KRT78, reflecting immune modulation, impaired immune surveillance, and disrupted proteostatic pathways.
Conclusion: The performance of the identified proteins supports their potential as a minimally invasive EV-based liquid biopsy in MM diagnosis and monitoring, warranting future validation.
Keywords: cancer, EVs, proteomics, machine learning, liquid biopsy
Introduction
Multiple myeloma (MM) is characterized by the clonal expansion of abnormal plasma cells within the bone marrow (BM) and progressive immune dysfunction. MM is also marked by the secretion of monoclonal (M) proteins by these aberrant plasma cells. MM is preceded by monoclonal gammopathy of undetermined significance (MGUS), a premalignant condition with an annual progression risk to MM of 1%. Patients with MGUS do not typically receive preventative therapy and are managed only upon progression to symptomatic MM. The disease pathogenesis involves interactions with the BM microenvironment that trigger signaling pathways including PI3K/AKT/mTOR, RAS/MAPK, JAK/STAT, Wnt/β-catenin, and NF-κB, promoting myeloma cell growth, survival, migration, and drug resistance.1 Despite recent advances in therapeutic strategies and overall patient survival, MM remains incurable, with most patients experiencing cycles of remission and relapse that eventually lead to treatment resistance.2,3 Symptomatic MM is diagnosed through invasive bone marrow biopsy and detection of end-organ damage, assessed via serum elevated calcium and urea, decreased iron, and the presence of bone lesions.4 Diagnosis is especially challenging in cases of non-secretory MM, where the absence of M-protein limits the utility of standard detection methods.5,6 According to the revised International Staging System (R-ISS) for MM, risk stratification is assessed using serum beta-2 microglobulin, albumin, lactate dehydrogenase (LDH) levels, and characterization of chromosomal abnormalities.4 In the context of MM, the clinical utility of serum beta-2 microglobulin is limited by poor specificity, as elevated levels are also observed in other hematological malignancies such as leukemia and lymphoma.7–9 These challenges underscore an urgent need for non-invasive approaches and robust disease-specific biomarkers to identify novel molecular signatures for earlier diagnosis, monitoring disease progression from asymptomatic to symptomatic stages, and improving risk stratification in MM. Recent proteomic studies have characterized the molecular landscape of MM and evaluated the use of protein-based biomarkers for diagnosis and risk stratification. Bone marrow plasma proteomics analyses have identified panels of differentially enriched proteins associated with disease stage, prognosis, and therapeutic response, supporting the value of proteomics-driven diagnostics in MM. Hsu et al identified disease-associated proteomic signatures in bone marrow plasma that distinguish MM from MGUS,10 while Cutler et al reported bone marrow interstitial fluid biomarkers, including coagulation proteins, associated with MM survival outcomes.11
Liquid biopsy is a method for molecular analysis of biofluids, most commonly derived from blood, but it can also be derived from urine, cerebrospinal fluid, ascites, and pleural fluid.12 It offers several advantages over traditional tissue biopsy approaches, including reduced invasiveness, increased monitoring frequency, and applicability in primary healthcare settings, thereby alleviating the burden on hospital resources.13 However, the identification of effective cancer biomarkers remains a significant challenge, as many candidate markers reflect the host systemic response to cancer rather than tumor-specific processes.14 Paradoxically, this characteristic can be advantageous in early-stage cancers where direct tumor-specific biomarker levels are low, and secondary effects such as immune modulation may be more pronounced.15 For instance, current breast cancer biomarkers lack sensitivity for early detection.16 To address this limitation, combined profiling of tumor- and non-tumor-derived biomarkers has shown promise in improving early diagnosis.15 Consequently, the development of biomarker signatures, rather than reliance on single biomarkers, has been shown to enhance diagnostic accuracy.17–21
Among emerging liquid biopsy components, extracellular vesicles (EVs), lipid bilayer-bound nanocarriers secreted by cells, have gained attention due to their abundance and stability in biological fluids, and encapsulated cell type-specific cargo.22–25 EVs offer advantages compared to circulating tumor cells, which are rare and heterogeneous,26 and circulating tumor DNA (ctDNA), which is often fragmented and unstable.27,28 EVs have been successfully isolated from plasma, serum, urine, cerebrospinal fluid, and saliva demonstrating their clinical utility. As with cell-based assays, EV-based biomarker panels composed of multiple disease-associated proteins, have demonstrated diagnostic and prognostic value in cancers such as breast,29 prostate,30 and lung.31 Given the complexity of MM pathogenesis and its heterogeneity among patients, a multi-parametric approach using EV-based biomarker panels could address the limitations of current diagnostics and significantly enhance diagnostic accuracy and patient management.
In MM, EVs have shown diagnostic and prognostic potential. Prior studies have identified MM-associated markers in EVs and demonstrated their detectability in both newly diagnosed and treated patients.32,33 Surface and regulatory proteins relevant to disease progression and treatment resistance have been found enriched in EVs, indicating their utility as a reflection of tumor phenotype.34,35 Although the cohort in the present study is similar in size to that of Laurenzana et al32 and smaller than the Ferreira et al33 cohort, it meets the MISEV standards by rigorously demonstrating enrichment of canonical EV markers and depletion of contaminants.36 Given the limited data available and studies supporting EV enrichment for disease-specific markers, we hypothesized that MM EVs contain additional, yet-unidentified biomarkers with diagnostic and predictive value across distinct disease stages. In this context, supervised machine-learning (ML) approaches have gained increasing attention as effective tools for biomarker discovery and disease classification.37–40 ML algorithms integrate prior knowledge with statistical, probabilistic, and optimization frameworks to identify informative patterns within large, complex, and heterogeneous datasets, enabling the discrimination of disease states based on quantitative molecular features.41 The selection of disease-relevant EV-derived features, in combination with an appropriate ML algorithm, is critical for achieving accurate and reproducible classification performance. In support of this approach, Yin et al recently demonstrated the feasibility of integrating EV proteomics with supervised ML by performing deep proteomic profiling of serum EV membrane proteins from colorectal cancer patients and constructing multiple ML-based diagnostic models, identifying a panel of EV-associated proteins with high diagnostic accuracy.42 Collectively, these studies support the integration of supervised ML with EV-based proteomic profiling as a rational and scalable strategy for biomarker discovery in complex and heterogeneous diseases such as MM.
A comparative analysis of EV cargo from both bone marrow (BM) and peripheral blood (PB) samples in MGUS and symptomatic MM, may reveal signatures that reflect the phenotypic changes during disease progression. By profiling the EV proteome across key clinical stages, namely MGUS, initial diagnosis, remission, and relapse, this study aims to identify robust biomarker signatures capable of tracking disease progression using a supervised machine-learning-based approach. Such signatures could facilitate the development of a plasma EV-based liquid biopsy, offering a minimally invasive alternative to bone marrow aspiration for disease monitoring and risk stratification.
Materials and Methods
Primary Samples: Patient Study Population and Collection
Patients diagnosed with MM and receiving treatment at the Mater Misericordiae University Hospital and the Mater Private Hospital (Dublin, Ireland) were enrolled between June 2021 and June 2022; non-myeloma control participants with no history of cancer (referred to as “normal” throughout the manuscript) were recruited from the Mater Private Hospital. This study was performed in compliance with the principles of the Declaration of Helsinki. Written informed consent was obtained from all participants. Ethical approval for the study was granted by the Mater Misericordiae University Hospital Ethics Committee (Reference: 1/378/1158). BM aspirates (3–12 mL) were collected from 13 MM patients and 10 normal samples, and PB samples (10–30 mL) from 28 MM patients and 10 normal samples (Table 1). All samples were collected using EDTA tubes. Clinical data, including treatment history and disease stage, were retrospectively obtained for all study participants.
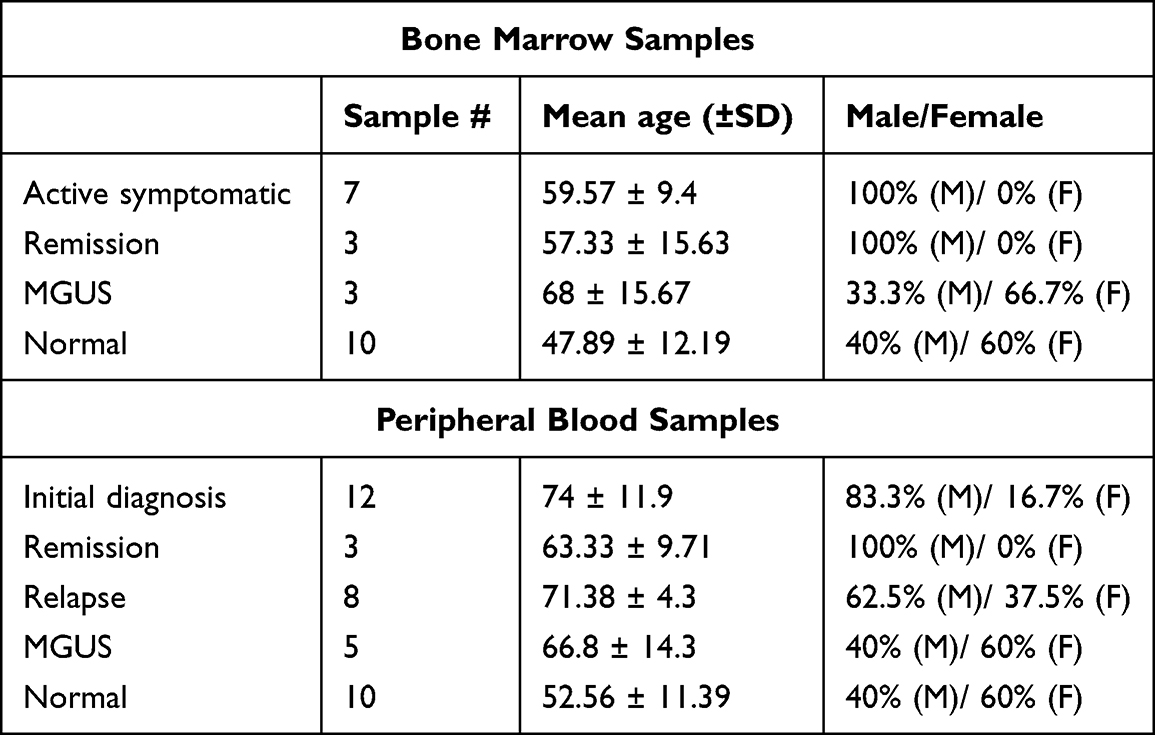 |
Table 1 The Demographic of Primary BM and PB Samples Used for Proteomic Analysis Included MM Samples Stratified into Disease Stages and Normal Samples |
Lymphoprep Gradient of Blood and Bone Marrow Samples
Peripheral blood and bone marrow samples were diluted 1:1 with Phosphate Buffered Saline (PBS). The diluted samples were then carefully layered over Lymphoprep (STEMCELL Technologies) at a 2:1 sample-to-Lymphoprep ratio to generate a discontinuous density gradient. Samples were centrifuged at 550 g for 25 min at room temperature. The plasma layer was collected and transferred to a new tube and centrifuged twice at 2500 g for 15 min to obtain platelet-poor plasma (PPP). All PPP samples were frozen at −80 °C. PPP was thawed at room temperature prior to EV isolation.
EV Isolation Standards and Validation
EVs were isolated and confirmed in compliance with the MISEV2023 recommendations,36 ensuring successful purification from BM and PB plasma.
Ultracentrifugation and Iodixanol Density Gradient for EV Isolation
PPP samples were thawed at room temperature and diluted in PBS to a final volume of 37 mL (Beckman Coulter, 38.5 mL Open-Top Thinwall Polypropylene Tube, 326823). Samples were centrifuged at 120,000 gAvg for 2 h 40 min at 20 °C (SW32Ti, Beckman Coulter, brake = 9). Centrifugation times were determined using a 50 nm cut-off size as previously described.34,43 The resulting pellet was washed in PBS and centrifuged at 120,000 gAvg for 35 min (MLA-130, Beckman Coulter, brake = 9).
The EV-enriched pellet was then subjected to density gradient ultracentrifugation to separate EVs from non-EV protein and low density lipoproteins. The pellet was resuspended in 200 µL of PBS and mixed with 670 µL of 54% iodixanol-PBS (IPBS) in a 13.5 mL ultracentrifuge tube. A discontinuous iodixanol gradient was prepared by overlaying 2 mL of 1.2 g/mL IPBS, followed by 3 mL of 1.08 g/mL IPBS. The remaining volume of the tube was filled with PBS. Samples were centrifuged at 120,000 gAvg for 15 hr at 4 °C. The EV-enriched fraction formed at the interface between 1.08–1.2 g/mL and was transferred to a new tube. This fraction was diluted in PBS to reduce the density to <1.03 g/mL in a final volume of 13.5 mL and centrifuged again for 3 hours and 15 minutes at 20 °C (SW32Ti, Beckman Coulter, brake = 9). The final EV-enriched pellet was resuspended in 100 µL of PBS and stored at −80 °C until use.
Nanoparticle Tracking Analysis
EV size distribution was assessed using a NanoSight NS300 system (Malvern Technologies, Middlesex, UK) equipped with a 488 nm laser and a high-sensitivity scientific CMOS camera. Samples were diluted in particle-free PBS (Gibco) to achieve an optimal concentration of 30–60 particles per frame. Measurements were taken under constant flow conditions (flow rate = 50) at 25 °C, with 15 videos of 60 seconds each recorded. Data analysis was performed using NTA3.2 software, applying a detection threshold of 5 and a bin size of 2.
Transmission Electron Microscopy
Formvar/carbon-coated 200-mesh copper grids were incubated with 10 μL of an isolated EV sample for 60 mins. Grids were washed three times with PBS for 2 mins each and air-dried. Samples were fixed with 2.5% glutaraldehyde for 10 mins, followed by five washes with distilled water for 2 mins each. Grids were stained with 2% uranyl acetate for 15 mins at room temperature. The grids were then briefly rinsed with ice-cold 1.8% methylcellulose and 0.4% uranyl acetate (MC/UA) before embedding in MC/UA for 10 mins on ice. The grids were air-dried at room temperature and analyzed using a transmission electron microscope (FEI Tecnai 120 kV).
Western Blot
EV proteins were extracted using RIPA lysis buffer supplemented with a protease inhibitor cocktail (Abcam, Ab201113). Lysates were incubated on ice for 10 minutes and centrifuged at 20,000 g for 30 mins at 4 °C. Protein concentration was measured using the bicinchoninic acid (BCA) assay (Thermo Fisher Scientific) according to the manufacturer’s instructions. Protein samples were denatured with 4× Laemmli buffer and heated at 95 °C for 5 mins.
Proteins were separated on 5–12% SDS-PAGE gels (Mini-PROTEAN II, Bio-Rad) at 40 mA for 50 mins and transferred to 0.45 μm PVDF membranes at 110 V for 80 mins. Membranes were blocked with 5% bovine serum albumin (BSA) in Tris-buffered saline with 0.1% Tween-20 (TBS-T) for 1 hour at room temperature.
The primary antibodies used were anti-TSG101 (1:1000 dilution, Abcam, Cambridge, UK, ab125011), anti-CD9 (1:1000, ThermoFisher, MA5-31980), mouse anti-APOE (1/1000, Santa Cruz Biotechnology, sc-390925), mouse anti-Albumin (1/1000, Santa Cruz Biotechnology, sc-51515), and mouse anti-APOB (1/500, Thermo Fisher Scientific, MA5-14671). Primary antibodies were diluted in 5% BSA in TBS-T and incubated overnight at 4 °C. Following three TBS-T washes, membranes were incubated for 1 hour at room temperature with IRDye800-conjugated goat anti-rabbit IgG (1:3000 dilution, ThermoFisher, SA5-35571) or IRDye680-conjugated goat anti-mouse IgG secondary antibodies (1:3000 dilution, ThermoFisher, 35519). Blots were washed six times for 5 minutes each, alternating between TBS-T and TBS, and visualised using the Odyssey Infrared Imaging System (LI-COR Biosciences, Nebraska, USA) with detection at 700 and 800 nm.
EV Quantification by Flow Cytometry
EV quantification was performed on the Beckman Coulter CytoFLEX LX Flow Cytometer as previously described.32,44 EVs were identified using VSSC gain = 300, VSSC-H threshold = 5500, and VSSC-width log x VSSC-H log cytogram gating to remove aggregates. The microparticle region was identified using a size gate based on 80–500 nm polystyrene reference beads and a time-based stability gate set on the time histogram.
Preparation of Samples for Mass Spectrometry
EV samples were diluted in 8 M Urea/50 mM Tris-HCl supplemented with phosphatase and protease inhibitors (Abcam). Samples were sonicated (sonicator 3000, Misonix Inc., New York, USA) for 3×8 sec and stored on ice between cycles. Protein concentration was determined at A280 using a Nanodrop 2000 spectrophotometer (Thermo Fisher Scientific). All samples were normalised to 1×10⁸ EVs.
Proteins were reduced by adding 8 mM dithiothreitol (DTT) (Fisher Scientific, USA) and incubated at 30 °C with shaking at 1000 RPM (ThermoShaker Comfort, Eppendorf, Hamburg, Germany). Carboxylation was performed by adding 20 mM iodoacetamide (VWR, Pennsylvania, USA), followed by incubation in the dark at 30 °C for 30 mins with shaking at 1000 RPM. Urea concentration was reduced to below 1 M by dilution with 50 mM Tris-HCl. Proteins were digested overnight with 1 µg of MS-grade trypsin (Pierce, Thermo Fisher Scientific, Illinois, USA, 90057) at 37 °C with shaking at 850 RPM. Digestion was terminated by acidifying the sample with 1% formic acid.
Peptide clean-up was performed using C18 columns (HyperSepTM SpinTip, Fisher Scientific). Columns were activated with 60% acetonitrile in 0.1% Tri-fluoric acid (TFA) (Merck, Germany) and centrifuged at 664 g for 2 minutes. Columns were then equilibrated with 0.1% TFA and centrifuged again to remove the buffer. Digested peptides were loaded onto the column, washed with 0.1% TFA, and eluted with 60% acetonitrile in 0.1% TFA into a final volume of 150 µL. Eluates were dried using an Eppendorf vacuum concentrator at 30 °C until completely evaporated.
Mass Spectrometry and Analysis
Samples were analyzed on a Bruker timsTof Pro mass spectrometer connected to an Evosep One liquid chromatography system. Dried peptide pellets were resuspended in 0.1% formic acid and each sample was loaded on to an Evosep tip. The Evosep tips were placed in position on the Evosep One, in a 96-tip box. The autosampler was configured to pick up each tip, elute and separate the peptides using a set chromatography method (30 samples a day).
The mass spectrometer was operated in positive ion mode with a capillary voltage of 1600 V, dry gas flow of 3 L/min and a dry temperature of 250 °C. All data was acquired with the instrument operating in trapped ion mobility spectrometry (TIMS) mode. Trapped ions were selected for MS/MS using parallel accumulation serial fragmentation (PASEF). A scan range of (100–1700 m/z) was performed at a rate of 5 PASEF MS/MS frames to 1 MS scan with a cycle time of 1.03 seconds.
Raw data were processed using MaxQuant software (version 2.0.3.0),45 with searches performed against the Homo sapiens subset of the UniProt Swiss-Prot database46 (reviewed entries only). Specific search parameters for TIMS data-dependent acquisition (TIMS-DDA) were applied. Peptide identification was filtered using a 1% false discovery rate (FDR). Label-free quantification (LFQ) was performed using the normalized protein intensity values obtained from MaxQuant.
Dataset Preparation and Preprocessing
LFQ proteomic datasets from MM PB and BM EVs were filtered to retain protein features detected in at least 50% of all samples across groups. This filtering threshold was selected to reduce technical noise while preserving biologically meaningful features, consistent with strategies adopted in previous machine learning (ML) studies.47
Data were curated to analyze EV biomarker signatures across two BM models: (1) general asymptomatic/symptomatic MM and (2) active symptomatic (AS) MM; and four PB models: (1) general asymptomatic/symptomatic MM, (2) MGUS, (3) initial diagnosis (ID), (4) and relapse (REL). The group classifications of each model are outlined in Table S1.
Data Analysis and Statistical Visualizations
Principal component analysis (PCA) was used to visualize sample clustering and assess variance between groups. Differential abundance analysis for defined clinical groups was conducted using a statistical threshold of log2 fold change > 1.5 and p < 0.05, computations carried out using the dplyr package in R. Resulting proteins were visualized through volcano plots and heatmaps generated using the SRplot online tool.48 To explore functional context, the same list of significantly altered proteins was processed for Gene Ontology (GO) and Kyoto Encyclopedia of Genes and Genomes (KEGG) pathway enrichment in SRplot. Enrichment results were visualized as dot plots, summarizing biological process and pathway categories.
Biomarker Signature Analysis
Feature Selection
To identify informative biomarkers, proteins that can reliably distinguish between different sample groups, least absolute shrinkage and selection operator (Lasso) regression was applied using the glmnet R package.49 The response variable (y) in the model was the sample class label, indicating whether a sample was classified as Normal or MM. The predictor variables (x) were the protein LFQ intensities. Lasso regression was performed with the alpha parameter set to 1, corresponding to pure L1 regularization. The optimal value of the regularization parameter (lambda) was selected via cross-validation using the cv.glmnet function. This approach shrinks the coefficients of less informative features to zero, thereby identifying the most predictive protein biomarkers while reducing model overfitting.
Classification Algorithm Selection and Model Training
To determine the optimal classification algorithm for the combinatorial biomarker signature, model selection was guided by a Monte Carlo cross-validation approach with 100 iterations. In each iteration, datasets were randomly partitioned into 70% training and 30% testing sets using stratified sampling to preserve class distributions. Multinomial logistic regression was applied to the general multiclass models encompassing asymptomatic and symptomatic MM. For the binary classification tasks of MGUS, active symptomatic MM, ID, and REL, performance was compared across three algorithms: linear support vector machine (SVM), logistic regression, and decision tree. Multiple algorithms were evaluated using the same Lasso-selected biomarkers to assess whether a fixed, biologically grounded feature set could support clinically interpretable models such as decision trees. The linear SVM model was implemented using MetaboAnalyst 6.0 (https://www.metaboanalyst.ca), logistic regression using the glm function in R, and the decision tree algorithm with the rpart R package.50
Model Evaluation and Validation
Each model’s performance was evaluated on the test sets using area under the receiver operating curve, F1 score, accuracy, sensitivity, specificity, positive predictive value (PPV), and negative predictive value (NPV). Area under the curve (AUC) is a widely used metric for calculating diagnostic accuracy, reflecting the trade-off between sensitivity and specificity across various threshold values.51–53 Accuracy measures the proportion of the correctly predicted cases. Sensitivity indicates the model’s ability to correctly identify positive cases, while specificity reflects its ability to correctly identify negative cases. PPV measures the proportion of predicted positives that are true positives, and NPV indicates the proportion of predicted negatives that are true negatives. The F1 score is the harmonic mean of PPV and sensitivity, a balanced measure of classification performance that is particularly informative in the presence of class imbalance.54 The classification algorithm that consistently achieved the highest performance across these metrics was selected as the optimal model for each binary task.
Statistical Analysis and Visualization
Statistical analyses were performed to assess differential protein abundance among samples from normal controls, patients with MGUS, and MM patients at initial diagnosis, remission, and relapse. Statistical significance for two-group comparisons was assessed using an unpaired two-tailed Welch’s t-test, while pairwise comparisons among multiple groups were performed using unpaired two-tailed Welch’s t-tests. All analyses and data visualization were performed in R version 4.4.1. ROC curves were generated using ggplot2, with confidence intervals estimated based on variability observed across iterations.
Results
Patient Characteristics and Sampling
BM aspirates were obtained from 13 patients with MM and 10 normal controls, and PB samples from 28 MM patients and 10 normal controls. Patient samples collected were at various stages of disease progression, ranging from MGUS to symptomatic MM, including stages of initial diagnosis, remission, and relapse (Table 1). Patients in the initial diagnosis group were receiving treatment for MM but had not yet achieved their first remission. Remission samples were collected from patients who had undergone autologous stem cell transplantation (ASCT) and met clinical criteria for complete response with no detectable disease at the time of sampling. Relapse samples were obtained from patients who had previously achieved remission following ASCT but had since experienced disease recurrence. No uniform therapeutic pattern was observed in the MM cohort, with patients receiving diverse treatment regimens (Table S1).
Isolation and Mass Spectrometry Characterization of EVs from Control and MM BM and PB Plasma
Successful EV isolation was confirmed by transmission electron microscopy (TEM) which revealed the characteristic cup-shaped morphology and EV size distribution of approximately 200 nm in BM and PB samples, with representative images of each sample type (Figure 1A and B). An average particle size of 200 nm was confirmed by NTA (Figure 1C). Western blot analysis showed enrichment of the internal EV marker, TSG101 and EV surface marker CD9 in the EV fractions. Concurrently, a marked reduction in plasma contaminants in PB EV samples and matched whole plasma, including albumin, high-density lipoprotein (HDL) marker Apolipoprotein E (ApoE), and low-density lipoprotein (LDL) marker Apolipoprotein B (ApoB), confirmed successful enrichment of EVs using the combined UC and DG-UC approach (Figure 1D). Additionally, EV quantification by flow cytometry demonstrated a similar EV concentration in normal and MM PB and BM plasma (Figure S1). Mass spectrometry-based EV proteomic profiling was conducted to characterize the protein cargo of BM and PB-derived EVs. This provided label-free quantification of EV-associated proteins across clinical stages of MM and control samples. The resulting proteomic data was used for downstream analyses, including differential protein abundance, dimensionality reduction, feature selection, and ML implementations for biomarker signature identification.
 |
Figure 1 Confirmation of plasma EV isolation from BM and PB samples following MISEV2023 guidelines. Representative negative staining transmission electron microscopy of EVs isolated from (A) BM and (B) PB plasma samples. (C) Nanoparticle tracking analysis of the PB plasma EVs was carried out to determine their size distribution. The data shown represent a representative sample, and values were calculated as the mean of 15 video recordings (60 s each). (D) Western blot analysis of PB plasma EVs and complete plasma probed with primary antibodies for EV markers (TSG101, CD9) and plasma contaminant markers (Albumin, ApoB, ApoE). |
Characterization and Differential Abundance Analysis of BM-Isolated EVs
Principal component analysis (PCA) of BM EV proteomes from MM patients revealed separation between normal controls and MM disease stages with a partial overlap between clusters (Figure 2A). Due to the lower number of BM samples, patients at initial diagnosis and relapse were combined into the active symptomatic (AS) MM group (ID + REL). Normal samples displayed broader variability, primarily extending along the positive axis of principal component 1 (PC1). In contrast, MM samples including MGUS, AS, and REM clustered more compactly along the negative axis of PC1. MGUS samples occupied an intermediate position between normal and AS, while REM partially overlapped with both MGUS and AS but extended further along PC1. These patterns suggest a separation between MM and normal groups, indicative of disease-associated proteomic alterations in BM-derived EVs.
 |
Figure 2 (A) Two-dimensional principal component analysis (PCA) of MM BM EV samples showing group clusters. (B and D) Heatmaps of the most significantly decreased‑in‑abundance proteins (by fold-change) in BM EVs from (B) monoclonal gammopathy of undetermined significance (MGUS) and symptomatic MM, and (D) active symptomatic (AS) MM, compared to respective disease controls. Heatmaps display the average values of technical duplicates. (C) Volcano plot of differentially expressed proteins in AS MM vs normal and MGUS. Significance thresholds: p < 0.05; log2FC ≥ 1.5. |
Differential proteomic analysis of BM EVs from MM patients compared to normal controls revealed significant changes in protein abundance. Heatmaps were generated to visualize the most significantly increased and decreased protein abundances, using a log2 fold-change threshold of >1.5 (p < 0.05) in both general asymptomatic/symptomatic MM as well as the AS MM groups compared to their respective controls (Detailed group classifications outlined in Table S1). Notably, no proteins met this fold change threshold for increased abundance in both comparisons. Among the many proteins showing significantly decreased abundance, the top 10 are highlighted in the heatmaps (Figure 2B and D). In the AS MM group, 31 proteins were significantly decreased relative to normal and MGUS samples, whereas no proteins met the threshold for increased abundance, indicating that MM-associated alterations in BM EV cargo are dominated by loss or reductions in specific protein functions (Figure 2C). Furthermore, gene ontology and pathway enrichment analysis in AS MM revealed enrichment in immune response activation (Figure S2).
MM BM EV Biomarker Signature Analysis Using Machine Learning
Building on the differential-abundance patterns identified above, ML was used to refine biomarker selection. Mass-spectrometry profiling detected more than 1700 proteins, yet the patient cohort was much smaller. A relatively large number of features with respect to the number of samples can lead to overfitting, which is when a model matches the data it was trained on well but fails to perform in unseen data.55,56 Accordingly, Lasso regression was applied for feature selection in the development of diagnostic and stratification models for MM using BM EV proteomic data as the method effectively eliminates the coefficients of less informative features to zero. From this analysis, complement C8 gamma chain (C8G), glioma pathogenesis-related 2 (GLIPR2), fibrinogen gamma chain (FGG), and alpha-enolase (ENO1) were identified as candidate biomarkers for distinguishing general asymptomatic/symptomatic MM cases.
A multinomial logistic-regression model based on the four machine-learning-selected markers (C8G, GLIPR2, FGG, ENO1) achieved 74% accuracy, with 75% sensitivity and 87% specificity. Notably, these proteins were not among the ten most differentially abundant proteins ranked by fold change (Figure 2B), underscoring the value of multivariate selection in uncovering optimal biomarkers beyond the largest individual fold-change magnitude. The binary diagnostic models were trained and tested using linear support vector machine (SVM), logistic regression, and decision tree algorithms (Table S3). Logistic regression demonstrated the best overall performance. Specifically, the AS MM model achieved an accuracy of 0.93, with a sensitivity of 90% and specificity of 95%.
Among the biomarkers identified in the multiclass-model, C8G was also found to be significantly altered in abundance in both the asymptomatic and symptomatic MM groups compared to normal controls (Figure 3A). FGG and ENO1 were selected in the AS MM model, in which ENO1 was significantly decreased in abundance (Figure 4A), with sample‑level separation further displayed in the heatmap (Figure S3).
 |
Figure 3 Label-free quantitation (LFQ) intensity distributions and ROC curve for ML‑selected protein markers in the general asymptomatic/symptomatic MM BM EV multinomial model. (A) Boxplots show the distributions of LFQ intensities for each protein (C8G, GLIPR2, FGG, ENO1), with pairwise unpaired Welch’s t‑test comparisons across normal (N; n=10), monoclonal gammopathy of undetermined significance (MGUS; n=3), and active symptomatic/remission (AS/REM; n=10) groups. Individual sample values are displayed as jittered points. Significance is indicated as p ≤ 0.05 (*) and p ≤ 0.01 (**). (B) ROC curve showing the performance of the multinomial logistic regression model on the training (red) and test (blue) sets, with shaded 95% confidence intervals. |
 |
Figure 4 Label-free quantitation (LFQ) intensity distributions and ROC curve for ML–selected protein markers in active symptomatic MM BM EV model. (A) Boxplots show the distributions of LFQ intensities for each protein (FGG and ENO1), with unpaired Welch’s t‑test comparisons across normal and monoclonal gammopathy of undetermined significance (N, MGUS; n=13), and active symptomatic (AS; n=7) groups. Individual sample values are displayed as jittered points with optimal cut-off points indicated by dashed lines. Distributions are compared against respective non-target disease samples. Significance is indicated as p ≤ 0.05 (*). (B) ROC curve showing performance of the logistic regression model on training (red) and test (blue) sets, with shaded 95% confidence intervals. |
Receiver operating characteristic (ROC) curve analysis, which plots sensitivity against 1-specificity, was used to evaluate the diagnostic performance of models. AUC scores for each model, evaluated on both training (70%) and test (30%) datasets, are presented in Figures 3B and 4B. Both multinomial and binary logistic regression models demonstrated strong performance on unseen data, achieving AUC scores of 0.89 and 0.94, respectively. AUC ranges from 0.5 (no better than chance) to 1.0 (perfect discrimination), with values above 0.80 generally considered clinically useful.57
Characterization and Differential Abundance Analysis of PB-Isolated EVs
Having shown that the ML-assisted pipeline identifies a high-performing protein signature in BM EVs from MM patients, the approach was applied to PB EVs, an essential step toward a practical liquid biopsy. The analysis aimed to determine (i) whether the optimal PB markers overlap with or differ from the BM signature and (ii) how well PB EV profiles capture the various clinical stages of MM.
MM PB EV samples were stratified into four clinical categories: MGUS, initial diagnosis (ID), remission (REM), and relapse (REL). PCA of PB EV proteomes from MM patients revealed partial separation between normal controls and MM disease stages (Figure 5A), although the separation was less pronounced compared to BM EVs (Figure 2A). Despite overlap, the normal samples were more broadly distributed along the negative axis of PC1 and the positive axis of PC2. In contrast, MM samples including MGUS, ID, REM, and REL formed a more compact cluster near the origin of the PCA plot. ID samples were predominantly centered, while REL samples extended slightly towards the positive end of PC1. MGUS and REM samples clustered closely, with REM showing greater spread toward the negative axis of PC1. Similar to the clustering observed in MM BM EV samples, these patterns suggest partial separation between MM and normal samples, although clear differentiation among individual MM stages was not evident. Differential abundance analysis was conducted to identify proteins with significantly increased and decreased abundance in PB EVs across various MM stages. Heatmaps were generated for general asymptomatic/symptomatic MM, as well as specific groups including MGUS, ID, and REL, each compared to their respective controls, using a log2 fold-change threshold of >1.5 (Figure 5B, C, E, F, H, I, K and L). The heatmaps display the top 10 proteins with the most significant changes in abundance if the number meeting the threshold is ≥10; otherwise, all relevant proteins are shown. In the MGUS, ID, and REL groups, 182, 13, and 187 proteins showed significantly decreased abundance, respectively, while 1, 6, and 9 proteins showed increased abundance, all meeting the fold change threshold (Figure 5D, G and J). Thus, similar to the pattern observed in the MM BM EV proteome, MM-associated changes in the PB EV proteome were characterized by a marked predominance of proteins showing decreased rather than increased abundance. Moreover, PB EVs revealed hundreds of stage-specific protein changes, indicating that PB contains a discernible MM signature.
 |
Figure 5 (A) Two-dimensional principal component analysis (PCA) of MM PB EV samples showing group clusters. Heatmaps of the most significantly increased and decreased‑in‑abundance proteins (by fold-change) in PB EVs from (B and C) asymptomatic and symptomatic MM, (E and F) monoclonal gammopathy of undetermined significance (MGUS), (H and I) initial diagnosis (ID), and (K and L) relapse (REL) compared to respective controls. Heatmaps display the average values of technical duplicates. (D, G and J) Volcano plot of differentially expressed proteins in MGUS, ID, and REL. Significance thresholds: p < 0.05; log2FC ≥ 1.5. |
Gene ontology and pathway enrichment analysis confirmed stage-specific biological relevance of the differentially abundant EV-associated proteins (Figure S4). The MGUS group showed enrichment in actin filament regulation (Figure S4A), whereas the ID group was enriched in coagulation and complement cascades (Figure S4B), and the REL group was enriched in homeostasis and platelet activation (Figure S4C).
MM PB EV Biomarker Signature Analysis Using Machine Learning
Lasso regression identified six proteins with strong diagnostic and stratification potential for both the general multiclass model (asymptomatic/symptomatic MM) (Figure 6A) and for the three binary classification models of MGUS, ID, and REL (Figure 6B).
 |
Figure 6 Divergence plot showing coefficients of the selected optimal protein markers via Lasso regression across (A) the general asymptomatic/symptomatic multinomial MM PB EV model and (B) the three binary MM PB EV models diagnostic models. The plot highlights the marker selection and feature importance of the refined set of biomarkers based on their robust performance across various combinations. |
The multinomial logistic regression model for MM PB EVs achieved an accuracy of 0.87 with a sensitivity of 87% and specificity of 93%. Binary classification models were trained and tested using the same three algorithms (linear SVM, logistic regression, and decision tree) (Table S4). Among these, logistic regression consistently demonstrated superior performance across all binary MM PB EV diagnostic and stratification models. The MGUS model demonstrated an accuracy of 0.96 (Sensitivity = 100%, Specificity = 94%). The ID model showed an accuracy of 0.85 (Sensitivity = 81%, Specificity = 89%), while the REL model achieved an accuracy of 0.89 (Sensitivity = 87%, Specificity = 91%).
In the MGUS group, apolipoprotein C1 (APOC1), one of the ML-selected biomarkers, was the only protein to show a significant increase in abundance and to meet the fold-change threshold (Figure 5E). For the ID group, delta-aminolevulinic acid dehydratase (ALAD), although not among the top 10 proteins with the most decreased abundance by fold-change, ALAD displayed the most consistent low abundance (blue signal) across all normal samples, suggesting strong and uniform abundance in the normal group. This clear separation was not observed for most other proteins with decreased abundance in this comparison (Figures 5I and Figure S5B). Galectin-1 (LGALS1), another biomarker identified by ML for the ID group, showed the third most significantly increased abundance (Figure 5H). For the REL group, DNAX accessory molecule-1 (CD226), another ML-selected biomarker, did not rank among the top 10 proteins with decreased abundance (Figure 5L). Importantly, although not all markers were among the most significantly altered in abundance, all markers achieved statistical significance in their respective comparisons (p<0.05) (Figure 5D, G and J). These findings indicate that the selection of optimal MM EV proteomic markers involves evaluating multi-protein combinations that can accurately distinguish sample groups (Figure 7A) and individual significant differential abundance (Figure 8A, C, and E). Across all models, AUC scores on the test dataset were comparable to those on the training dataset, indicating good generalizability. Specifically, the AUC scores for the general asymptomatic/symptomatic MM, MGUS, ID, and REL models using logistic regression were 0.95, 1, 0.91, and 0.95, respectively, on the test dataset (Figures 7B, 8B, D, and F). Heatmaps for each ML-selected biomarker across the three binary classification models are presented in Figure S5A–S5C.
 |
Figure 7 Label-free quantitation (LFQ) intensity distributions and ROC curve for ML–selected protein markers in general asymptomatic and symptomatic MM PB EV multinomial model. (A) Boxplots show the distributions of LFQ intensities for each protein (ALAD, S100A7, APOC1, LGALS1, and CD226), with pairwise unpaired Welch’s t‑test comparisons across normal (N; n=10), monoclonal gammopathy of undetermined significance (MGUS; n=5), and initial diagnosis, relapse, and remission (ID, REL, REM; n=23) groups. Individual sample values are displayed as jittered points. Significance is indicated as p ≤ 0.05 (*), p ≤ 0.01 (**), and p ≤ 0.001 (***). (B) ROC curve showing performance of the multinomial logistic regression model on training (red) and test (blue) sets, with shaded 95% confidence intervals. |
 |
Figure 8 Label-free quantitation (LFQ) intensity distributions and ROC curve for ML–selected protein markers in monoclonal gammopathy of undetermined significance (MGUS), initial diagnosis, and relapse PB EV models. (A) Boxplots show the distributions of LFQ intensities for KRT78 and APOC1 in the MGUS model (n=5), (C) ALAD and LGALS1 in the initial diagnosis (ID; n=12) model, (E) CD226 in the relapse (REL; n=8) model. For each model, unpaired Welch’s t‑tests were performed against the respective non‑target disease samples, including normal (N; n=10) and remission (REM; n=3) groups. Individual sample values are displayed as jittered points, with optimal cut‑off values indicated by dashed lines. Significance is indicated as p ≤ 0.05 (*) and p ≤ 0.001 (***). (B, D and F) ROC curves showing the performance of the three‑MM PB EV logistic regression models on the training (red) and test (blue) sets, with shaded 95% confidence intervals. |
Discussion
The diagnosis and management of MM remain complex and resource-intensive, particularly in an aging population where comorbidities complicate clinical decision-making.58 Despite major advances in therapeutic options, early and accurate diagnosis remains challenging due to the biological heterogeneity of the disease. The current diagnostic framework, based on SLiM-CRAB criteria, enables identification of MM through evidence of end-organ damage (CRAB: hypercalcemia, Renal insufficiency, Anemia, and Bone lesions) and by high-risk biomarkers (SLiM: ≥60% clonal plasma cells in BM, Light chain ratio ≥100, or ≥5 mm focal lesions on MRI).59 However, the reliance on invasive BM procedures may delay diagnosis and intervention. Imaging modalities such as whole-body MRI have enabled earlier detection of disease activity prior to overt bone destruction. Nonetheless, diagnostic performance remains imperfect. Whole-body MRI has a sensitivity of 63% and specificity of 83%, improving only when corroborated by PET-CT.60 While combination with PET-CT offers higher accuracy, it involves radiation exposure and limited patient comfort. Innovative approaches like dual-energy CT (DECT), supported by artificial intelligence (AI), are emerging as a diagnostic method even in the absence of osteolytic lesions; however, sensitivity and specificity remain limited at approximately 63% and 71%, respectively.61 Conventional electrophoretic M-protein and serum free light-chain assays provide robust tools for MM burden; however, their sensitivity is limited at low disease levels due to interference from the polyclonal immunoglobulin background, a limitation reflected by the International Myeloma Working Group.4,62,63 Immunoglobulin-related signals observed in this study were selectively enriched in BM EVs and largely absent from PB EVs, consistent with disease-site-specific biology and not background noise.
To overcome current diagnostic limitations, this study profiled EV proteomes to uncover biomarkers that can improve MM detection. BM and PB samples were collected from participants with MGUS, various stages of MM, and non‑myeloma controls with no history of cancer. EVs were isolated from PPP and subjected to proteomic profiling and comparative analysis. TEM confirmed the expected cup‑shaped vesicular morphology, and NTA measurements showed average particle sizes of approximately 200 nm, consistent with EV characteristics. Western blot analysis of plasma and plasma‑derived EVs demonstrated enrichment of the EV‑associated markers CD9 and TSG101, together with a marked reduction in plasma proteins albumin, ApoE, and ApoB, indicating effective depletion of soluble contaminants and successful EV isolation. Overall, these evaluations aligned with MISEV2023 guidelines and confirmed the suitability of the EV preparations for downstream biomarker‑discovery analyses. Comprehensive proteomic analysis of BM‑ and PB‑derived EVs revealed significant alteration in protein abundance across disease stages.
ML algorithms were then applied to analyze data from BM and PB across key disease stages (MGUS, AS MM (ID + REL), ID, and REL). The models generated demonstrated strong diagnostic performance (AUC, sensitivity, specificity, PPV, and NPV) within their respective compartments of BM and PB samples. Notably, the optimal EV biomarkers identified in BM differed from those in PB, suggesting that the local tumor microenvironment and systemic circulation have distinct EV proteomic signatures. Applying BM‑derived markers to PB samples substantially reduced diagnostic accuracy (sensitivity <60%), underscoring the need for compartment‑specific biomarker development. Although different from the BM panel, PB EV signature was able to distinguish MGUS, initial diagnosis, and relapse with high accuracy. Enrichment for homeostasis and platelet-activation pathways in the relapse group was consistent with extramedullary disease.63 The PB EV-based diagnostic models developed using logistic regression for MGUS, ID, and REL stages, demonstrated strong diagnostic performance with AUC values ≥ 0.91, sensitivities ≥ 0.81, specificities ≥ 0.89, PPVs ≥ 0.89, and NPVs ≥ 0.88. These metrics exceed the diagnostic accuracy of current imaging modalities such as whole-body MRI and emerging approaches, including DECT, underscoring the clinical promise of EV-based liquid biopsies. ML played a critical role in enhancing model performance through intelligent selection of biomarker combinations. Unlike traditional approaches based solely on statistical significance (eg, t-tests, ANOVA),64 our ML pipeline prioritized features with consistent protein abundance patterns across patient samples. This approach improved model reproducibility and robustness, as illustrated in the divergence plots and heatmaps of selected markers (Figures 6 and S5). The ability to detect MM with such precision offers meaningful clinical benefits, particularly in reducing reliance on invasive bone marrow biopsies. Future validation in a larger cohort will be essential to confirm these findings. Overall, this study demonstrates the potential of EVs as a source of MM biomarkers. Their stability in plasma preserves cargo integrity, enabling reliable downstream analyses.22
This study builds on prior evidence that myeloma-associated EV cargo is a promising substrate for liquid-biopsy assays. Harshman et al first identified myeloma-associated proteins in circulating EVs.65 The study, however, focused on only a single biomarker (CD44) and did not report standard EV markers or impurity controls, as it pre-dated current MISEV guidelines. Laurenzana et al demonstrated miRNA EV-based differences in MM vs healthy subjects, although EV-marker validation was not included.32 More recently, Brennan et al reported that plasma EVs from MM patients carry the myeloma surface marker CD38, even in individuals receiving the anti-CD38 antibody daratumumab, along with elevated levels of the complement regulators CD55 and CD59.34 Notably, CD55 and CD59 are implicated in immune evasion and treatment resistance in MM.35 These findings suggest that circulating EVs can reflect the phenotype of bone marrow-resident myeloma cells, even after therapy, making them suitable candidates for monitoring therapeutic response and emerging resistance. A 2022 study proposed a four-protein EV signature (PDIA3, C4BPA, BTN1A1, TNFSF13) derived from PB EVs for MGUS, MM, responder, and non-responder detection. However, the MM cohorts lacked stratification by disease stage (at initial diagnosis, remission, or relapse),33 highlighting the need for MM stage-specific EV biomarkers. Moreover, it confirmed only CD9 and ApoA1 by immunoblot, falling short on the MISEV recommendations. The present study improved on this by profiling the PB EV proteome across distinct MM stages and meeting the full MISEV2023 criteria, yielding a validated EV proteome that provides additional MM stage-specific diagnostic information. This dataset can be integrated with public datasets and validated in a larger cohort to support consensus biomarker discovery.
This study has certain limitations, including incomplete age- and sex-matching across patient and control groups. Although sex matching was not fully uniform, the male predominance of subjects reflects the established epidemiology of MM, in which a higher prevalence occurs in males (54–57%),66,67 supporting the real-world relevance of the cohort. In addition, while the cohort size is modest relative to the dimensionality of the proteomic dataset, this study was designed as a discovery-phase analysis to identify candidate biomarkers. The promising diagnostic and predictive signatures identified here warrant further validation in a larger, well-characterized cohort to confirm their robustness and clinical applicability.
Several markers are supported biologically by existing literature reports. In BM, ENO1, a glycolytic enzyme linked to poor MM prognosis,68–70 was unexpectedly decreased in abundance in AS MM EVs versus MGUS and controls, suggesting stage-specific vesicle packaging or microenvironmental modulation. FGG, a coagulation protein linked to poor prognosis in hepatocellular carcinoma,71–74 was markedly increased in AS MM, underscoring its pathogenic role.75 In AS MM, heightened cytokines, particularly during immunotherapy, can activate NF-κB, provoking systemic inflammation and pro-coagulant effects contributing to MM progression.1,76 In PB, for MGUS diagnosis, APOC1 and KRT78 emerged as promising candidates. APOC1, a very low-density lipoprotein component and a macrophage-associated ovarian cancer prognostic marker, was markedly elevated in MGUS, consistent with emerging links between lipid metabolism and macrophage biology in MM.77–79 KRT78, a cytoskeletal keratin linked to immune infiltration and prognosis in head-and-neck cancer,80 was reduced in MGUS EVs, consistent with evidence that keratin loss enhances MMP2/9-mediated invasion,81 mechanisms that are also relevant to MM EV biology.44 Two PB EV biomarkers, ALAD and LGALS1, were selected as the ID model. ALAD, a heme biosynthesis enzyme and endogenous 26S proteasome inhibitor, is linked to bortezomib sensitivity and associated with poor prognosis in solid tumours.82 Numerous studies reported associations between reduced ALAD abundance and disrupted proteostasis in cancer.83,84 LGALS1, elevated in PB EVs, promotes immunosuppression, angiogenesis, and hypoxia in MM.85 Its upregulation in CD138⁺ cells from newly diagnosed, but not in MGUS, smoldering MM, or relapsed patients, underscores its stage-specific relevance.86,87 In relapsed patients, CD226, an activating receptor on NK and T cells, showed significantly decreased abundance.88,89 This finding aligns with previous reports linking CD226 loss to reduced immune surveillance and MM therapy efficacy.90 Notably, four out of six MM PB EV markers, including APOC1, S100A7, LGALS1, and CD226 are linked to immune modulation, consistent with the characteristic of progressive immune dysfunction observed in MM. S100A7, CD226, ALAD, and KRT78, four of the six PB EV signature proteins showed decreased abundance, reflecting the broader PB EV proteomic landscape across disease stages, where substantially more proteins were reduced than increased. This pronounced imbalance suggests a dominant biological process characterized by selective reduction of EV-associated proteins. Accordingly, this global pattern of reduced EV protein abundance, together with the identified biomarker panels, may provide complementary diagnostic information and enhance the ability to monitor MM progression.
Conclusion
In conclusion, this study demonstrates the diagnostic potential of MM peripheral blood EV proteomic profiling, achieving high accuracy across multiple disease stages. Focusing on specific protein biomarkers overcomes limitations of M-protein assays, such as background immunoglobulin noise and limited utility in non-secretory subtypes. By leveraging the inherent properties of EVs, and incorporating machine learning, this approach may complement or exceed current diagnostic standards, supporting a future of non-invasive, biomarker-driven disease monitoring and earlier intervention in MM.
Data Sharing Statement
The mass spectrometry proteomics data have been deposited to the ProteomeXchange Consortium via the PRIDE91 partner repository with the dataset identifier PXD069556. The source code for the full analysis pipeline, including data preprocessing, feature selection, model training, testing, and result visualization, was deposited in the following repository https://github.com/Angelique28/MachineLearningAlgorithms.
Patient Consent Statement
Informed consent was obtained from all patients.
Acknowledgments
We thank all the patients who consented to the use of their samples in this study and the staff at the Mater (University and private) Hospital for collecting the samples. We are particularly indebted to the patient advocates and members of Multiple Myeloma Ireland (Mary Kelly, Ann Flemming, Dermot O’Leary, Joe O’Brien) who were part of the Patient and Public Involvement panel for Rebecca Sheridan PhD advisory group. We would also like to acknowledge the support provided by Alfonso Blanco at the UCD Flow Cytometry Core Facility for his expertise in flow cytometry and Kieran Wynne from Systems Biology Ireland for his contributions to mass spectrometry analysis.
Author Contributions
Margaret Mc Gee conducted the conception and study design, and all of the authors made a significant contribution to the work reported, whether that is in the execution, acquisition of data, analysis and interpretation, or in all these areas; took part in drafting, revising or critically reviewing the article; gave final approval of the version to be published; have agreed on the journal to which the article has been submitted; and agree to be accountable for all aspects of the work.
Funding
This work is funded by the University College Dublin School of Biomolecular and Biomedical Science Research Scholarship awarded to Angelique Cheryl and the Irish Cancer Society Research Scholarship CRS19SHE awarded to Rebecca Sheridan. The work was also supported by SFI Infrastructure Programme Award (21/RI/9718) and the Twinflag consortium (HORIZON-WIDERA-2021-ACCESS-03-01/101079489).
Disclosure
The technology and methods described in this study are protected by a pending patent application (Application No. GB2522536.8). The authors report no other conflicts of interest in this work.
References
1. Lu Q, Yang D, Li H, Niu T, Tong A. Multiple myeloma: signaling pathways and targeted therapy. Mol Biomed. 2024;5(1):25. doi:10.1186/s43556-024-00188-w
2. Hameed A, Ali J, Munawar K, Arshad F, Badar F, Siddiqui N. Characteristics and outcomes of patients with multiple myeloma: data from a developing country. Med J Islam Repub Iran. 2018;32(1):1–21. doi:10.14196/mjiri.32.1
3. Thorsteinsdottir S, Dickman PW, Landgren O, et al. Dramatically improved survival in multiple myeloma patients in the recent decade: results from a Swedish population-based study. Haematologica. 2018;103(9):e412–e415. doi:10.3324/haematol.2017.183475
4. Palumbo A, Avet-Loiseau H, Oliva S, et al. Revised international staging system for multiple myeloma: a report from international myeloma working group. J Clin Oncol. 2015;33(26):2863–2869. doi:10.1200/JCO.2015.61.2267
5. Charliński G, Jurczyszyn A. Non-secretory multiple myeloma: diagnosis and management. Adv Clin Exp Med. 2021;31(1):95–100. doi:10.17219/acem/141455
6. Rajkumar SV, Lacy MQ, Kyle RA. Monoclonal gammopathy of undetermined significance and smoldering multiple myeloma. Blood Rev. 2007;21(5):255–265. doi:10.1016/j.blre.2007.01.002
7. Rossi D, Fangazio M, De Paoli L, et al. Beta-2-microglobulin is an independent predictor of progression in asymptomatic multiple myeloma. Cancer. 2010;116(9):2188–2200. doi:10.1002/cncr.24959
8. Amaya-Chanaga CI, Rassenti LZ. Biomarkers in chronic lymphocytic leukemia: clinical applications and prognostic markers. Best Pract Res Clin Haematol. 2016;29(1):79–89. doi:10.1016/j.beha.2016.08.005
9. Shang Y, Fu X, Chang Y, Li Y, Zhang M. B2 microglobulin is a novel prognostic marker of Angioimmunoblastic T-cell lymphoma. Sci Rep. 2018;8(1):12907. doi:10.1038/s41598-018-31212-z
10. Hsu JS, Yadav U, Garapati K, et al. Defining the proteome of bone marrow plasma in multiple myeloma and monoclonal gammopathy of undetermined significance. Blood Cancer J. 2025;15(1):202. doi:10.1038/s41408-025-01417-3
11. Cutler S, Trottier A, Gaston D, et al. Identification of novel protein biomarkers in bone marrow interstitial fluid links coagulation cascade proteins to survival outcomes in multiple myeloma. Blood. 2024;144(Supplement 1):1876. doi:10.1182/blood-2024-193994
12. Nikanjam M, Kato S, Kurzrock R. Liquid biopsy: current technology and clinical applications. J Hematol Oncol. 2022;15(1):131. doi:10.1186/s13045-022-01351-y
13. Kwapisz D. The first liquid biopsy test approved. Is it a new era of mutation testing for non-small cell lung cancer? Ann Transl Med. 2017;5(3):46. doi:10.21037/atm.2017.01.32
14. Connal S, Cameron JM, Sala A, et al. Liquid biopsies: the future of cancer early detection. J Transl Med. 2023;21(1):118. doi:10.1186/s12967-023-03960-8
15. Crosby D, Bhatia S, Brindle KM, et al. Early detection of cancer. Science. 2022;375(6586):eaay9040. doi:10.1126/science.aay9040
16. Loke SY, Lee ASG. The future of blood-based biomarkers for the early detection of breast cancer. Eur J Cancer. 2018;92:54–68. doi:10.1016/j.ejca.2017.12.025
17. Bast RC, Klug TL, John EST, et al. A radioimmunoassay using a monoclonal antibody to monitor the course of epithelial ovarian cancer. N Engl J Med. 1983;309(15):883–887. doi:10.1056/NEJM198310133091503
18. Kang KN, Koh EY, Jang JY, Kim CW. Multiple biomarkers are more accurate than a combination of carbohydrate antigen 125 and human epididymis protein 4 for ovarian cancer screening. Obstet Gynecol Sci. 2022;65(4):346–354. doi:10.5468/ogs.22017
19. Urban N, McIntosh MW, Andersen MR, Karlan BY. Ovarian cancer screening. Hematol Oncol Clin North Am. 2003;17(4):989–1005. doi:10.1016/S0889-8588(03)00063-7
20. Ahmed AA, Abdou AM. Diagnostic accuracy of CA125 and HE4 in ovarian carcinoma patients and the effect of confounders on their serum levels. Curr Probl Cancer. 2019;43(5):450–460. doi:10.1016/j.currproblcancer.2018.12.004
21. Buamah P. Benign conditions associated with raised serum CA-125 concentration. J Surg Oncol. 2000;75(4):264–265. doi:10.1002/1096-9098(200012)75:4<264::AID-JSO7>3.0.CO;2-Q
22. Liu J, Chen Y, Pei F, et al. Extracellular vesicles in liquid biopsies: potential for disease diagnosis. BioMed Res Int. 2021;2021(1):6611244. doi:10.1155/2021/6611244
23. Chang L, Ni J, Zhu Y, et al. Liquid biopsy in ovarian cancer: recent advances in circulating extracellular vesicle detection for early diagnosis and monitoring progression. Theranostics. 2019;9(14):4130–4140. doi:10.7150/thno.34692
24. Chang WH, Cerione RA, Antonyak MA. Extracellular vesicles and their roles in cancer progression. In: Robles-Flores M editor. Cancer Cell Signaling. Vol 2174. Methods in Molecular Biology. Springer US; 2021:143–170. doi:10.1007/978-1-0716-0759-6_10
25. Xie F, Zhou X, Fang M, et al. Extracellular vesicles in cancer immune microenvironment and cancer immunotherapy. Adv Sci. 2019;6(24):1901779. doi:10.1002/advs.201901779
26. Chaffer CL, Weinberg RA. A perspective on cancer cell metastasis. Science. 2011;331(6024):1559–1564. doi:10.1126/science.1203543
27. Sedlackova T, Repiska G, Celec P, Szemes T, Minarik G. Fragmentation of DNA affects the accuracy of the DNA quantitation by the commonly used methods. Biol Proced Online. 2013;15(1):5. doi:10.1186/1480-9222-15-5
28. Ignatiadis M, Lee M, Jeffrey SS. Circulating tumor cells and circulating tumor DNA: challenges and opportunities on the path to clinical utility. Clin Cancer Res. 2015;21(21):4786–4800. doi:10.1158/1078-0432.CCR-14-1190
29. Tian F, Zhang S, Liu C, et al. Protein analysis of extracellular vesicles to monitor and predict therapeutic response in metastatic breast cancer. Nat Commun. 2021;12(1):2536. doi:10.1038/s41467-021-22913-7
30. Sequeiros T, Rigau M, Chiva C, et al. Targeted proteomics in urinary extracellular vesicles identifies biomarkers for diagnosis and prognosis of prostate cancer. Oncotarget. 2017;8(3):4960–4976. doi:10.18632/oncotarget.13634
31. Novikova SE, Soloveva NA, Farafonova TE, Tikhonova OV, Liao PC, Zgoda VG. Proteomic signature of extracellular vesicles for lung cancer recognition. Molecules. 2021;26(20):6145. doi:10.3390/molecules26206145
32. Laurenzana I, Trino S, Lamorte D, et al. Analysis of amount, size, protein phenotype and molecular content of circulating extracellular vesicles identifies new biomarkers in multiple myeloma. Int J Nanomed. 2021;16:3141–3160. doi:10.2147/IJN.S303391
33. Ferreira BV, Carneiro EA, Pestana C, et al. Patient-derived extracellular vesicles proteins as new biomarkers in multiple myeloma - a real-world study. Front Oncol. 2022;12:860849. doi:10.3389/fonc.2022.860849
34. Brennan K, Iversen KF, Blanco-Fernández A, Lund T, Plesner T, Mc Gee MM. Extracellular vesicles isolated from plasma of multiple myeloma patients treated with daratumumab express CD38, PD-L1, and the complement inhibitory proteins CD55 and CD59. Cells. 2022;11(21):3365. doi:10.3390/cells11213365
35. Nijhof IS, Casneuf T, Van Velzen J, et al. CD38 expression and complement inhibitors affect response and resistance to daratumumab therapy in myeloma. Blood. 2016;128(7):959–970. doi:10.1182/blood-2016-03-703439
36. Welsh JA, Goberdhan DCI, O’Driscoll L, et al. Minimal information for studies of extracellular vesicles (MISEV2023): from basic to advanced approaches. J Extracell Vesicles. 2024;13(2):e12404. doi:10.1002/jev2.12404
37. Meyer L, Mulder D, Wallace J. A supervised machine learning approach with feature selection for sex-specific biomarker prediction. Npj Syst Biol Appl. 2025;11(1):69. doi:10.1038/s41540-025-00523-z
38. Mottalib MM, Jones-Smith JC, Sheridan B, Beheshti R. Subtyping patients with chronic disease using longitudinal BMI patterns. IEEE J Biomed Health Inform. 2023;1–12. doi:10.1109/JBHI.2023.3237753
39. Koppad S, Basava A, Nash K, Gkoutos GV, Acharjee A. Machine learning-based identification of colon cancer candidate diagnostics genes. Biology. 2022;11(3):365. doi:10.3390/biology11030365
40. Ledesma D, Symes S, Richards S. Advancements within modern machine learning methodology: impacts and prospects in biomarker discovery. Curr Med Chem. 2021;28(32):6512–6531. doi:10.2174/0929867328666210208111821
41. Uddin S, Khan A, Hossain ME, Moni MA. Comparing different supervised machine learning algorithms for disease prediction. BMC Med Inform Decis Mak. 2019;19(1):281. doi:10.1186/s12911-019-1004-8
42. Yin H, Xie J, Xing S, et al. Machine learning-based analysis identifies and validates serum exosomal proteomic signatures for the diagnosis of colorectal cancer. Cell Rep Med. 2024;5(8):101689. doi:10.1016/j.xcrm.2024.101689
43. Livshits MA, Khomyakova E, Evtushenko EG, et al. Isolation of exosomes by differential centrifugation: theoretical analysis of a commonly used protocol. Sci Rep. 2015;5(1):17319. doi:10.1038/srep17319
44. Sheridan R, Brennan K, Bazou D, O’Gorman P, Matallanas D, Mc Gee MM. Multiple myeloma derived extracellular vesicle uptake by monocyte cells stimulates IL-6 and MMP-9 secretion and promotes cancer cell migration and proliferation. Cancers. 2024;16(5):1011. doi:10.3390/cancers16051011
45. Cox J, Hein MY, Luber CA, Paron I, Nagaraj N, Mann M. Accurate proteome-wide label-free quantification by delayed normalization and maximal peptide ratio extraction, termed MaxLFQ. Mol Cell Proteomics MCP. 2014;13(9):2513–2526. doi:10.1074/mcp.M113.031591
46. Breuza L, Poux S, Estreicher A, et al. The UniProtKB guide to the human proteome. Database. 2016;2016:bav120. doi:10.1093/database/bav120
47. Iglesias-Martinez LF, Rauch N, Wynne K, McCann B, Kolch W, Rauch J. Interactome dynamics of RAF1-BRAF kinase monomers and dimers. Sci Data. 2023;10(1):203. doi:10.1038/s41597-023-02115-0
48. Tang D, Chen M, Huang X, et al. SRplot: a free online platform for data visualization and graphing. PLoS One. 2023;18(11):e0294236. doi:10.1371/journal.pone.0294236
49. Friedman J, Hastie T, Tibshirani R. Regularization paths for generalized linear models via coordinate descent. J Stat Softw. 2010;33(1). doi:10.18637/jss.v033.i01
50. Therneau T, Atkinson B. rpart: recursive partitioning and regression trees. 4.1.24. 1999. doi:10.32614/CRAN.package.rpart.
51. Hanley JA, McNeil BJ. The meaning and use of the area under a receiver operating characteristic (ROC) curve. Radiology. 1982;143(1):29–36. doi:10.1148/radiology.143.1.7063747
52. Kumar R, Indrayan A. Receiver operating characteristic (ROC) curve for medical researchers. Indian Pediatr. 2011;48(4):277–287. doi:10.1007/s13312-011-0055-4
53. Zou KH, O’Malley AJ, Mauri L. Receiver-operating characteristic analysis for evaluating diagnostic tests and predictive models. Circulation. 2007;115(5):654–657. doi:10.1161/CIRCULATIONAHA.105.594929
54. Erickson BJ, Kitamura F. Magician’s Corner: 9. Performance metrics for machine learning models. Radiol Artif Intell. 2021;3(3):e200126. doi:10.1148/ryai.2021200126
55. Debie E, Shafi K. Implications of the curse of dimensionality for supervised learning classifier systems: theoretical and empirical analyses. Pattern Anal Appl. 2019;22(2):519–536. doi:10.1007/s10044-017-0649-0
56. Liu H, Motoda H, eds.. Feature Extraction, Construction and Selection. Springer US; 1998. doi:10.1007/978-1-4615-5725-8
57. Çorbacıoğlu ŞK, Aksel G. Receiver operating characteristic curve analysis in diagnostic accuracy studies: a guide to interpreting the area under the curve value. Turk J Emerg Med. 2023;23(4):195–198. doi:10.4103/tjem.tjem_182_23
58. Morè S, Corvatta L, Manieri VM, Morsia E, Offidani M. The challenging approach to multiple myeloma: from disease diagnosis and monitoring to complications management. Cancers. 2024;16(12):2263. doi:10.3390/cancers16122263
59. Rajkumar SV, Dimopoulos MA, Palumbo A, et al. International myeloma working group updated criteria for the diagnosis of multiple myeloma. Lancet Oncol. 2014;15(12):e538–e548. doi:10.1016/S1470-2045(14)70442-5
60. Hillengass J, Landgren O. Challenges and opportunities of novel imaging techniques in monoclonal plasma cell disorders: imaging “early myeloma. Leuk Lymphoma. 2013;54(7):1355–1363. doi:10.3109/10428194.2012.740559
61. Fervers P, Fervers F, Kottlors J, et al. Feasibility of artificial intelligence–supported assessment of bone marrow infiltration using dual-energy computed tomography in patients with evidence of monoclonal protein — a retrospective observational study. Eur Radiol. 2022;32(5):2901–2911. doi:10.1007/s00330-021-08419-2
62. Keren DF, Schroeder L. Challenges of measuring monoclonal proteins in serum. Clin Chem Lab Med CCLM. 2016;54(6):947–961. doi:10.1515/cclm-2015-0862
63. Dunphy K, Bazou D, Henry M, et al. Proteomic and metabolomic analysis of bone marrow and plasma from patients with extramedullary multiple myeloma identifies distinct protein and metabolite signatures. Cancers. 2023;15(15):3764. doi:10.3390/cancers15153764
64. Ng S, Masarone S, Watson D, Barnes MR. The benefits and pitfalls of machine learning for biomarker discovery. Cell Tissue Res. 2023;394(1):17–31. doi:10.1007/s00441-023-03816-z
65. Harshman SW, Canella A, Ciarlariello PD, et al. Proteomic characterization of circulating extracellular vesicles identifies novel serum myeloma associated markers. J Proteomics. 2016;136:89–98. doi:10.1016/j.jprot.2015.12.016
66. Bird S, Cairns D, Menzies T, et al. Sex differences in multiple myeloma biology but not clinical outcomes: results from 3894 patients in the myeloma XI trial. Clin Lymphoma Myeloma Leuk. 2021;21(10):667–675. doi:10.1016/j.clml.2021.04.013
67. Mousavi SE, Ilaghi M, Aslani A, Yekta Z, Nejadghaderi SA. A population-based study on incidence trends of myeloma in the United States over 2000–2020. Sci Rep. 2023;13(1):20705. doi:10.1038/s41598-023-47906-y
68. Heuck CJ, Qu P, Van Rhee F, et al. Five gene probes carry most of the discriminatory power of the 70-gene risk model in multiple myeloma. Leukemia. 2014;28(12):2410–2413. doi:10.1038/leu.2014.232
69. Huang CK, Sun Y, Lv L, Ping Y. ENO1 and Cancer. Mol Ther - Oncolytics. 2022;24:288–298. doi:10.1016/j.omto.2021.12.026
70. Pancholi V. Multifunctional α-enolase: its role in diseases. Cell Mol Life Sci. 2001;58(7):902–920. doi:10.1007/PL00000910
71. Davalieva K, Kiprijanovska S, Maleva Kostovska I, et al. Comparative proteomics analysis of urine reveals down-regulation of acute phase response signaling and LXR/RXR activation pathways in prostate cancer. Proteomes. 2017;6(1):1. doi:10.3390/proteomes6010001
72. Duan S, Gong B, Wang P, Huang H, Luo L, Liu F. Novel prognostic biomarkers of gastric cancer based on gene expression microarray: COL12A1, GSTA3, FGA and FGG. Mol Med Rep. 2018. doi:10.3892/mmr.2018.9368
73. Gao HJ, Chen YJ, Zuo D, et al. Quantitative proteomic analysis for high-throughput screening of differential glycoproteins in hepatocellular carcinoma serum. Cancer Biol Med. 2015;12(3):246–254. doi:10.7497/j.issn.2095-3941.2015.0010
74. Zhang X, Wang F, Huang Y, et al. FGG promotes migration and invasion in hepatocellular carcinoma cells through activating epithelial to mesenchymal transition. Cancer Manag Res. 2019;11:1653–1665. doi:10.2147/CMAR.S188248
75. Mosesson MW. Fibrinogen and fibrin structure and functions. J Thromb Haemost. 2005;3(8):1894–1904. doi:10.1111/j.1538-7836.2005.01365.x
76. Cippitelli M, Stabile H, Kosta A, et al. Role of NF-κB signaling in the interplay between multiple myeloma and mesenchymal stromal cells. Int J Mol Sci. 2023;24(3):1823. doi:10.3390/ijms24031823
77. Trenchevska O, Schaab MR, Nelson RW, Nedelkov D. Development of multiplex mass spectrometric immunoassay for detection and quantification of apolipoproteins C-I, C-II, C-III and their proteoforms. Methods. 2015;81:86–92. doi:10.1016/j.ymeth.2015.02.020
78. Berardi S, Ria R, Reale A, et al. Multiple myeloma macrophages: pivotal players in the tumor microenvironment. J Oncol. 2013;2013:1–6. doi:10.1155/2013/183602
79. Liang L, Li J, Fu H, Liu X, Liu P. Identification of high serum apolipoprotein A1 as a favorable prognostic indicator in patients with multiple myeloma. J Cancer. 2019;10(20):4852–4859. doi:10.7150/jca.31357
80. Guo Q, Lu T, Xu H, et al. Identification of immune-related genes contributing to head and neck squamous cell carcinoma development using weighted gene co-expression network analysis. Cancer Rep. 2023;6(5):e1808. doi:10.1002/cnr2.1808
81. Fortier AM, Asselin E, Cadrin M. Keratin 8 and 18 loss in epithelial cancer cells increases collective cell migration and cisplatin sensitivity through claudin1 up-regulation. J Biol Chem. 2013;288(16):11555–11571. doi:10.1074/jbc.M112.428920
82. Buac D, Shen M, Schmitt S, et al. From bortezomib to other inhibitors of the proteasome and beyond. Curr Pharm Des. 2013;19(22):4025–4038. doi:10.2174/1381612811319220012
83. Ge J, Yu Y, Xin F, et al. Downregulation of delta-aminolevulinate dehydratase is associated with poor prognosis in patients with breast cancer. Cancer Sci. 2017;108(4):604–611. doi:10.1111/cas.13180
84. Ye Q, Yang X, Zheng S, et al. Low expression of moonlight gene ALAD is correlated with poor prognosis in hepatocellular carcinoma. Gene. 2022;825:146437. doi:10.1016/j.gene.2022.146437
85. Storti P, Marchica V, Giuliani N. Role of Galectins in Multiple Myeloma. Int J Mol Sci. 2017;18(12):2740. doi:10.3390/ijms18122740
86. Storti P, Marchica V, Airoldi I, et al. Galectin-1 suppression delineates a new strategy to inhibit myeloma-induced angiogenesis and tumoral growth in vivo. Leukemia. 2016;30(12):2351–2363. doi:10.1038/leu.2016.137
87. Glavey SV, Naba A, Manier S, et al. Proteomic characterization of human multiple myeloma bone marrow extracellular matrix. Leukemia. 2017;31(11):2426–2434. doi:10.1038/leu.2017.102
88. Wagner AK, Kadri N, Snäll J, et al. Expression of CD226 is associated to but not required for NK cell education. Nat Commun. 2017;8(1):15627. doi:10.1038/ncomms15627
89. Weulersse M, Asrir A, Pichler AC, et al. Eomes-dependent loss of the co-activating receptor CD226 restrains CD8+ T cell anti-tumor functions and limits the efficacy of cancer immunotherapy. Immunity. 2020;53(4):824–839.e10. doi:10.1016/j.immuni.2020.09.006
90. Guillerey C, Ferrari De Andrade L, Vuckovic S, et al. Immunosurveillance and therapy of multiple myeloma are CD226 dependent. J Clin Invest. 2015;125(5):2077–2089. doi:10.1172/JCI77181
91. Perez-Riverol Y, Bandla C, Kundu DJ, et al. The PRIDE database at 20 years: 2025 update. Nucleic Acids Res. 2025;53(D1):D543–D553. doi:10.1093/nar/gkae1011
 © 2026 The Author(s). This work is published and licensed by Dove Medical Press Limited. The
full terms of this license are available at https://www.dovepress.com/terms
and incorporate the Creative Commons Attribution
- Non Commercial (unported, 4.0) License.
By accessing the work you hereby accept the Terms. Non-commercial uses of the work are permitted
without any further permission from Dove Medical Press Limited, provided the work is properly
attributed. For permission for commercial use of this work, please see paragraphs 4.2 and 5 of our Terms.
© 2026 The Author(s). This work is published and licensed by Dove Medical Press Limited. The
full terms of this license are available at https://www.dovepress.com/terms
and incorporate the Creative Commons Attribution
- Non Commercial (unported, 4.0) License.
By accessing the work you hereby accept the Terms. Non-commercial uses of the work are permitted
without any further permission from Dove Medical Press Limited, provided the work is properly
attributed. For permission for commercial use of this work, please see paragraphs 4.2 and 5 of our Terms.
Recommended articles
Development and Validation of a Diagnostic Model for Stanford Type B Aortic Dissection Based on Proteomic Profiling
Zhao Z, Chen T, Liu Q, Hu J, Ling T, Tong Y, Han Y, Zhu Z, Duan J, Jin Y, Fu D, Wang Y, Pan C, Keyoumu R, Sun L, Li W, Gao X, Shi Y, Dou H, Liu Z
Journal of Inflammation Research 2025, 18:533-547
Published Date: 10 January 2025
A Preliminary Predictive Panel for Pre-Frailty Based on Serum Proteomic Biomarkers: A Two-Phase Cross-Sectional Study
Ye Y, Liu J, Zhang Z, Xu S, Chang C, Cao M, Zhang Y, Wang F, Zhang N, Wang G, Peng N
Clinical Interventions in Aging 2026, 21:608726
Published Date: 26 May 2026