Back to Journals » Clinical Interventions in Aging » Volume 21
A Preliminary Predictive Panel for Pre-Frailty Based on Serum Proteomic Biomarkers: A Two-Phase Cross-Sectional Study
Authors Ye Y, Liu J, Zhang Z, Xu S, Chang C, Cao M, Zhang Y, Wang F, Zhang N, Wang G, Peng N
Received 13 March 2026
Accepted for publication 15 May 2026
Published 26 May 2026 Volume 2026:21 608726
DOI https://doi.org/10.2147/CIA.S608726
Checked for plagiarism Yes
Review by Single anonymous peer review
Peer reviewer comments 4
Editor who approved publication: Dr Maddalena Illario
Yu Ye,1,2,* Jinwei Liu,1,2,* Zhen Zhang,1,2,* Shuaixuan Xu,2 Chenghao Chang,1,2 Mengyu Cao,2 Yongyi Zhang,1,3 Fang Wang,2 Nihui Zhang,2 Guibin Wang,4 Nan Peng1,2
1Medical School, Chinese PLA General Hospital, Beijing, People’s Republic of China; 2Department of Rehabilitation Medicine, second Medical Center of Chinese PLA General Hospital, Beijing, People’s Republic of China; 3Department of Anaesthesiology, No. 962 Hospital of the PLA Joint Logistic Support Force, Harbin, Heilongjiang, People’s Republic of China; 4State Key Laboratory of Medical Proteomics, Beijing Institute of Lifeomics, Beijing, People’s Republic of China
*These authors have contributed equally to this work
Correspondence: Nan Peng, Email [email protected] Guibin Wang, Email [email protected]
Background: Prefrailty is associated with anomalies in protein metabolism; however, the serum proteomic signatures remain unclear. This study investigated protein profiles across different health statuses and evaluated their potential for the early identification of prefrailty.
Methods: Older adults were categorized as robust, prefrail, and frail. Untargeted proteomic screening in a discovery cohort (n = 30) was followed by parallel reaction monitoring (PRM) validation (n = 99). Multidimensional clinical parameters and differentially expressed proteins were integrated within machine learning pipelines to refine the search for characteristic features of prefrailty.
Results: 166 proteins were found to be differentially expressed across frailty statuses, with 15 significantly prefrailty-associated proteins subsequently confirmed by PRM validation. These proteins were functionally enriched in pathways related to cell signaling, protein metabolism, immune regulation, and skeletal muscle function maintenance. A Random Forest model, further assembled from gait speed, skeletal muscle mass, E3-independent E2 ubiquitin-conjugating enzyme (UBE2O), Timed Up and Go test time, alpha-actinin-3 (ACTN3), and Mini-Mental State Examination score, exhibited the most robust performance for early frailty identification among multiple algorithms compared.
Conclusion: This exploratory study identified candidate serum protein biomarkers associated with prefrailty. Preliminary machine learning models incorporating UBE2O and ACTN3 suggested the feasibility of discriminating prefrailty from robust status, reflecting underlying proteomic heterogeneity among community-dwelling older adults.
Keywords: frailty, pre-frailty, older adults, proteomics, machine learning
Introduction
Frailty is a geriatric syndrome characterized by decreased physiological reserve, increased vulnerability, and reduced resistance to stressors due to multi-system dysregulation.1 Currently, approximately 18% of older adults meet the criteria for frailty, while the proportion of prefrailty, the transitional phase from robustness to frailty, reaches 49%.2 This transition poses a significant threat to healthy aging and represents one of the most serious public health challenges of the 21st century.3,4 Notably, prefrailty is a dynamic and reversible state, making its effective identification and timely intervention crucial for improving health outcomes in older populations.5
Prefrailty typically manifests as exhaustion, reduced gait speed, low grip strength, decreased physical activity, and unintentional weight loss. These clinical features largely overlap with sarcopenia, a condition primarily characterized by impaired muscle strength.6 Leveraging the concept of progressive loss in skeletal muscle mass and function is essential for elucidating the early progression of frailty. This musculoskeletal deterioration is fundamentally driven by disrupted proteostasis and widespread proteomic remodeling.7,8 Studies indicate that the aberrant expression of pro-inflammatory and lipid-related proteins can accelerate functional decline by promoting catabolism, perturbing energy homeostasis, and engaging in multi-organ crosstalk.9,10 Such proteomic shifts likely serve as the pivotal mechanisms driving the transition toward the prefrailty phenotype.
Characterized as a multidimensional decline in physiological reserve, prefrailty is not attributable to fluctuations in individual proteins but rather reflects the coordinated dysregulation of multiple biological processes, including chronic inflammation, metabolic imbalance, cellular senescence, and anabolic resistance.11–13 A recent population-based cohort study identified that various circulating proteins remain persistently associated with the frailty index. The involvement of diverse biological pathways ranging from renal and skeletal systems to immune and apoptotic signaling underscores the multi-system deterioration characteristic of frailty.14 Consequently, compared to single-biomarker analyses, exploring interactions within protein networks offers a more comprehensive explanation for the onset and evolution of prefrailty. Furthermore, integrating rapid clinical assessments with multi-omic features via advanced machine-learning algorithms holds significant promise for enhancing the diagnostic precision and clinical utility of early frailty identification.15,16
In this study, mass spectrometry-based proteomics was employed to screen for key proteins associated with prefrailty. By integrating differentially expressed proteins with clinical features into algorithmic models, we established a preliminary interpretable classification framework for prefrailty, providing a reference for its precise identification.
Methods
Study Design
This two-stage cross-sectional observational study was conducted between December 2022 and June 2023. Participants were recruited from community-based settings, including health service centers, seniors’ activity centers, and via public platform advertisements in Haidian District, Beijing, China, using convenience sampling. The overall workflow is illustrated in Figure 1. Clinical evaluations and proteomic analyses were performed by independent personnel blinded to each other’s data. The study framework comprised a discovery phase for untargeted proteomics screening and a validation phase using an independent cohort for targeted proteomics. Feature selection and comparative analyses of multiple machine learning algorithms were performed to identify the best combination for early frailty identification. All eligible participants provided written informed consent. The protocol adhered to the Declaration of Helsinki and was approved by the Ethics Committee of Chinese PLA General Hospital (Approval No. S2019-140-03).
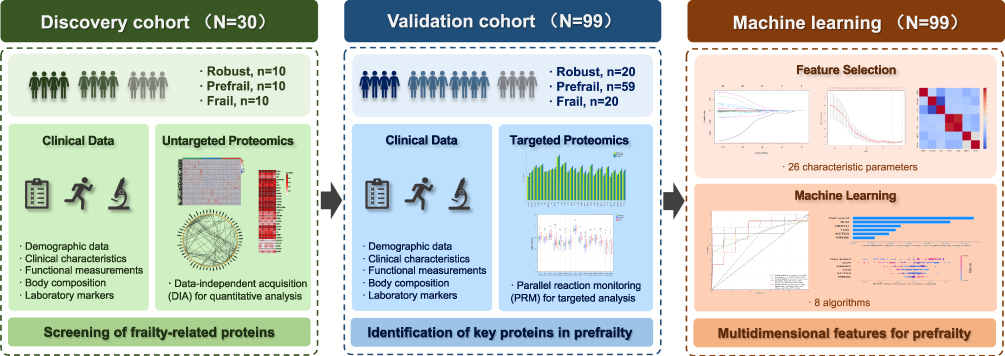 |
Figure 1 Flowchart of the study design. |
Participants
A total of 129 community-dwelling older adults aged 60 years or older were eligible for inclusion in this study. Participants were categorized into robust, prefrail, and frail groups based on the Fried Physical Frailty Phenotype.17 Exclusion criteria included uncontrolled hypertension, acute cardiovascular or cerebrovascular events, active infection, or postoperative status within the preceding 3 months. Potential participants were also excluded for unstable functional status, severe pain, impairments in cognition, speech, or hearing, a history of substance abuse, and end-stage organ failure. Additional exclusion criteria involved contraindications to exercise, severe malnutrition defined by a Mini-Nutritional Assessment-Short Form (MNA-SF) score below 7, and major diseases affecting systemic protein metabolism such as malignancy, autoimmune diseases, or decompensated cirrhosis, along with the use of related medications. Individuals with pacemakers or metal implants that precluded body composition assessment were also excluded.
In the discovery phase, 30 participants were included based on common design strategies for exploratory proteomics studies, with 10 individuals in each group.18 In the validation phase, an independent cohort was recruited. Sample size was estimated using G*Power 3.1, assuming a medium-to-large effect size (Cohen’s f = 0.50),19,20 a significance level of α = 0.05, and a statistical power of 1–β = 0.80, resulting in a minimum required sample size of 42 for comparisons among three groups. Considering the prevalence of prefrailty in community populations and potential data loss,21 99 participants were ultimately included in the validation cohort, consisting of 20 robust individuals, 59 prefrail individuals, and 20 frail individuals.
Assessment of Pre-Frailty
Prefrailty was defined using the Fried Physical Frailty Phenotype, which evaluates five clinical criteria.17
- Weight loss: Unintentional loss of >4.5 kg or >5% of body weight within the preceding year.
- Gait speed: walking time ≥ 6 s or ≥ 7 s over a 4.57-meter course, adjusted for sex and height.
- Grip strength: Measured using a JAMAR Plus handheld dynamometer (Sammons Preston, USA). Participants were seated with their dominant shoulder in a neutral position and elbow flexed at 90°. After two 5-second maximal voluntary contractions, the average value was recorded. Thresholds were stratified by sex and body mass index (BMI), ranging from 29–32 kg for men and 17–21 kg for women.
- Physical activity: Identified by a weekly energy expenditure below 383 kcal for men or 270 kcal for women.
- Exhaustion: Scored 1 if either “everything I did was an effort” or “I could not get going” persisted for ≥3 days during the past week.
The total score ranged from 0 to 5. Participants were categorized as robust with a score of 0, prefrail with scores of 1 to 2, and frail with scores of 3 or higher.
Clinical Data Collection
Demographic data included gender (male/female), age (years), education (years), BMI (kg/m²), smoking history (yes/no), alcohol consumption (yes/no), insomnia status (yes/no), sedentary behavior (yes/no) and the Mini-Mental State Examination (MMSE). MMSE scores range from 0 to 30, with cognitive impairment cut-offs set at ≤17, ≤20, and ≤24 for uneducated, primary, and middle school or above education levels, respectively.22,23
Clinical characteristics were evaluated using the Fried Physical Frailty Phenotype (Fried score). The Number of chronic diseases was quantified by identifying clinical items defined in the Charlson Comorbidity Index framework.24 Pain intensity was determined by Visual Analogue Scale (VAS) on a 10-cm scale where 0 represents no pain and 10 represents unbearable pain.25 Nutritional status was assessed using the MNA-SF, where scores of 12–14 indicate normal status, 8–11 indicate risk of malnutrition, and 0–7 indicate malnutrition.26 Depressive symptoms were screened via the Geriatric Depression Scale-15 (GDS-15), where a score of 5 or higher suggests depression.27 The Modified Barthel Index (MBI) evaluated activities of daily living on a scale of 0 to 100, where lower scores indicate greater dependence.28
Functional measurements consisted of gait speed, grip strength, Timed Up and Go Test (TUG) time, and the Short Physical Performance Battery (SPPB) score. For the TUG, the average time was recorded for participants to rise from a 46-cm chair, walk 3 meters, and return. The SPPB integrated balance, a 4-meter walk, and five-times sit-to-stand tests, with a maximum score of 12 where lower scores indicate poorer physical function.29
Body composition was measured via direct segmental multi‑frequency bioimpedance analysis (DSM‑BIA) using the InBody 770 device (Korea). Parameters obtained included total body protein (Protein), body fat mass (BFM), skeletal muscle mass (SLM). The standard ranges for these parameters were defined in kg as 90%–110% of the predicted ideal values based on individual age, gender, and height.
Laboratory markers and their normal reference ranges were as follows: 25-hydroxyvitamin D (Vit D) was 30 to 60 ng/mL, cystatin C (CysC) was 0.053 to 0.095 mg/dL, insulin‑like growth factor‑1 (IGF‑1) was 60 to 200 ng/mL, c-reactive protein (CRP) was 0 to 0.9 mg/L, creatine kinase (CK) was 2 to 200 U/L, creatinine (Cr) was 30 to 110 μmol/L, and triglycerides (TG) was 0.4 to 1.7 mmol/L.
Serum Sample Preparation
Blood samples were collected from participants under fasting conditions using vacuum tubes, with a volume of 5 mL per sample. Within one hour after collection, the blood was centrifuged at 3,000 rpm for 10 minutes to separate the serum. The supernatant was carefully aliquoted and stored at −80 °C until analysis. For subsequent testing, frozen serum samples were thawed to room temperature prior to processing.
Untargeted Proteomic
Untargeted proteomic profiling was performed using data-independent acquisition (DIA) for quantitative analysis.30 After protein extraction with lysis buffer (8 M urea containing protease inhibitors), high‑abundance proteins were removed using an Agilent MARS Hu‑14 immunoaffinity column to enrich low‑abundance proteins from the flow‑through fraction. Protein concentration was determined by the bicinchoninic acid assay. Subsequent sample processing included reduction (10 mM dithiothreitol, 56 °C), alkylation (55 mM iodoacetamide, in the dark), and digestion via the filter‑aided sample preparation method. The resulting peptides were desalted using a C18 column prior to analysis.
Peptide separation was carried out on an EASY‑nLC 1200 nano‑LC system equipped with a C18 analytical column, using mobile phase A (0.1% formic acid in water) and mobile phase B (0.1% formic acid in 80% acetonitrile). The gradient elution program was as follows: 7–12% B, 12–30% B, 30–45% B, 45–95% B, and maintained until 60 min.
Mass spectrometry analysis was performed on a Q Exactive HF mass spectrometer equipped with a Nanospray Flex ion source. The spray voltage was set to 2.2 kV and the ion transfer temperature to 320 °C. DIA acquisition parameters included a full‑scan range of 350–1150 m/z at a resolution of 120,000, followed by 30 MS/MS windows acquired at a resolution of 30,000 with a normalized collision energy of 33%.
DIA data were processed using Spectronaut software against the UniProt human database. Search settings included trypsin digestion with up to two missed cleavages, fixed modification of carbamidomethylation on cysteine, and variable modifications of methionine oxidation and N‑terminal acetylation.
Targeted Proteomic
Targeted proteomic quantification was performed using mass spectrometry-based parallel reaction monitoring (PRM). This method enables both quantitative and qualitative analysis of specific proteins by monitoring the ion signals of predetermined target peptides, with at least two unique peptides selected per protein.31
Following tryptic digestion, peptides were separated by liquid chromatography and subsequently analyzed by mass spectrometry. PRM acquisition comprises two main steps: Precursor Ion Selection—specific precursor ions corresponding to the target peptides were isolated based on their predefined mass-to-charge (m/z) ratios; and Fragment Ion Monitoring—after fragmentation, the resulting product ions were recorded. Quantification was performed based on the signal intensity of these fragment ions, allowing relative or absolute protein abundance to be determined.
Analyses were carried out on a Q-Exactive high-resolution mass spectrometer, which offers precise mass accuracy and high sensitivity to ensure reliable detection of low-abundance proteins. Peak identification was performed using chromatographic and spectral data generated from the instrument. The signal intensity (peak area) of each peptide was extracted for quantification. Absolute quantification was performed for target peptides using calibration curves constructed from synthetic peptide standards of known concentrations.
Statistical Analysis
Data were processed and analyzed using SPSS Statistics, version 27.0 (IBM Corp., Armonk, NY, USA). All statistical tests were two‑sided, with P < 0.05 considered statistically significant. Missing data for all variables were < 5% and addressed via Markov Chain Monte Carlo (MCMC) multiple imputation with five iterations. Outlier treatment was performed in conjunction with the actual pathophysiological status of the participants. When outliers were consistent with pathological upregulation, they were considered valid data and retained for analysis.
Normality of continuous variables was assessed using the Shapiro–Wilk test. Continuous variables were expressed as mean ± standard deviation (Mean ± SD) for normally distributed data, or as median with interquartile range [M (P25–P75)] for non-normally distributed data. Comparisons among groups were performed using one-way analysis of variance (ANOVA) for normally distributed data, and the Kruskal–Wallis test for non-normally distributed data. Categorical variables were expressed as frequencies and percentages and analyzed using the chi-squared test.
For proteomics data, protein abundance was log2-transformed and normalized. In the discovery phase, differentially expressed proteins among the three groups were identified using one-way ANOVA or the Kruskal–Wallis test according to data distribution, with the false discovery rate (FDR) controlled using the Benjamini–Hochberg method. Differential expression was defined as |log2 fold change (FC)| > 0.58 and FDR < 0.05. Mfuzz clustering and Spearman correlation analysis were applied to identify core proteins, followed by gender-specific filtering.
In the validation phase, PRM data were analyzed using the same statistical criteria. When a global test was significant (P < 0.05), post-hoc pairwise comparisons were conducted with Bonferroni correction to control for Type I error.
Bioinformatics Analysis
Functional annotation and enrichment analyses were performed to explore the biological significance of differentially expressed proteins. Gene Ontology (GO) terms, including biological process, cellular component, and molecular function, were obtained from the GO database (http://www.geneontology.org/). Kyoto Encyclopedia of Genes and Genomes (KEGG) pathway analysis was conducted using the KEGG database (https://www.kegg.jp/kegg/pathway.html). Enrichment analysis was performed using a hypergeometric test, and the Benjamini–Hochberg method was applied to control FDR. Enrichment was considered statistically significant at P < 0.05 and FDR < 0.05.
Protein–protein interaction (PPI) networks were constructed by mapping differentially expressed proteins to the STRING database (https://string-db.org/) with a medium confidence score threshold of 0.400. The network was visualized using Cytoscape, and hub proteins were identified based on topological analysis.
Feature Selection
The dependent variable was defined as prefrailty, with a Fried score of 1–2 serving as the outcome of interest. Robust and frail groups were included as controls to help exclude false‑positive proteins potentially arising from non‑specific aging in the older adult population. A total of 26 candidate parameters were considered as independent variables, among which those showing statistically significant differences across the three groups in the validation cohort were selected (P < 0.05). These included 11 clinical parameters, namely sedentary behavior, MMSE, MBI, gait speed, grip strength, TUG, SPPB, protein, SLM, CysC, and IGF-1, and 15 differentially expressed proteins, including CP, F8, HPX, VWF, RPLP0, ATP5F1B, LPL, F5, MYH9, HSPG2, SVEP1, BPIFB1, UBE2O, ACTN3, and TREML1.
First, the least absolute shrinkage and selection operator (LASSO) regression algorithm was applied for feature standardization by adding an L1 norm to the objective function to penalize the regression coefficients. This resulted in the shrinkage of regression coefficients of redundant variables to zero, thereby achieving feature selection, reducing model complexity, and addressing multicollinearity.32
Subsequently, Kendall’s rank correlation coefficient (τ) was used to detect monotonic correlations among features to ensure model parsimony and stability.33 Pairwise Kendall correlation coefficients were calculated for all features to generate a symmetric matrix. A threshold of |τ| ≥ 0.8 was set, where feature pairs with absolute correlation values above this threshold were considered redundant. In such cases, the feature with a stronger correlation to the target variable was retained, and the other was removed.
Machine Learning
Model development and comparison were performed in the Python 3.7 programming environment using eight machine learning algorithms based on the selected important features. These included ensemble learning algorithms suitable for high-dimensional data: random forest (RF), gradient boosting (GB), and eXtreme gradient boosting (XGBoost);34–36 linear algorithms with good interpretability: logistic regression (LR) and ridge regression (RR);37,38 a probabilistic algorithm: naive Bayes (NB);39 an instance‑based learning method: K‑nearest neighbors (KNN);40 and a single‑tree algorithm: decision tree (DT).41 During the modeling process, five rounds of cross‑validation and grid search for parameter optimization were repeated to prevent overfitting. Hyperparameter tuning for all algorithms was performed on the training set using nested cross‑validation. The final results were summarized across five rounds of validation, and the average performance of each algorithm was calculated. Model performance was evaluated primarily using the receiver operating characteristic (ROC) curve and the area under the curve (AUC) along with its 95% confidence interval (CI), supplemented by accuracy, precision, recall, and F1 score for comprehensive assessment of the classification performance of the eight machine learning algorithms.
Model Interpretability
Shapley Additive Explanations (SHAP) were applied to interpret the optimal model. Rooted in cooperative game theory, SHAP assigns each feature an importance value by averaging its marginal contribution across all possible feature subsets. This approach provides a mathematically grounded, transparent explanation of how each feature influences model predictions, thereby enhancing the interpretability and credibility of the model.42
Results
Clinical Characteristics in Discovery Cohort
In the discovery phase, the mean age of the participants was 77.00 ± 3.17 years, and 15 participants were male (50%). No statistically significant differences were observed in general demographic characteristics among the three groups (all P > 0.05). In terms of clinical functional performance, Fried score (P < 0.001), VAS score (P = 0.010), GDS-15 score (P = 0.013), and TUG time increased with the severity of frailty (P = 0.009). MNA-SF score (P = 0.024), MBI (P = 0.009), gait speed (P = 0.003), grip strength (P = 0.013), and SPPB score (P = 0.010) were all decreased in both the prefrail and frail groups. Circulating levels of CK (P = 0.038) also decreased progressively from the robust to the frail state. No significant inter‑group differences were observed for number of chronic diseases, protein, BFM, SLM, Vit D, CysC, IGF-1, CRP, Cr, or TG (all P > 0.05, Table 1).
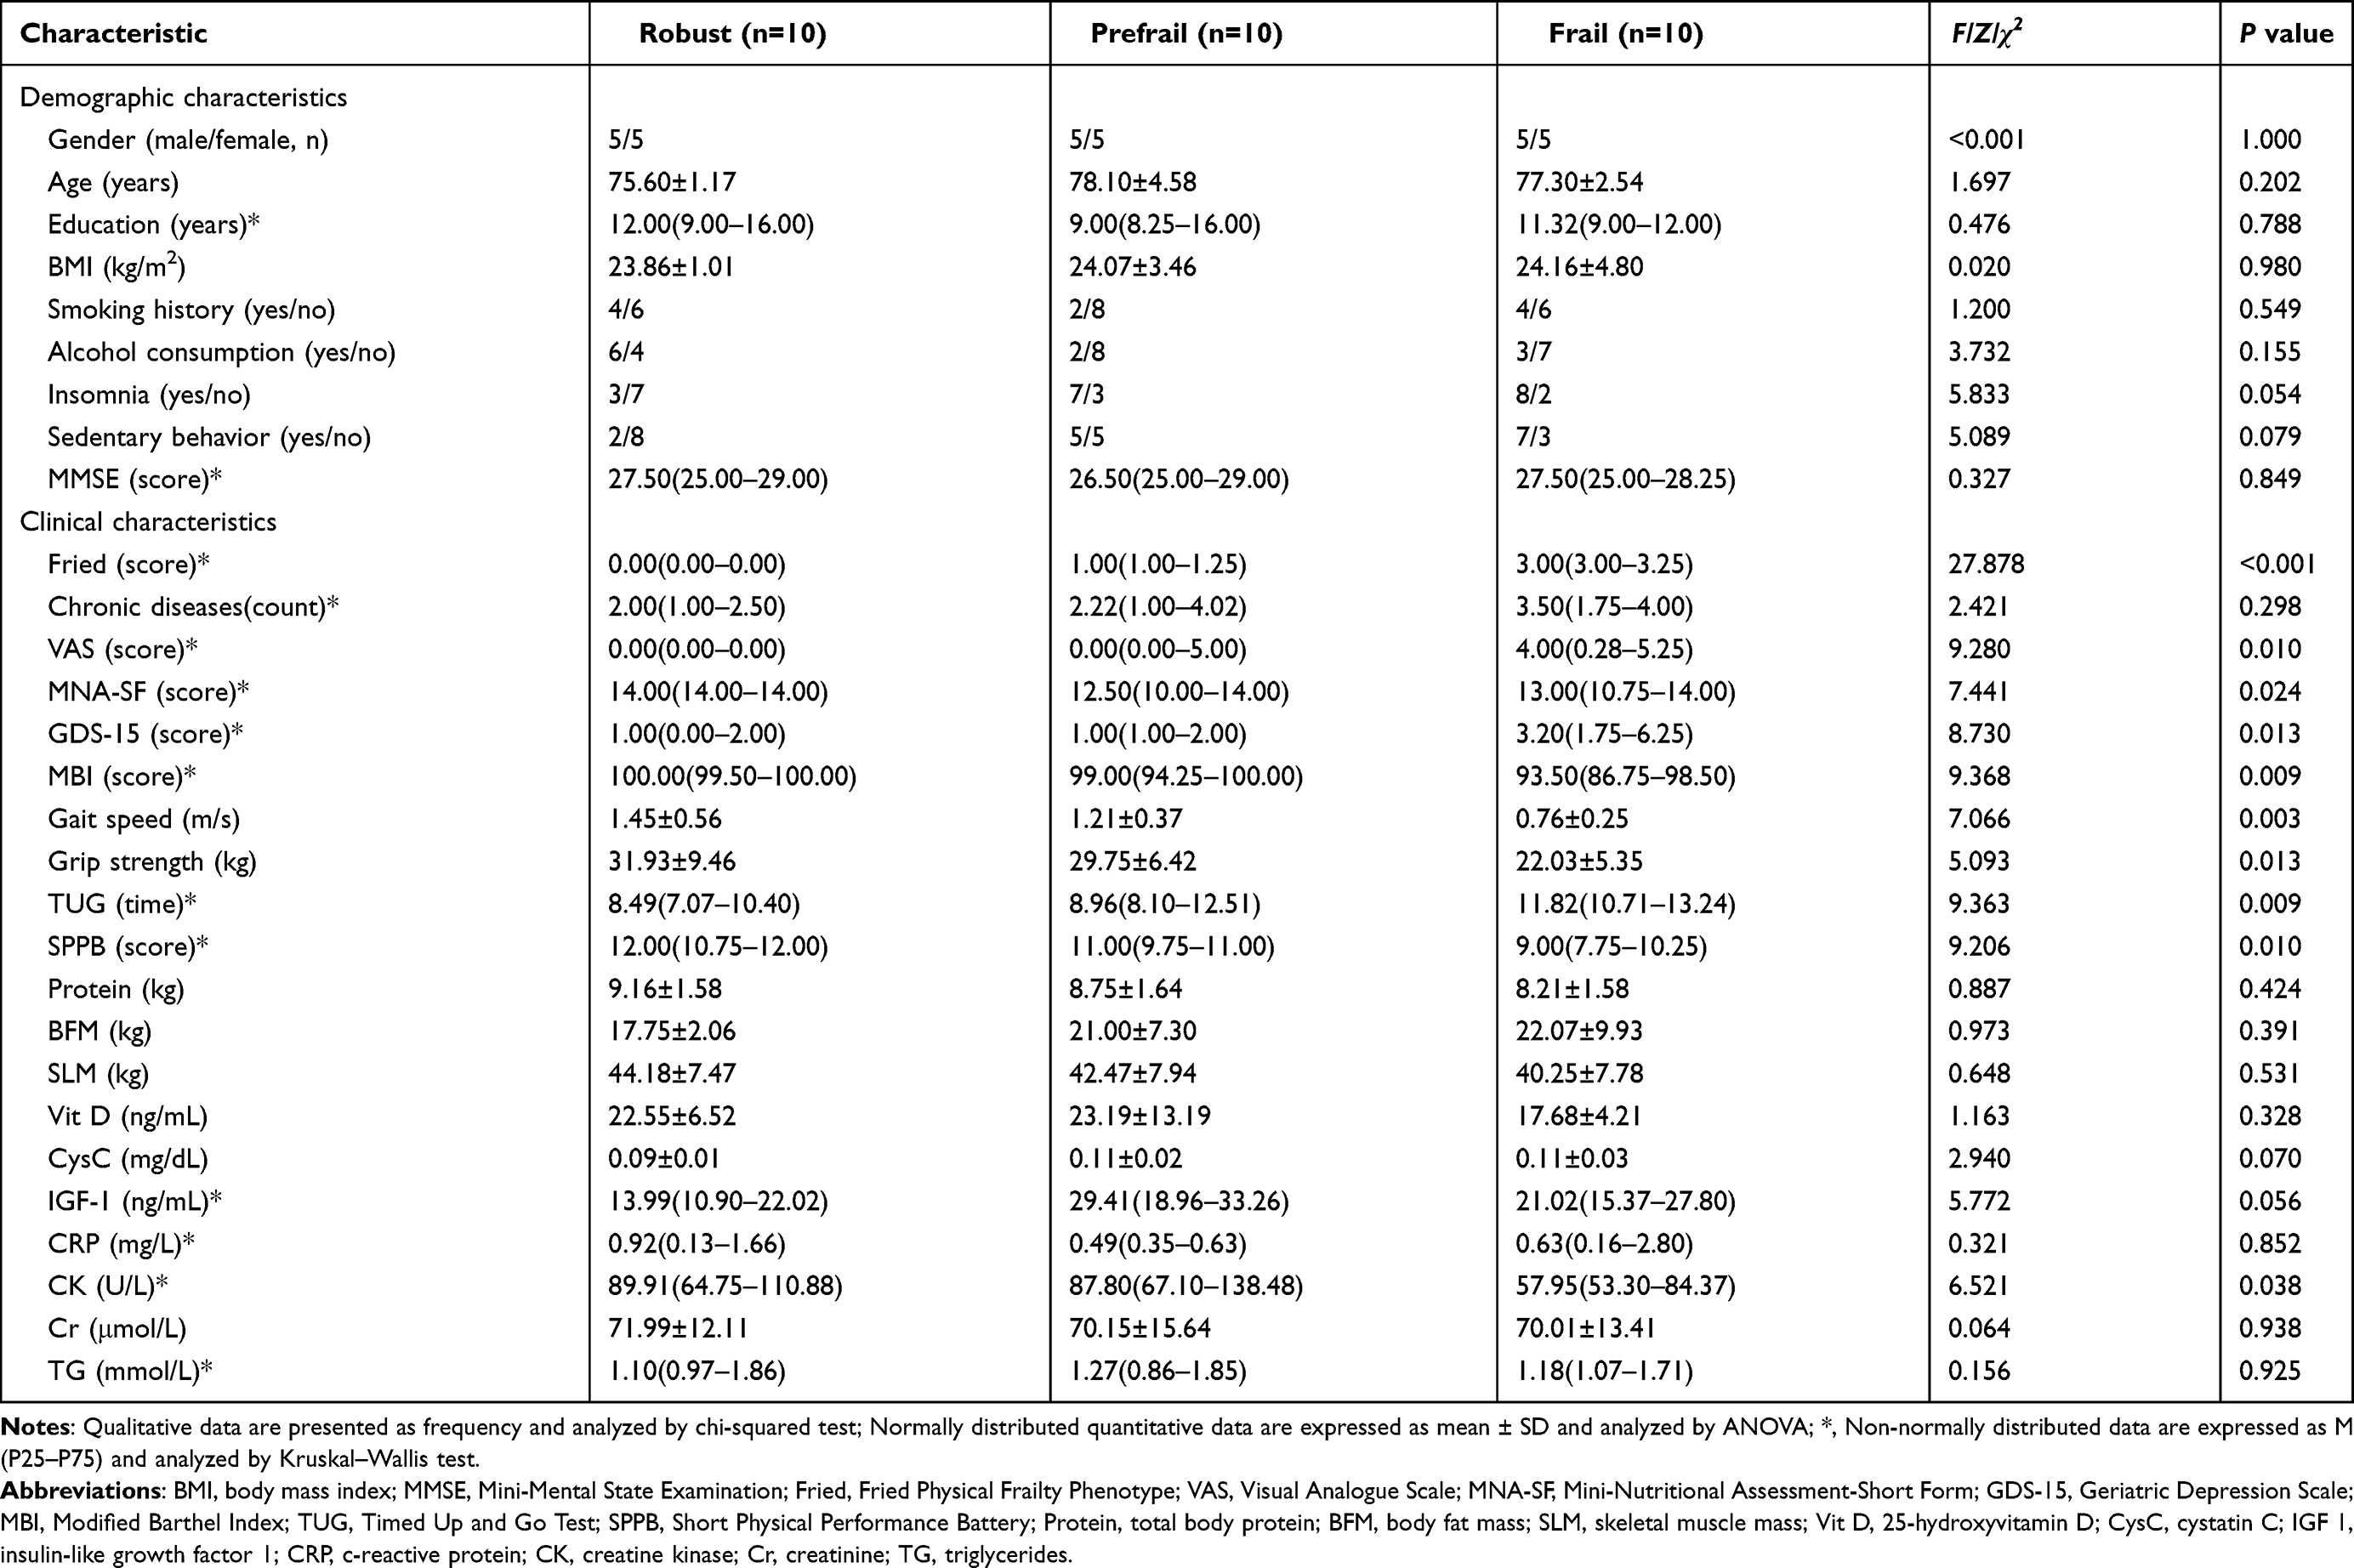 |
Table 1 Comparison of Clinical Characteristics in the Discovery Cohort (N=30) |
Proteins in the Discovery Cohort
In the discovery cohort, a total of 1,145 raw proteins were identified at quantifiable levels. Comparative analysis revealed 166 proteins that were differentially expressed among the robust, prefrail, and frail groups (Figure 2A). To elucidate the biological functions associated with frailty progression, enrichment analyses were performed using the GO and KEGG databases. Significantly enriched GO terms included vesicle‑mediated transport, regulation of response to stimulus, regulation of immune system processes, platelet activation, regulation of cell communication, proteolysis, muscle structure development, and muscle cell differentiation (Figure 2B).
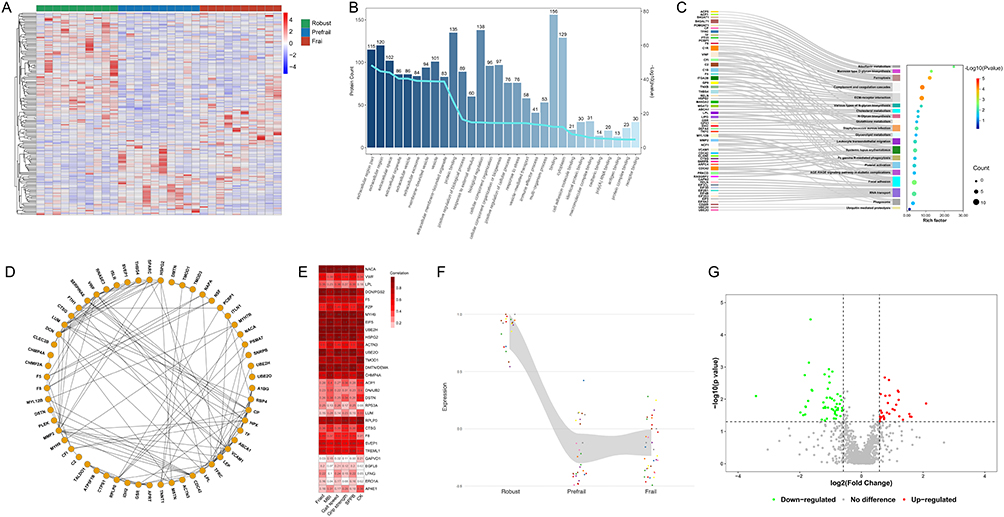 |
Figure 2 Discovery phase untargeted proteomic analysis (N = 30). (A) Heatmap of 166 differentially expressed proteins across three groups; color scale indicates relative protein abundance (blue, low; red, high). (B) Gene Ontology (GO) enrichment analysis; bars represent protein counts; line indicates enrichment score. (C) Kyoto Encyclopedia of Genes and Genomes (KEGG) pathway enrichment. (D) Protein–protein interaction (PPI) network; edges represent interactions. (E) Correlation matrix of key proteins and clinical phenotypes; color intensity reflects correlation strength. (F) Expression pattern map. (G) Volcano plot of sex-specific differences; red, upregulated; green, downregulated. Differentially expressed proteins were identified using one-way ANOVA or Kruskal–Wallis test, Benjamini–Hochberg-adjusted P < 0.05, and |log2 fold change| > 0.58. Protein abbreviations in Table 2. Fried, Fried Physical Frailty Phenotype; MBI, Modified Barthel Index; SPPB, Short Physical Performance Battery; CK, creatine kinase. |
KEGG pathway analysis revealed that the transition from robust to frail states involved complement and coagulation cascades, ferroptosis, focal adhesion, riboflavin metabolism, platelet activation, cholesterol metabolism, glutathione metabolism, glycerolipid metabolism, and ubiquitin‑mediated proteolysis (Figure 2C).
PPI was constructed to visualize functional connectivity among the differentially expressed proteins (Figure 2D). Clustering analysis highlighted 57 key proteins involved in biological processes such as regulation of adaptive immune response, regulation of cytokine production, protein polyubiquitination, regulation of skeletal muscle tissue development, lipid metabolism, and proteolysis.
Based on the bioinformatic analysis of differentially expressed proteins, candidate proteins were prioritized according to their correlation with clinical phenotypes (Figure 2E); the six clinical indicators were selected based on their significant baseline differences and clinical representativeness in assessing physical performance. These protein targets were further filtered by evaluating their fold-change expression trends (Figure 2F) and sex-specific distributions (Figure 2G). These analyses led to the identification of 30 candidate proteins as potential prefrailty biomarkers for subsequent PRM-based validation in the verification cohort (all FDR < 0.05; Table 2).
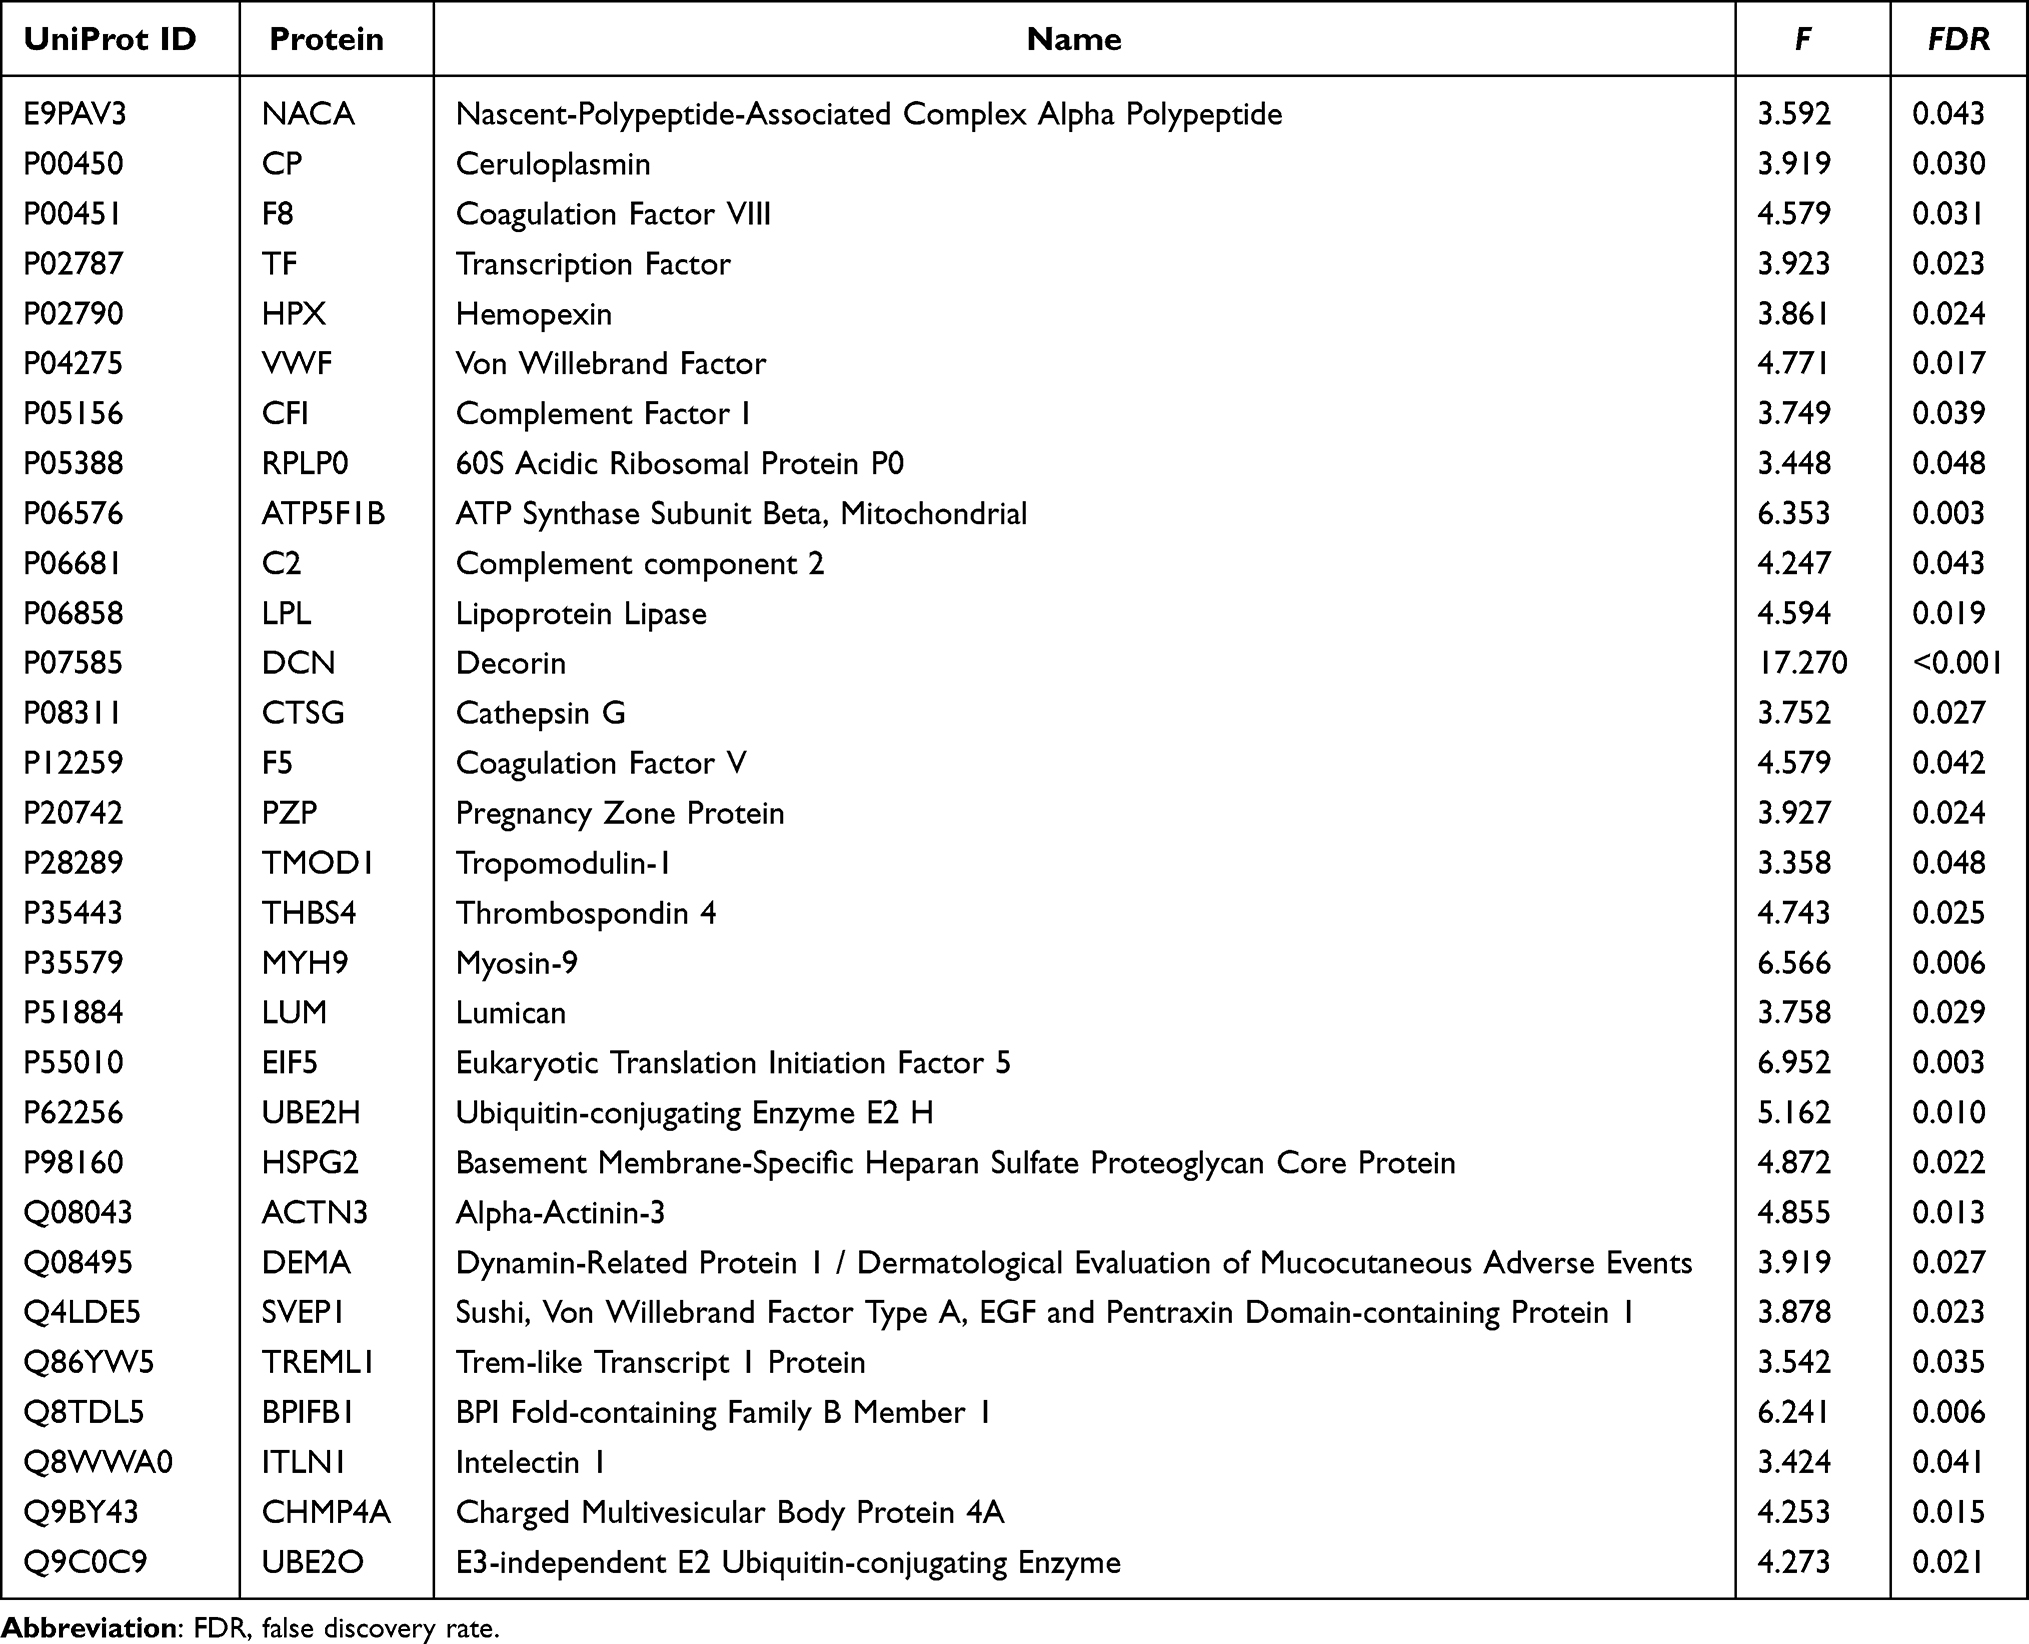 |
Table 2 Candidate Proteins Identified by ANOVA for Parallel Reaction Monitoring (PRM) Validation (N=30) |
Clinical Characteristics in Validation Cohort
In the validation phase, the mean age of participants was 75.32 ± 5.09 years, with 27 males (27.3%). The prevalence of sedentary behavior was significantly higher in the prefrail and frail groups (47.5% and 95.0%, respectively; P = 0.001) compared to the robust group (45.0%). MMSE scores decreased progressively with worsening frailty status (P = 0.004). No significant differences were observed among the three groups in gender, age, years of education, BMI, smoking history, alcohol consumption use, or insomnia (all P > 0.05).
Fried scores differed significantly among groups (P < 0.001). Compared to the robust group, the frail group showed significantly lower scores in the MBI (P < 0.001), gait speed (P < 0.001), grip strength (P =0.010), and SPPB (P < 0.001). TUG time was significantly longer in both the prefrail and frail groups than in the robust group (P < 0.001). Protein and SLM were notably lower in the prefrail group compared to the robust group (P = 0.017 and P = 0.009, respectively). CysC levels increased significantly only at the frail stage (P = 0.040), whereas IGF-1 followed a non-linear trend, decreasing slightly in prefrailty before peaking in the frail group (P = 0.004). In contrast, no significant inter‑group differences were detected for number of chronic diseases, VAS, MNA‑SF, GDS‑15, BFM, Vit D, CRP, CK, Cr, or TG levels (all P > 0.05; Table 3).
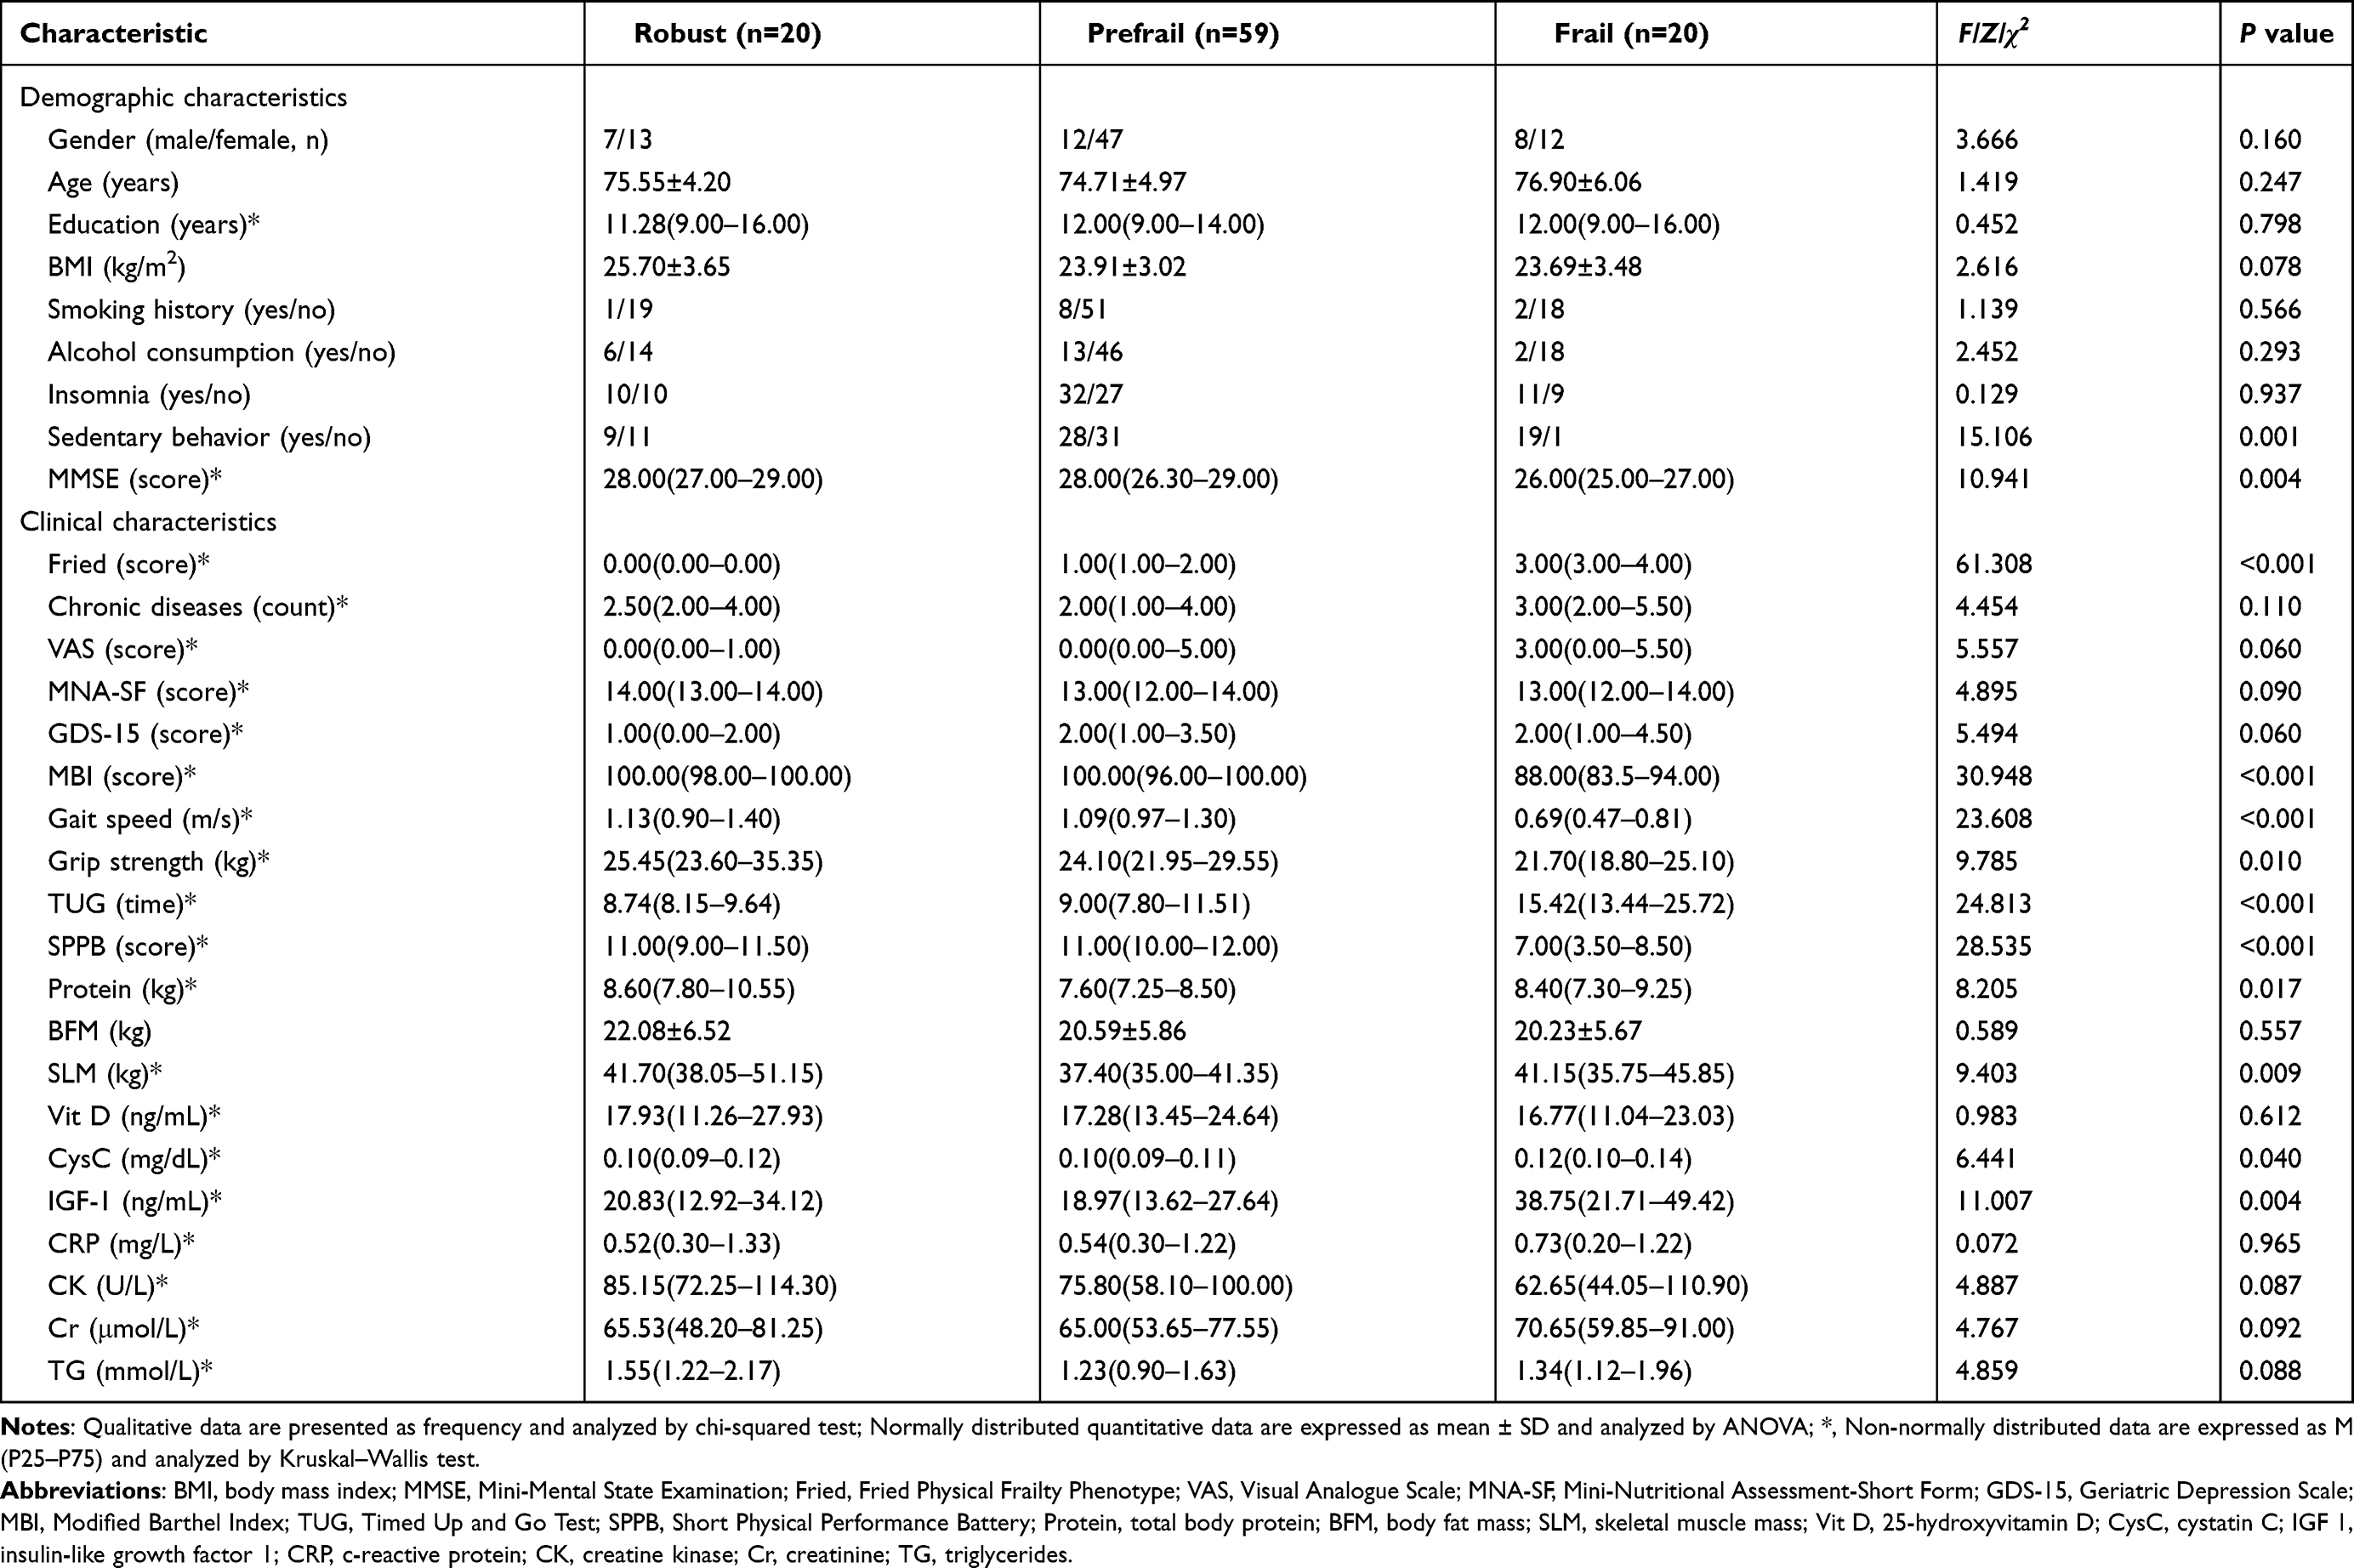 |
Table 3 Comparison of Clinical Characteristics in the Validation Cohort (N=99) |
Targeted Proteins in the Validation Cohort
Targeted proteomic analysis via PRM was performed in the validation cohort to quantify the expression levels of 30 candidate proteins previously identified in the discovery phase (Figure 3A). Among these, 15 proteins exhibited statistically significant differential expression across the robust, prefrail, and frail groups (P < 0.05; Figure 3B), including ceruloplasmin (CP), coagulation factor VIII (F8), hemopexin (HPX), von Willebrand factor (VWF), 60S acidic ribosomal protein P0 (RPLP0), ATP synthase subunit beta mitochondrial (ATP5F1B), lipoprotein lipase (LPL), coagulation factor V (F5), myosin-9 (MYH9), basement membrane-specific heparan sulfate proteoglycan core protein (HSPG2), sushi, von Willebrand factor type A, EGF and pentraxin domain-containing protein 1 (SVEP1), BPI fold-containing family B member 1 (BPIFB1), E3-independent E2 ubiquitin-conjugating enzyme (UBE2O), alpha-actinin-3 (ACTN3), and triggering receptor expressed on myeloid cells like transcript-1 (TREML1).
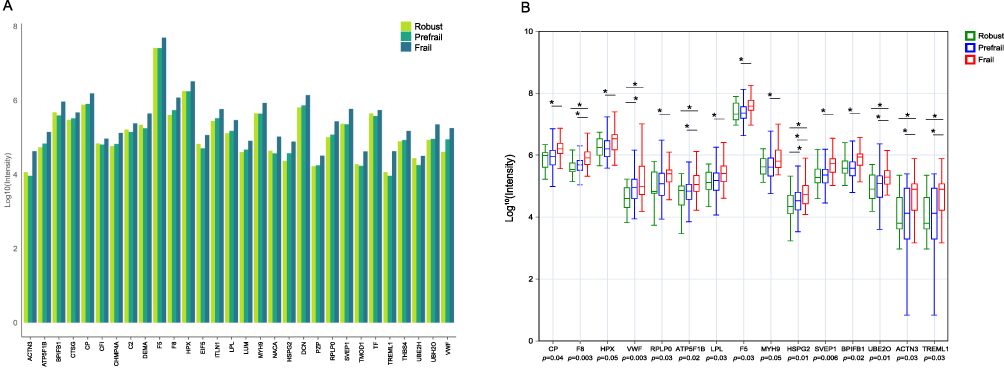 |
Figure 3 Validation phase targeted proteomic analysis (N = 99). (A) Quantitative expression of candidate proteins; relative abundance of 30 proteins. (B) Differential protein expression among the three groups; *, Bonferroni-corrected post-hoc pairwise comparisons, P < 0.05. Protein abbreviations in Table 2. |
Feature Selection
A total of 26 independent variables showing statistical significance in the validation phase were subjected to LASSO regression analysis (Figure 4A). Feature selection was performed using LASSO with cross‑validation, and seven features with non‑zero coefficients corresponding to the optimal lambda on the left side of the curve were selected (Figure 4B). Based on the LASSO results, Kendall correlation analysis (Figure 4C) revealed high collinearity between SLM and total protein content (τ = 0.95). The redundant feature with relatively lower nonlinear association, “Protein” was removed. The remaining six features, namely MMSE, gait speed, TUG, SLM, UBE2O, and ACTN3, were subsequently used to construct the machine learning model.
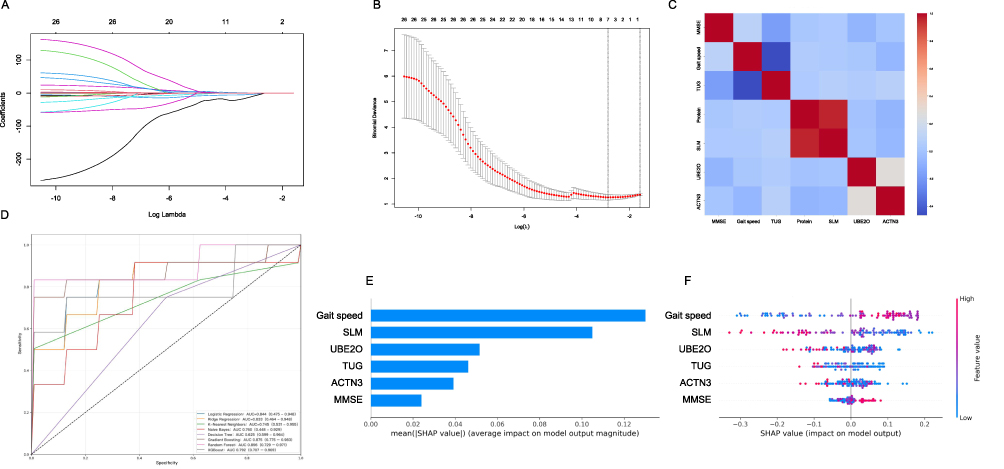 |
Figure 4 Machine learning analysis (N = 99). (A) LASSO coefficient profiles; variable selection across log(λ). (B) Cross validation curve; selection of optimal λ based on binomial deviance. (C) Feature correlation heatmap; relationships among selected variables. (D) Receiver operating characteristic (ROC) curves of the eight machine learning models. (E) SHAP feature importance; ranking based on mean SHAP values in the random forest model. (F) SHAP summary plot. Abbreviations: MMSE, Mini-Mental State Examination; TUG, Timed Up and Go Test; Protein, total body protein; SLM, skeletal muscle mass; UBE2O, E3-independent E2 ubiquitin-conjugating enzyme; ACTN3, alpha-actinin-3. |
Performance Comparison of Machine Learning
Based on the six selected important features, the study systematically evaluated the classification performance of eight widely used machine learning algorithms, including RF, GB, XGBoost, LR, RR, NB, KNN, and DT (Figure 4D). The results showed that ensemble learning methods exhibited the most prominent overall performance. The RF algorithm achieved the highest AUC (0.896, 95% CI: 0.792–0.971), indicating excellent discriminative ability and stability. GB ranked second (AUC = 0.875, 95% CI: 0.775–0.983), followed by XGBoost (AUC = 0.792, 95% CI: 0.707–0.969), which demonstrated relatively narrow CIs and good generalizability. Among traditional models, LR (AUC = 0.844, 95% CI: 0.475–0.948) and RR (AUC = 0.833, 95% CI: 0.464–0.948) showed moderate performance, yet their wide CIs suggested sensitivity to data distribution. The probabilistic model NB (AUC = 0.760, 95% CI: 0.448–0.929) and distance-sensitive KNN (AUC = 0.745, 95% CI: 0.531–0.955) performed similarly, with NB displaying greater variability. In contrast, DT yielded the poorest results (AUC = 0.625, 95% CI: 0.599–0.964), reflecting its instability and limited applicability in this classification task (Table 4).
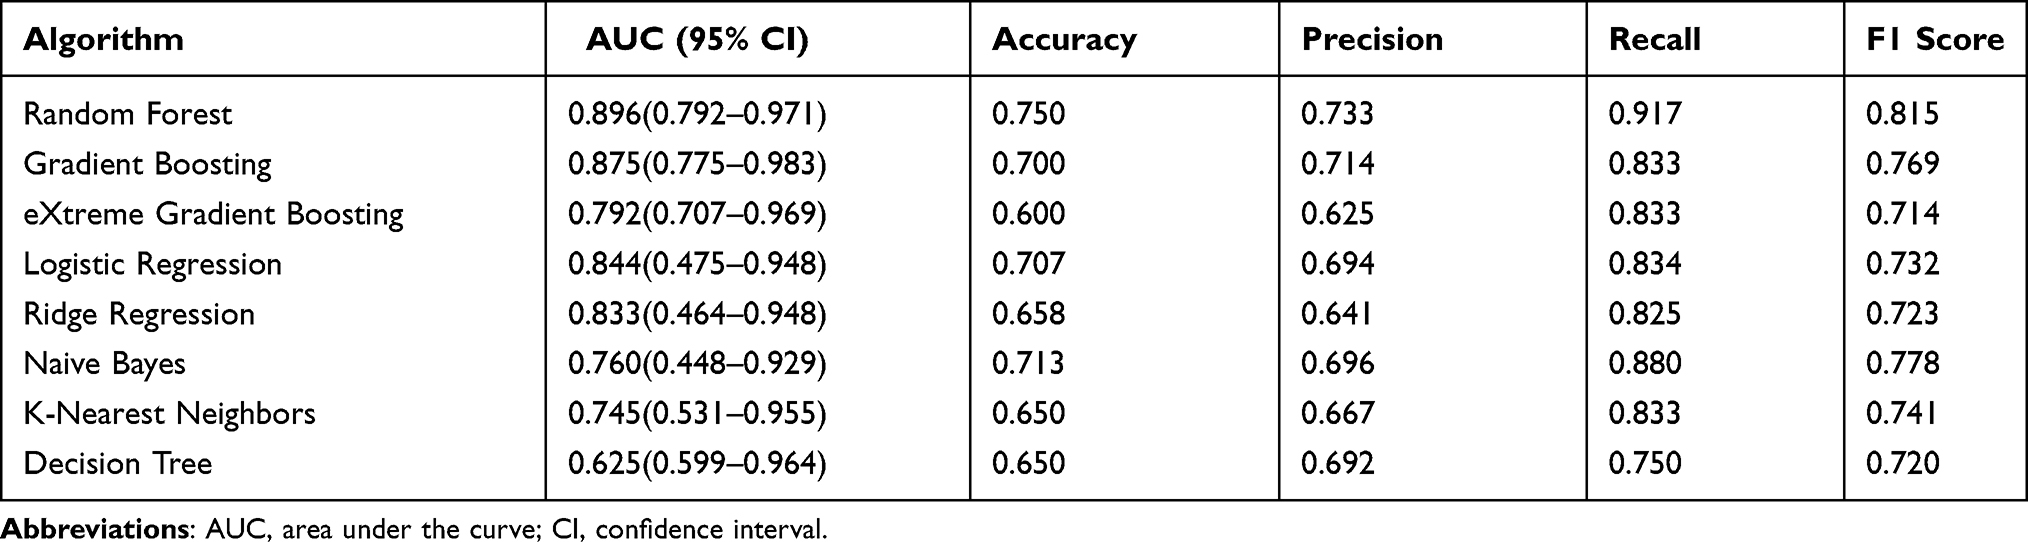 |
Table 4 Comparison of Predictive Performance Among the Eight Model (N=99) |
SHAP Analysis
The best‑performing RF algorithm was further interpreted using SHAP analysis. Figure 4E illustrates the mean absolute SHAP values for each feature, ranked in descending order of importance: gait speed, SLM, UBE2O, TUG, ACTN3, and MMSE. Figure 4F further reveals the contribution magnitude and direction of each feature to the classification results in the RF model. Gait speed exhibited the strongest predictive influence. SLM and the protein markers UBE2O and ACTN3 showed more complex, non‑linear relationships, where both high and low levels could contribute to prefrailty risk. TUG time, while less influential, was positively associated with prefrailty risk, whereas MMSE score only contributed substantially under conditions of pronounced cognitive decline.
Discussion
To our knowledge, this is the first study to integrate high-throughput proteomic data with clinical phenotypes to systematically characterize the proteomic profiles across different stages of frailty, with prefrailty investigated as a distinct clinical status. The results revealed that among 166 significantly differentially expressed proteins detected in older adults across different health statuses, 15 core proteins associated with prefrailty were validated by targeted proteomics, including CP, F8, HPX, VWF, RPLP0, ATP5F1B, LPL, F5, MYH9, HSPG2, SVEP1, BPIFB1, UBE2O, ACTN3, and TREML1. Through machine learning combined with SHAP‑based interpretability analysis, UBE2O and ACTN3, together with clinical features including gait speed, SLM, TUG time, and MMSE score, were further identified as the most promising indicators for early frailty detection. Our findings provide preliminary insights into the molecular alterations associated with prefrailty and suggest potential protein candidates that may inform future clinical identification strategies.
Clinical characteristics, including gait speed, SLM, TUG time, and MMSE scores, have long served as key indicators for distinguishing prefrailty in older adults.43 Our findings align with established research on frailty risk prediction, where functional indicators, socio-psychological factors, and physiological parameters remain the most frequently utilized variables.43,44 Indeed, a large-scale Chinese cohort study validated that predictive models incorporating cognitive function, lifestyle behaviors, and body composition indices, specifically muscle mass and visceral fat achieved significant efficacy in early screening and risk stratification.45 Such clinical indicators are considered indispensable for prefrailty discrimination due to their high operability in diverse settings and well-defined biological mechanisms.
Integrating two independent cohorts, our results revealed widespread proteomic alterations across different frailty statuses. A total of 15 proteins, primarily involved in intercellular signaling, protein homeostasis, immune regulation, and skeletal muscle maintenance, showed significant differences. To further explore the clinical translational potential of these markers, an interpretable machine learning framework highlighted ACTN3 and UBE2O as key protein molecules for identifying prefrailty.
In this study, the altered expression of ACTN3 in the peripheral circulation of prefrail individuals may reflect early-stage skeletal muscle distress. As a fundamental structural component of type II muscle fibers, ACTN3 is typically sequestered within the myofibrillar apparatus.46 Its upregulation in serum likely signifies stress-induced leakage from damaged myocytes, a process increasingly attributed to extracellular vesicle-mediated transport in degenerative muscle pathologies.47 While ACTN3 elevation serves as a marker of structural vulnerability, UBE2O, a multifaceted E3 ubiquitin ligase, represents a more direct enzymatic driver of muscle attrition. We hypothesize that these two proteins converge on the AMPK/mTOR signaling axis, which is a master regulator of muscle proteostasis.48,49 Specifically, excessive UBE2O accelerates the ubiquitination and degradation of the AMPKα2 subunit, thereby blunting mTOR-mediated protein synthesis.50,51 This pathological synergy, supported by our PPI analysis showing indirect interactions between ACTN3 and UBE2O, suggests that the transition to frailty involves a fundamental shift in muscle protein turnover. The compensatory increase in ACTN3 and the proteolytic activity of UBE2O collectively disrupt the balance between muscle synthesis and breakdown. These proteomic trends indicate that the onset of prefrailty typically emerges gradually under the influence of multi-system dysregulation, while providing measurable biological corroboration for conventional clinical assessments.
Physical functional performance, muscle mass, and cognitive status primarily reflect the macroscopic manifestations of physical frailty. In the context of the growing emphasis on precision medicine, integrating these core clinical indicators with key protein biomarkers may provide a more refined characterization of prefrailty by capturing molecular remodeling associated with proteostasis imbalance. Such a multidimensional approach may help reveal heterogeneity in prefrailty that is not detectable using conventional assessment tools alone, thereby offering additional insights for personalized risk stratification and targeted interventions. Nevertheless, certain non-linear trends in our data warrant further consideration. The relatively lower levels of total protein, IGF-1, and SLM in the prefrail group compared to the frail group may mirror an early catabolic or compensatory dysregulation phase preceding later-stage stabilization.52 Concurrently, the universal hypovitaminosis D among participants serves as a systemic background factor, reflecting a widespread vulnerability in protein synthesis and calcium signaling pathways inherent to the aging process.53
This study has several limitations. First, its cross-sectional design prevents observing the dynamic progression of prefrailty and precludes establishing causal relationships. Second, the modest sample size may result in limited statistical power, potentially masking subtle proteomic alterations or associations in secondary analyses. Third, the single-center cohort may not fully capture the heterogeneity of older populations; potential confounding factors such as comorbidities and complex drug histories were not fully controlled, which may influence protein expression. Finally, while external validation is required to confirm the generalizability of our machine-learning models, computational constraints limited the breadth of our algorithmic comparisons. Future multi-center, longitudinal studies with larger cohorts and more rigorous control for clinical confounders are necessary to validate these exploratory findings.
Conclusions
This study revealed distinct proteomic shifts and identified 15 proteins potentially associated with prefrailty, primarily involved in cell signaling, protein metabolism, immune regulation, and skeletal muscle function maintenance. Based on the random forest algorithm, a preliminary model combining clinical indicators and protein markers was established for prefrailty identification. Notably, ACTN3 and UBE2O emerged as promising candidate markers associated with prefrailty. These findings provide exploratory evidence for the potential of integrating proteomic data into multidimensional prefrailty assessment. However, further large-scale and longitudinal validation is essential to confirm the clinical utility and robustness of these candidate markers.
Ethics Approval and Informed Consent
The study was conducted according to the guidelines of the Declaration of Helsinki, and approved by the Ethics Committee of the Chinese PLA General Hospital (Approval No. S2019‑140‑03). All participants provided written informed consent for participation and data collection.
Acknowledgments
An unauthorized version of the Chinese MMSE was used by the study team without permission, however this has now been rectified with PAR. The MMSE is a copyrighted instrument and may not be used or reproduced in whole or in part, in any form or language, or by any means without written permission of PAR (www.parinc.com).
Author Contributions
All authors made a significant contribution to the work reported, whether that is in the conception, study design, execution, acquisition of data, analysis and interpretation, or in all these areas; took part in drafting, revising or critically reviewing the article; gave final approval of the version to be published; have agreed on the journal to which the article has been submitted; and agree to be accountable for all aspects of the work.
Funding
This study was supported by the National Key Research and Development Program of China (Grant No. 2018YFC2002004).
Disclosure
The authors report no conflicts of interest in this work.
References
1. Orkaby AR, Schwartz AW, Callahan KE. Frailty. Ann Intern Med. 2026;179;(2):ITC17–16. doi:10.7326/ANNALS-25-04412
2. Cai S, Li J, Fang Y, et al. Frailty and pre-frailty prevalence in community-dwelling elderly with multimorbidity: a systematic review and meta-analysis. Arch Gerontol Geriatr. 2025;132:105782. doi:10.1016/j.archger.2025.105782
3. Lapi F, Marconi E, Aprile PL, et al. Frailty, comorbidity, and multimorbidity and their relation with medications adherence in primary care older adults. Eur Geriatr Med. 2024;16(2):583–603. doi:10.1007/s41999-024-01098-4
4. Sato R, Vatic M, Peixoto da Fonseca GW, Anker SD, von Haehling S. Biological basis and treatment of frailty and sarcopenia. Cardiovasc Res. 2024;120(9):982–998. doi:10.1093/cvr/cvae073
5. Serra-Prat M, Fortuny Borsot A, Burdoy E, et al. Frailty reversal and its main determinants: a population-based observational and longitudinal study. Fam Med Comm Health. 2025;13(2):e003250. doi:10.1136/fmch-2024-003250
6. Aliberti SM, Menini A, Sacco AM, et al. A pragmatic two-step screening algorithm for sarcopenia and frailty in community-dwelling older adults: a cross-sectional population-based study. Life. 2026;16(1):106. doi:10.3390/life16010106
7. Jude M, Rajasingh S, Alway S, Rajasingh J. Molecular basis of muscle wasting and emerging therapeutic strategies targeting degenerative muscle disorders. Exp Cell Res. 2026;457(2):114969. doi:10.1016/j.yexcr.2026.114969
8. Kemper EJ, Blaak EE, Adriaens ME, Meex RCR. Muscle and liver insulin resistance are associated with distinct plasma protein profiles: data from the DiOGenes trial. J Clin Endocrinol Metab. 2026;111(4):1031–1039. doi:10.1210/clinem/dgaf562
9. Liu G, Jiang S, Xie W, et al. Biomarkers for sarcopenia, muscle mass, muscle strength, and physical performance: an umbrella review. J Transl Med. 2025;23(1):650. doi:10.1186/s12967-025-06575-3
10. Sathyan S, Ayers E, Gao T, Milman S, Barzilai N, Verghese J. Plasma proteomic profile of frailty. Aging Cell. 2020;19(9):e13193. doi:10.1111/acel.13193
11. Wilkinson DJ, Piasecki M, Atherton PJ. The age-related loss of skeletal muscle mass and function: measurement and physiology of muscle fibre atrophy and muscle fibre loss in humans. Ageing Res Rev. 2018;47:123–132. doi:10.1016/j.arr.2018.07.005
12. Hodgins ML, Maxwell SP, Howlett SE, Rockwood K. Blood biomarkers of frailty and cognition: a scoping review. Neurobiol Aging. 2026;161:14–30. doi:10.1016/j.neurobiolaging.2026.01.003
13. Sciancalepore F, Salemme S, Valletta M, et al. Frailty and the brain: a narrative review of functional and pathological correlates. Ageing Res Rev. 2025;113:102945. doi:10.1016/j.arr.2025.102945
14. Mitchell A, Malmgren L, Bartosch P, McGuigan FE, Akesson KE. Pro-inflammatory proteins associated with frailty and its progression: a longitudinal study in community-dwelling women. J Bone Miner Res. 2023;38(8):1076–1091. doi:10.1002/jbmr.4861
15. Pedro KM, Alvi MA, Hejrati N, et al. Machine learning–based cluster analysis identifies four unique phenotypes of patients with degenerative cervical myelopathy with distinct clinical profiles and long-term functional and neurological outcomes. EBioMedicine. 2024;106:105226. doi:10.1016/j.ebiom.2024.105226
16. Niu L, Thiele M, Geyer PE, et al. Noninvasive proteomic biomarkers for alcohol-related liver disease. Nat Med. 2022;28(6):1277–1287. doi:10.1038/s41591-022-01850-y
17. Fried LP, Tangen CM, Walston J, et al. Frailty in older adults: evidence for a phenotype. J Gerontol a Biol Sci Med Sci. 2001;56(3):M146–M156. doi:10.1093/gerona/56.3.M146
18. Hochrainer K, Yang W. Stroke proteomics: from discovery to diagnostic and therapeutic applications. Circ Res. 2022;130(8):1145–1166. doi:10.1161/CIRCRESAHA.122.320110
19. Masood A, Benabdelkamel H, Alfadda AA, et al. Proteomic profiling reveals novel molecular insights into dysregulated proteins in established cases of rheumatoid arthritis. Proteomes. 2025;13(3):32. doi:10.3390/proteomes13030032
20. Lim SM, Ng YL, Majeed ABA, et al. Differential proteomic profiles between cognitive frail and robust older adults from the MELoR cohort. GeroScience. 2024;47(3):5069–5088. doi:10.1007/s11357-024-01462-z
21. Yuan Y, Lin S, Huang X, et al. The identification and prediction of frailty based on Bayesian network analysis in a community-dwelling older population. BMC Geriatr. 2022;22(1):847. doi:10.1186/s12877-022-03520-7
22. Katzman R, Zhang MY, Ou-Yang YQ, et al. A Chinese version of the mini-mental state examination: impact of illiteracy in a shanghai dementia survey. J Clin Epidemiol. 1988;41(10):971–978. doi:10.1016/0895-4356(88)90034-0
23. Folstein MF, Folstein SE, McHugh PR. Mini-mental state. A practical method for grading the cognitive state of patients for the clinician. J Psychiatr Res. 1975;12(3):189–198. doi:10.1016/0022-3956(75)90026-6
24. Charlson M, Szatrowski TP, Peterson J, Gold J. Validation of a combined comorbidity index. J Clin Epidemiol. 1994;47(11):1245–1251. doi:10.1016/0895-4356(94)90129-5
25. Anbarasan D, Merchant RA. Association between chronic pain severity, falls, frailty and perceived health in older adults at risk of falls. Eur J Med Res. 2025;30(1):1047. doi:10.1186/s40001-025-03304-w
26. Ishiwari M, Kono Y, Togashi Y, et al. Mini nutritional assessment short-form as a risk factor for mortality in patients with respiratory disease undergoing urgent hospitalization. BMC Geriatr. 2025;25(1):113. doi:10.1186/s12877-025-05767-2
27. Park SH, Kwak MJ. Performance of the geriatric depression scale-15 with older adults aged over 65 years: an updated review 2000-2019. Clin Gerontol. 2020;44(2):83–96. doi:10.1080/07317115.2020.1839992
28. Sainsbury A, Seebass G, Bansal A, Young JB. Reliability of the Barthel index when used with older people. Age Ageing. 2005;34(3):228–232. doi:10.1093/ageing/afi063
29. Houston DK, Marsh AP, Neiberg RH, et al. Vitamin D supplementation and muscle power, strength and physical performance in older adults: a randomized controlled trial. Am J Clin Nutr. 2023;117(6):1086–1095. doi:10.1016/j.ajcnut.2023.04.021
30. Li K, Teo GC, Yang KL, Yu F, Nesvizhskii AI. diaTracer enables spectrum-centric analysis of diaPASEF proteomics data. Nat Commun. 2025;16(1):95. doi:10.1038/s41467-024-55448-8
31. Chambers AG, Sweet SMM, Chain D, Kim YJ. Global extraction from parallel reaction monitoring to quantify background peptides for improved normalization and quality control in targeted proteomics. Anal Chem. 2021;93(40):13434–13440. doi:10.1021/acs.analchem.1c01375
32. Deng M, Sun S, Zhao R, et al. The pyroptosis-related gene signature predicts prognosis and indicates immune activity in hepatocellular carcinoma. Mol Med. 2022;28(1):16. doi:10.1186/s10020-022-00445-0
33. Takefuji Y. Reevaluating feature importance in machine learning: concerns regarding SHAP interpretations in the context of the EU artificial intelligence act. Water Res. 2025;280:123514. doi:10.1016/j.watres.2025.123514
34. Owens CD, Pinto CB, Mukli P, et al. Neurovascular coupling, functional connectivity, and cerebrovascular endothelial extracellular vesicles as biomarkers of mild cognitive impairment. Alzheimers Dement. 2024;20(8):5590–5606. doi:10.1002/alz.14072
35. Yi Y, Tae M, Shin S, Choi SI. Predicting acute kidney injury in trauma using an extreme gradient boosting model. Clin Kidney J. 2025;18(4):sfaf002. doi:10.1093/ckj/sfaf002
36. Liang D, Wang L, Zhong P, et al. Perspective: global burden of iodine deficiency: insights and projections to 2050 using XGBoost and SHAP. Adv Nutr. 2025;16(3):100384. doi:10.1016/j.advnut.2025.100384
37. Dey D, Haque MS, Islam MM, et al. The proper application of logistic regression model in complex survey data: a systematic review. BMC Med Res Methodol. 2025;25(1):15. doi:10.1186/s12874-024-02454-5
38. Akhtar N, Alharthi MF. Enhancing accuracy in modelling highly multicollinear data using alternative shrinkage parameters for ridge regression methods. Sci Rep. 2025;15(1):10774. doi:10.1038/s41598-025-94857-7
39. Sugahara S, Ueno M. Exact learning augmented naive Bayes classifier. Entropy. 2021;23(12):1703. doi:10.3390/e23121703
40. Wang J, Geng X. Large margin weighted k-nearest neighbors label distribution learning for classification. IEEE Trans Neural Netw Learn Syst. 2024;35(11):16720–16732. doi:10.1109/TNNLS.2023.3297261
41. Hou R, Wang X, Zhang W, et al. Decision tree extraction for clinical decision support system with if-else pseudocode and PlanSelect strategy. IEEE J Biomed Health Inform. 2025;29(5):3642–3653. doi:10.1109/JBHI.2025.3529682
42. Cao S, Hu Y. Creating machine learning models that interpretably link systemic inflammatory index, sex steroid hormones, and dietary antioxidants to identify gout using the SHAP (SHapley additive exPlanations) method. Front Immunol. 2024;15:1367340. doi:10.3389/fimmu.2024.1367340
43. Perdiguero GG, Spina JC, Martínez J, et al. Enhancing ACLF prediction by integrating sarcopenia assessment and frailty in liver transplant candidates on the waiting list. JHEP Rep. 2024;6(3):100985. doi:10.1016/j.jhepr.2023.100985
44. Shah SJ, Oreper S, Jeon SY, Boscardin WJ, Fang MC, Covinsky KE. Social frailty index: development and validation of an index of social attributes predictive of mortality in older adults. Proc Natl Acad Sci U S A. 2023;120(7):e2209414120. doi:10.1073/pnas.2209414120
45. Dong Y, Wang Q, Zhang K, et al. Development and validation of a prediction model of frailty risk in community-dwelling older adults: from a national longitudinal survey. Public Health. 2025;240:63–70. doi:10.1016/j.puhe.2024.12.055
46. El Ouali EM, Barthelemy B, Del Coso J, et al. A systematic review and meta-analysis of the association between ACTN3 R577X genotypes and performance in endurance versus power athletes and non-athletes. Sports Med Open. 2024;10(1):37. doi:10.1186/s40798-024-00711-x
47. Giza S, Mojica-Santiago JA, Parafati M, et al. Microphysiological system for studying contractile differences in young, active, and old, sedentary adult derived skeletal muscle cells. Aging Cell. 2022;21(7):e13650. doi:10.1111/acel.13650
48. Seto JT, Roeszler KN, Meehan LR, et al. ACTN3 genotype influences skeletal muscle mass regulation and response to dexamethasone. Sci Adv. 2021;7(27):eabg0088. doi:10.1126/sciadv.abg0088
49. Huang H, Zhu W, Huang B, et al. Structural insights into the biochemical mechanism of theE2/E3hybrid enzyme UBE2O. Structure. 2025;33(2):274–288.e4. doi:10.1016/j.str.2024.12.002
50. Vila IK, Park MK, Setijono SR, et al. A muscle-specific UBE2O/AMPKα2 axis promotes insulin resistance and metabolic syndrome in obesity. JCI Insight. 2019;4(13):e128269. doi:10.1172/jci.insight.128269
51. de Carvalho LGA, Komoto TT, Moreno DA, et al. USP15-USP7 axis and UBE2T differential expression may predict pathogenesis and poor prognosis in de novo myelodysplastic neoplasm. Int J Mol Sci. 2023;24(12):10058. doi:10.3390/ijms241210058
52. Jia X, Gao W, Hagelin H, et al. Plasma proteomic signature of frailty in 50,506 adults. Cell Metab. 2026;S1550-4131(26). doi:10.1016/j.cmet.2026.02.013
53. Voulgaridou G, Papadopoulou SD, Spanoudaki M, et al. Increasing muscle mass in elders through diet and exercise: a literature review of recent RCTs. Foods. 2023;12(6):1218. doi:10.3390/foods12061218
 © 2026 The Author(s). This work is published and licensed by Dove Medical Press Limited. The
full terms of this license are available at https://www.dovepress.com/terms
and incorporate the Creative Commons Attribution
- Non Commercial (unported, 4.0) License.
By accessing the work you hereby accept the Terms. Non-commercial uses of the work are permitted
without any further permission from Dove Medical Press Limited, provided the work is properly
attributed. For permission for commercial use of this work, please see paragraphs 4.2 and 5 of our Terms.
© 2026 The Author(s). This work is published and licensed by Dove Medical Press Limited. The
full terms of this license are available at https://www.dovepress.com/terms
and incorporate the Creative Commons Attribution
- Non Commercial (unported, 4.0) License.
By accessing the work you hereby accept the Terms. Non-commercial uses of the work are permitted
without any further permission from Dove Medical Press Limited, provided the work is properly
attributed. For permission for commercial use of this work, please see paragraphs 4.2 and 5 of our Terms.
Recommended articles
Combined Vision and Hearing Impairment is Associated with Frailty in Older Adults: Results from the West China Health and Aging Trend Study
Zhao Y, Ding Q, Lin T, Shu X, Xie D, Gao L, Yue J
Clinical Interventions in Aging 2022, 17:675-683
Published Date: 2 May 2022
Experiences of Being Significant Others to Older Adults with Frailty Living Alone in Rural Arctic Norway: A Qualitative Study
Bjerkmo L, Helgesen AK, Blix BH
Risk Management and Healthcare Policy 2022, 15:1283-1292
Published Date: 1 July 2022
Intrinsic Capacity Declines with Elevated Homocysteine in Community-Dwelling Chinese Older Adults
Lin S, Wang F, Zheng J, Yuan Y, Huang F, Zhu P
Clinical Interventions in Aging 2022, 17:1057-1068
Published Date: 7 July 2022
An Easy-to-Implement Clinical-Trial Frailty Index Based on Accumulation of Deficits: Validation in Zoster Vaccine Clinical Trials

Andrew MK, Matthews S, Kim JH, Riley ME, Curran D
Clinical Interventions in Aging 2022, 17:1261-1274
Published Date: 19 August 2022
Recognition and Management of Hospital-Acquired Sepsis Among Older General Medical Inpatients: A Multi-Site Retrospective Study
Barker N, Scott IA, Seaton R, Mehta N, Kalke VR, Redpath L
International Journal of General Medicine 2023, 16:1039-1046
Published Date: 21 March 2023