Back to Journals » Journal of Inflammation Research » Volume 14
Identification and Validation of a Novel Inflammatory Response-Related Gene Signature for the Prognosis of Colon Cancer
Authors Liang Y ![]() , Wu X, Su Q, Liu Y, Xiao H
, Wu X, Su Q, Liu Y, Xiao H
Received 25 May 2021
Accepted for publication 14 July 2021
Published 11 August 2021 Volume 2021:14 Pages 3809—3821
DOI https://doi.org/10.2147/JIR.S321852
Checked for plagiarism Yes
Review by Single anonymous peer review
Peer reviewer comments 2
Editor who approved publication: Professor Ning Quan
Yichao Liang, Xin Wu, Qi Su, Yujie Liu, Hong Xiao
Department of General Surgery, Shengjing Hospital of China Medical University, Shenyang, People’s Republic of China
Correspondence: Xin Wu
Department of General Surgery, Shengjing Hospital of China Medical University, Shenyang, People’s Republic of China
Email [email protected]
Purpose: The inflammatory response plays a crucial role in the occurrence and development of colon cancer. In this study, we aimed to explore a novel prognostic model for patients with colon cancer (COAD) based on inflammatory response-related genes.
Methods: Inflammatory response-related genes were obtained from Molecular Signatures database. Univariate and multivariate Cox regression analyses were used for model construction based on TCGA dataset. GSE39582 dataset and qRT-PCR dataset were used for validation. Gene set variation analysis and gene set enrichment analysis were performed to explore the potential regulatory pathways. The immune cell infiltration level was analyzed via CIBERSORT. Immunohistochemistry analysis and experiments were used to explore the function of genes in model.
Results: In this study, a novel prognostic signature was identified using stepwise Cox proportional hazards regression analysis based on TCGA dataset. The results were subsequently validated in 562 patients from GSE39582 and a qRT-PCR data set from 70 tumor samples. Functional analysis indicated that the tumor microenvironment and immune cell infiltrate were different between high- and low-risk groups. Additionally, IHC results showed that the protein levels of prognostic genes were significantly different between COAD tissues and adjacent non-tumorous tissues, and prognostic genes could regulate the malignant phenotype of COAD cells.
Conclusion: Overall, the inflammation-related gene signature can be used for prognostic prediction in patients with COAD.
Keywords: colon cancer, prognosis, inflammation
Introduction
Colon cancer is a common malignant tumor and one of the main causes of cancer-related death.1 Presently, surgery is the primary approach to treat colon cancer, and the metastasis or postoperative recurrence of colon cancer is a key factor affecting the long-term survival of patients.2,3 Therefore, a more effective prognostic evaluation system is required to provide individualized treatment for colon cancer patients and improve the prognosis of patients. The rapid development of bioinformatics analysis and high-throughput sequencing technology has helped identify a series of markers and risk prediction models related to the prognosis of colon cancer patients, assisting clinicians in evaluating the prognosis of colon cancer patients and formulating personalized treatment plans.4–6 However, most of the analysis parameters in these studies are derived from the entire genome or transcriptome and do not consider changes in specific genomes or transcriptomes. Therefore, these genetic models only represent statistical models and do not reflect the inherent characteristics of colon cancer.
Inflammation is one of the important characteristics of tumors.7 Tumor-related inflammation includes local inflammation and systemic inflammation.8 The local inflammatory response refers to the inflammatory microenvironment, which can promote tumor growth and progression by promoting angiogenesis and metastasis, subverting the anti-tumor immune response, and changing the sensitivity of tumor cells to chemotherapeutics.7,9 The persistent non-controllable inflammatory microenvironment can also trigger gene mutations to cause tumors.10 The systemic inflammatory response, including changes in neutrophils and lymphocytes numbers and albumin levels, is closely related to the response to tumor treatment.11 In colon cancer, patients with an elevated neutrophil-lymphocyte ratio (NLR) have a high risk of recurrence, and this ratio can predict the survival of patients with colon cancer after surgery.12 Additionally, increased neutrophils and decreased albumin can be used as independent predictors of the prognosis of colon cancer liver metastasis.13 Recent studies have highlighted that local chronic inflammatory cell infiltration combined with systemic inflammatory response analysis can predict the prognosis of colon cancer patients independently of clinicopathological staging and assist patients with stage II colon cancer in choosing postoperative adjuvant chemotherapy.14 However, the expression and clinical relevance of inflammatory response-related genes in colon cancer remain unclear.
In this study, we constructed an inflammation-related gene signature (IRGS) in the TCGA cohort and verified the stability and reliability of the model. Next, functional enrichment analysis was conducted to explore the potential mechanism. Finally, experiments verified the protein expression level and function of prognostic genes.
Materials and Methods
Data Collection
The Cancer Genome Atlas (TCGA) Genomic Data Commons (GDC) application performing interface (API) was used to download the latest expression data and clinical follow-up information of patients with colon adenocarcinoma (COAD). This cohort 277 samples. The GSE39582 chip expression data in MINiML format were downloaded from the National Center for Biotechnology Information (NCBI). GSE39582 contained 536 samples with clinical characteristics. These two cohorts were included because they were the largest sample sets in the same platform with detailed follow-up information of colon cancer. Inflammatory response-related genes were selected from hallmark gene sets in the Molecular Signatures database, and the link is http://www.gsea-msigdb.org/gsea/msigdb/cards/HALLMARK_INFLAMMATORY_RESPONSE.html.
Construction and Validation of the IRGS
The independent prognostic predictors among 200 inflammatory response-related genes were selected via univariate and multivariate Cox regression analyses. The risk score of the IRGS for each sample was calculated using the expression values of the selected genes weighted by their corresponding coefficients following multivariate Cox regression analysis. The high- and low-risk groups were divided following the optimized risk value. Kaplan-Meier survival analyses were used to analyze the difference in overall survival between the high- and low-risk groups. Time‐dependent ROC curve analysis was used to evaluate the predictive value of the IRGS.
Analysis of Potential Regulatory Pathways
GSVA was used to observe the relationships between the risk score and pathway as described previously.15 Gene set enrichment analysis (GSEA) was performed to compare the expression of genes in the high-risk and low-risk score groups, and the MSigDB H: hallmark gene set was used as a reference.
Immune Infiltration Analysis
The immune cell infiltration level was estimated using the CIBERSORT website. CIBERSORT is a novel tool widely used for characterizing the cell composition of tissues through the gene expression profile.16
RNA Isolation and RT-PCR Analysis
The surgically resected tumorous tissue samples of 70 patients with colon cancer at Shengjing Hospital of China Medical University were included in this study. All the patients were followed up by telephone. The study was approved by the Human Ethics Review Committee of the Shengjing Hospital of China Medical University. All patients provided informed consent, in accordance with the Declaration of Helsinki. RNA extraction from the tissues was performed using TRIzol reagent (Invitrogen, Carlsbad, CA, USA). RNA was reverse-transcribed into cDNA using the QuantiTect Reverse Transcription Kit (Qiagen, Valencia, CA, USA). Real-time PCR analyses were quantified by SYBR Green (Takara, Otsu, Shiga, Japan), and the levels were normalized to GAPDH levels. The sequences of the upstream and downstream primers were as follows: SLC4A4-forward: 5’-TTCACGGAACTGGATGAGCT-3’; SLC4A4-reverse 5’-ACTGTGGGAGAGAAGAAGCC-3’; TIMP1-forward: 5’-CGCAGCGAGGAGGTTTCTCAT-3’; TIMP1-reverse: 5’-GGCAGTGATGTGCAAATTTCC-3’; NMUR1-Forward: 5’-CCTCAAGGATTACAGCCTG-3’; NMUR1- reverse: 5’-GTTCCTGAGGCTTTGGTAG-3; TACR3- forward: 5’-CGCCAACTACTGCCGCTTC-3´; TACR3- reverse: 5’-ACAGTCTGGGTTTCAAGGGATCA-3´.
Immunohistochemistry Analysis
Surgically resected colon cancer samples and matched nontumorous tissue were fixed in 10% formalin, embedded in paraffin, and processed as 4-µm continuous sections. IHC staining was performed according to the manufacturer’s instructions (UltraSensitiveTM SP; MXB, China). The antibodies used were as follows: SLC4A4 (1:100; ab187511; Abcam), TIMP1 (1:1000; ab211926; Abcam), NMUR1 (1:50; ab121959; Abcam), and TACR3 (1:100; ab124025; Abcam). Each sample was independently assessed by two pathologists and scored using a semiquantitative scoring system. The histoscores ranged from zero (minimum) to 300 (maximum).
Cell Culture
Colon cancer cells (HCT-116) were purchased from the Chinese Academy of Medical Sciences and CAMS & PUMC Medical College (Beijing, China). The cell lines were cultured in 1640 medium supplemented with 10% fetal bovine serum and 100 units/mL of penicillin at 37°C in a humidified 5% CO2 incubator.
Cell Transfection
SiRNA (small interfering RNA) transfection was performed using Lipofectamine 2000 (Invitrogen, Shanghai, China). The sequences were as follows: 5′- GCAAUUGCUCAAGAGCUGA-3′ for SLC4A4-specific siRNA,5′-ATCAACCAGACCACCTTATA-3′ for TIMP1-specific siRNA, 5′-ATCAACCAGACCACCTTATA-3′ for NMUR1-specific siRNA and 5′-AAUAGCCAUAUACCUGUCCAC-3′ for TACR3-specific siRNA. The sequence for the negative control (NC) was 5′- UUCUCCGAACGUGUCACGUTT-3′.
Cell Viability Assay
Cells (1500/well) were added to a 96-well culture plate and transfected with NC-siRNA, SLC4A4-siRNA, NMUR1-siRNA, TIMP1-siRNA, or TACR3-siRNA. After 0, 24, 48, or 72 h, the cells were cultured with 20 μL of CCK8 solution for another 2 h. Cell viability was expressed as an optical density (OD) value at 450 nm.
Colony Formation Assay
To explore the effects of SLC4A4, NMUR1, TIMP1 and TACR3 expression on cell proliferation, cells (1000/well) transfected with NC-siRNA or siRNA were added to each well of 6-well culture plates and incubated for two weeks. Cells were stained by Wright–Giemsa. Finally, the number of colonies was counted by light microscopy.
Statistical Analysis
Cox analyses were performed to screen the predictors for OS. Kaplan-Meier analysis was used to compare the differences in OS between the high- and low-risk score groups. Statistical comparisons between two groups were calculated using Student’s two-tailed t-test, and p-values < 0.05 were considered statistically significant.
Results
Construction of the IRGS in the TCGA Cohort
To comprehensively analyze the prognostic value of immune response-related genes in COAD, we first performed single-factor Cox analysis. The results showed that 16 genes (TACR3, SEMA4D, TIMP1, IL15RA, IRF7, DCBLD2, NMUR1, GABBR1, CX3CL1, PTGIR, SPHK1, SERPINE1, EREG, SLC4A4 and SRI) were significantly related to the prognosis of COAD patients (Figure S1). A Cox proportional hazards regression model was used to optimize and obtain IRGs. Subsequently, the following risk score was constructed: risk score = (0.498 ×TIMP1 expression) - (0.188 × SLC4A4 expression) + (0.350 × NMUR1 expression) + (1.339 × TACR3 expression). The risk score was calculated, and the distribution of the TCGA training cohort is shown in Figure 1A. Following the optimized risk value, patients were assigned to the high-risk or low-risk group. Kaplan-Meier survival analyses showed that the overall survival of patients in the high-risk group was significantly lower than that of patients in the low-risk group (Figure 1B; P < 0.0001). Furthermore, the results based on ROC curve analysis showed that the AUC values of the 1-, 3-, 5- and 7-year survival rates were 0.772, 0.731, 0.731 and 0.725, respectively (Figure 1C). Additionally, patients with low-risk scores had significantly longer DSS (disease-free survival) (p = 0.02; Figure 1D) and PFI (progression-free interval) (p = 0.0047; Figure 1E).
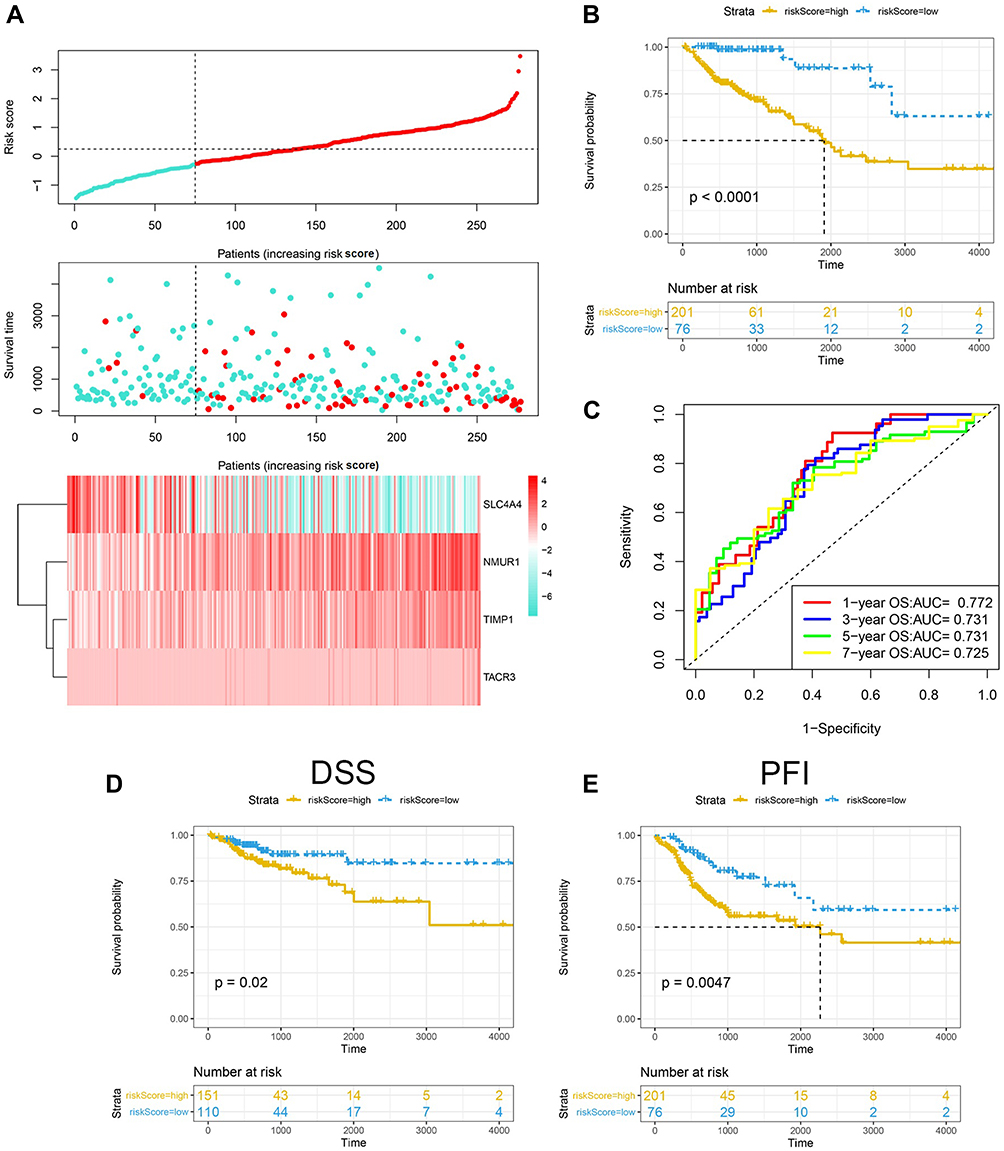 |
Figure 1 Construction of the inflammatory response-related gene signature in the TCGA training set. (A) Risk score, survival time and survival status and expression of four genes in the TCGA cohort. (B) ROC curve and AUC of the four-gene signature classification. (C) KM survival curve distribution (overall survival, OS) of the four-gene signature in the TCGA cohort. (D) KM survival curve distribution (disease-free survival, DSS) of the four-gene signature in the TCGA cohort. (E) KM survival curve distribution (progression-free interval, PFI) of the four-gene signature in the TCGA cohort. Abbreviations: ROC, receiver operating characteristic curve; AUC, area under curve; OS, overall survival; DSS, disease-free survival; PFI, progression-free interval. |
Verification of IRGS Based on GSE39582
To verify the accuracy of the 4-gene prognostic model, we downloaded the GSE39582 database as an external verification cohort. The risk score distribution of the validation cohort is shown in Figure 2A. Survival analysis showed that the OS of low-risk patients was significantly longer than that of high-risk patients (Figure 2B; p =0.0047). ROC curve analysis showed that the AUC values of the 1-, 3-, 5- and 7-year survival rates were 0.696, 0.624, 0.617 and 0.627, respectively (Figure 2C).
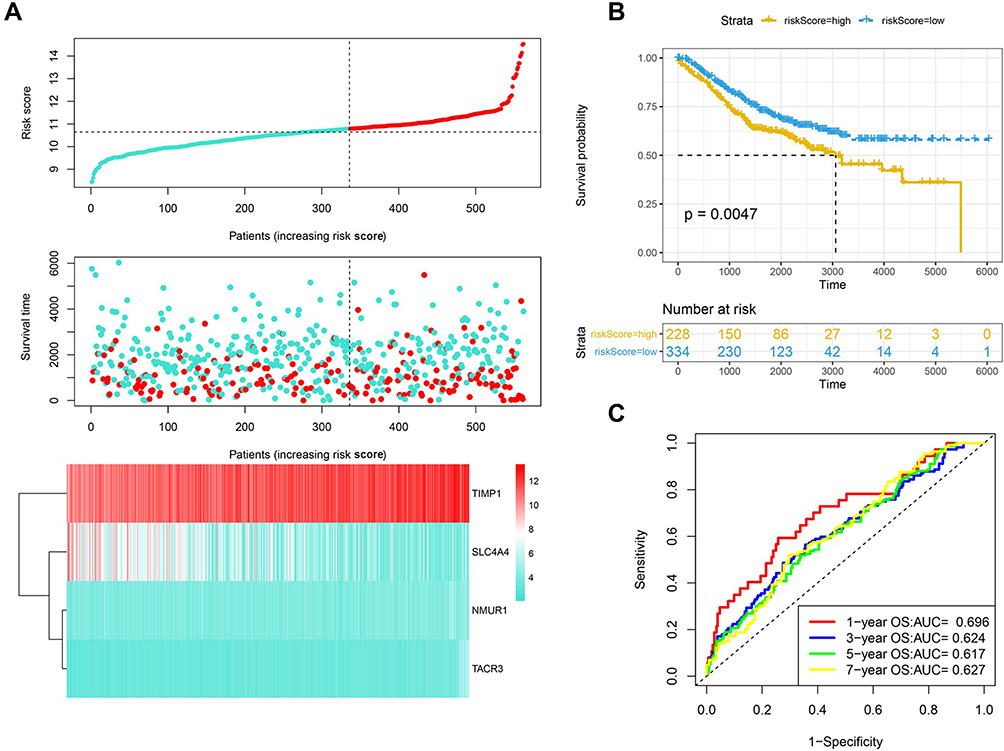 |
Figure 2 Validation of the prognostic performance of the IRGS in GSE39582. (A) Risk score, survival time and survival status and expression of four genes in the GSE39582 cohort. (B) ROC curve and AUC of the four-gene signature classification. (C) KM survival curve distribution of the four-gene signature in the GSE39582 cohort. Abbreviations: ROC, receiver operating characteristic curve; AUC, area under curve. |
Verification of the IRGS in an Independent Group of Colon Cancer Tissue Samples
To evaluate the robustness of the IRGS for patients with COAD in clinical practice, we used qRT-PCR to further validate the specific signature in an independent cohort comprising tissue samples from 70 patients with colon cancer. Using the same formula, the risk score of each patient was calculated. The risk score distribution of the validation cohort is shown in Figure 3A. Survival analysis showed that the OS of low-risk patients was significantly longer than that of high-risk patients (Figure 3B; p =0.0017). ROC curve analysis showed that the AUC values of the 1-, 3- and 5-year survival rates were 0.551, 0.724 and 0.636, respectively (Figure 3C). These findings were consistent with the results of the TCGA cohort and GSE39582 cohort, and verified the reliability of our prognostic model.
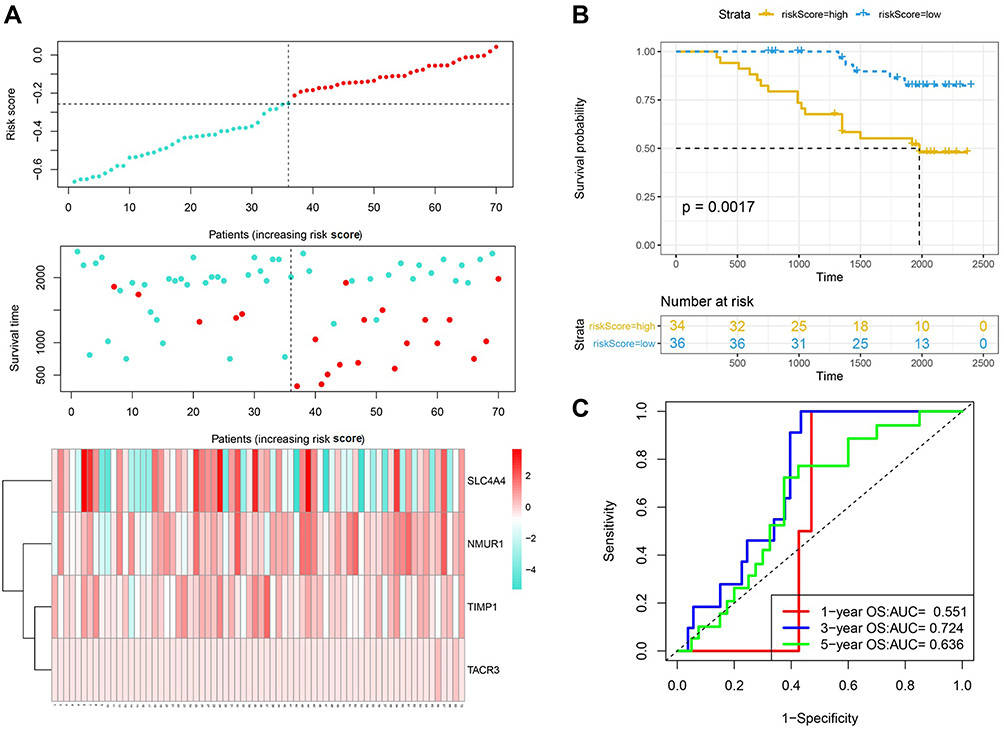 |
Figure 3 Validation of the prognostic performance of the IRGS based on 70 frozen tissues. (A) Risk score, survival time and survival status and expression of four genes based on 70 frozen tissues. (B) ROC curve and AUC of the four-gene signature classification. (C) KM survival curve distribution of the four-gene signature based on 70 frozen tissues. Abbreviations: ROC, receiver operating characteristic curve; AUC, area under curve. |
Prognostic Model Risk Score and Clinical Features
Patients with different clinical features require different therapeutic strategies and have different prognoses; therefore, subgroup analysis was applied. In Figure 4A and B, a higher risk score was associated with a significantly worse OS, regardless of whether the patient was female or male. In Figure 4C and D, a higher risk score was associated with a significantly worse OS in patients with N0 stage or N1-2 stage disease. In T1+T2 stage patients and T3+T4 patients, a higher risk score was associated with a significantly worse OS (Figure 4E and F). Additionally, a higher risk score was associated with a significantly worse OS of patients with stage 3–4 disease but was not significantly associated with that of patients with stage 1–2 disease (Figure 4G and H).
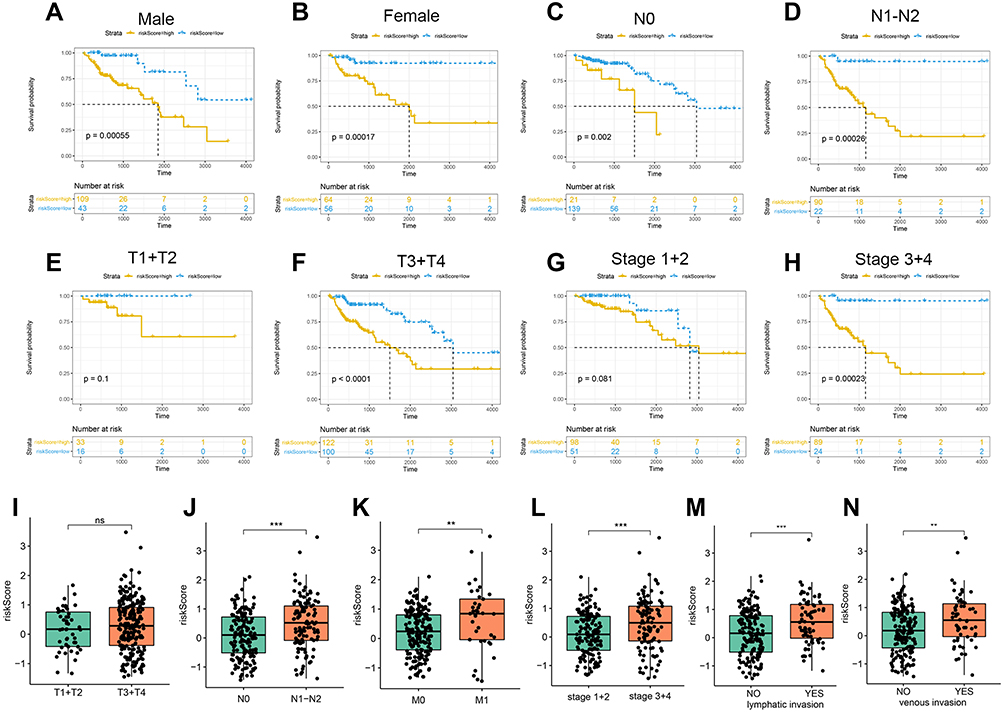 |
Figure 4 Analysis of patients with different clinical characteristics. Prognostic significance of the IRGS in COAD patients according to different clinical characteristics: male (A), female (B), N0 (C), N1-N2 (D), T1+T2 (E), T3+T4 (F), Stage 1–2 (G), Stage 3–4 (H). The risk score in different groups according to different clinical characteristics: T stage (I), N stage (J), M stage (K), tumor stage (L), lymphatic invasion (M), vascular invasion (N). **P < 0.01; ***P < 0.001 (versus control group). Abbreviation: ns, not significant. |
Next, we analyzed the relationship between the risk score and clinical features.
The risk score between T1+T2 and T3+T4 was not significantly different (Figure 4I). The risk score was significantly increased in patients with lymph node metastasis (Figure 4J), metastasis (Figure 4K), advanced TNM stage (Figure 4L), lymphatic invasion (Figure 4M), and vascular invasion (Figure 4N).
Association Between Risk Score and the Tumor Microenvironment
We attempted to analyze the relationship between the risk score and tumor immune microenvironment. The ESTIMATE score, stromal score and immune score were used to estimate the tumor immune microenvironment. In Figure 5A–C, the risk score was positively correlated with the ESTIMATE score (R=0.44; p<0.001), immune score (R=0.12; p=0.04) and stromal score (R=0.52; p<0.001).
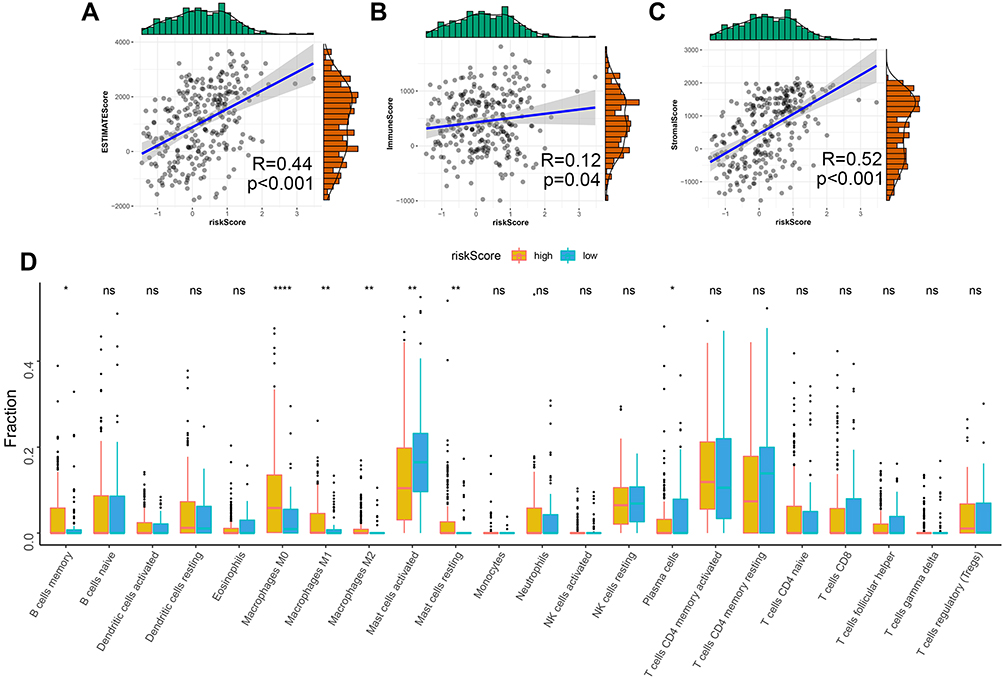 |
Figure 5 Association between the risk score and tumor microenvironment. Relationship between the risk score and ESTIMATES Score (A), Stromal Score (B) and Immune Score (C). (D) Distribution level of 22 types of immune cells in the high- and low-risk groups. ns, not significant; *P < 0.05; **P < 0.01; and ****P < 0.0001 (versus control group). |
Next, we checked the correlation between the risk score and immune infiltrate cells. Compared with the low-risk group, the fractions of B cell memory cells, M0 macrophages, M1 macrophages, M2 macrophages and resting mast cells were higher in the high-risk group (Figure 5D). Additionally, the fractions of activated mast cells and plasma cells were higher in the low-risk group. These results indicate the differences in macrophage cell and mast cell regulation between the high- and low-risk groups.
Identifying Pathways Related to IRGS
Next, we analyzed the relationship between the risk scores of different samples and biological functions. First, we calculated the ssGSEA scores via GSVA to obtain the scores of all patients in terms of the different pathways (Figure 6A). The activity of the hedgehog signaling pathway and basal cell carcinoma increased as the risk score rose, while the activity of the citrate cycle TCA cycle, glyoxylate and dicarboxylate metabolism decreased. Furthermore, GSEA was used to perform pathway enrichment analyses between the high- and low-risk groups, and the MSigDB H: hallmark gene set was used as a reference in this step. Eleven pathways, such as “HALLMARK_ANGIOGENESIS“ and ”HALLMARK_APICAL_JUNCTION”, were significantly enriched in the high-risk group (Figure 6B).
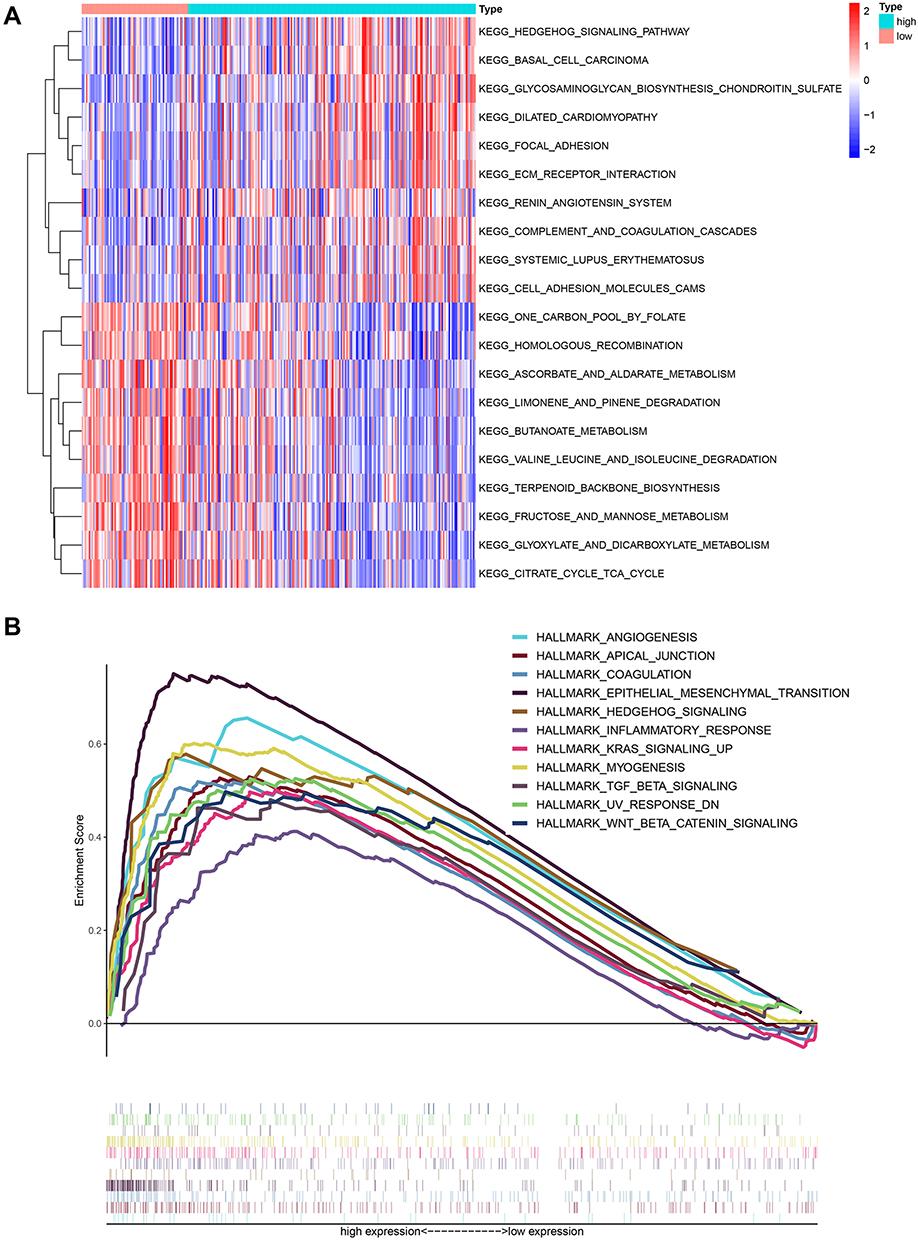 |
Figure 6 Gene set variation analysis and gene set enrichment analysis of pathways. (A) Heatmap showing the differentially expressed pathways between the low- and high-risk score groups based on GSVA analysis. (B) GSEA showed eleven pathways enriched in the high-risk group. |
Protein Level Validation and Functional Analysis of the Genes in the IRGS
To verify the protein expression of SLC4A4, NMUR1, TIMP1 and TACR3 in colon cancer tissues, 30 colon cancer tissues and paired normal tissues were tested. Immunohistochemistry (Figure 7A) showed that SLC4A4 was downregulated in colon cancer tissues, and NMUR1, TIMP1, and TACR3 were highly expressed in colon cancer tissues. Next, we analyzed the potential function of SLC4A4, NMUR1, TIMP1 and TACR3 in colon cancer. Silencing SLC4A4 promoted the proliferation of colon cancer cells in vitro, and silencing NMUR1, TIMP1 and TACR3 inhibited the proliferation of colon cancer cells in vitro (Figure 7B and C). These results suggest that SLC4A4 may function as a tumor suppressor gene and NMUR1, TIMP1 and TACR3 may function as oncogenes in colon cancer.
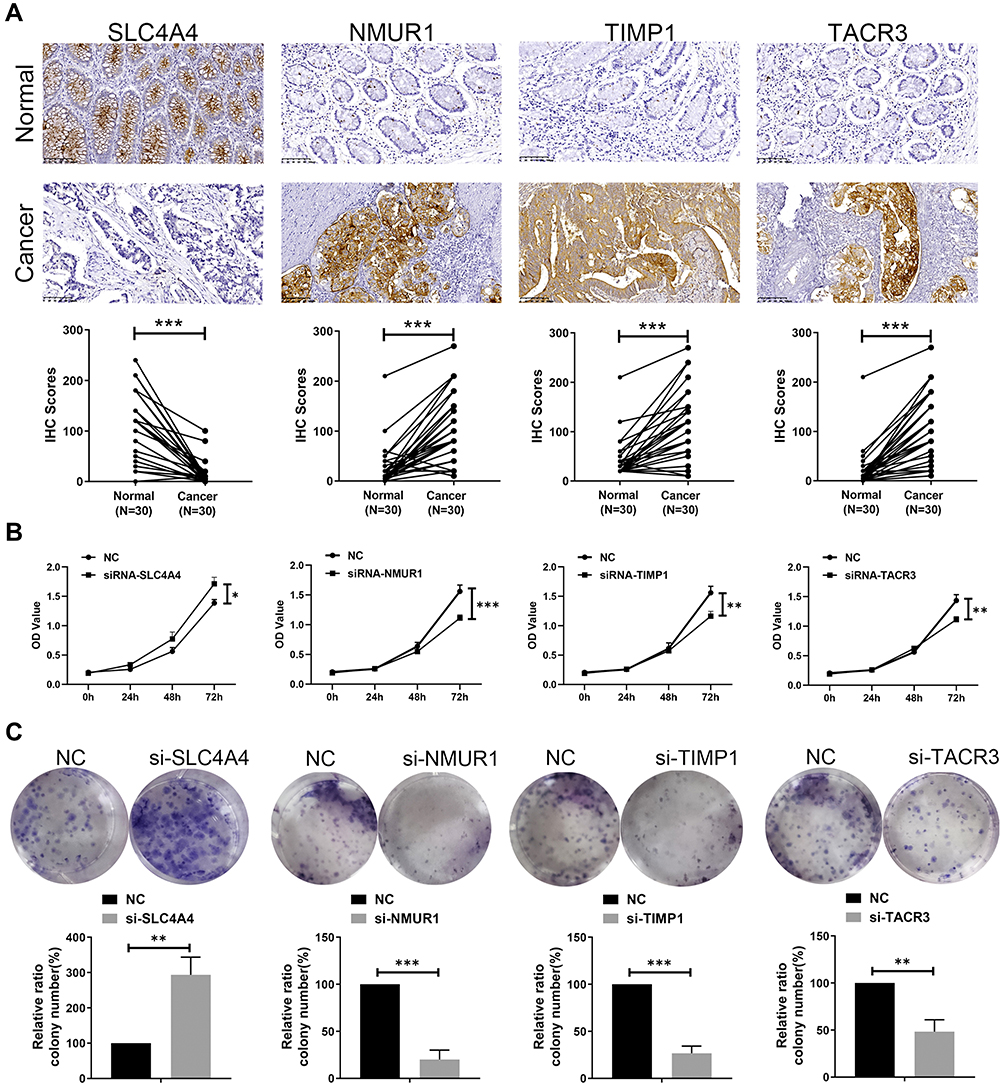 |
Figure 7 Protein level validation and functional analysis of 4 genes in the IRGS. (A) Immunohistochemical results showed that SLC4A4 was downregulated in colon cancer tissues, and NMUR1, TIMP1, TACR3 were highly expressed in colon cancer tissues. Magnification: 10*20. Cell viability assays (B) and colony formation assays (C) showed that silencing SLC4A4 promoted the proliferation of HCT116 cells, and silencing NMUR1, TIMP1 and TACR3 inhibited the proliferation of HCT116 cells, data represent mean ± SD; *P < 0.05, **P < 0.01 and ***P < 0.001 (versus control group). |
Discussion
Colon cancer is a common malignant tumor of the digestive tract and the third most common malignant tumor worldwide.17 Despite many advances in comprehensive treatment strategies, the prognosis of colon cancer patients remains poor, mainly because of the lack of effective diagnostic markers and molecular targeted therapies.18,19 The rapid development of omics sequencing technology enables researchers to analyze the mechanism of ovarian cancer progression through large-scale gene expression data and clinical information.15 An abnormal immune response is an important mechanism for the occurrence and development of colon cancer.20,21 Immune response-related indicators have shown the application value of evaluating the prognosis of colon cancer patients.
In this study, we systematically analyzed the expression of 200 inflammatory response-related genes in colon cancer tissues and their relationship with survival. A prognostic model integrating four inflammatory response-related genes was constructed through Cox regression analysis and verified in GSE39582 and PCR data from 70 samples. The prognostic value of inflammation-related gene signature in our collected clinical samples was consistent with the results of online analysis (TCGA and GEO). Inflammation-related gene signature can be used for prognostic prediction in patients with COAD in TCGA, GSE39582 dataset and our qRT-PCR dataset.Using different platforms and subgroups of colon cancer patients, the 4-gene signature showed good prognostic prediction performance.
Our IRGS was based on immune-related genes, including SLC4A4, NMUR1, TIMP1, and TACR3. SLC4A4 encodes a sodium bicarbonate cotransporter (NBC) involved in regulating bicarbonate secretion and absorption and intracellular pH.22,23 Compared with normal tissues, SLC4A4 mRNA and protein levels are reduced in colon cancer tissues. Low expression of SLC4A4 is closely related to a shorter overall survival of CRC patients.24 NMUR1 belongs to the G-protein coupled receptor 1 family and is the receptor for neuromedin-U and neuromedin-S neuropeptides.25 Additionally, NMUR1 has been identified as a prognostic biomarker of oropharyngeal cancer26 and breast cancer patients.27 The proteins encoded by TIMP1 are natural inhibitors of matrix metalloproteinases (MMPs), which are important regulators of the extracellular environment. TIMP1 in serum could identify colon cancer patients with a poor prognosis. In patients showing no systemic inflammatory response, TIMP1 is also associated with a poor prognosis.28 TACR3 encodes the receptor for tachykinin neurokinin 3, also referred to as neurokinin B, and is abnormally expressed in bladder cancer29 and oral squamous cell carcinoma.30 In this study, both NMUR1 and TACR3 reported their prognostic value in colon cancer for the first time, and the underlying mechanism of action depends on further exploration.
The IRGS we constructed showed good prognostic ability in the training set (TCGA), validation set (GSE39582 and PCR) and colon cancer patients of different subtypes. Univariate and multivariate Cox analyses after including clinical features showed that the IRGS is an independent prognostic factor for colon cancer patients. To gain a deeper understanding of the relationship between risk scores and immune components, we studied the relationship between risk scores and immune infiltrating cells. The results showed that high-risk scores are closely related to macrophages (M0, M1, and M2). Macrophages are important immune cells that infiltrate tumor tissues.31 Macrophages play an important role in the local inflammatory response of tumors. Under the influence of the tumor microenvironment, macrophages exhibit a classic activation state (M1 type) and selective activation state (M2) type, play antitumor and tumor-promoting functions, respectively, and play an important role in the interaction between inflammation and tumors.32,33 This result further indicates the important role of macrophages in the immune response of colon cancer.
Therefore, we tried to further analyze the mechanism of IRGS in colon cancer. GSVA and GSEA showed that pathways such as WNT-β-catenin, focal adhesion, and TGF-β were enriched with an increasing risk score. The Wnt signaling pathway is evolutionarily conserved and can regulate embryonic development and maintain adult tissue homeostasis.34,35 Wnt signaling controls basic cell functions, including proliferation, differentiation, migration and stemness. In colon cancer, the WNT pathway is overactivated or overactivated due to genetic, epigenetic, or receptor/ligand changes.36,37 Focal adhesion is a type of cytoplasmic nonreceptor protein tyrosine kinase. FAK is the center of intracellular and extracellular signal entry and exit, mediating multiple signaling pathways.38,39 In colon cancer, the upregulation of FAK activity promotes the malignant biological behavior of tumor cells.40,41 The TGF_BETA pathway determines the specific fate of cells in the process of cell proliferation, embryogenesis, differentiation, and cell death.42,43 The results of this study suggest that methylation-related genes in colon cancer may function through pathways, such as the WNT-β-catenin, focal adhesion and TGF-β pathways.
Our inflammation-related gene signature was constructed based on TCGA-COAD dataset, GSE39582 dataset was used for validation. TCGA-COAD dataset was published in 2012, it suggest new markers for aggressive colorectal carcinoma and an important role for MYC-directed transcriptional activation and repression.44 GSE39582 dataset was published in 2013, researchers report a new classification of CC into six molecular subtypes that arise through distinct biological pathways.45 Different from previous research, we re-analysis these datasets for the initial screening of biomarkers and for validation.
Due to the advent of genomics, TCGA and GEO databases are available for exploring prognostic signatures in in colorectal cancer. Liu et al46 report deoxyribonuclease 1-like 3 could be a potential prognostic biomarker in colon cancer based on the results from TCGA and GEO datasets. Cao et al47 combined three independent datasets and screened to determine that CXCL11 is a prognostic biomarker in colon cancer. However, the expression of a single gene can vary among populations whereas, a multi-gene signature can compensate for individual differences and thus, can be more predictive and higher accuracy in comparison to single gene-expression based markers. Zhang et al48 constructed a 17 immune-related gene prognostic signature for colon cancer. Lv et al49 constructed of an 12 immune-related genes signature with prognostic value for colon cancer. Luo et al50 established a 17 immune-related genes model to predict colon adenocarcinoma prognosis. However, these models lack of sufficient advantages due to larger genes number and a lack of independent external verification. Compared with these models, our inflammation-related gene signature has a smaller number of genes, and shows better prediction performance in TCGA, GEO and our qRT-PCR data set from 70 tumor samples.
IRGS based on immune response-related genes can be used as an effective method to judge the prognosis of patients. However, there are still some limitations. First, the samples in our study were retrospective; prospective samples are required for verification. Second, we only analyzed the prognostic value and clinical significance of the IRGS. The mechanism of action of the four genes contained in the signature requires further experimental exploration.
Conclusion IRGS
Overall, we comprehensively analyzed the prognostic value of inflammatory response-related genes in colon cancer. The IRGS we constructed for the first time has stable predictive power in predicting the prognosis of patients. These findings provide potential clinical application tools for better management of the prognosis of colon cancer patients.
Disclosure
The authors report no conflicts of interest in this work.
References
1. Hofseth LJ, Hebert JR, Chanda A, et al. Early-onset colorectal cancer: initial clues and current views. Nat Rev Gastroenterol Hepatol. 2020;17(6):352–364.
2. Carethers JM, Jung BH. Genetics and genetic biomarkers in sporadic colorectal cancer. Gastroenterology. 2015;149(5):1177–1190.e3. doi:10.1053/j.gastro.2015.06.047
3. Okugawa Y, Grady WM, Goel A. Epigenetic alterations in colorectal cancer: emerging biomarkers. Gastroenterology. 2015;149(5):584.
4. Niu G, Deng L, Zhang X, et al. GABRD promotes progression and predicts poor prognosis in colorectal cancer. Open Med. 2020;15(1):1172–1183. doi:10.1515/med-2020-0128
5. Zhang L, Jiang X, Li Y, et al. Clinical correlation of Wnt2 and COL8A1 with colon adenocarcinoma prognosis. Front Oncol. 2020;10:1504. doi:10.3389/fonc.2020.01504
6. Liu J, Jiang C, Xu C, et al. Identification and development of a novel invasion-related gene signature for prognosis prediction in colon adenocarcinoma. Cancer Cell Int. 2021;21(1):101. doi:10.1186/s12935-021-01795-1
7. Hanahan D, Weinberg RA. Hallmarks of cancer: the next generation. Cell. 2011;144(5):646–674. doi:10.1016/j.cell.2011.02.013
8. Qian S, Golubnitschaja O, Zhan X. Chronic inflammation: key player and biomarker-set to predict and prevent cancer development and progression based on individualized patient profiles. EPMA J. 2019;10(4):365–381. doi:10.1007/s13167-019-00194-x
9. Neagu M, Constantin C, Caruntu C, Dumitru C, Surcel M, Zurac S. Inflammation: a key process in skin tumorigenesis. Oncol Lett. 2019;17(5):4068–4084.
10. Wu Y, Antony S, Meitzler JL, Doroshow JH. Molecular mechanisms underlying chronic inflammation-associated cancers. Cancer Lett. 2014;345(2):164–173. doi:10.1016/j.canlet.2013.08.014
11. Diakos CI, Charles KA, McMillan DC, Clarke SJ. Cancer-related inflammation and treatment effectiveness. Lancet Oncol. 2014;15(11):e493–e503. doi:10.1016/S1470-2045(14)70263-3
12. Galizia G, Lieto E, Zamboli A, et al. Neutrophil to lymphocyte ratio is a strong predictor of tumor recurrence in early colon cancers: a propensity score-matched analysis. Surgery. 2015;158(1):112–120. doi:10.1016/j.surg.2015.02.006
13. Malik HZ, Prasad KR, Halazun KJ, et al. Preoperative prognostic score for predicting survival after hepatic resection for colorectal liver metastases. Ann Surg. 2007;246(5):806–814. doi:10.1097/SLA.0b013e318142d964
14. Turner N, Wong H-L, Templeton A, et al. Analysis of local chronic inflammatory cell infiltrate combined with systemic inflammation improves prognostication in stage II colon cancer independent of standard clinicopathologic criteria. Int j Cancer. 2016;138(3):671–678. doi:10.1002/ijc.29805
15. Liang Y, Su Q, Wu X. Identification and validation of a novel six-gene prognostic signature of stem cell characteristic in colon cancer. Front Oncol. 2020;10:571655. doi:10.3389/fonc.2020.571655
16. Newman AM, Steen CB, Liu CL, et al. Determining cell type abundance and expression from bulk tissues with digital cytometry. Nat Biotechnol. 2019;37(7):773–782. doi:10.1038/s41587-019-0114-2
17. Puccini A, Lenz H-J. Colorectal cancer in 2017: practice-changing updates in the adjuvant and metastatic setting. Nat Rev Clin Oncol. 2018;15(2):77–78. doi:10.1038/nrclinonc.2017.185
18. Sveen A, Kopetz S, Lothe RA. Biomarker-guided therapy for colorectal cancer: strength in complexity. Nat Rev Clin Oncol. 2020;17(1):11–32.
19. Lech G, Słotwiński R, Słodkowski M, Krasnodębski IW. Colorectal cancer tumour markers and biomarkers: recent therapeutic advances. World j Gastroenterol. 2016;22(5):1745–1755. doi:10.3748/wjg.v22.i5.1745
20. Rabbenou W, Ullman TA. Risk of colon cancer and recommended surveillance strategies in patients with ulcerative colitis. Gastroenterol Clin North Am. 2020;49(4):791–807. doi:10.1016/j.gtc.2020.08.005
21. Nasef NA, Mehta S. Role of inflammation in pathophysiology of colonic disease: an update. Int J Mol Sci. 2020;21(13):4748. doi:10.3390/ijms21134748
22. Aalkjaer C, Boedtkjer E, Choi I, Lee S. Cation-coupled bicarbonate transporters. Compr Physiol. 2014;4(4):1605–1637.
23. McIntyre A, Hulikova A, Ledaki I, et al. Disrupting hypoxia-induced bicarbonate transport acidifies tumor cells and suppresses tumor growth. Cancer Res. 2016;76(13):3744–3755. doi:10.1158/0008-5472.CAN-15-1862
24. Yang H, Lu Y, Lan W, Huang B, Lin J. Down-regulated solute carrier family 4 member 4 predicts poor progression in colorectal cancer. J Cancer. 2020;11(12):3675–3684. doi:10.7150/jca.36696
25. Wallrapp A, Riesenfeld SJ, Burkett PR, et al. The neuropeptide NMU amplifies ILC2-driven allergic lung inflammation. Nature. 2017;549(7672):351–356. doi:10.1038/nature24029
26. Misawa K, Mima M, Satoshi Y, et al. Neuropeptide receptor genes GHSR and NMUR1 are candidate epigenetic biomarkers and predictors for surgically treated patients with oropharyngeal cancer. Sci Rep. 2020;10(1):1007. doi:10.1038/s41598-020-57920-z
27. Jia R, Li Z, Liang W, et al. Identification of key genes unique to the luminal a and basal-like breast cancer subtypes via bioinformatic analysis. World J Surg Oncol. 2020;18(1):268. doi:10.1186/s12957-020-02042-z
28. Böckelman C, Beilmann-Lehtonen I, Kaprio T, et al. Serum MMP-8 and TIMP-1 predict prognosis in colorectal cancer. BMC Cancer. 2018;18(1):679. doi:10.1186/s12885-018-4589-x
29. Zaravinos A, Lambrou GI, Boulalas I, Delakas D, Spandidos DA. Identification of common differentially expressed genes in urinary bladder cancer. PLoS One. 2011;6(4):e18135. doi:10.1371/journal.pone.0018135
30. Obata K, Shimo T, Okui T, et al. Tachykinin receptor 3 distribution in human oral squamous cell carcinoma. Anticancer Res. 2016;36(12):6335–6341. doi:10.21873/anticanres.11230
31. Murray PJ. On macrophage diversity and inflammatory metabolic timers. Nat Rev Immunol. 2020;20(2):89–90. doi:10.1038/s41577-019-0260-2
32. DeNardo DG, Ruffell B. Macrophages as regulators of tumour immunity and immunotherapy. Nat Rev Immunol. 2019;19(6):369–382. doi:10.1038/s41577-019-0127-6
33. Vitale I, Manic G, Coussens LM, Kroemer G, Galluzzi L. Macrophages and metabolism in the tumor microenvironment. Cell Metab. 2019;30(1):36–50. doi:10.1016/j.cmet.2019.06.001
34. Pond KW, Doubrovinski K, Thorne CA. Wnt/β-catenin signaling in tissue self-organization. Genes. 2020;11(8):939. doi:10.3390/genes11080939
35. Zhong Z, Virshup DM. Wnt signaling and drug resistance in cancer. Mol Pharmacol. 2020;97(2):72–89. doi:10.1124/mol.119.117978
36. Shen P, Pichler M, Chen M, Calin GA, Ling H. To Wnt or lose: the missing non-coding linc in colorectal cancer. Int J Mol Sci. 2017;18(9):2003. doi:10.3390/ijms18092003
37. Cheriyamundath S, Ben-Ze’ev A. Wnt/β-catenin target genes in colon cancer metastasis: the special case of L1CAM. Cancers. 2020;12(11):3444. doi:10.3390/cancers12113444
38. Dawson JC, Serrels A, Stupack DG, Schlaepfer DD, Frame MC. Targeting FAK in anticancer combination therapies. Nat Rev Cancer. 2021;21(5):313–324. doi:10.1038/s41568-021-00340-6
39. Urciuoli E, Peruzzi B. Involvement of the FAK network in pathologies related to altered mechanotransduction. Int J Mol Sci. 2020;21(24):9426. doi:10.3390/ijms21249426
40. Ying H, Lin F, Ding R, Wang W, Hong W. Extracellular vesicles carrying miR-193a derived from mesenchymal stem cells impede cell proliferation, migration and invasion of colon cancer by downregulating FAK. Exp Cell Res. 2020;394(2):112144. doi:10.1016/j.yexcr.2020.112144
41. Hao H-F, Takaoka M, Bao X-H, et al. Oral administration of FAK inhibitor TAE226 inhibits the progression of peritoneal dissemination of colorectal cancer. Biochem Biophys Res Commun. 2012;423(4):744–749. doi:10.1016/j.bbrc.2012.06.030
42. Derynck R, Turley SJ, Akhurst RJ. TGFβ biology in cancer progression and immunotherapy. Nat Rev Clin Oncol. 2021;18(1):9–35.
43. Batlle E, Massagué J. Transforming growth factor-β signaling in immunity and cancer. Immunity. 2019;50(4):924–940. doi:10.1016/j.immuni.2019.03.024
44. Cancer Genome Atlas Network. Comprehensive molecular characterization of human colon and rectal cancer. Nature. 2012;487(7407):330–337. doi:10.1038/nature11252
45. Marisa L, de Reyniès A, Duval A, et al. Gene expression classification of colon cancer into molecular subtypes: characterization, validation, and prognostic value. PLoS Med. 2013;10(5):e1001453. doi:10.1371/journal.pmed.1001453
46. Liu X, Yu W, Liang C, et al. INHBA is a prognostic predictor for patients with colon adenocarcinoma. BMC Cancer. 2020;20(1):305. doi:10.1186/s12885-020-06743-2
47. Cao Y, Jiao N, Sun T, et al. CXCL11 correlates with antitumor immunity and an improved prognosis in colon cancer. Front Cell Dev Biol. 2021;9:646252. doi:10.3389/fcell.2021.646252
48. Zhang Q, Feng Z, Zhang Y, Shi S, Zhang Y, Ren S. Identification and verification of a 17 immune-related gene pair prognostic signature for colon cancer. Biomed Res Int. 2021;2021:6057948. doi:10.1155/2021/6057948
49. Lv Y, Wang X, Ren Y, Fu X, Li T, Jiang Q. Construction of an immune-related signature with prognostic value for colon cancer. PeerJ. 2021;9:e10812. doi:10.7717/peerj.10812
50. Luo J, Liu P, Wang L, et al. Establishment of an immune-related gene pair model to predict colon adenocarcinoma prognosis. BMC Cancer. 2020;20(1):1071. doi:10.1186/s12885-020-07532-7
 © 2021 The Author(s). This work is published and licensed by Dove Medical Press Limited. The
full terms of this license are available at https://www.dovepress.com/terms
and incorporate the Creative Commons Attribution
- Non Commercial (unported, 3.0) License.
By accessing the work you hereby accept the Terms. Non-commercial uses of the work are permitted
without any further permission from Dove Medical Press Limited, provided the work is properly
attributed. For permission for commercial use of this work, please see paragraphs 4.2 and 5 of our Terms.
© 2021 The Author(s). This work is published and licensed by Dove Medical Press Limited. The
full terms of this license are available at https://www.dovepress.com/terms
and incorporate the Creative Commons Attribution
- Non Commercial (unported, 3.0) License.
By accessing the work you hereby accept the Terms. Non-commercial uses of the work are permitted
without any further permission from Dove Medical Press Limited, provided the work is properly
attributed. For permission for commercial use of this work, please see paragraphs 4.2 and 5 of our Terms.