Back to Journals » Patient Preference and Adherence » Volume 19
Health State Utility Values Associated with Knee Osteoarthritis: A Vignette-Based Approach
Authors Ramos-Goñi JM, Janssen MF, Perez-Nieves M ![]() , Rivero-Arias O, Gonsahn-Bollie S, Boye KS
, Rivero-Arias O, Gonsahn-Bollie S, Boye KS ![]()
Received 20 August 2025
Accepted for publication 30 October 2025
Published 6 November 2025 Volume 2025:19 Pages 3469—3482
DOI https://doi.org/10.2147/PPA.S555596
Checked for plagiarism Yes
Review by Single anonymous peer review
Peer reviewer comments 2
Editor who approved publication: Dr Johnny Chen
Juan M Ramos-Goñi,1,2 Mathieu F Janssen,1 Magaly Perez-Nieves,3 Oliver Rivero-Arias,1,4 Sylvia Gonsahn-Bollie,3 Kristina S Boye3
1Maths in Health, Klimmen, Limburg, the Netherlands; 2Decision Analysis and Support Unit, SGH. Warsaw School of Economics, Warsaw, Poland; 3Eli Lilly and Company, Indianapolis, IN, USA; 4Nuffield Department of Population Health, National Perinatal Epidemiology Unit, University of Oxford, Oxford, UK
Correspondence: Juan M Ramos-Goñi, Maths in Health, Klimmen, Limburg, the Netherlands, Tel +34670757100, Email [email protected]
Purpose: Pain is the most common symptom of Osteoarthritis (OA) making OA one of the most frequent causes of mobility dependence and disability and resulting in a significant negative impact on health-related quality of life (HRQoL). The main objective of this study was to estimate health state utility values (HSUVs) associated with different levels of pain related to Knee OA (KOA).
Patients and Methods: Six different health state vignettes were developed using best practices and real-world data from the Osteoarthritis Initiative (OAI) database that included the Western Ontario and McMaster Universities Osteoarthritis Index (WOMAC) instrument. OAI data from individuals with KOA were categorized into 6 different pain profiles using patient responses to the WOMAC pain items (pain while: walking; climbing stairs; sleeping; resting and standing) each having response levels 0 (no)-4 (extreme). The six vignettes identified the most frequently observed response levels of the pain items. A time trade-off study was conducted in the UK among individuals with KOA.
Results: Analysis dataset included 198 interviews. Participants’ mean age was 51.6 years and 58.6% were females. Mean HSUVs ranged from 0.983 for the mildest health state, which was described as slight pain while climbing stairs and no pain on the other items, to 0.305 for the most severe health state which was described as extreme pain in all items.
Conclusion: This is the first known set of HSUVs estimated describing levels of pain most commonly reported by individuals with KOA. The results demonstrate considerable HRQoL burden in individuals with KOA.
Keywords: vignettes, time-trade-off, knee osteoarthritis, overweight/obesity, pain
Introduction
Pain is the most common symptom of osteoarthritis (OA)1 making OA one of the most frequent causes of mobility dependence and disability, affecting around 240 million individuals worldwide.2 In addition to pain, OA symptoms include stiffness, swollen joints, loss of function and disability, resulting in a significant negative impact on the individuals’ health-related quality of life (HRQoL).3 A recent meta-analysis of prospective studies has estimated that individuals with overweight or obesity are significantly associated with a higher Knee OA (KOA) risk of 2.45 (95% Confidence Interval (CI) 1.88–3.20) and 4.55 (95% CI 2.90–7.13), respectively, compared to individuals without overweight or obesity.4 Therefore, weight reduction is currently recommended in patients with KOA in guidelines by the United States (US) American College of Rheumatology5 and the United Kingdom (UK) National Institute for Health and Care Excellence (NICE).6
Health State Utility Values (HSUVs) are used to calculate quality-adjusted life years (QALYs), a preferred measure of benefit used in the economic evaluation of health care technologies.7,8 HSUVs used for QALY calculations are placed on a scale where 0 denotes the health state “dead” and 1 the health state “full health”. Health states considered worse than dead are allowed and identified with negative values. HRQoL can be measured directly by patients completing a generic multi-attribute utility instrument (MAUI), and their responses can be translated onto an HSUV using a value set that is typically based on preferences from the general population.9 When feasible, this method is generally recommended, with the EQ-5D instrument being the preferred MAUI by many health technology assessment organizations7 including NICE.8 However, EQ-5D is a generic (non-disease specific) instrument, and it may not be sufficiently sensitive to capture important changes associated with specific treatment effects and therefore might not fully capture all effects experienced by a patient for a condition. When EQ-5D is not appropriate, NICE guidelines suggest that HSUVs may be obtained by using alternative approaches such as another generic or disease-specific MAUIs, or by using utilities derived from a vignette-based valuation study.8 In the case of treatments for individuals with KOA, the EQ-5D may not be sufficiently sensitive, as it only includes one generic item for pain. Therefore, in an effort to fully capture the patient’s experience associated with this condition, specific HSUVs including different aspects of pain are needed.
Specific HSUVs in the adult population associated with OA are available in the literature.10 A US study evaluating the cost-effectiveness of diet and exercise for patients with overweight or obesity with KOA employed HSUVs associated with different intervals on the Western Ontario and McMaster Universities Osteoarthritis Index (WOMAC) pain scale.11 These HSUVs were derived using a preference-based algorithm to transform SF-12 responses provided by participants of the Osteoarthritis Initiative (OAI)12 (into HSUVs). However, the SF-12 is a generic HRQoL instrument similar to the EQ-5D and unlikely to capture all aspects of pain relevant to KOA. To our knowledge, no HSUVs specific to individuals with KOA focusing on pain are available. The main objective of this study was to more accurately estimate HSUVs associated with different levels of pain related to KOA.
Methods
Study Design
This study was conducted in accordance with the ethical principles that have their origin in the Declaration of Helsinki and that are consistent with Good Pharmacoepidemiology Practices (GPPs) and applicable laws and regulations of the UK, where the study was conducted. The study protocol was submitted and approved by the external ethical review board of the University of Portsmouth, UK (Protocol: 24/ETHIC/005).
The valuation study consisted of a vignette-based stated preference exercise using the classic time trade-off (TTO) elicitation technique.13,14 All data were collected via computer-assisted personal interviewing (CAPI). Participants completed an interviewer-led electronic survey in which their TTO responses were captured. All participants read the information sheet and given the electronic nature of the interview, they gave electronic consent to participate prior to the interview started. The main study was preceded by a pilot study to test the design of the survey instrument in terms of clarity of wording, feasibility and the participants’ cognitive burden. The interviews in the pilot study were administered in-person by two lead researchers of this work, while for the main study, interviews were conducted via videoconference by experienced professional interviewers.
Vignette Development
Real-world evidence from the OAI, a multicenter, longitudinal, prospective observational study of KOA, was used to support the development of the vignettes. The OAI compromises data of 4796 men and women aged 45 to 79 years who had or were at risk of having symptomatic tibiofemoral OA at five US centers.12
The core of the vignettes (hereafter pain-based vignettes) consisted of a description of WOMAC pain items for six severity classes based on the WOMAC pain subscale. The following approach was used: First, all patient outcome data of the OAI database were categorized into 6 classes using the WOMAC Osteoarthritis Index Version LK3.1 pain subscale (range 0–20). The classes were defined as follows: 1) Slight1 (pain scale 1–3); 2) Slight2 (pain scale 4–6); 3) Moderate1 (pain scale 7–9); 4) Moderate2 (pain scale 10–12); 5) Severe1 (pain scale 13–16); 6) Severe2 (pain scale 17–20).
The development of the pain-based vignettes was based on the frequencies of responses for each WOMAC pain item (pain while: walking; climbing stairs; sleeping; resting and standing). Using this approach, the levels of responses (no; slight; moderate; severe or extreme pain) of each pain item within each of the six severity classes were tabulated. The following rule was adopted for selecting vignettes: for each pain item, if more than 50% of responses were associated to a single level, that level was used to describe the item within the vignette; otherwise, the two most frequent response levels were used for the vignette description (eg, “slight to moderate pain while resting”). See Figure 1 for the resulting six pain-based vignettes, which were labeled: Slight 1 (SL1), Slight 2 (SL2), Moderate 1 (MD1), Moderate 2 (MD2), Severe 1 (SV1), and Severe 2 (SV2).
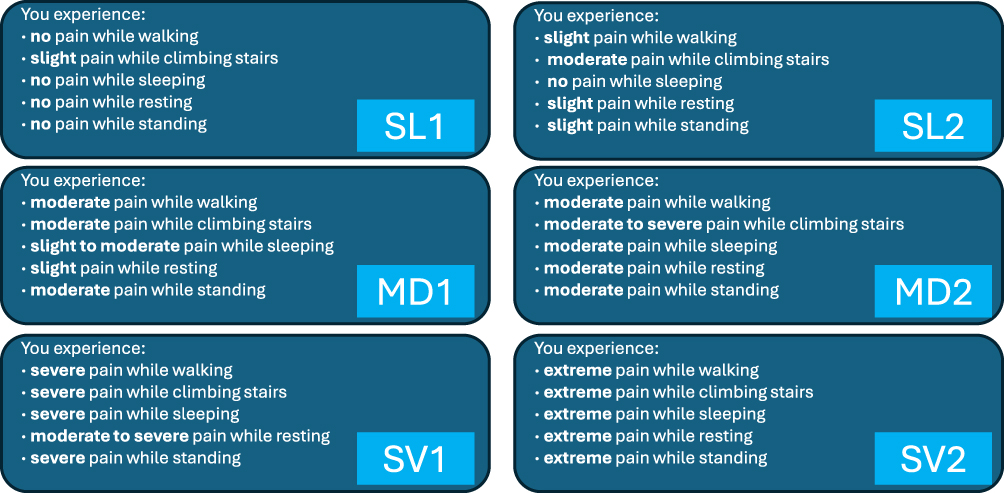 |
Figure 1 Pain-based vignettes. SL1 slight 1, SL2 slight 2, MD1 moderate 1, MD2 moderate 2, SV1 severe 1, SV2 severe 2. |
Beyond pain, KOA patients typically suffer physical limitations that significantly impact their mobility and daily physical functioning. The possibility of complementing the pain-based vignettes with a description of physical function was explored, also based on empirical WOMAC data from the OAI database. Therefore, six additional vignettes were developed to capture the six levels of pain described above along with their corresponding physical functioning problems (hereafter pain+physical-based vignettes). The physical function subscale of the WOMAC Osteoarthritis Index Version LK3.1 consists of 17 items, each having scores ranging from 0 to 4. As it was not feasible to include that many items’ descriptions in a single vignette, it was decided to use the mean of the sum scores of the 17 physical function items (range 0–68). The mean sum score was calculated for each of the 6 classes used to develop the six pain-based vignettes. Then, the mean sum of the physical function scores per class were re-scaled to a 0 (no problems)–10 (extreme problems) scale and added to the pain descriptions in the form of a horizontal visual scale (see Figure S1).
Pilot Insights
The aim of the pilot study was to inform the final number of vignettes to complete per participant, the final wording included and the format of the vignette presentation. Twenty participants were recruited for this exercise. Sixty-five percent were female. Age, education and BMI were uniformly distributed from 37 to 72 for age; from level 2 to level 4 for education; and from 29 kg/m2 to 45 kg/m2 for BMI. All the twelve developed vignettes (six pain-based and six pain+physical-based vignettes) were initially used in the pilot. Feedback from the pilot participants suggested that valuing twelve vignettes imposed a significant cognitive burden. Therefore, to prevent cognitive overload, the main valuation study included nine vignettes per participant. This number was chosen as most participants in the pilot started experiencing fatigue after completing 10 or more vignettes. In the main valuation study, all six pain-based vignettes were included. However, the six pain+physical-based vignettes were split into two blocks of three vignettes each. The two blocks were constructed by ordering the six pain+physical-based vignettes by severity and taking the first, third and fifth in one block and the second, fourth and sixth in the other block. Participants were randomly allocated to one of the two blocks.
Interviews Workflow
First, the interviewer read the information sheet aloud with the participant. The participant had the option of agreeing or declining to participate. If agreed to participate, key demographic information was collected. Then, the interviewer collected clinical information including the KOA diagnosis and which knee was affected (if both knees were affected, it was asked which knee was most affected). Subsequently, questions were asked about the age at diagnosis, the type of health care provider that treats the participant for their KOA, and the impact of their KOA on different aspects of their life. Before stating preferences, participants self-reported their health by selecting which pain-based vignette most closely described their current status.
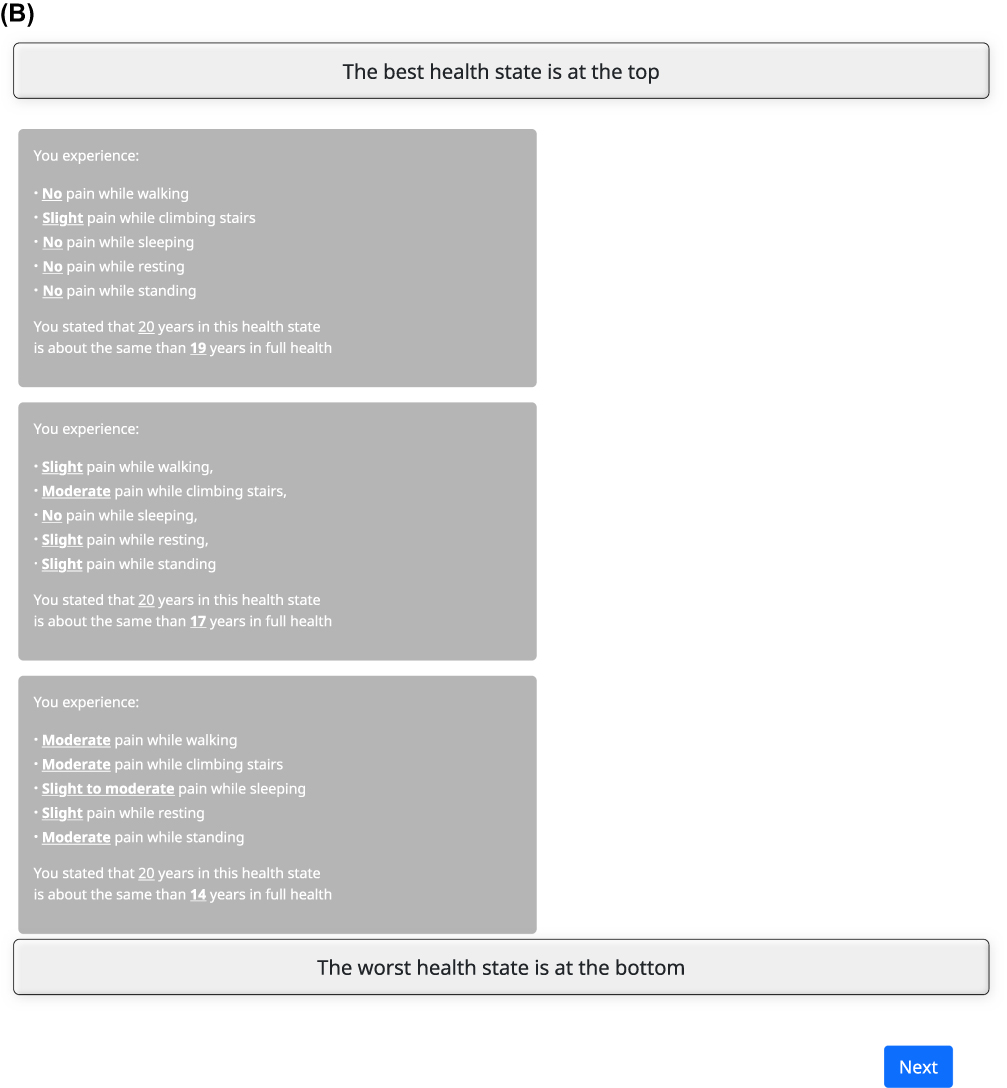
The participant then was asked to rank the six pain-based vignettes by severity. This task assisted participants familiarize themselves with the vignettes for the subsequent time trade-off (TTO) valuation (see Figure 2A for a TTO example). After ranking, a general TTO example was administered. This served to familiarize the participant with the TTO, ie, the elements on the screen, the 20-year time horizon and the classic “ping-pong” iteration procedure.15 In this TTO, no worse than dead values were allowed in the tasks. Next, the participant was administered a practice health state using a pain-based vignette. This step allowed the participant to practice with the TTO task and ask any questions. Thereafter, participants valued the six pain-based vignettes (in random order by participant) using TTO. All the valued pain-based vignettes were subsequently presented in descending order corresponding to the values provided by the participant and the interviewer asked the participant whether they wanted to review their valuations (see Figure 2B Feedback module example). Participants were allowed to select any vignettes they thought had been incorrectly ordered and re-valued them, repeating the TTO task.
Figure 2 Continued. Figure 2 TTO and feedback module examples. (A) TTO tasks example. (B) Feedback module tasks example.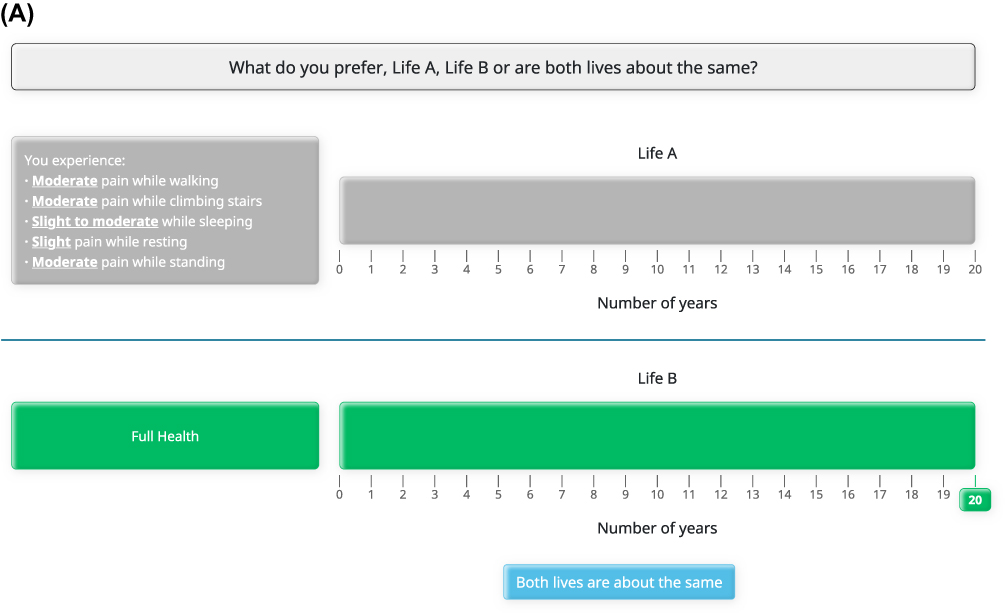
Once the pain-based vignettes exercise had been completed, a new TTO section was administered with three pain+physical-based vignettes. To prevent cognitive overload, no response-based ranking presentation or re-valuation opportunities were given for the pain+physical-based vignettes as this section was a methodological add-on.
In the final section of the interview, participants completed questions about their interests in reducing their weight, the potential impact of reducing weight on quality of life (not reported in this manuscript), and the EQ-5D-5L.
Sample Size
There is no consensus regarding the minimally acceptable sample size for a TTO study and sample sizes reported in published studies vary widely.16–27 It was acknowledged that the variance of HSUVs depends on the severity of the health state being valued with more severe health states exhibiting a higher variance than less severe health states.28 Therefore, we focused on achieving a precise estimate for the worse health states, implying that all other health states would be estimated with a higher precision. According to the literature, the SF-6D-based minimal important difference (MID) for assessing HSUVs variations across knee symptom severity groups is estimated to be 0.04 on average.29,30 In order to estimate utility values with a precision of 0.04, assuming an expected standard deviation of ~0.56 (based on previous valuation studies31) the sample size was calculated as follows: (N= (σ/ε)2 =(0.56/0.04)2≈196). The target sample size for this study was rounded to 200 participants.
Participant Recruitment and Compensation
Individuals with overweight (BMI ≥ 27 kg/m2 and BMI < 30 kg/m2) or obesity (BMI > 30 kg/m2), a self-reported diagnosis of KOA, being able to understand and read English and living in England, Wales or Scotland were included in the study. A balanced age/gender sample composition in the sample was sought. A specialized recruiting company in the UK reached potential participants, when a particular subject was eligible to participate in the study, they were invited to an online booking system where they completed their baseline information, and an appointment was made with one of the interviewers. For the main study, participating patients were interviewed via videoconference, whereas the pilot study was conducted face-to-face. All participants were provided with a monetary incentive of 100 pounds for completing an interview with an expected time commitment of approximately 1.5 hours.
Statistical Analysis
Participant characteristics were described by means and standard deviations (SDs) for continuous variables and proportions and counts for discrete variables. The primary output consisted of aggregate level statistics for HSUVs of each vignette, in the form of means and SDs. Given that the TTO tasks used did not allow responses below zero (ie, “worse than dead” values), there was a possibility that participants might have reported negative HSUVs if they had been given the option. Censored means were therefore also calculated by estimating a Tobit model for each vignette (ie, with data for a single vignette only) without independent variables, making the model’s constant the censored mean of the vignette. Disutilities between consecutive vignettes (one severity class apart in terms of descriptive severity) were also reported to show the potential health benefits when moving from one to another vignette.
All analysis was performed using Excel and Stata.
Results
Descriptive Statistics
A total of 203 interviews with individuals with KOA and severe overweight or obesity were conducted in the UK. Five interviews were excluded, four due to reporting different information (age or BMI) between recruitment screening and interview, one due to the participant not paying adequate attention (ie, not focusing on the tasks). A total of 198 individuals were included in the final sample, with 58.6% being female and 41.4% being male. Participant’s demographic data is presented in Table 1. The mean (SD) age was 51.6 (11.4) years. The mean (SD) age at KOA diagnosis was 45.3 (12.0) years. About 57.1% of the sample were living in England, while 37.9% were living in Scotland. The remaining 5% of the sample were living in Northern Ireland or Wales. About 40.4% of the sample had a level 2 education, ie, school certification or below. Most of the sample (75.7%) were white, either British or non-British, while 16.7% were black. Most of the individuals (68.2%) were in employment or self-employed, while 17.2% were retired.
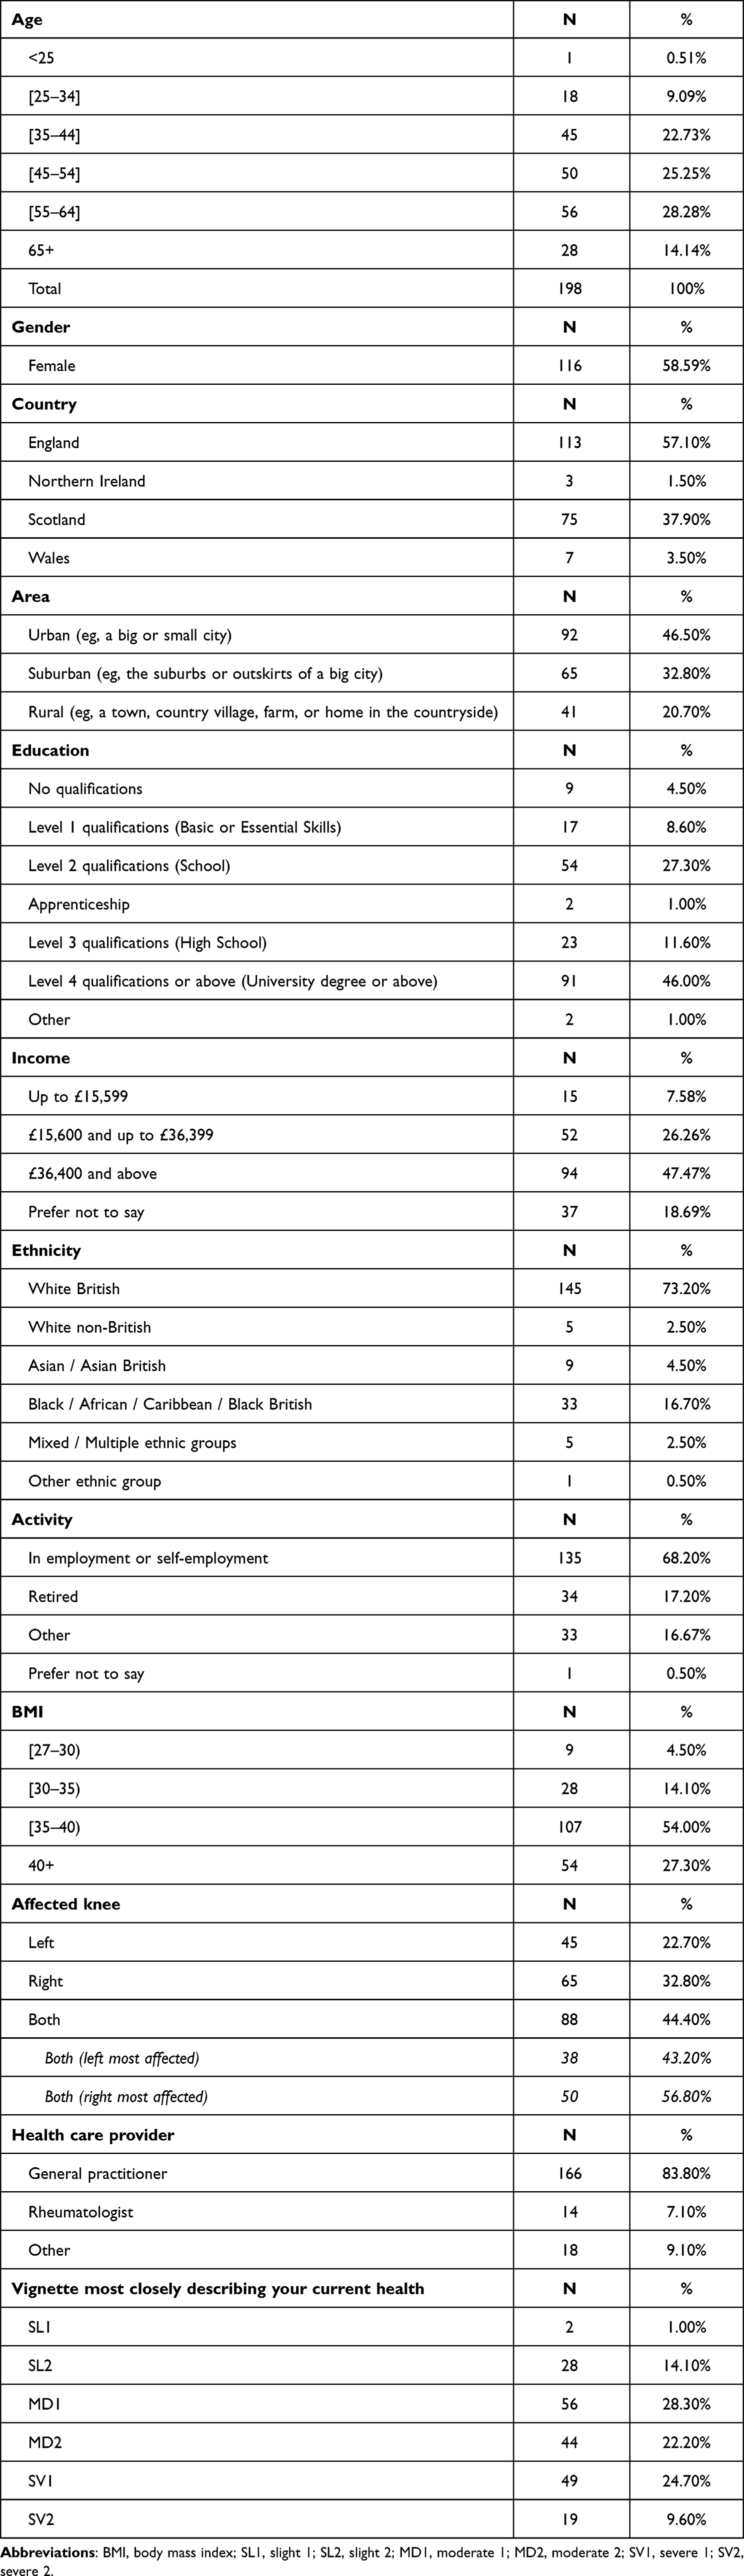 |
Table 1 Sample Characteristics |
Table 1 also reports participant’s clinical information. The mean (SD) BMI was 38.3 Kg/m2 (6.9 Kg/m2). Most of the individuals (54%) had a BMI higher or equal to 35Kg/m2, while 18.6% had a BMI lower than 35Kg/m2. About 27.3% of the sample individuals had a BMI equal to or above 40Kg/m2. The great majority of participants (83.8%) were managing their KOA symptoms though a general practitioner. Self-reported pain differed between self-reported health via pain-based vignettes, where 15.1% of the sample individuals reported being in SL1 or SL2 pain-based vignettes (ie, slight pain) (Table 1), and EQ-5D-5L self-reported health, where 31.3% of the sample individuals reported no pain (0.5%) or slight pain (30.8%) (Table S1).
Ranking Results
Table 2 shows how often (percentage and absolute numbers) each of the six vignettes (table rows) were placed in which position (table columns) in the ranking task. Most of the participants (99%) ranked the SL1 vignette in the first position. MD1 and MD2 vignettes were placed in the appropriate order based on the defined severity of the vignettes in 93.9% of the observed rankings. For the most severe vignettes SV1 and SV2 the percentages of appropriate order based on defined severity were 96% and 96.5%, respectively.
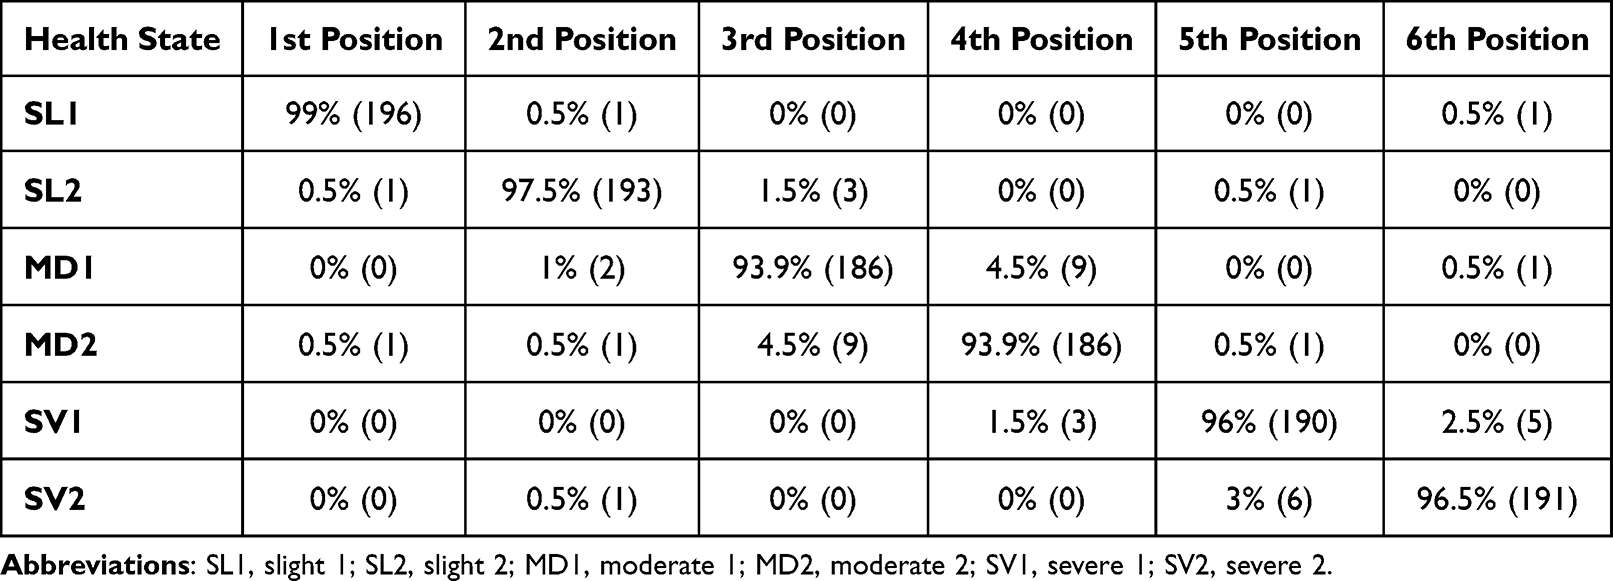 |
Table 2 Ranking Task |
TTO Results
Mean utilities for the six pain-based vignettes ranged from 0.305 (SV2) to 0.983 (SL1). The level of agreement among the sample individuals about the vignette’s utilities decreased when the severity of the vignette increased. The SD of the SL1 vignette was 0.069, and the SD of the SV2 vignette was 0.288. When looking at differences between consecutive pain-based vignettes, the difference between SV1 and MD2 was −0.252, which was the largest difference between consecutives pain-based vignettes (Table 3). If a patient moves from experiencing the health state described by the SV2 pain-based vignette to the SL1 pain-based-vignette the utility gain will be 0.678. Corresponding WOMAC pain subscale scores (sum and mean) based on the vignette profiles are also shown, as well as changes in these scores between consecutive vignettes, for both WOMAC versions and in percentage as well.
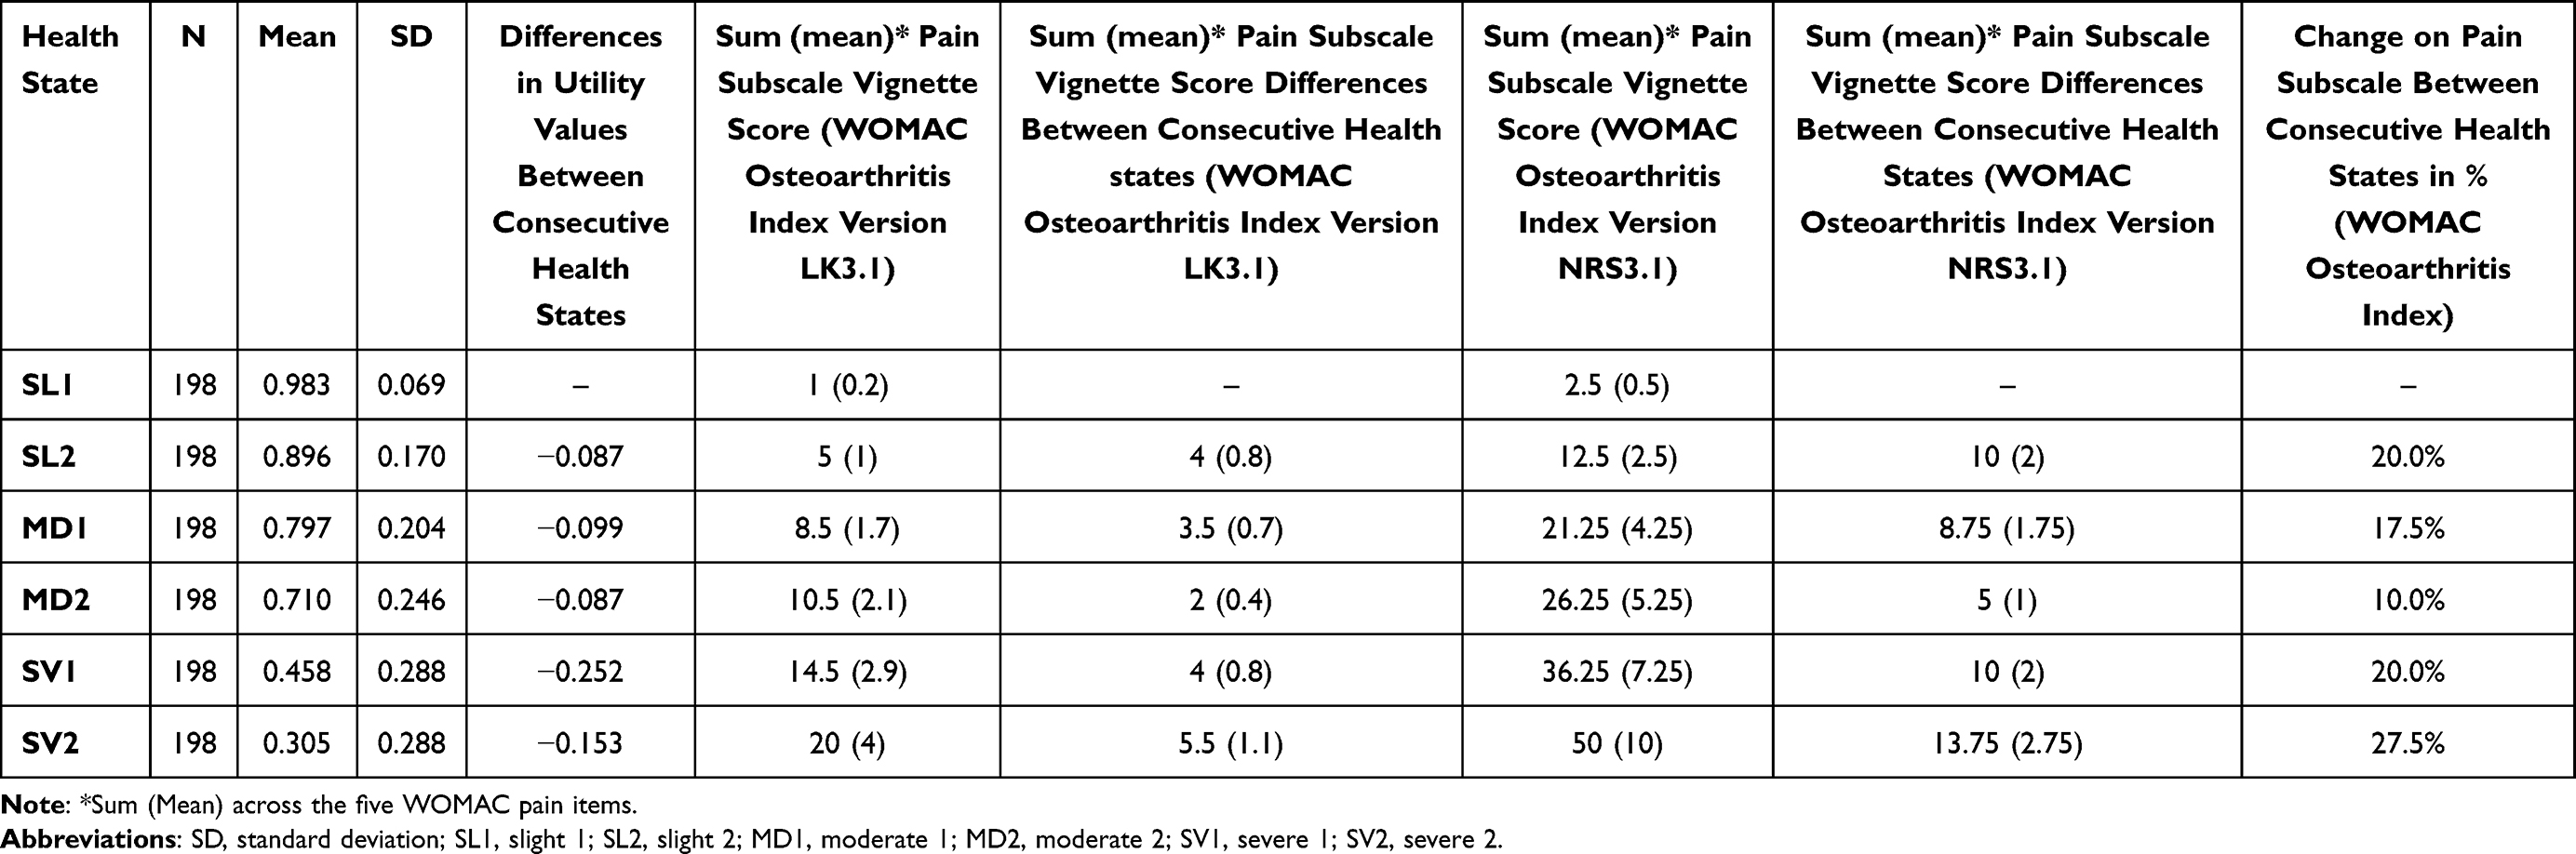 |
Table 3 Mean Differences Between Utility Values for the Pain-Based Vignettes |
The mean utilities for the six pain+physical-based vignettes ranged from 0.283 (SV2), with 96 participants valuing this vignette, to 0.965 (SL1), with 102 participants valuing this vignette (Table S2). When considering censored values, ranges went from 0.247 (SV2) to 0.983 (SL1) for the pain-based vignettes and from 0.221 (SV2) to 0.965 (SL1) for the pain+physical-based vignettes (Table S3). If a patient moves from experiencing the health state described by the SV2 pain+physical-based vignette to the SL1 pain+physical-based vignette the utility gain will be 0.682 (Table S3). When considering censored values, moving from SV2 to SL1 produces a utility gain of 0.736 for the pain-based vignettes and 0.744 for the pain+physical-based vignettes.
Discussion
In this study, HSUVs associated with different levels of pain were derived from individuals with KOA using a TTO vignette-based approach. The findings revealed a range of HSUVs, with a utility value of 0.304 for the most severe pain scenario and a value of 0.983 for the mildest.32 This wide range of values not only demonstrated the substantial impact of pain in terms of stated preferences but also indicated face validity of the observed results because it revealed that participants’ preferences were aligned with their subjective assessments of the pain’s severity.
The study also investigated the combined effect of pain and physical functioning on HSUVs, indicating that on average HSUVs for pain+physical-based vignettes were only slightly lower than those based on pain-based scenarios, by a mean disutility of 0.025. This suggests that individuals with KOA might perceive physical functioning and pain as interrelated, with the presence of pain often implying physical issues. The feedback from some participants confirmed their tendency to assume that physical functioning problems would accompany pain. This underscores the importance of considering the interplay between the impact of KOA on pain and physical functioning, and it is difficult to separate these when evaluating health-related scenarios.33
Two previous studies have reported HSUVs for individuals with KOA undergoing knee arthroplasty. Both studies used the EQ-5D-3L and the UK value set.34 Elcock et al included patients with BMI ≥ 40 Kg/m2 and mean age of 65.2 years-old, they reported median HSUVs of 0.159 (0.05 to 0.620) for pre-surgery and 0.691 (0.576 to 0.796) post-surgery.35 While Yapp et al included patients with median BMI of 30.1 Kg/m2 and median age of 69.9 years-old, they reported a mean HSVU of 0.426 (median 0.59) pre-surgery and a mean HSUV of 0.748 (median 0.796) post-surgery.36 Given that both studies included individuals with KOA undergoing knee arthroplasty who were in severe pain before surgery, these results align with the results presented here. A study conducted by Harris et al also reported HSUVs by using the AQoL-8D instrument.37 This study included individuals with KOA with average knee pain severity ≥4 on an 11-point numerical rating scale undergoing Telehealth-Delivered Exercise and Dietary Weight Loss Programs. Mean HSUVs reported by Harris et al ranged from 0.71 to 0.78. Given the level of pain of the individuals with KOA included by Harris et al, it can be safely assumed that they were in moderate pain according to the presented vignettes here, therefore the HSUVs also align with the HSUVs of the MD1 (0.797) and MD2 (0.710) pain-based vignettes. Another study conducted by Singh et al in Australia included patients with mean BMI of 27.18 kg/m2 and mean age 43.5 years-old. They reported HSUVs for different WOMAC-based levels of pain using the SF-6D preference-based instrument and the UK value set. Results ranged from 0.820 for normal WOMAC scores to 0.740 for severe WOMAC scores. Singh et al results do not align with the other studies by Elcock et al, Yapp et al, and Harris et al, nor with the vignette-based HSUVs being presented here. There are two main reasons for this discrepancy, first, the Singh et al definitions of pain severity based on the WOMAC score were different than the definition being presented here. Singh et al defined moderate pain as scores ≤ 5 (out of 45), which aligns with the “Slight1” vignette presented here, while severe pain was characterized by scores > 5 (out of 45), matching the “Slight2” vignette presented here. Secondly, Singh et al’s study involved participants who were younger and had a lower BMI compared to those in the studies by Elcock et al, Yapp et al, and Harris et al, as well as to the participants in this vignette study. Consequently, the outcomes for the slight to moderate pain-based vignettes presented here are more comparable with the findings for moderate or severe pain from Singh et al.
This research adhered to available guidelines (Matza et al, 2021) and the NICE Decision Support Unit (DSU) recommendations for vignette-based studies.14,38 The vignettes developed in the current study were based on real-world data from the OAI project, which employed the WOMAC instrument to assess patients’ pain and physical functioning. This evidence-based approach significantly enhanced the construct validity of the vignettes. The selection of vignettes, spanning from very slight to very severe pain, provided a wide spectrum of scenarios. The associated HSUVs can be used in economic models aiming to assess the impact of pain reduction. The vignettes were carefully developed to capture the most pertinent aspects of KOA, ie, pain and physical functioning, without including disease labels or treatment information. This approach aimed to minimize bias and ensure that the focus remained on the patient’s perspective. The careful development of the survey instrument design can be also considered a strength of this study. By utilizing bullet points with minimal wording and avoiding ambiguity, the survey instrument facilitated a user-friendly and clear presentation of the vignettes. This method aligned with the recommendations for vignette presentation, ensuring that participants could accurately interpret the scenarios.14,38 Furthermore, the pilot study played a crucial role in validating the vignettes and refining the overall survey design. Participants involved in the pilot study did not report any critical issues, suggesting that the vignettes were well received and understood. This validation step is essential to ensure the validity and reliability of the study design.
To use the HSUVs presented in this study in cost-effectiveness models based on the WOMAC pain subscale, the following approach can be taken: first calculate the mean pain subscale score at baseline and select the vignette closest to that score, eg, SV1 for a mean pain subscale sum score of 3 (version LK3.1) or 7.5 (version NRS3.1). The HSUV for that health state (0.458) can be used as baseline value. For any change on the mean pain subscale from the baseline score, another vignette and corresponding HSUV can be selected, eg, an improvement of 1.2 (version LK3.1) or 3 (NRS3.1) results in a subscale score of 3–1.2=1.8 or 7.5–3=4.5, respectively, which is closest to MD1. The resulting HSUV improvement is 0.797–0.458=0.339.
There are several limitations that need to be addressed. Firstly, the study used individuals with KOA as a representative sample instead of the general population. While this was justified by the assumption that KOA patients have a better understanding of the disease, there is a potential limitation that our findings may not be comparable with other utilities estimated from the general population. The coping or adaptation effect,39,40 where patients with chronic conditions might have adapted to their condition, could influence the results by overestimating of the HSUVs. Secondly, the study utilized a TTO version that prevented participants from valuing health states as worse than dead, which could have led to an additional overestimation of HSUVs. To mitigate this issue, the study employed censored modelling techniques. The results of the censored techniques do not suggest a major bias in the estimations as for 3 vignettes there was no change in value, for another the change was minimal (0.002) and for the severe vignettes the biggest difference was 0.058. Lastly, the study’s sample was limited to participants from the UK, which may limit the applicability of the results across different jurisdictions. Despite the limitations discussed above, this research offers valuable insights into HSUVs for individuals with KOA.
Conclusions
This is the first set of HSUVs estimated using vignettes describing different levels of pain commonly reported by individuals with KOA. The results demonstrate a considerable HRQoL burden in individuals with KOA. This evidence may be useful to inform cost-effectiveness models that evaluate KOA treatments.
Acknowledgments
The authors express their heartfelt gratitude to all the participants who have participated in this study.
Funding
This study was funded by Eli Lilly and Company (Indianapolis, IN, USA).
Disclosure
Dr Juan Ramos-Goñi and Dr Oliver Rivero-Arias are co-founder of Maths in Health, a health economics and outcomes research company. Dr Mathieu F Janssen is administrator of Maths in Health. Dr Sylvia Gonsahn-Bollie owns stocks from Eli Lilly. Dr Kristina Boye and Dr Magaly Pérez-Nieves are employees and a stockholders of Eli Lilly and Company. The authors report no other conflicts of interest in this work.
References
1. Lim J, Choi A, Kim B. The effects of resistance training on pain, strength, and function in osteoarthritis: systematic review and meta-analysis. J Pers Med. 2024;14(12):1130. doi:10.3390/jpm14121130
2. Global Burden of Disease Study 2013 Collaborators. Global, regional, and national incidence, prevalence, and years lived with disability for 301 acute and chronic diseases and injuries in 188 countries, 1990-2013: a systematic analysis for the global burden of disease study 2013. Lancet. 2015;386(9995):743–800. doi:10.1016/S0140-6736(15)60692-4
3. Wilson R, Blakely T, Abbott JH. Radiographic knee osteoarthritis impacts multiple dimensions of health-related quality of life: data from the Osteoarthritis Initiative. Rheumatology. 2018;57(5):891–899. doi:10.1093/rheumatology/key008
4. Zheng H, Chen C. Body mass index and risk of knee osteoarthritis: systematic review and meta-analysis of prospective studies. BMJ Open. 2015;5(12):e007568. doi:10.1136/bmjopen-2014-007568
5. Kolasinski SL, Neogi T, Hochberg MC, et al. 2019 American college of rheumatology/arthritis foundation guideline for the management of osteoarthritis of the hand, hip, and knee. Arthritis Rheumatol. 2020;72(2):220–233. Erratum in: Arthritis Rheumatol. 2021 73(5):799. doi:10.1002/art.41142
6. Guideline NG226, N. Osteoarthritis in over 16s: diagnosis and management. Methods. 2022.
7. Kennedy-Martin M, Slaap B, Herdman M, et al. Which multi-attribute utility instruments are recommended for use in cost-utility analysis? A review of national health technology assessment (HTA) guidelines. Eur J Health Econ. 2020;21(8):1245–1257. doi:10.1007/s10198-020-01195-8
8. National Institute for Health and Care Excellence. NICE health technology evaluations: the manual. Process and methods [PMG36]. (2022).
9. Brazier J, Ratcliffe J, Saloman J, Tsuchiya A. Measuring and Valuing Health Benefits for Economic Evaluation. Oxford university press; 2017.
10. Zhao T, Winzenberg T, de Graaff B, et al. Systematic review and meta-analysis of health state utility values for osteoarthritis-related conditions. Arthritis Care Res. 2022;74(2):291–300. doi:10.1002/acr.24478
11. Losina E, Smith KC, Paltiel AD, et al. Cost-effectiveness of diet and exercise for overweight and obese patients with knee osteoarthritis. Arthritis Care Res. 2019;71(7):855–864. doi:10.1002/acr.23716
12. Nevitt MC, Felson DT, Lester G. The osteoarthritis initiative. Protocol Cohort Study. 2006;1(2).
13. Torrance GW. Measurement of health state utilities for economic appraisal. J Health Econ. 1986;5(1):1–30. doi:10.1016/0167-6296(86)90020-2
14. Matza LS, Stewart KD, Lloyd AJ, et al. Vignette-based utilities: usefulness, limitations, and methodological recommendations. Value Health. 2021;24(6):812–821. doi:10.1016/j.jval.2020.12.017
15. Boye KS, Matza LS, Stewart KD, et al. Health state utilities associated with weight loss in type 2 diabetes and obesity. J Med Econ. 2022;25(1):14–25. doi:10.1080/13696998.2021.2002062
16. Best JH, Garrison LP, Hollingworth W, et al. Preference values associated with stage III colon cancer and adjuvant chemotherapy. Qual Life Res. 2010;19(3):391–400. doi:10.1007/s11136-010-9589-5
17. Cheville AL, Almoza M, Courmier JN, Basford JR. A prospective cohort study defining utilities using time trade-offs and the Euroqol-5D to assess the impact of cancer-related lymphedema. Cancer. 2010;116(15):3722–3731. PMID: 20564063; PMCID: PMC3855404. doi:10.1002/cncr.25068
18. Devlin NJ, Tsuchiya A, Buckingham K, Tilling C. A uniform time trade off method for states better and worse than dead: feasibility study of the ‘lead time’ approach. Health Econ. 2011;20(3):348–361. doi:10.1002/hec.1596
19. Eldabe S, Lloyd A, Verdian L, et al. Eliciting health state utilities from the general public for severe chronic pain. Eur J Health Econ. 2010;11(3):323–330. doi:10.1007/s10198-009-0178-x
20. Lee GM, Salomon JA, Gay C, Hammitt JK. Preferences for health outcomes associated with Group A Streptococcal disease and vaccination. Health Qual Life Outcomes. 2010;8(1):28. doi:10.1186/1477-7525-8-28
21. Norman R, King MT, Clarke D, et al. Does mode of administration matter? Comparison of online and face-to-face administration of a time trade-off task. Qual Life Res. 2010;19(4):499–508. doi:10.1007/s11136-010-9609-5
22. Peeters Y, Ranchor AV, Vliet Vlieland TP, Stiggelbout AM. Effect of adaptive abilities on utilities, direct or mediated by mental health? Health Qual Life Outcomes. 2010;8(1):130. doi:10.1186/1477-7525-8-130
23. Ploegmakers MM, Viscaal AM, Finch L, Mayo NE, Brophy JM. The disutility of restenosis--the impact of repeat percutaneous coronary intervention on quality of life. Can J Cardiol. 2010;26(6):197–200. doi:10.1016/s0828-282x(10)70399-8
24. Sinno HH, Thibaudeau S, Duggal A, Lessard L. Utility scores for facial disfigurement requiring facial transplantation [outcomes article]. Plast Reconstr Surg. 2010;126(2):443–449. doi:10.1097/PRS.0b013e3181e094fa
25. Summerfield AQ, Lovett RE, Bellenger H, Batten G. Estimates of the cost-effectiveness of pediatric bilateral cochlear implantation. Ear Hear. 2010;31(5):611–624. doi:10.1097/AUD.0b013e3181de40cd
26. Szende A, Schaefer C, Goss TF, et al. Valuation of transfusion-free living in MDS: results of health utility interviews with patients. Health Qual Life Outcomes. 2009;7(1):81. doi:10.1186/1477-7525-7-81
27. van de Graaf ES, van Kempen-du Saar H, Looman CW, Simonsz HJ. Utility analysis of disability caused by amblyopia and/or strabismus in a population-based, historic cohort. Graefes Arch Clin Exp Ophthalmol. 2010;248(12):1803–1807. doi:10.1007/s00417-010-1457-z
28. Ramos-Goñi JM, Oppe M, Slaap B, et al. Quality control process for EQ-5D-5L valuation studies. Value Health. 2017;20(3):466e73. doi:10.1016/j.jval.2016.10.012
29. Jayadevappa R, Cook R, Chhatre S. Minimal important difference to infer changes in health-related quality of life—A systematic review. J Clin Epidemiol. 2017;89:188–198. doi:10.1016/j.jclinepi.2017.06.009
30. Walters SJ, Brazier JE. Comparison of the minimally important difference for two health state utility measures: EQ-5D and SF-6D. Qual Life Res. 2005;14(6):1523–1532. doi:10.1007/s11136-004-7713-0
31. Ramos-Goñi JM, Oppe M, Estévez-Carrillo A, et al. Accounting for unobservable preference heterogeneity and evaluating alternative anchoring approaches to estimate country-specific EQ-5D-Y value sets: a case study using spanish preference data. Value Health. 2022;25(5):835–843. doi:10.1016/j.jval.2021.10.013
32. Boye KS, Janssen MF, Perez-Nieves M, et al. PCR129 utility values from individuals with knee osteoarthritis in the UK [Poster abstract]. May 13 - 16, 2025 ISPOR, Montreal, Canada. Available from: https://www.valueinhealthjournal.com/article/S1098-30152501574-8/abstract.
33. Hopman-Rock M, Odding E, Hofman A, et al. Physical and psychosocial disability in elderly subjects in relation to pain in the Hip and/or knee. J Rheumatol. 1996;23(6):1037–1044.
34. Dolan P. Modeling valuations for EuroQol health states. Med Care. 1997;35(11):1095–1108. doi:10.1097/00005650-199711000-00002
35. Elcock KL, Carter TH, Yapp LZ, et al. Total knee arthroplasty in patients with severe obesity provides value for money despite increased complications. Bone Joint J. 2022;104-B(4):452–463. doi:10.1302/0301-620X.104B4.BJJ-2021-0353.R3
36. Yapp LZ, Scott CEH, Howie CR, et al. Meaningful values of the EQ-5D-3L in patients undergoing primary knee arthroplasty. Bone Joint Res. 2022;11(9):619–628. doi:10.1302/2046-3758.119.BJR-2022-0054.R1
37. Harris A, Hinman RS, Lawford BJ, et al. Cost-effectiveness of telehealth-delivered exercise and dietary weight loss programs for knee osteoarthritis within a twelve-month randomized trial. Arthritis Care Res. 2023;75(6):1311–1319. doi:10.1002/acr.25022
38. Rowen D, Brazier J, Wong R, Wailoo A. Measuring and valuing health-related quality of life when sufficient EQ-5D data is not available. NICE DSU Report. 2020.
39. Baron J, Asch DA, Fagerlin A, et al. Effect of assessment method on the discrepancy between judgments of health disorders people have and do not have: a web study. Med Decis Making. 2003;23(5):422–434. doi:10.1177/0272989X03257277
40. De Wit GA, Busschbach JJ, De Charro FT. Sensitivity and perspective in the valuation of health status: whose values count? Health Econ. 2000;9(2):109–126. doi:10.1002/(SICI)1099-1050(200003)9:2<109::AID-HEC503>3.0.CO;2-L
 © 2025 The Author(s). This work is published and licensed by Dove Medical Press Limited. The
full terms of this license are available at https://www.dovepress.com/terms
and incorporate the Creative Commons Attribution
- Non Commercial (unported, 4.0) License.
By accessing the work you hereby accept the Terms. Non-commercial uses of the work are permitted
without any further permission from Dove Medical Press Limited, provided the work is properly
attributed. For permission for commercial use of this work, please see paragraphs 4.2 and 5 of our Terms.
© 2025 The Author(s). This work is published and licensed by Dove Medical Press Limited. The
full terms of this license are available at https://www.dovepress.com/terms
and incorporate the Creative Commons Attribution
- Non Commercial (unported, 4.0) License.
By accessing the work you hereby accept the Terms. Non-commercial uses of the work are permitted
without any further permission from Dove Medical Press Limited, provided the work is properly
attributed. For permission for commercial use of this work, please see paragraphs 4.2 and 5 of our Terms.
Recommended articles
Pain Empathy and Its Association with the Clinical Pain in Knee Osteoarthritis Patients
Zhao R, Ji Y, Li J, Li X, Wu T, Wu H, Liu C
Journal of Pain Research 2022, 15:4017-4027
Published Date: 19 December 2022
Electroacupuncture Alleviates KOA-Induced Pain and Cartilage Degeneration via NGF/TrkA Pathway
Fu Y, Lin L, Chen W, Shi G, Li HP, Tu JF, Liu CZ
Journal of Pain Research 2026, 19:560506
Published Date: 7 January 2026