Back to Journals » Diabetes, Metabolic Syndrome and Obesity » Volume 14
Glutathione S-Transferase (GSTT1 rs17856199) and Nitric Oxide Synthase (NOS2 rs2297518) Genotype Combination as Potential Oxidative Stress-Related Molecular Markers for Type 2 Diabetes Mellitus
Authors Gusti AMT, Qusti SY, Bahijri SM ![]() , Toraih EA
, Toraih EA ![]() , Bokhari S
, Bokhari S ![]() , Attallah SM, Alzahrani A, Alshehri WMA, Alotaibi H, Fawzy MS
, Attallah SM, Alzahrani A, Alshehri WMA, Alotaibi H, Fawzy MS ![]()
Received 6 January 2021
Accepted for publication 10 February 2021
Published 25 March 2021 Volume 2021:14 Pages 1385—1403
DOI https://doi.org/10.2147/DMSO.S300525
Checked for plagiarism Yes
Review by Single anonymous peer review
Peer reviewer comments 2
Editor who approved publication: Dr Konstantinos Tziomalos
Amani MT Gusti,1,2 Safaa Y Qusti,1 Suhad M Bahijri,3,4 Eman A Toraih,5,6 Samia Bokhari,7 Sami M Attallah,8,9 Abdulwahab Alzahrani,10 Wafaa MA Alshehri,11 Hawazin Alotaibi,12 Manal S Fawzy13,14
1Department of Biochemistry, Faculty of Science, King Abdulaziz University, Jeddah, Saudi Arabia; 2Department of Medical Laboratory, Biochemistry, King Fahad Armed Forces Hospital, Jeddah, Saudi Arabia; 3Department of Clinical Biochemistry, Faculty of Medicine, King Abdulaziz University, Jeddah, Saudi Arabia; 4Saudi Diabetes Research Group, King Fahd Medical Research Centre, King Abdulaziz University, Jeddah, Saudi Arabia; 5Department of Surgery, Tulane University, School of Medicine, New Orleans, LA, USA; 6Department of Histology and Cell Biology (Genetics Unit), Faculty of Medicine, Suez Canal University, Ismailia, Egypt; 7Department of Endocrinology and Diabetes, King Fahd Armed Forces Hospital, Jeddah, Saudi Arabia; 8Department of Clinical Pathology, Faculty of Medicine, Mansoura University, Mansoura, Egypt; 9Department of Clinical Pathology, King Fahd Armed Forces Hospital, Jeddah, Saudi Arabia; 10Department of Molecular Biology, King Fahd Armed Forces Hospital, Jeddah, Saudi Arabia; 11Department of Chemistry, Faculty of Science, University of Bisha, Al Namas, Saudi Arabia; 12Ministry of Health, Jeddah, Saudi Arabia; 13Department of Medical Biochemistry and Molecular Biology, Faculty of Medicine, Suez Canal University, Ismailia, Egypt; 14Department of Biochemistry, Faculty of Medicine, Northern Border University, Arar, Kingdom of Saudi Arabia
Correspondence: Manal S Fawzy
Department of Medical Biochemistry and Molecular Biology, Faculty of Medicine, Suez Canal University, Ismailia, 41522, Egypt
Tel + 20 1008584720
Fax + 20 64 3216496
Email [email protected]
Background: Deregulation of the antioxidant enzymes was implicated in pathogenesis and complications of type 2 diabetes mellitus (T2DM). The data relate the genetic variants of these enzymes to T2DM are inconsistent among various populations.
Purpose: We aimed to explore the association of 13 genetic variants of “superoxide dismutase (SOD), catalase (CAT), glutathione peroxidase (GPx), glutathione-S-transferase (GST) and nitric oxide synthase (NOS)” with T2DM susceptibility and the available clinical laboratory data.
Subjects and Methods: A total of 384 individuals were enrolled in this work. Different genotypes of the genes mentioned above were characterized using TaqMan OpenArray Genotyping assays on a Real-Time polymerase chain reaction system.
Results: After age- and sex-adjustment, among the studied 13 variants, GSTT1 rs17856199 was associated with T2DM under homozygote (OR=3.42; 95% CI:1.04– 11.2, p=0.031), and recessive (OR=3.57; 95% CI: 1.11– 11.4, p=0.029) comparison models. The NOS2 rs2297518*A allele was more frequent among the T2DM cohort (58.1% vs 35.4%, p< 0.001) and showed a dose-response effect; being heterozygote was associated with higher odds for developing DM (OR=4.06, 95% CI=2.13– 7.73, p< 0.001), whereas being AA homozygote had double the risk (OR=9.06, 95% CI=3.41– 24.1, p< 0.001). Combined NOS2 rs2297518*A and either GSTT1 rs17856199*A or *C genotype carriers were more likely to develop T2DM. Different associations with sex, BMI, hyperglycemia, and/or hyperlipidemia were evident. The principal component analysis revealed NOS2 rs2297518*G, old age, dyslipidemia, high systolic blood pressure, and elevated HbA1c were the main classifiers of T2DM patients.
Conclusion: The oxidative stress-related molecular markers, GSTT1 rs17856199 and NOS2 rs2297518 variants were significantly associated with T2DM risk and phenotype in the study population.
Keywords: single nucleotide polymorphism, GSTT1, NOS2, oxidative stress, T2DM
Introduction
Type 2 diabetes mellitus (T2DM) is a chronic metabolic disorder that impacts patients’ lives worldwide. It is estimated that T2DM affects around 463 million individuals globally, rising to 578 million by 2030.1 Saudi Arabia is considered one of the top ten countries characterized by a high incidence of diabetes.2 Accumulating evidence, including previous studies in this region,3–5 indicated that environmental and genetic risk factors play essential roles in T2DM etiopathology.6,7 One of these factors is oxidative stress, which has been implicated in insulin resistance, ß-cell dysfunction, and impaired glucose tolerance progressing to T2DM.8 Also, oxidative stress has been associated with the various micro-and macrovascular complications of T2DM.9 The in vivo antioxidant enzymes: “Superoxide dismutase (SOD), catalase (CAT), glutathione peroxidase (GPx), glutathione-S-transferase (GST), and nitric oxide synthase (NOS)” acted as scavengers for the reactive metabolites which ameliorate the oxidative stress imposed by these reactants on the cells.10 Several genetic variants associated with T2DM, including those associated with the antioxidant enzymes, have been detected by genome-wide association studies (GWAS), mainly in European descent people.11,12 These functional gene variants might be associated with a decline or lack of catalytic activity with subsequent accumulation of reactive oxygen species (ROS).8,13 These species play a central role in insulin resistance and β-cell dysfunction, the two major components in T2DM development and increased risk of complications.13–16
The SOD family catalyzes the conversion of superoxide to hydrogen peroxide (H2O2), which form H2O and O2 by CAT and GPx enzymes. This family comprises the intracellular “CuZn-SOD (SOD1; EC 1.15.1.1)”, mitochondrial “Mn-SOD (SOD2; EC 1.15.1.1)”, and the extracellular “EC-SOD (SOD3; EC 1.15.1.1)”. The gene family coding for these enzymes is located on different chromosomes, “SOD1 on 21q22.11, SOD2 on 6q25.3, and SOD3 on 4p15.3-p15.1”.17,18 The SOD1 rs2234694 (A/C) which mapped near the splice site at the third exon/intron boundary, the SOD2 rs4880 (A/G) which reported to change the structural conformation of the enzyme “mitochondrial targeting peptide” domain,19 and the SOD3 rs2536512 (A/G) that resulted in threonine substitution of alanine, have been associated with the risk of diabetes.13,20,21
The main H2O2-scavenging catalysts include CAT (EC 1.11.1.6) and several thiol-based peroxidases such as GPXs (EC 1.11.1.9). Their deregulated activities were implicated in disease initiation and progression, including DMT2.22 The CAT rs7943316 variant was mapped to the promotor region just proximal to the start site (−21A/T).18 T1DM susceptibility locus has been identified on the chromosome 11p13 near this gene, supporting the idea of CAT may play a role in DMT2.23 GPX1 is expressed mainly in the red blood cells, whereas GPX3 and GPX4 work mainly in high-density lipoprotein cholesterol fraction and phospholipids, respectively, detoxifying the complex lipid hydroperoxides.24,25 The GPX1 gene (locus 3p21.3) contains the rs1800668G/A variant, which is likely to affect the encoded protein’s activity.26 Although GPX3 rs3828599 (T/C) and GPX4 rs713041C/T were not explored yet with T2DM; the latter variant showed risk modulation for diabetic kidney disease and cardiac autonomic neuropathy in patients with Type 1 diabetes.27,28
The GST (EC 2.5.1.18) family of Phase II metabolic isozymes were implicated in detoxifying various electrophilic compounds via catalysis of compounds conjugation with glutathione.29 The GST Mu 1 (GSTM1) rs1056806 (C/T), GST theta 1 (GSTT1) rs17856199 (A/C), GST Pi 1 (GSTP1) rs1695 (A/G), and microsomal GST3 (mGST3) rs2065942 (C/T) gene variants of this family were reported to alter the detoxification process which might increase the risk of T2DM in several populations.8,15,30–33
Lastly, the NOS (EC 1.14. 13.39) family members, which catalyze the NO production from L-arginine, have three isoforms, “neuronal NOS (nNOS/NOS1), inducible NOS (iNOS/NOS2) and endothelial NOS (eNOS/NOS3)”. Impairment of NO production leads to endothelial dysfunction, which eventually contributes to developing several disorders, including insulin resistance and T2DM.8 The NOS2 rs2297518 (A/G) and NOS3 rs1799983 (G/T) genetic variations were associated with the development of T2DM and/or its microvascular complications in several populations.34–37
As most association studies of the variants mentioned above were mainly investigated in European descent, the authors were inspired to explore for the first time, up to the knowledge of the authors, the genetic profile of a preliminary sample from Middle Eastern (Saudi population) concerning the 13 likely susceptibility loci collectively in the same patient group to unravel their association with T2DM and/or phenotype.
Subjects and Methods
Study Participants
This case-control study enrolled a total of 384 (177 T2DM and 207 controls) individuals with a mean age of 38.7 ± 15.5 (ranged 23 to 83) years. All participants were unrelated Saudi adult population. Informed consent was obtained from all participants before taking part. Uncomplicated cases with a confirmed diagnosis of T2DM who receive antidiabetic medications such as metformin for their glycemic control were enrolled in the study. The patients attended the Endocrinology and Diabetes center outpatient clinic, King Fahd Armed Forces Hospital (KFAFH), Jeddah, KSA. The patients complicated with other severe clinical disorders were excluded. The participants attending the clinics for a routine check-up and/or blood donation with normal glucose tolerance and without a family history of diabetes have been enrolled in the study as a control group.
All the participants underwent a complete medical history and physical examinations. Anthropometric parameters, including weight and height, and arterial blood pressure (BP), were measured. Body mass index (BMI) was calculated, and accordingly, obesity was defined from a BMI of ≥30 kg/m2.38 Hypertension was defined as stated previously. Ethical approval was obtained from the institutional review board at the King Fahd Armed Forces Hospital (approval No. REC 201), Jeddah, KSA.
Sample Collection and Biochemical Analysis
Venous blood samples (10 mL) were collected after an overnight fast (10–12 h); 4 mL on EDTA tubes for molecular analysis, 3 mL also on EDTA for glycated hemoglobin A1c (HbA1c) determination (VARIANT II TURBO Hemoglobin Testing System, Bio-Rad, USA), and 3 mL on serum separator tubes for other chemical assays. The later tubes were centrifuged immediately at 3000 rpm × 12 minutes, and the separated serum was subjected to routine laboratory data analysis, including serum glucose and lipid profile [total cholesterol, HDL-cholesterol (HDL-C), and triglyceride] (Cobas c701, Roche Diagnostics, GmbH, Mannheim). The LDL-cholesterol (LDL-C) levels were calculated according to the Friedewald equation as serum TG levels in all included samples were less than 4.5 mmol/L.39 All abnormal lipid and lipoprotein profiles were justified by the National Cholesterol Education Program and Adult Treatment Panel III (NCEP-ATP III) guidelines.40 Low HDL-C level was considered from a value below the 50th percentile (HDL-C <1.0 mmol/L). Hypertriglyceridemia (HTG) was defined by fasting serum for TG level of ≥1.7 mmol/L. Participants who had an abnormal level of one or more lipid profiles, or currently on the lipid-lowering drug, or had a history of lipid disorder was defined as “dyslipidemia”. Serum insulin levels were measured by Electrochemi-luminescence Immunoassay (Cobas e 602 immunoassay analyzer, Roche Diagnostics, GmbH, Mannheim).
Variants Selection and Genotyping
Based on dbSNP (www.ncbi.nlm.nih.gov) search for the SNP minor allele frequency (MAF) > 0.05 and the previous literature that showed evidence of functional significance and association of the specified SNPs with T2DM risk in various populations, the authors selected 13 variants related to GSTM1, GSTT1, GSTP1, MGST3, SOD1, SOD2, SOD3, CAT, GPX1, GPX3, GPX4, NOS3 and NOS2 genes (Table S1). Genomic DNA was extracted from peripheral blood leukocytes using Roche MagNA Pure Compact Nucleic Acid-based Isolation Kit I (Catalog no. 03730964001; Roche Diagnostics GmbH Mannheim, Germany) according to the manufacturer’s instructions. Concentration and integrity of the extracted DNA were assessed by Nanodrop 2000/2000c Spectrophotometer V1.0 (Thermo Fisher Scientific Wilmington, DE USA) and gel electrophoresis, respectively. Amplification and allelic discrimination were performed in a GenaTi research center (King Abdulaziz University, King Fahad Medical Research Center) using Quant Studio 12K Flex Real-Time PCR System (Applied Biosystems). Each PCR reaction contained 5 μL TaqMan GTXpress Master Mix (2x) (Cat no. 4,403,311, Applied Biosystems) mixed with 0.5 μL TaqMan genotyping assay mix (20x), 2.5 μL nuclease-free water, and 2.0 μL gDNA (20 ng/μL) in a total reaction volume of 10 μL/sample. The genotyping assays ID and the ready-to-use probe sequences for the specified study variants are summarized in Table S1. The PCR program was run as follows: enzyme activation at 95°C for 10 minutes followed by 40 cycles of denaturation at 95°C for 15 seconds, and annealing/extension at 60 °C for 1 minute. All the quality control measurements were followed in each run, including using the appropriate controls.
Statistical Analysis
Data were analyzed using the R software version 4.0.2 (RStudio 3.0.1) and BM Statistical Package for the Social Sciences (SPSS) Statistics for Windows, version 26.0 (Armonk, NY: IBM Corp.).
Quantitative data were expressed as means ± standard deviation or median and interquartile range, while qualitative data were expressed as numbers and percentages. Shapiro–Wilk test was used to test the normality of the continuous variables. Two-sided Chi-square, Student-t, and ANOVA tests were used for parametric data, while Mann–Whitney U and Kruskal Wallis tests were employed for non-parametric variables. A p-value of <0.05 was considered statistically significant.
Analysis of allele and genotype frequencies were carried out.41 Genotype frequencies were assessed in patients and controls for deviation from the Hardy-Weinberg equation (HWE) using an online excel sheet to compare observed versus expected values. A Chi-square test was used to check Goodness-of-fit.42 Single and polygenic SNP analyses were performed. Genotype combination analysis was performed using the online SNPStats software (www.snpstats.net).43 The relationship between allele frequencies and T2DM was determined under different inheritance models with logistic regression analysis after adjustment for age, sex, and obesity. Genetic association models included heterozygote comparison, homozygote comparison, dominant model, and recessive models.44 Iteration of analysis was performed to test the association with the risk of obesity. Significant results in univariate analysis were plotted as a forest plot using STAT version 16.0 (StataCorp. 2019. Stata Statistical Software: Release 16. College Station, TX: StataCorp LLC). Next, multivariable regression analysis was performed to include significant molecular markers from univariate analysis with clinical data and laboratory testing. Hosmer-Lemeshow test was used to assess goodness-of-fit. Results were reported as odds ratio (OR) and 95% Confidence interval (CI). Regression models were applied with genetic variants alone then repeated to integrate clinical and laboratory data. Both clinical and laboratory findings were tested for their association with each polymorphism. Multivariate analysis was executed for data exploration in principal component analysis using Psych, Factoextra, FactoMineR, ggplot2, ggpubr, and magrittr packages. Subjects were categorized according to their diabetic status.45
Results
Demographic Characteristics of the Study Population
A total of 384 subjects were enrolled in the current study, including 143 women and 241 men accounting for 37.2% and 62.8%, respectively. Comparison between diabetic and non-diabetic cohorts is illustrated in Table 1. Of the diabetic group, males and females were equally reported in the study population; 95 females (53.7%) versus 82 male subjects (46.3%). However, more men were represented in the control group (159 subjects, 76.8%) compared to women volunteers (48 subjects, 23.2%) (p <0.001). The mean age of the study population was 38.7 ± 15.5 years (ranged 13 to 83 years old). Diabetic cohorts (44.6 ± 17.3 years) were significantly older than non-diabetic controls (33.8 ± 11.7 years) (p <0.001). The mean body mass index (BMI) of the whole population was 28.6 ± 5.64 Kg/m2. Diabetic patients had a higher BMI value (29.9 ± 6.01 Kg/m2 than their counterparts (27.6 ± 4.58 Kg/m2) (p <0.001). For the whole study population, the mean systolic/diastolic blood pressure was 124.5 ± 18.3/72.3 ± 9.81 mmHg. Systolic blood pressure was significantly higher in the diabetic group (133.1 ± 18.3 mmHg) than in the control group (117.3 ± 14.8 mmHg) (p <0.001). Similarly, higher measurements of diastolic blood pressure were found in diabetic cases (73.5 ± 10.4 mmHg) than controls (71.4 ± 9.1 mmHg) (p = 0.047).
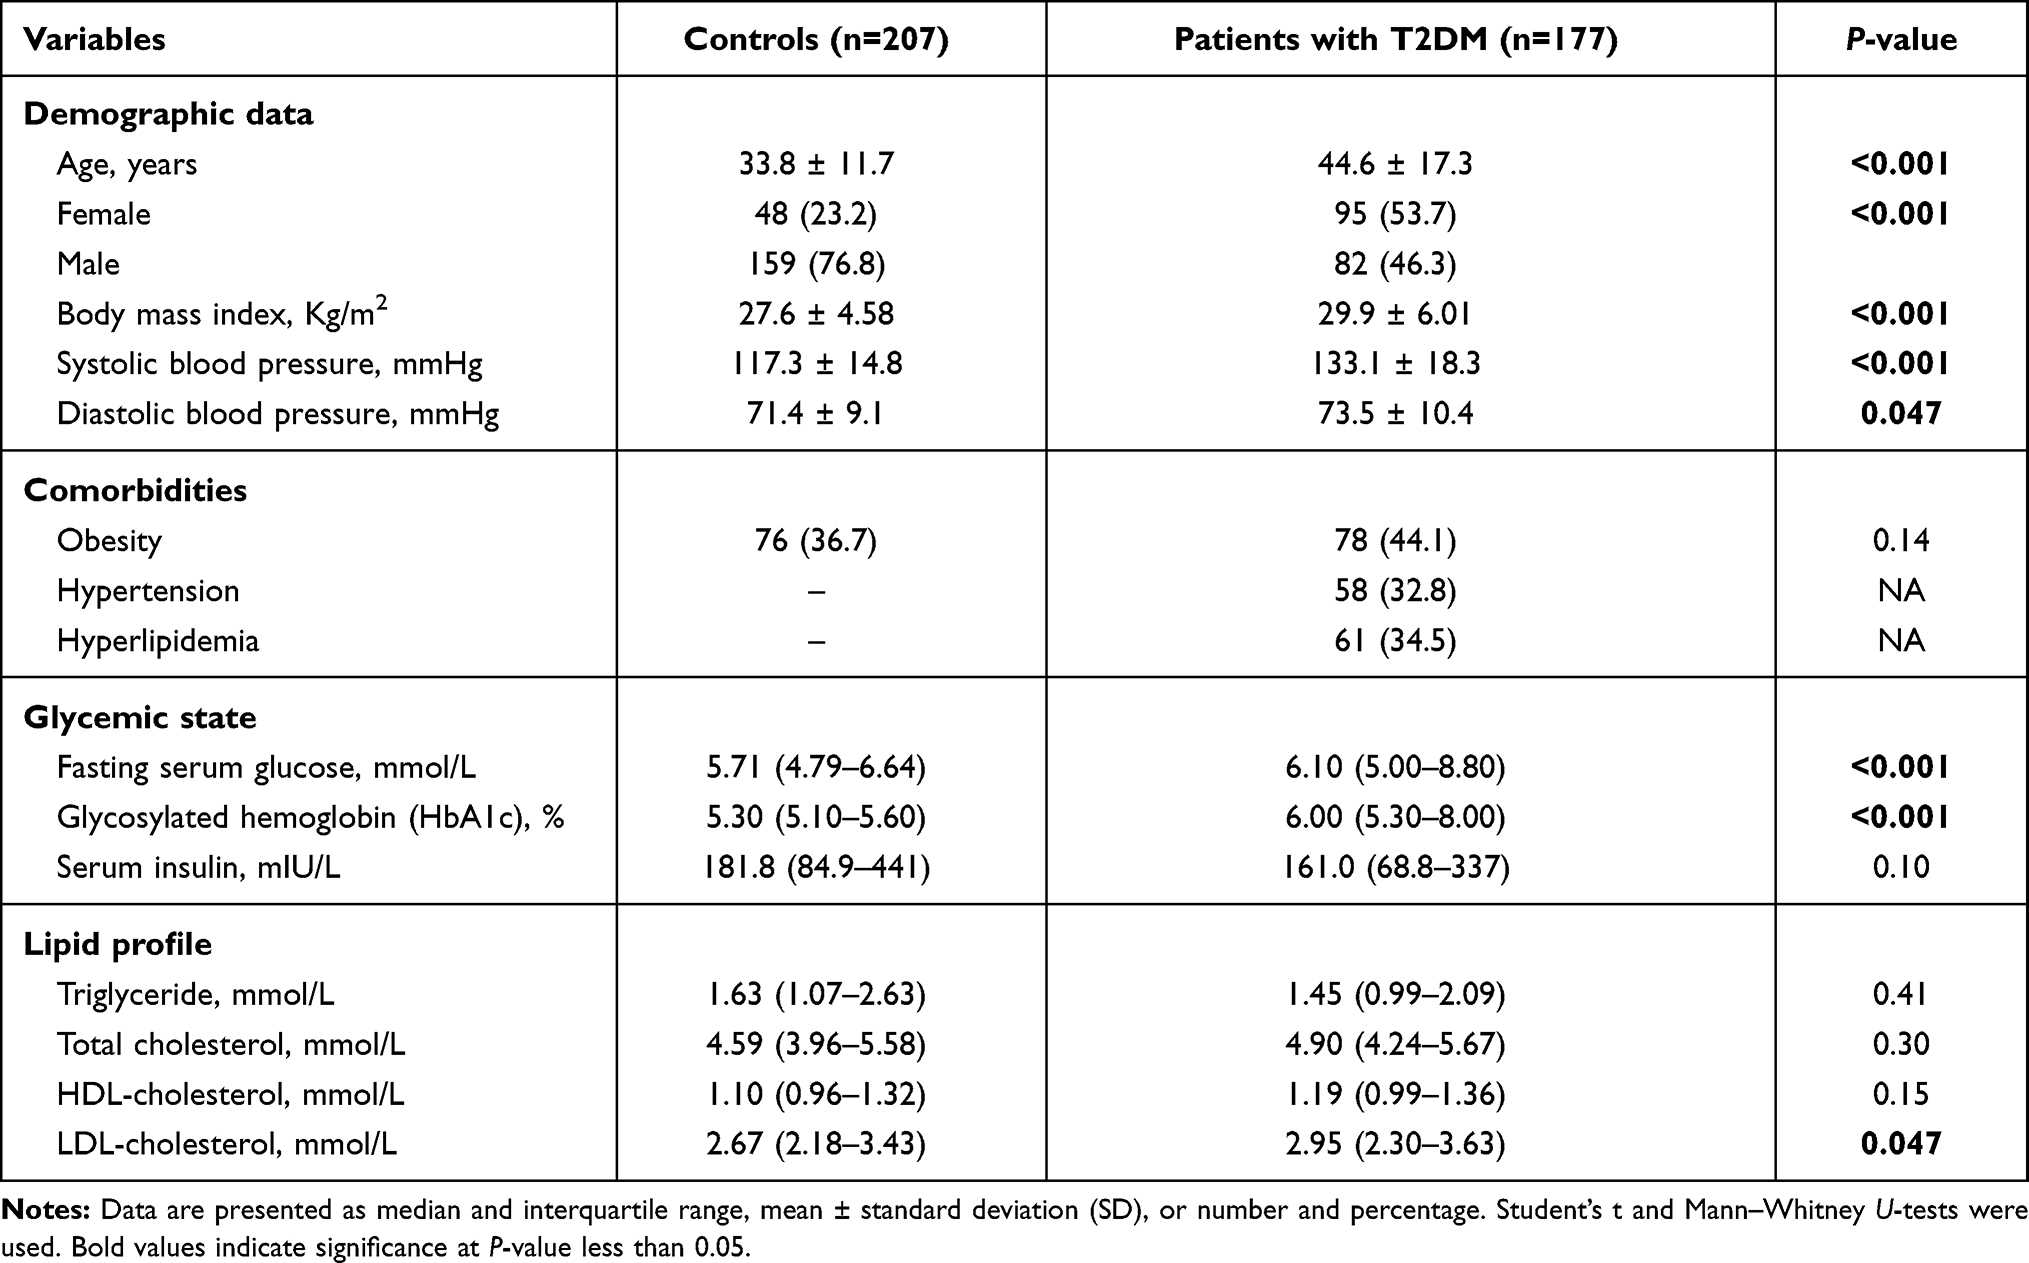 |
Table 1 Demographic, Clinical, and Biochemical Characteristics of the Study Population |
Comorbid Conditions of the Study Population
In the study population, 154 subjects (40.1%) were obese. Of the T2DM patients, 58 cases had hypertension, accounting for 32.8%. None of the controls were hypertensive. Regarding the lipid profile of the study groups, hyperlipidemia was only reported in the diabetic group, representing about 34.5% (N = 61) of diabetic patients (Table 1).
Laboratory Findings of the Study Population
As shown in Table 1, hyperglycemia was observed in the diabetic group. The median random blood sugar level of 6.1 mmol/L (IQR: 5.0–8.0) in individuals with diabetes was significantly higher than non-diabetics (median: 5.7 mmol/L, IQR: 4.79–6.64) (p <0.001). As a long-term marker, the HbA1c level was 6.0% (IQR: 5.3–8.0) in patients with type 2 diabetes higher than controls at 5.3% (IQR: 5.1–5.6) 9p <0.001). Also, LDL cholesterol levels in people with diabetes (median: 2.95 mmol/L, IQR: 2.30–3.63) were significantly higher than those in cohorts without diabetes (median: 2.67 mmol/L, IQR: 2.18–3.43) (p = 0.047). There was no significant difference between the two groups regarding the serum insulin level or other lipid profile parameters.
Allelic Discrimination Analysis in Diabetics and Non-Diabetics
Genotype distribution was found in agreement with HWE in patients and controls except for MGST3 rs2065942 (C/T), SOD1 rs2234694 (A/C), CAT rs7943316 (A/T), GPX1 rs1800668 (G/A), and GPX3 rs3828599 (T/C). Allele and genotype frequencies of the 13 polymorphisms were significant for NOS2 rs2297518 (A/G); rs2297518*A allele was more frequent among diabetic cohorts (58.1% vs 35.4%, p <0.001). While G/G being the most prevalent genotype in healthy controls accounting for 54.4%, A/G was the most prevalent genotype among diabetic patients (59.5% vs 39.6%), followed by A/A (23.4% vs 5.9%, p <0.001) (Table 2). rs2297518*A carriers showed a dose-response effect; being heterozygote with one allele (A/G) rendered higher odds for developing diabetes mellites (OR = 4.06, 95% CI = 2.13–7.73, p <0.001), whereas being a homozygote carrying two alleles (A/A) had double the risk (OR = 9.06, 95% CI = 3.41–24.1, p <0.001) (Table 3).
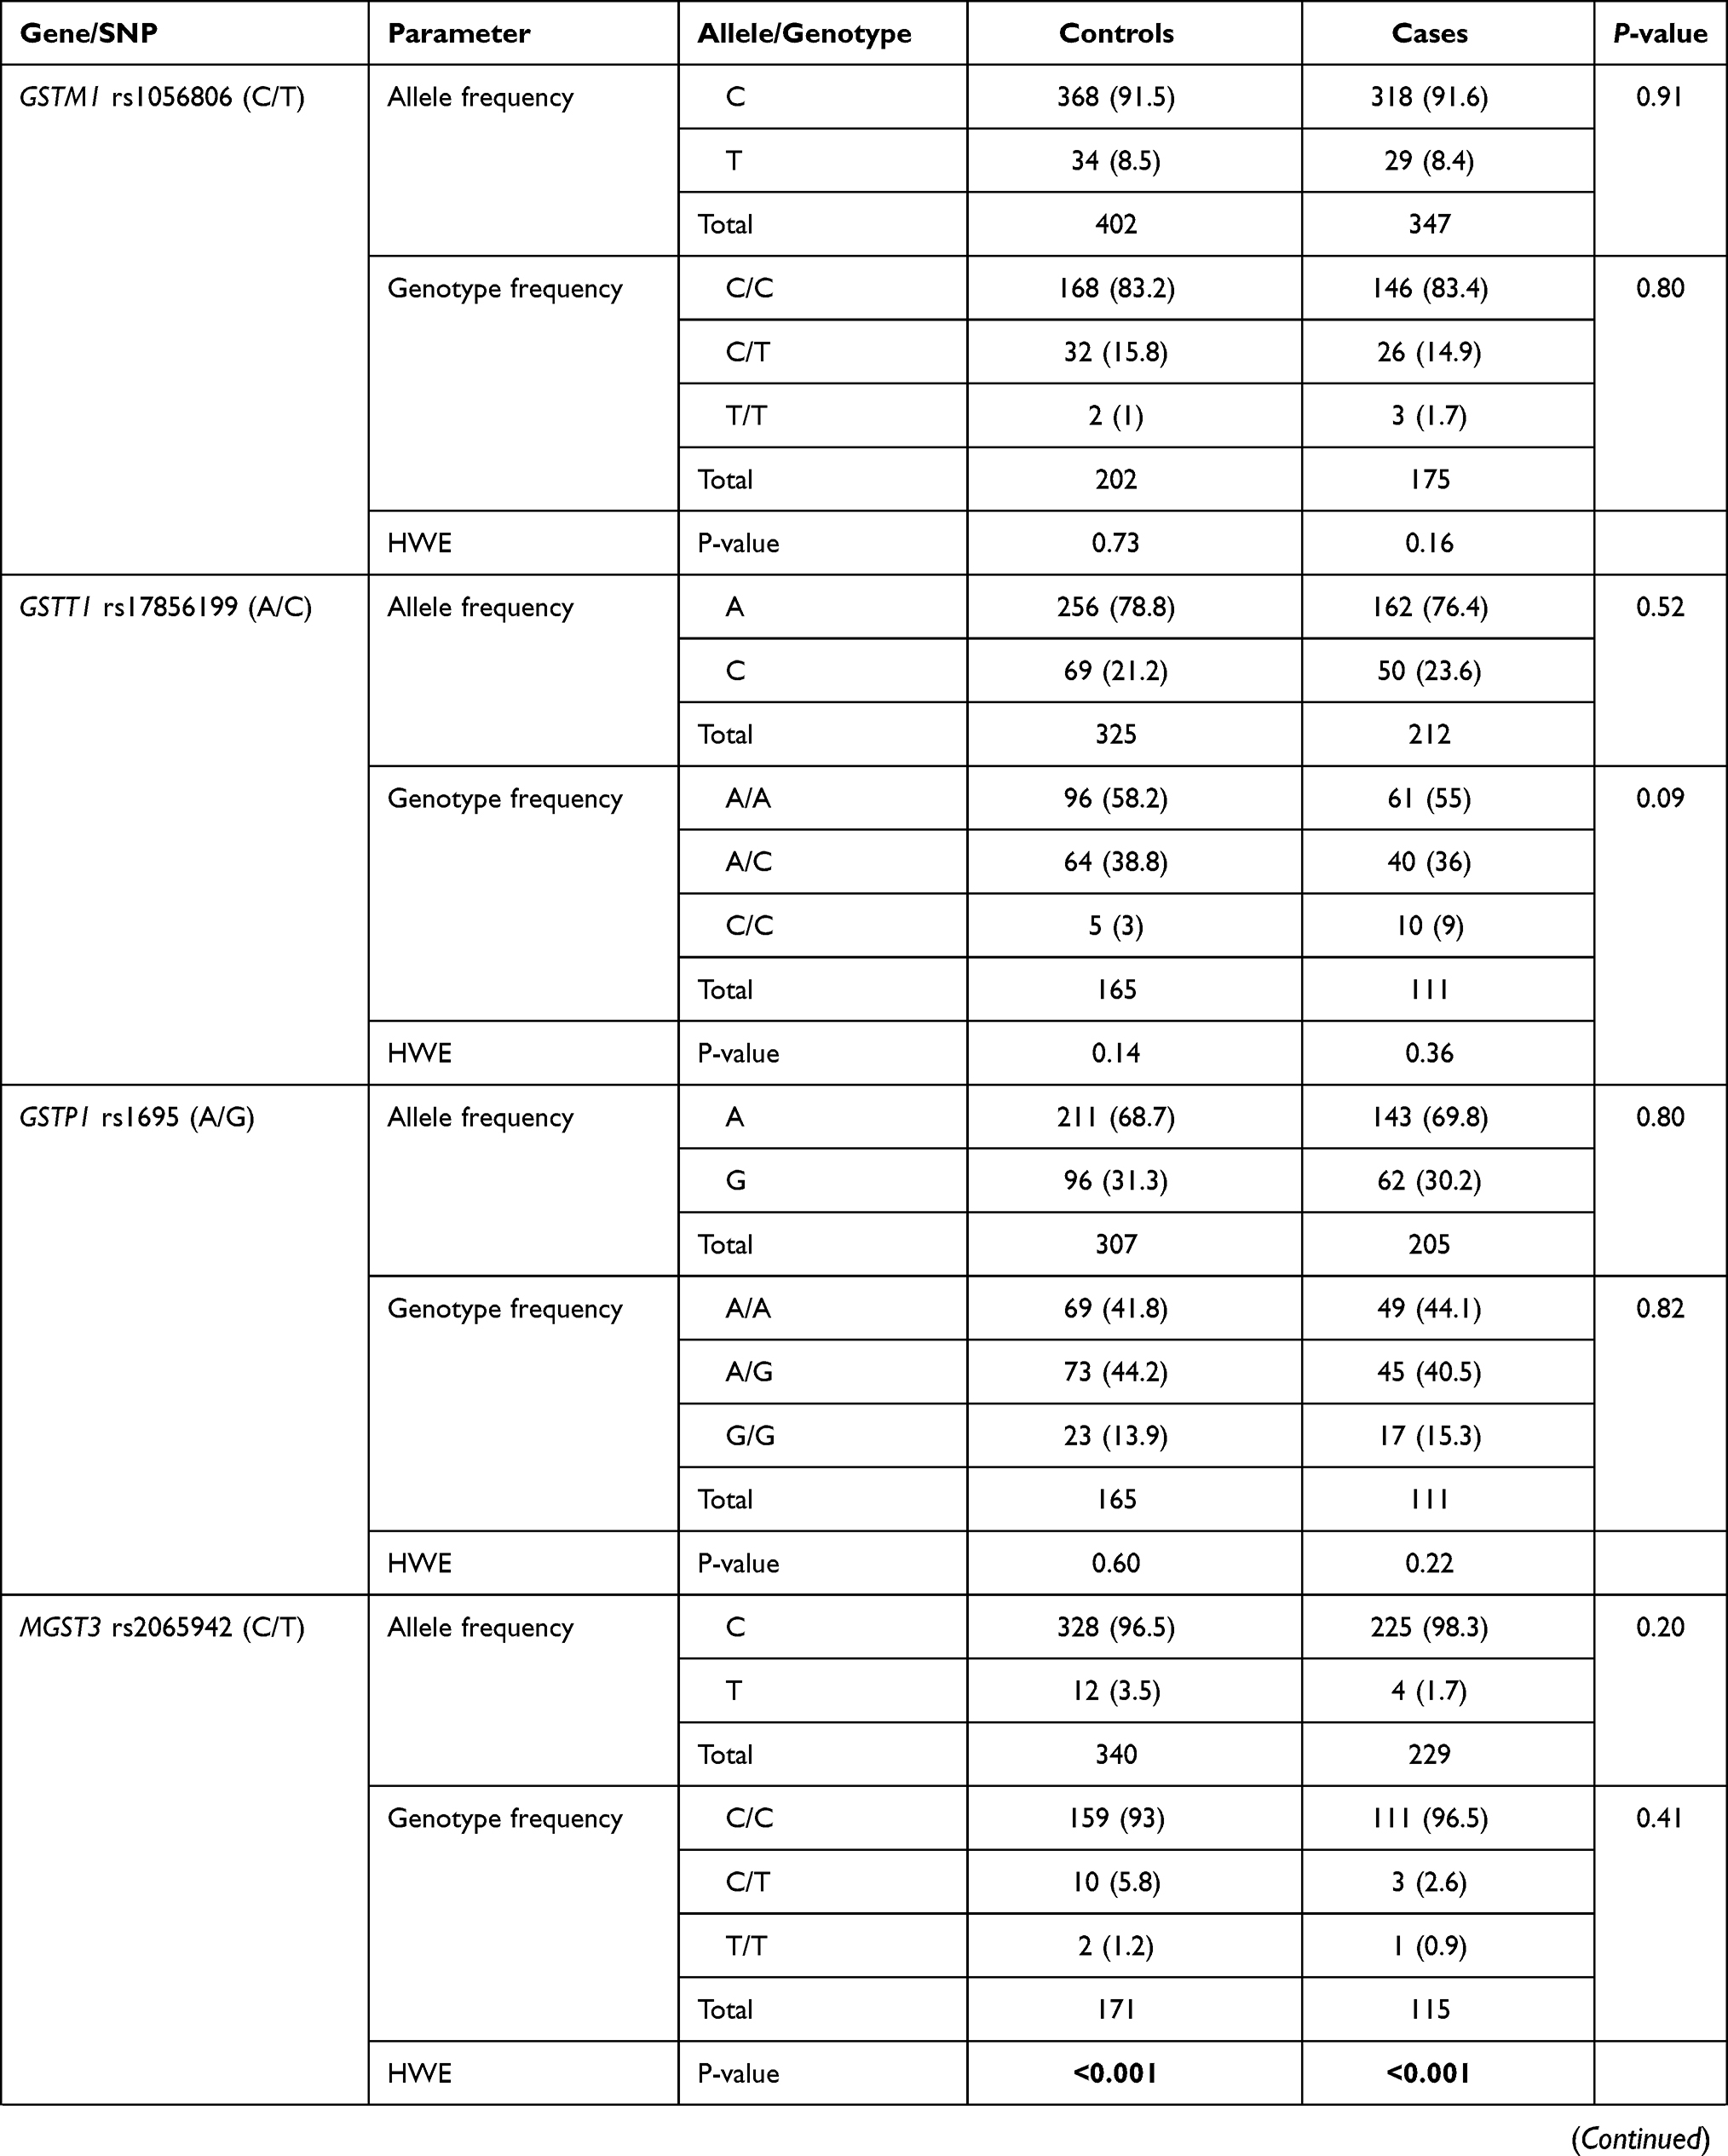 | 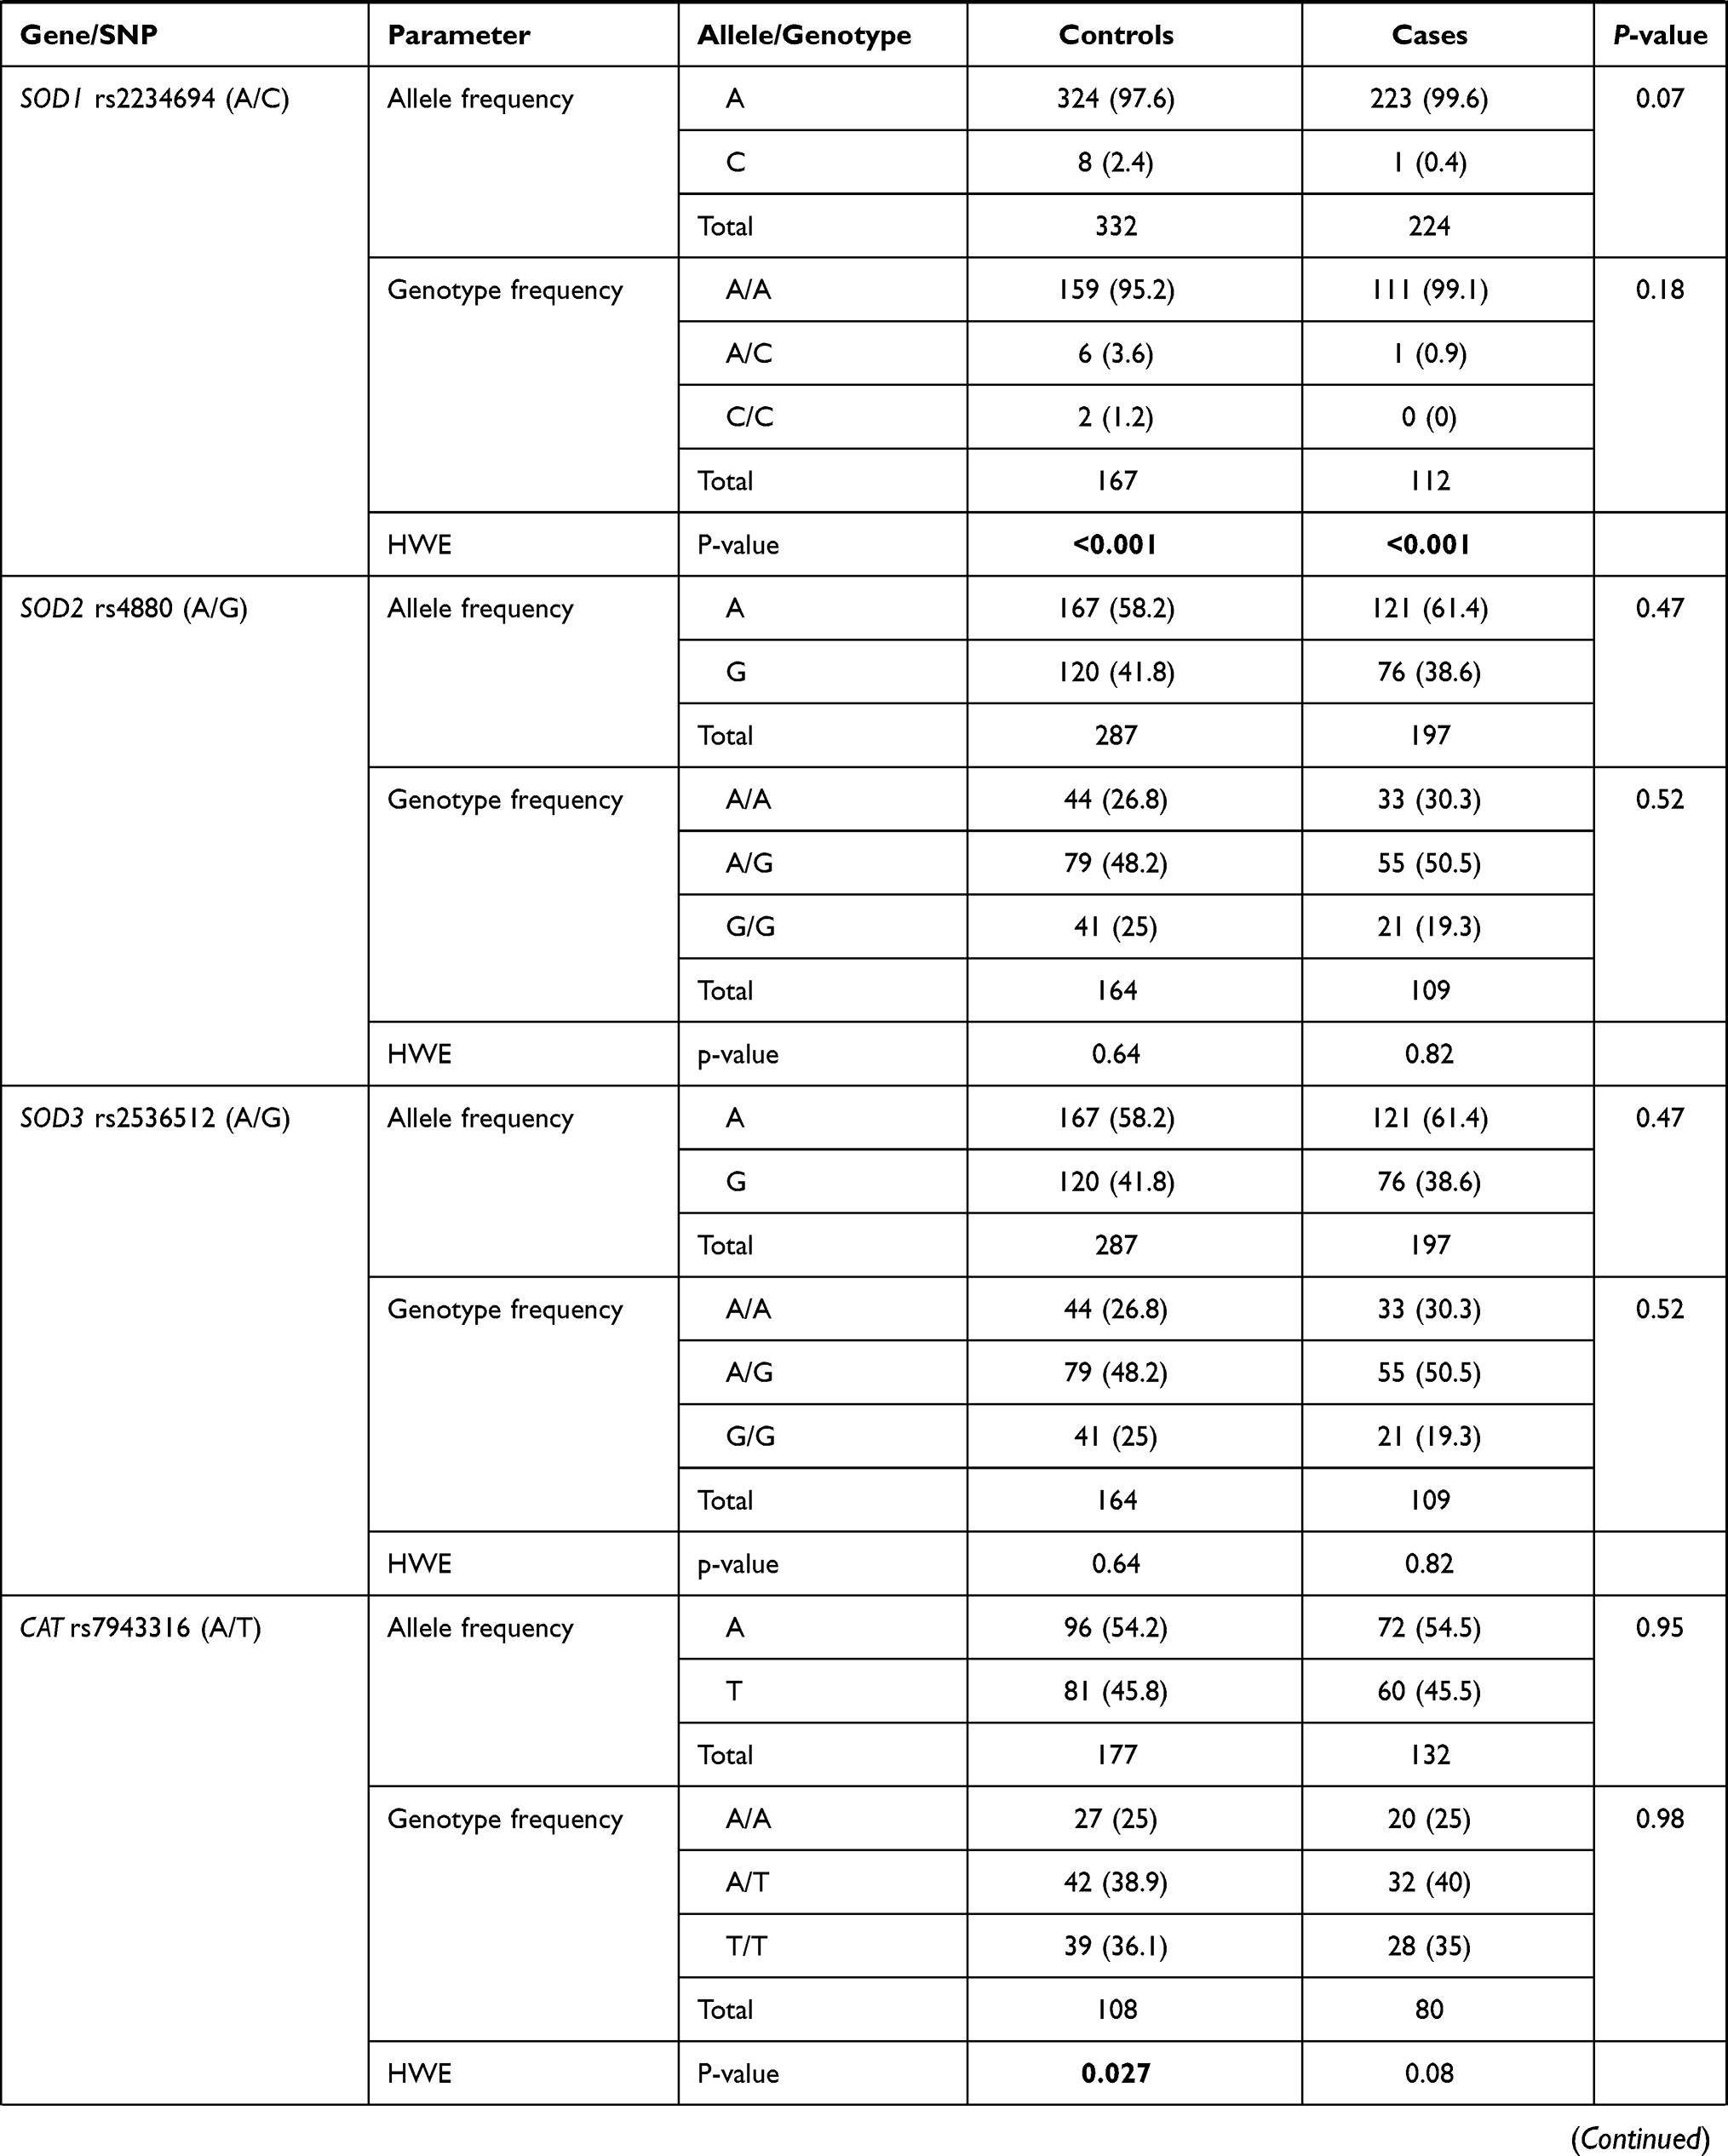 | 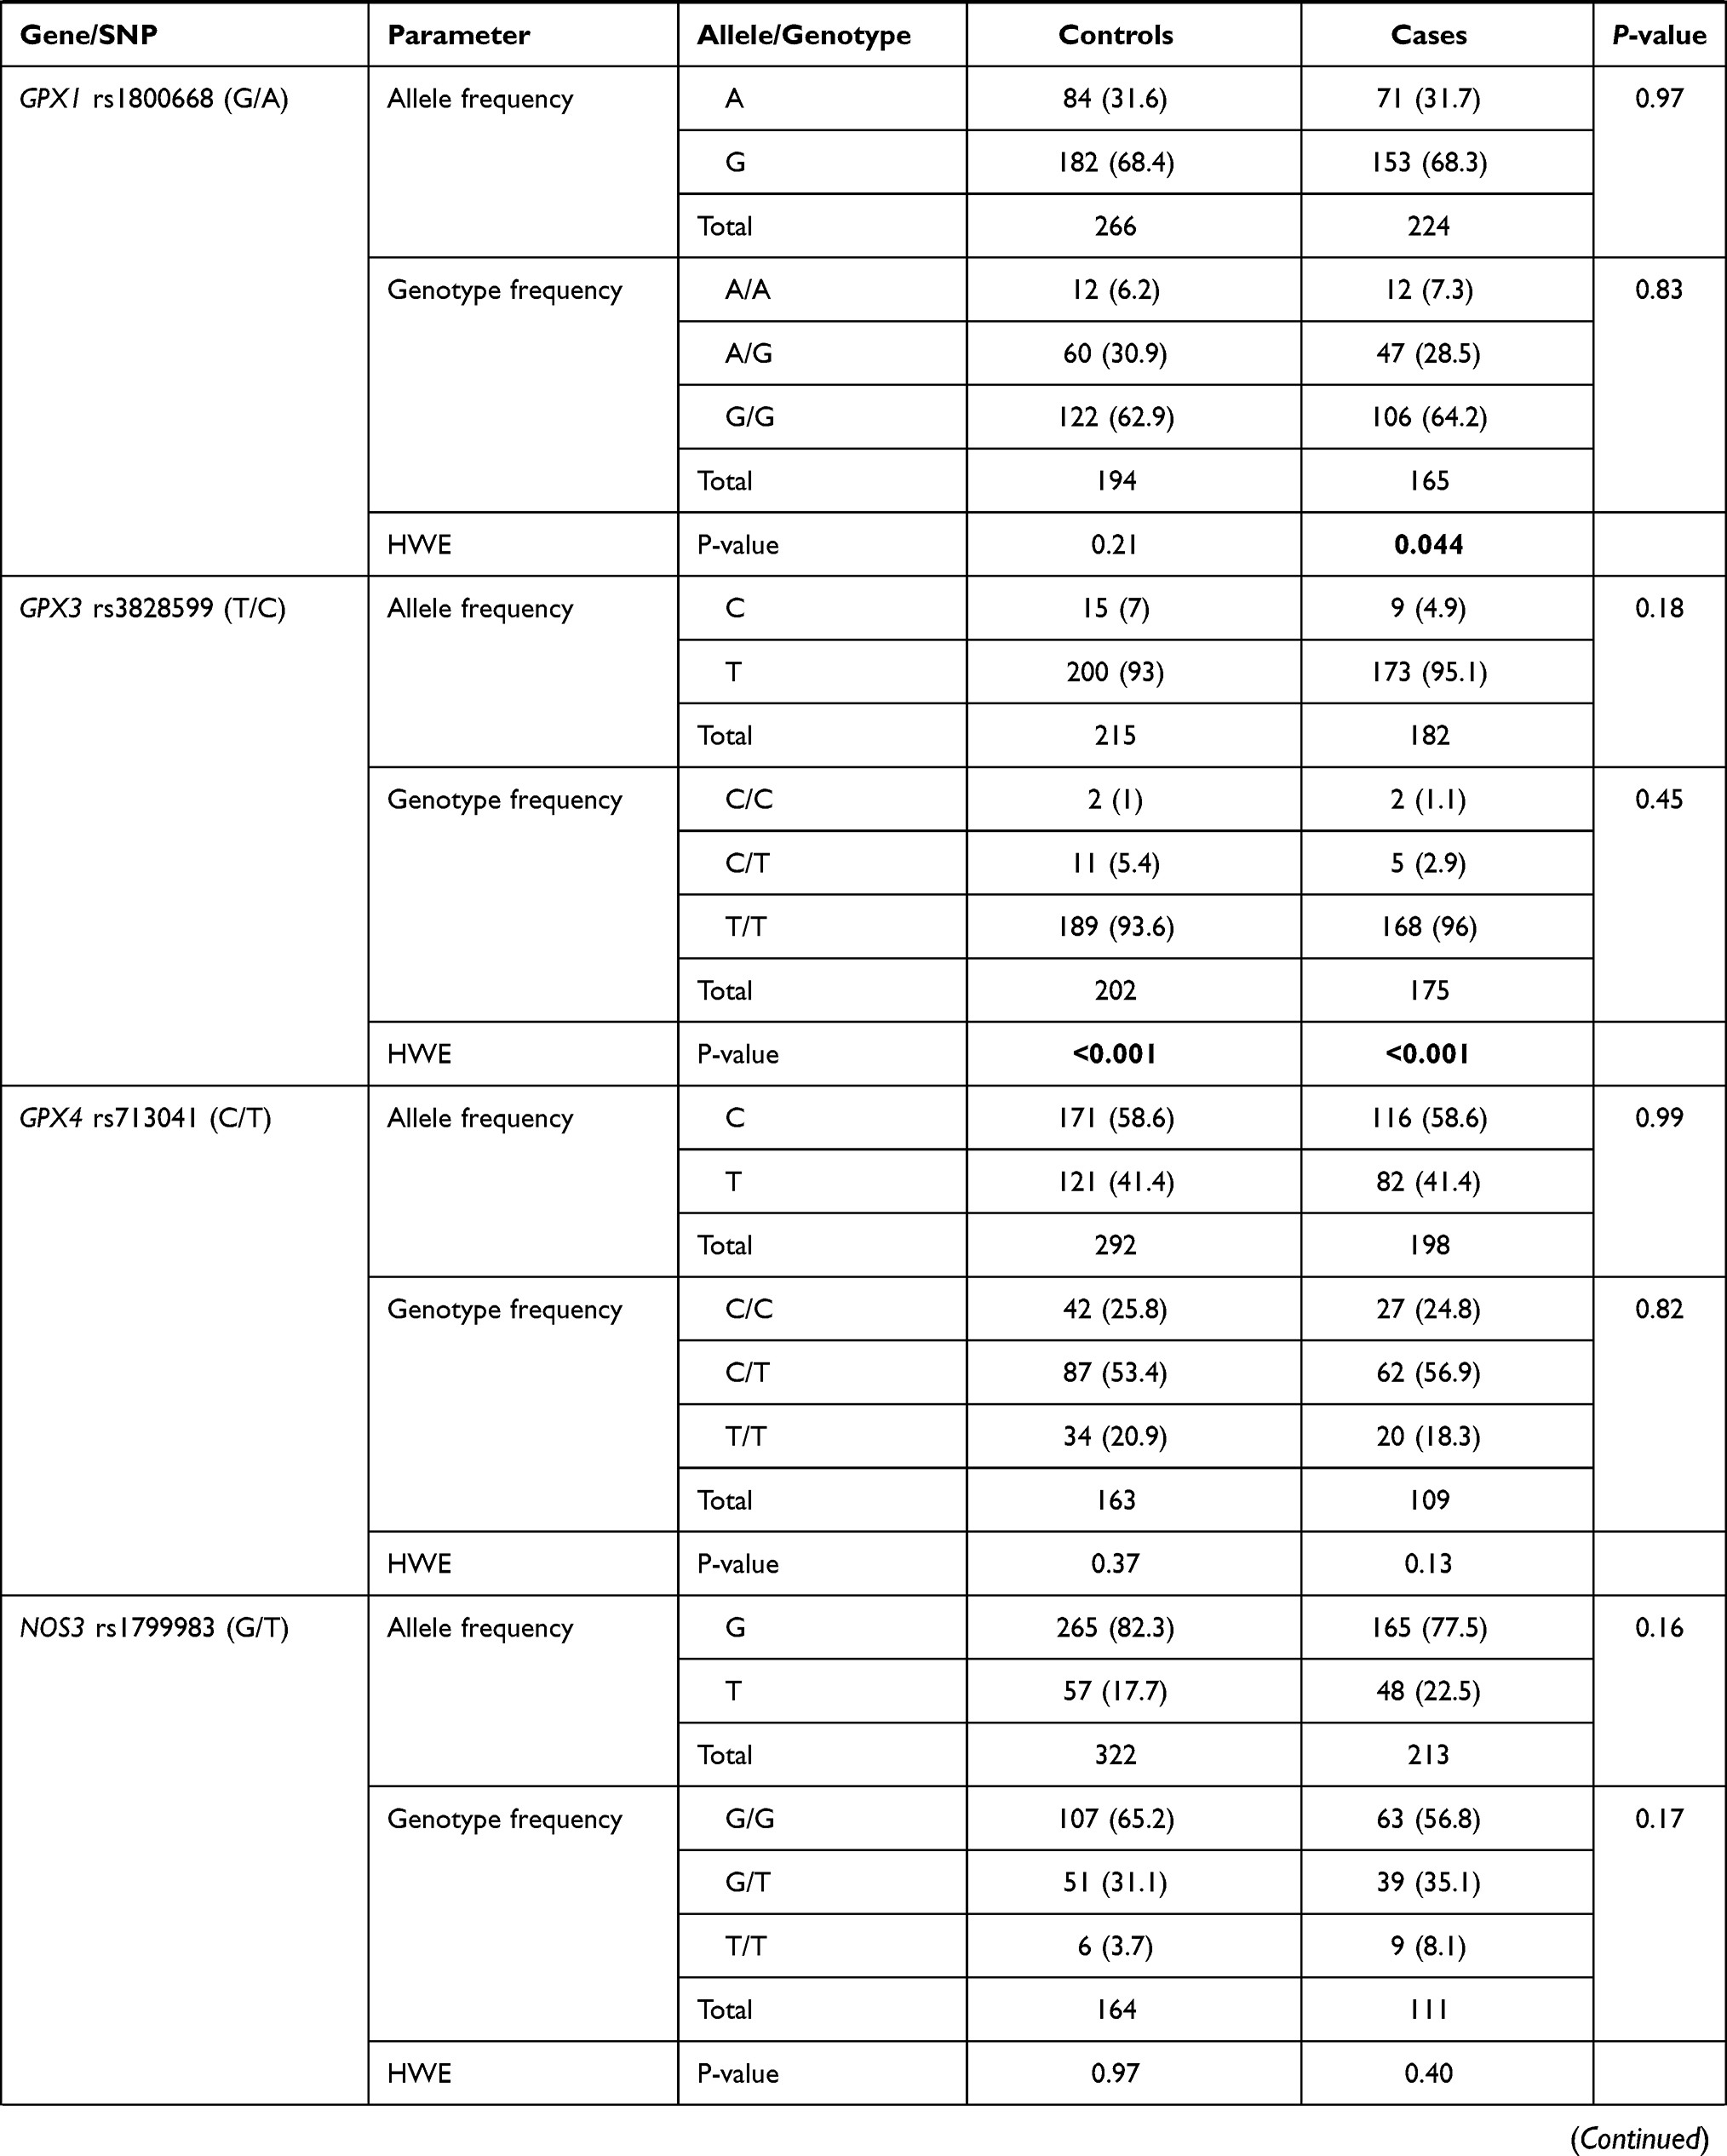 |  |
Table 2 Genotype and Allele Frequencies of Polymorphisms |
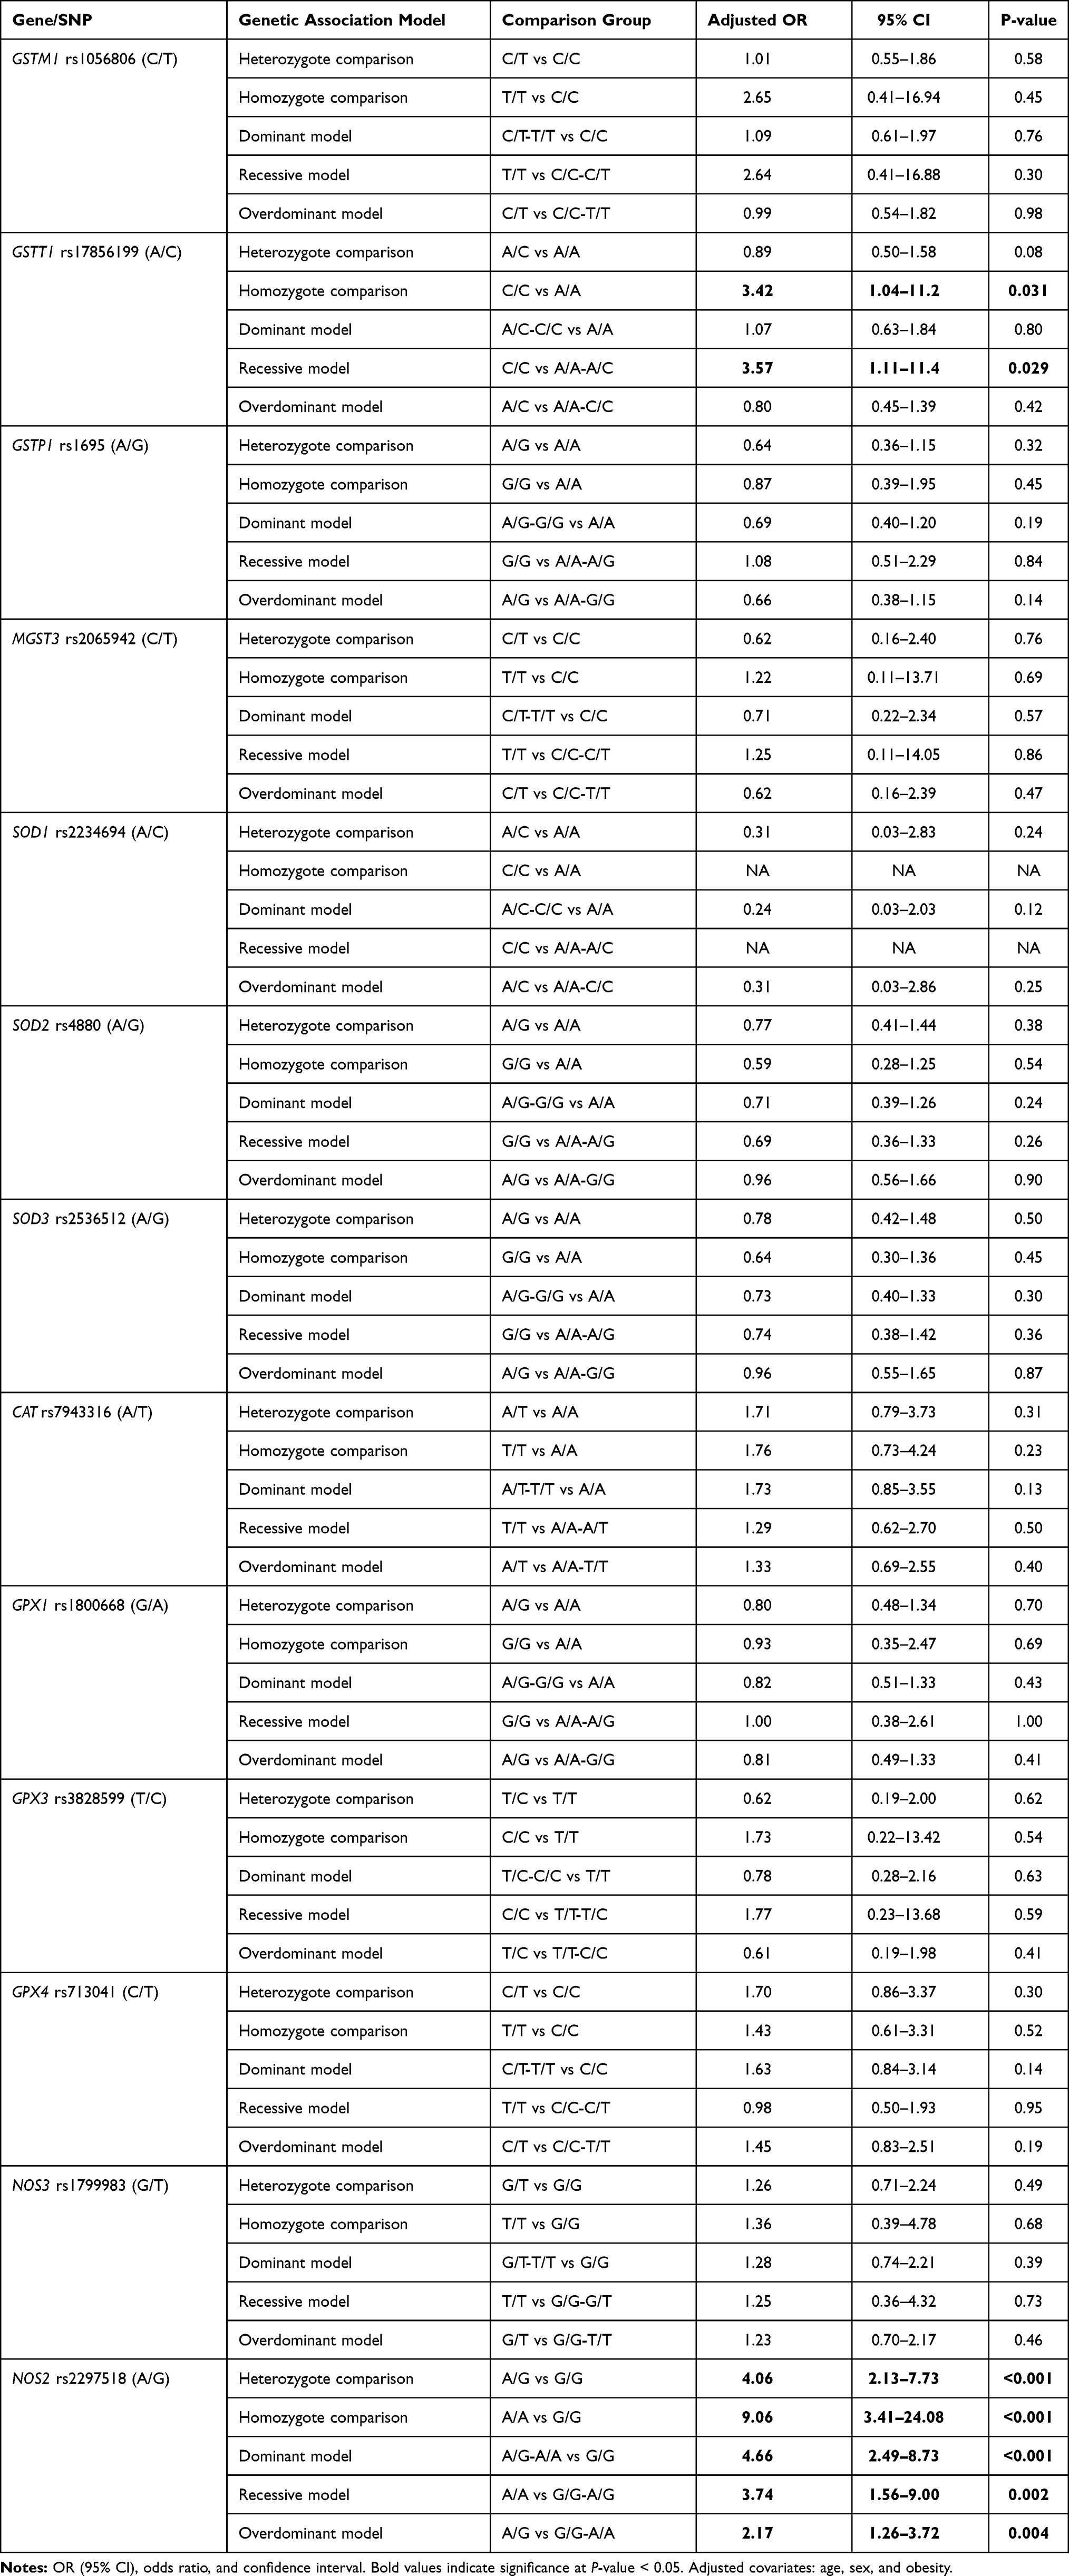 |
Table 3 Risk of Diabetes Mellitus According to Genetic Association Models |
Regarding GSTT1 rs17856199 (A/C) polymorphism, a higher frequency of C/C genotype was observed in diabetic patients, though the p-value did not reach significance (p = 0.09) (Table 2). After adjustment by age and sex, homozygote carriers for two copies of the C allele were three times more liable to develop diabetes than non-carriers. On homozygote comparison (C/C vs AA), odds ratio (OR) was 3.42 (95% CI: 1.04–11.2, p = 0.031), and similar risk was found under recessive model (C/C vs A/A-A/C) with OR at 3.57 (95% CI: 1.11–11.4, p = 0.029) (Table 3). Genetic association models analysis did not show a further association of other variants with disease susceptibility.
Polygenic Risk of Diabetes in Association with Gene Variants
Having both GSTT1 rs17856199*A and NOS2 rs2297518*A variants were 3.96 times more likely to have diabetes (OR = 3.96, 95% CI = 2.14–7.33, p <0.001), while carrying both GSTT1 rs17856199*C and NOS2 rs2297518*A variants had 3 times higher susceptibility of developing diabetes type 2 (OR = 3.08, 95% CI = 1.47–6.48, p = 0.003) (Table 4).
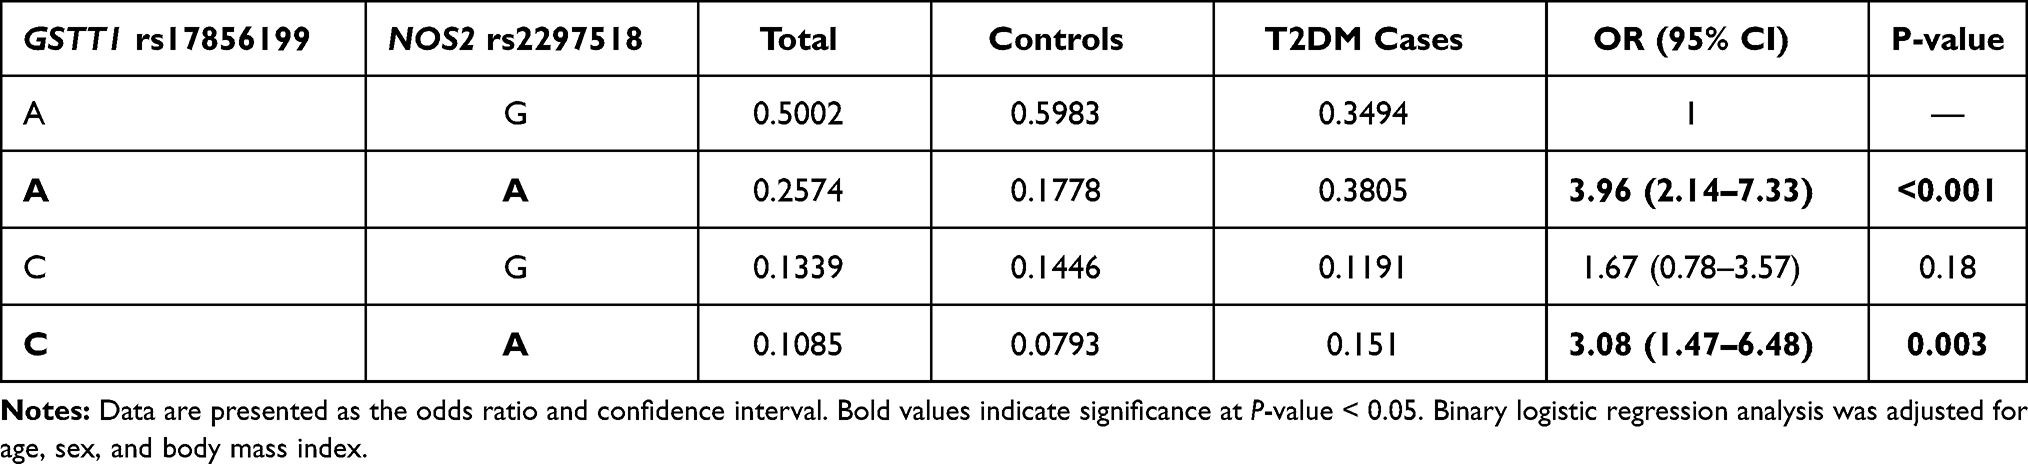 |
Table 4 Genotype Combination Analysis of Risk Alleles for Type 2 Diabetes Mellitus |
Association of Genetic Variants with Clinical and Biochemical Features
In the diabetic group, two polymorphisms were more frequent in males namely GSTP1 rs1695 G/G (82.4%, p <0.001) and CAT rs7943316 A/A (70.0%, p = 0.034). Another two variants were associated with higher body mass index: SOD2 rs4880 G/G genotype (31.70 ± 5.05 Kg/m2 in G/G vs 29.06 ± 7.54 Kg/m2 in A/A and 30.58 ± 5.53 Kg/m2 in A/G, p = 0.013), and SOD3 rs2536512 A/A genotype (32.30 ± 7.08 Kg/m2 in A/A vs 30.21 ± 4.82 Kg/m2 in G/G and 28.61 ± 5.33 Kg/m2 in A/G, p = 0.013) (Table 5). In addition, a higher frequency of hyperlipidemia was observed in diabetic patients with SOD2 rs4880*G/G genotype (56.5% in G/G vs 35.1% in A/A and 24% in A/G, p = 0.025) and NOS2 rs2297518 G/G (63.2% in G/G vs 34.6% in A/A and 31.3% in G/A, p = 0.039).
 | 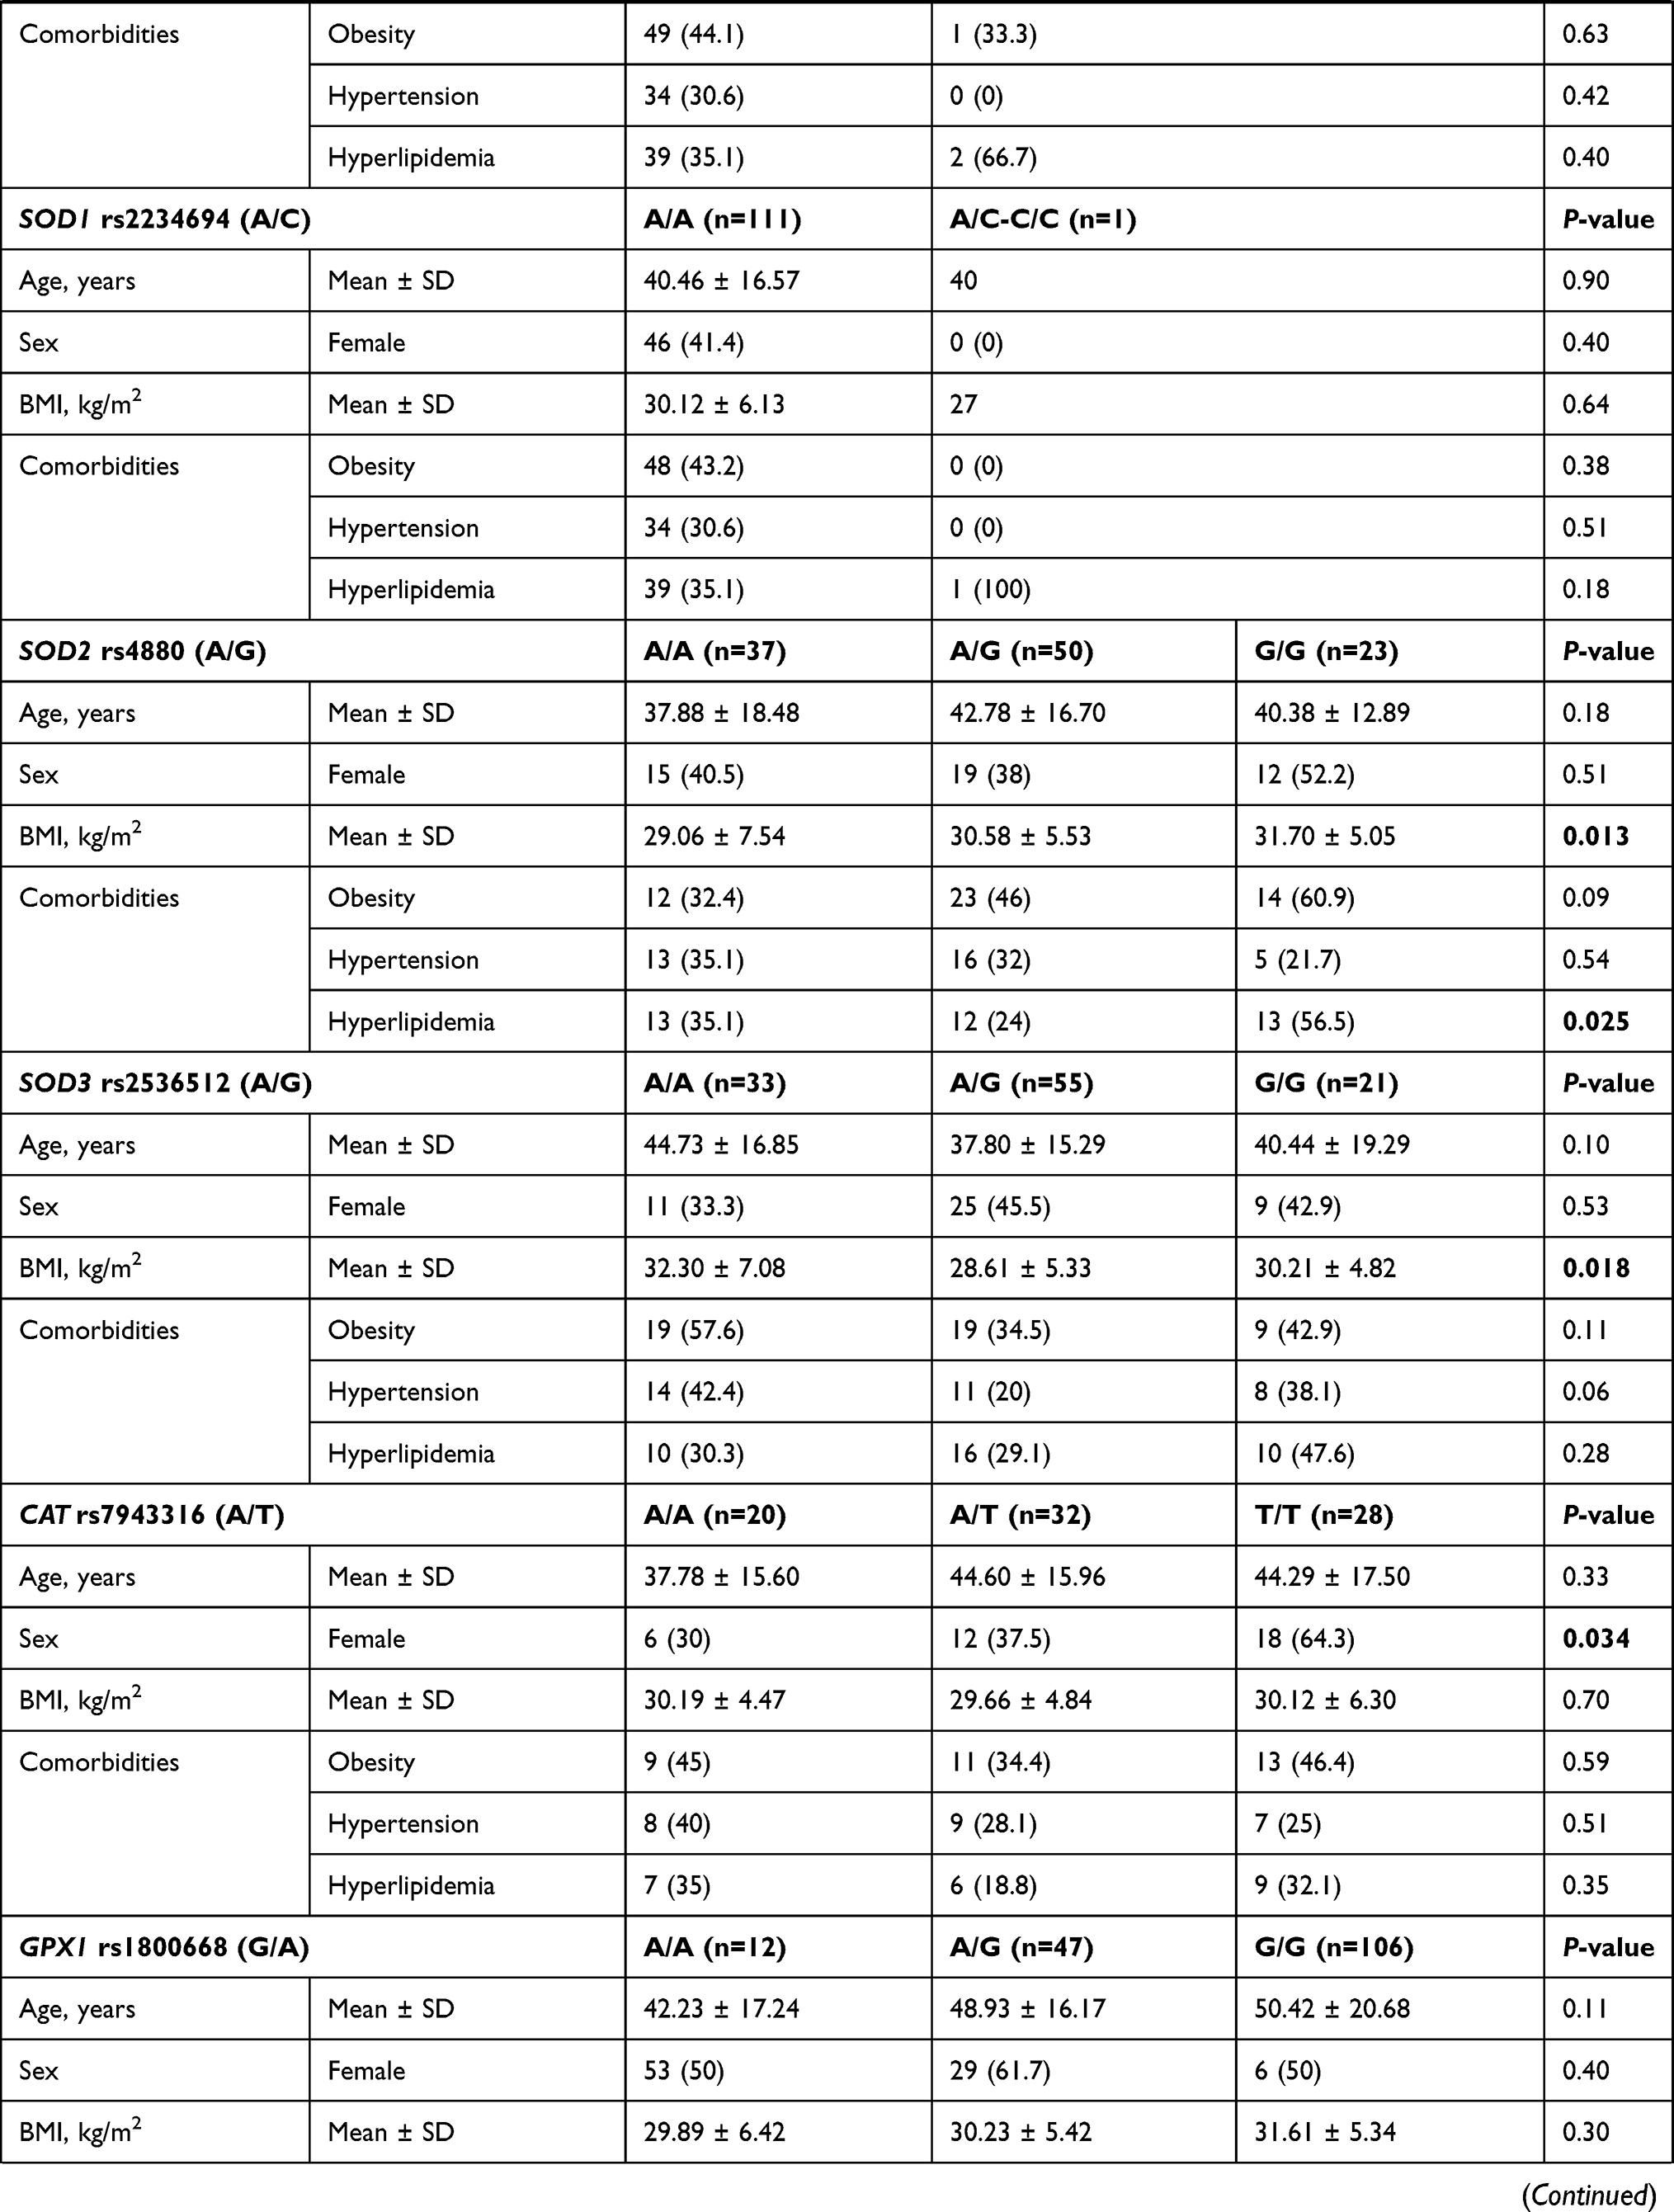 | 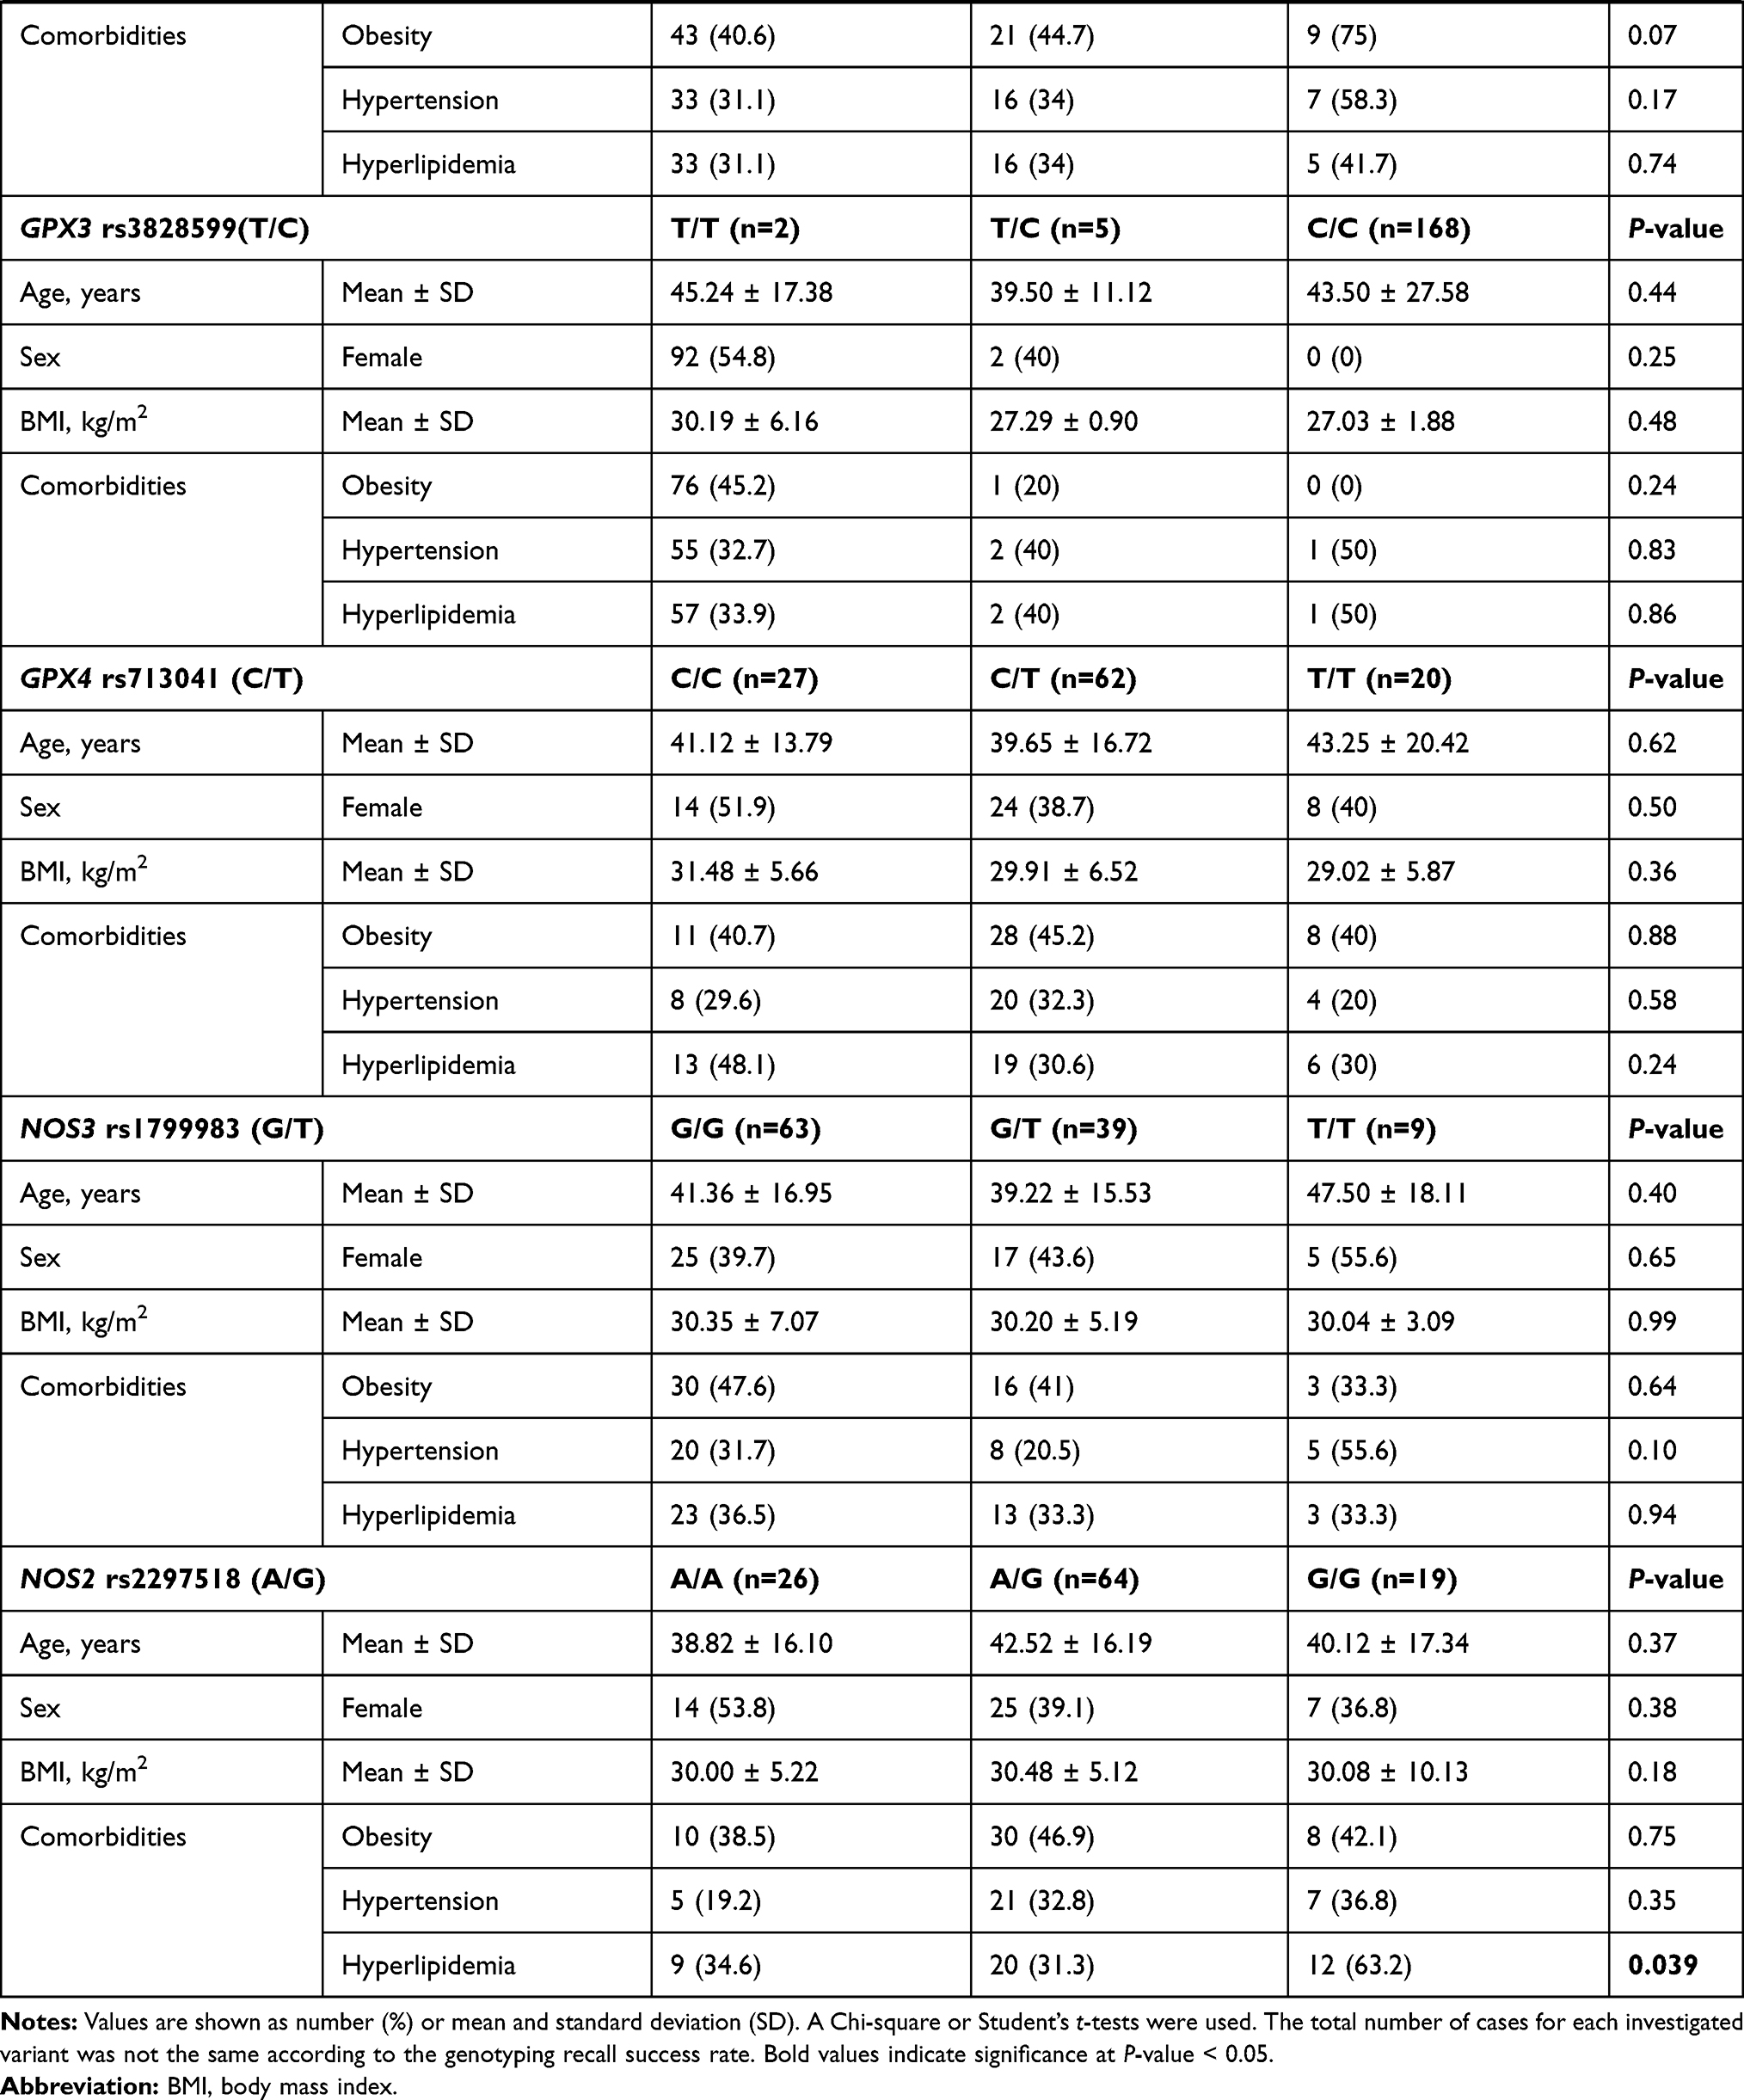 |
Table 5 Association of Genetic Variants with Clinical Features of Diabetic Patients |
As depicted in Table S2, higher levels of triglyceride were reported in GPX4 rs713041 C/C cohorts (median = 1.7 mmol/L, IQR = 1.2–2.4), followed by C/T patients (median = 1.5, IQR = 1.2–2.0) and T/T carriers (median = 1.1, IQR = 0.9–1.4) (p = 0.049). Higher glycemic state was found in diabetic patients carrying NOS2 rs2297518 G/G (median = 6.3 mmol/L, IQR = 5.8–7.6) or A/G (median = 5.7 mmol/L, IQR = 5.2–7.4) compared to A/A patients (median = 4.9, IQR = 4.5–5.7) (p = 0.004).
Multivariable Analysis
Binary regression analysis was employed and confirmed the dose-effect of the rs2297518*A variant of the NOS2 gene that was elaborated in univariate analysis. Also, being a female (OR = 2.94, 95% CI = 1.44–6.25, p = 0.003) and old age (OR = 1.03, 95% CI = 1.02–1.04, p = 0.031) were also predictor risk factors for developing diabetes (Figure 1).
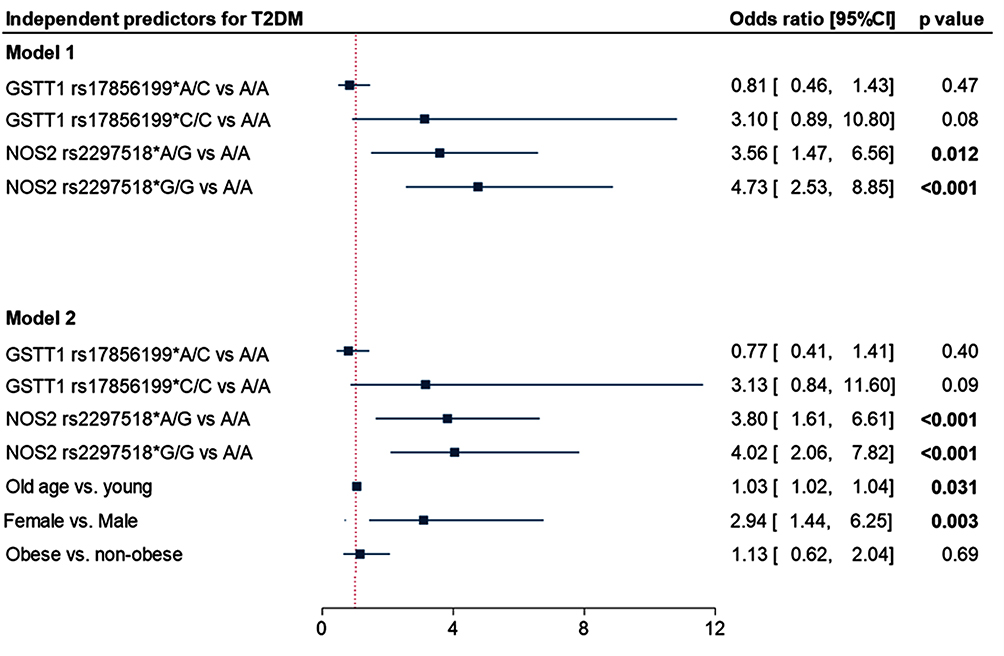 |
Figure 1 Independent risk factors for type 2 diabetes mellitus. Data are presented as the odds ratio and confidence interval. P-value < 0.05 was considered as statistically significant. Binary logistic regression analysis was applied. |
Principal Component Analysis (PCA) was performed to integrate all clinical, laboratory, and molecular features of the individual subject. Patients and controls were distributed in a high dimensional space then plotted across “axis 1” and “axis 2” with the highest variability. Subjects close to each other had similar features to those dispersed apart. As shown in Figure 2, there was a clear demarcation between diabetic patients and non-diabetic controls with some overlaps. NOS2 gene variant, older age, dyslipidemia, high systolic blood pressure, and elevated HbA1c were the main characteristics of this group, while the male sex was more represented in control subjects. Other variants were perpendicular to the Subjects’ distribution in the PCA, highlighting their absent role in determining disease outcomes in the present population.
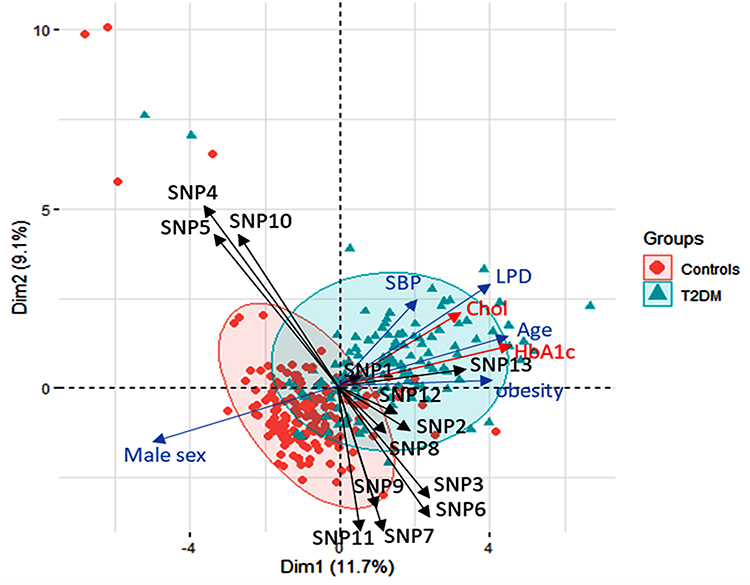 |
Figure 2 Principal Component analysis for data exploration. Data are plotted across axis 1 and 2, showing the variability of 11.7% and 9.1% of the data. Subjects are represented as circles (controls) or triangles (type 2 diabetic cohorts). Subjects close to each other had similar features to those dispersed apart. An oval ellipse was drawn around each group. Variables are indicated with arrow length, indicating the magnitude of strength, with a longer arrow indicating a greater influence of the factor. Genetic variants are shown in black arrows. Clinical data in blue while the red arrows represent the laboratory testing. All clinical and laboratory data were used in the plot, but fewer arrows with higher effects are only shown to avoid crowdedness. SNP1: GSTM1 rs1056806, SNP2: GSTT1 rs17856199, SNP3: GSTP1 rs1695, SNP4: MGST3 rs2065942, SNP5: SOD1 rs2234694, SNP6: SOD2 rs4880, SNP7: SOD3 rs2536512, SNP8: CAT rs7943316, SNP9: GPX1 rs1800668, SNP10: GPX3 rs3828599, SNP11: GPX4 rs713041, SNP12: NOS3 rs1799983, SNP13: NOS2 rs2297518. Abbreviations: HbA1c, glycosylated hemoglobin; LPD, hyperlipidemia; SBP, systolic blood pressure; Chol, total cholesterol; T2DM, type 2 diabetes mellitus. |
Discussion
The development of diabetes requires the implication of oxidative stress-related signaling in many aspects of disease etiopathology.46,47 It has been shown that the antioxidant enzyme-related gene variants are involved in the pathogenesis of T2DM and its complications.8 Although several ethnic population-based studies have reported the association between the specified study polymorphisms and T2DM, controversial results have been identified.32 The present study explored the association of 13 antioxidant-related gene variants with T2DM susceptibility and phenotype in a sample of Saudi population. From these polymorphisms being investigated, only the GSTT1 rs17856199*C and NOS2 rs2297518*A were significantly associated with T2DM risk.
For rs17856199 (A/C) polymorphism, CC homozygote carriers were three times more liable to develop diabetes than non-carriers, and a similar risk was found under the recessive model. The GSTT1 is a cytosolic isozyme of GSTs superfamily, which has an imminent role in detoxifying the phospholipid hydroperoxide, as mentioned earlier. In vitro studies have revealed that activation of GST protein expression can prevent 4-hydroperoxy-nonenal (an end product of phospholipid oxidation)-induced insulin resistance and lipolysis in adipocytes.48 Interestingly, on searching some online prediction tools (SIFT, PolyPhen, SNPs3D, and MutPred), Masoodi et al have identified the potential impact of the rs17856199 variant on gene expression and protein structure that affect the detoxification process with subsequent metabolites accumulation and risk modification for breast cancer.49 We also search these tools to confirm this variant’s impact on the structure/function of the related protein. We found that this gene variant results in phenylalanine substitution by cysteine (F45C) associated with a decrease in the encoded protein’s hydrophobic interaction (Figure S1).50 It is well known that the phenylalanine side chain is fairly non-reactive and is thus rarely directly involved in protein function, but it can play a role in substrate recognition via stacking interactions with other non-protein ligands that contain aromatics groups.51 In this sense, the decreased hydrophobicity of the coded protein at the specified variant position could impact the encoded enzyme’s function. Also, running the “Variant Effect Predictor” (https://asia.ensembl.org/Homo_sapiens/Tools/VEP) revealed this variant has potential deleterious effect by SIFT (Sorting Intolerant from Tolerant)52 algorithm and probably damaging by PolyPhen (polymorphism phenotyping) annotation with score = 0.999.53 These findings could support the significant association of this SNP with diabetes susceptibility identified for the first time, up to the authors’ knowledge, in the current population. Further animal model or cell line-based testing of this variant can help to confirm our findings.
Regards the NOS2 variant, the rs2297518*A allele showed a dose-response effect; being heterozygote was associated with higher odds for developing DM, whereas being AA homozygote had double the risk. This dose-effect remained significant in the multivariable analysis. In association with other non-genetic factors such as older age, dyslipidemia, high systolic blood pressure, and elevated HbA1c, this variant showed a significant role in distinguishing the T2DM cohort from controls by PCA. This exon-16 nonsynonymous variant was proved to increase the NOS2 activity with several implications in many diseases.54
The rs2297518 risk allele results in an S608L amino-acid substitution that is located in the catalytic domain of NOS2 close to the flavin mononucleotide-binding region
which may impact the catalytic activity of NOS2 and disease susceptibility, as proposed by Dhillon et al.55 Although this variant showed association with T2DM in Caucasians,35 the significant association in the population under the study, to our knowledge, is the first to be identified.
Apart from the SNPs mentioned above, there were no statistically significant differences in the distribution of other studied genetic variants and no impact of these variants on the present cohort’s biochemical parameters. These findings are similar to some previous reports,13,18,20 but inconsistent with others.13,21,56 These susceptibility differences could be contributed by several factors, including the enrolled population’s genetic background, the study design and sample size, the genotyping method, and the presence of diabetic complications, among others.
Interestingly, we found that having both GSTT1 rs17856199*A and NOS2 rs2297518*A variants were 3.96 times more likely to have DM while carrying both GSTT1 rs17856199*C and NOS2 rs2297518*A variants had three times higher susceptibility of developing T2DM. These findings are consistent with the previous observations, which reported that the “combined or additive effect of multiple gene variants from distinct loci might account for a greater proportion of the disease risk.”57,58 Risk alleles interaction in these antioxidant-related gene variants might impact the overall antioxidant activities, thus allowing more susceptibility to oxidative stress and increasing the overall disease risk as proposed by Decharatchakul and colleagues.59
The SOD2 rs4880 GG, and SOD3 rs2536512 AA genotypes, though they did not show a significant association with T2DM risk in the present cohort, they showed significant association with BMI and/or hyperlipidemia (Table 5), and the former variant also showed an association with blood glucose levels (Table S2). Interestingly, these results are consistent with a recent study that identified the same genotypes’ association with increased hypertriglyceridemia risk combined with low high-density lipoprotein cholesterol levels.59 SOD2 rs4880 variant causes valine substitution of alanine in “mitochondrial targeting sequence” as mentioned previously, affecting the normal importing process of the enzyme into the mitochondrial matrix with a partial halt of the precursor within the inner mitochondrial membrane and decline in active SOD2 enzyme formation with concomitant lower enzyme activity.60 Also, other studies suggested that this variant might not be associated with T2DM pathogenesis but could be related to diabetic microangiopathy in terms of microalbuminuria61 or macular edema.62 Dong et al demonstrated that the SOD3 rs2536512 variant might affect the enzyme plasma activity, increasing susceptibility to oxidative stress associated with obesity.63 The latter finding could, in part, support the association of this SNP with BMI in the present study. Given the essential roles NO plays, including regulation of endothelial cell function and inhibition of the vascular tone and oxidized LDL-C formation, NO production impairment due to NOS2 rs2297518 variant,32 could result in insulin resistance, T2DM, hypertension, and hypercholesterolemia.64 This can also support the significant association of this variant with hyperlipidemia in the present work consistent with the recent report that identified this missense variant as a genetic risk for vulnerable carotid plaque in the Chinese population.65
Taken together, although the present study is limited by the relatively small sample size, the cross-sectional design, and lack of inclusion of other known oxidative stress-related variants, the study findings, to the best of our knowledge, are the first to identify the potential association of the oxidative stress-related GSTT1 rs17856199 and NOS2 rs2297518 gene variants, individually or in combination, with susceptibility to T2DM in the current population. Also, SOD2 rs4880, SOD3 rs2536512, and NOS2 rs22975 showed significant association with BMI and/or hyperlipidemia. Testing the association of these gene variants with T2DM and considering other genetic and non-genetic factors could help patient stratification by the risk and be scheduled as molecular targets in future individualized therapy. Further large-scale multicenter studies are recommended to confirm the findings.
Data Sharing Statement
All data generated or analyzed during this study are included in this submitted article and Supplementary Materials.
Ethics Statement
The study was conducted in accordance with the Declaration of Helsinki (as revised in 2013). The study was approved by the IRB at the King Fahd Armed Forces Hospital (approval No. REC 201), Jeddah, KSA, and informed consent was given by all the patients. Parental informed consent was obtained for participants under the age of 18 (if any).
Acknowledgments
The authors would like to thank the Medical research center, Phlebotomy Department, and T2DM clinic of King Fahd Armed Forces Hospital (KFAFH) for helping with sample collection and the biochemical analysis. Many thanks extend to Eng. Y Shakoor (IGB) for providing tools and databases used for SNPs selection, and also Eng. A Bin Taleb (Roche), Dr. S Bakhashab, and Mis. M Shaabad (King Fahd Medical Research Center; KFMRC) for providing technical support during the molecular work.
Author Contributions
All authors contributed to data analysis, drafting or revising the article, have agreed on the journal to which the article has been submitted, gave final approval of the version to be published, and agree to be accountable for all aspects of the work.
Funding
There is no funding to report.
Disclosure
The authors report no conflicts of interest for this work.
References
1. Saeedi P, Petersohn I, Salpea P, et al. Global and regional diabetes prevalence estimates for 2019 and projections for 2030 and 2045: results from the international diabetes federation diabetes atlas. Diabetes Res Clin Pract. 2019;157:107843. doi:10.1016/j.diabres.2019.107843
2. Robert AA, Al Dawish MA. The worrying trend of diabetes mellitus in Saudi Arabia: an urgent call to action. Curr Diabetes Rev. 2020;16(3):204–210. doi:10.2174/1573399815666190531093735
3. Elfaki I, Almutairi FM, Mir R, Khan R, Abu-Duhier F. Cytochrome p450 cyp1b1* 2 gene and its association with t2d in tabuk population, northwestern region of saudi arabia. Asian J Pharm Clin Res. 2018;11:55–59. doi:10.22159/ajpcr.2018.v11i1.21657
4. Elfaki I, Mir R, Abu-Duhier FM, et al. Analysis of the potential association of drug-metabolizing enzymes CYP2C9* 3 and CYP2C19* 3 gene variations with type 2 diabetes: a case-control study. Curr Drug Metab. 2020;21(14):1152–1160. doi:10.2174/1389200221999201027200931
5. Bakhashab S, Filimban N, Altall RM, et al. The effect sizes of PPARγ rs1801282, FTO rs9939609, and MC4R rs2229616 variants on type 2 diabetes mellitus risk among the western saudi population: a cross-sectional prospective study. Genes. 2020;11(1):98. doi:10.3390/genes11010098
6. Wu Y, Ding Y, Tanaka Y, Zhang W. Risk factors contributing to type 2 diabetes and recent advances in the treatment and prevention. Int J Med Sci. 2014;11(11):1185–1200. doi:10.7150/ijms.10001
7. Dendup T, Feng X, Clingan S, Astell-Burt T. Environmental risk factors for developing type 2 diabetes mellitus: a systematic review. Int J Environ Res Public Health. 2018;15(1):78. doi:10.3390/ijerph15010078
8. Banerjee M, Vats P. Reactive metabolites and antioxidant gene polymorphisms in Type 2 diabetes mellitus. Redox Biol. 2014;2:170–177. doi:10.1016/j.redox.2013.12.001
9. Chawla A, Chawla R, Jaggi S. Microvasular and macrovascular complications in diabetes mellitus: distinct or continuum? Indian J Endocrinol Metab. 2016;20(4):546–551. doi:10.4103/2230-8210.183480
10. Soto ME, Soria-Castro E, Lans VG, et al. Analysis of oxidative stress enzymes and structural and functional proteins on human aortic tissue from different aortopathies. Oxid Med Cell Longev. 2014;2014:760694. doi:10.1155/2014/760694
11. Billings LK, Florez JC. The genetics of type 2 diabetes: what have we learned from GWAS? Ann N Y Acad Sci. 2010;1212(1):59–77. doi:10.1111/j.1749-6632.2010.05838.x
12. Bustamante CD, Burchard EG, De la Vega FM. Genomics for the world. Nature. 2011;475(7355):163–165. doi:10.1038/475163a
13. Vats P, Sagar N, Singh TP, Banerjee M. Association of Superoxide dismutases (SOD1 and SOD2) and glutathione peroxidase 1 (GPx1) gene polymorphisms with type 2 diabetes mellitus. Free Radic Res. 2015;49(1):17–24. doi:10.3109/10715762.2014.971782
14. Román-Pintos LM, Villegas-Rivera G, Rodríguez-Carrizalez AD, Miranda-Díaz AG, Cardona-Muñoz EG. Diabetic polyneuropathy in type 2 diabetes mellitus: inflammation, oxidative stress, and mitochondrial function. J Diabetes Res. 2016;2016:3425617. doi:10.1155/2016/3425617
15. Banerjee M, Vats P, Kushwah AS, Srivastava N. Interaction of antioxidant gene variants and susceptibility to type 2 diabetes mellitus. Br J Biomed Sci. 2019;76(4):166–171. doi:10.1080/09674845.2019.1595869
16. Malik A, Morya RK, Saha S, Singh PK, Bhadada SK, Rana SV. Oxidative stress and inflammatory markers in type 2 diabetic patients. Eur J Clin Invest. 2020;50(6):e13238. doi:10.1111/eci.13238
17. Zelko IN, Mariani TJ, Folz RJ. Superoxide dismutase multigene family: a comparison of the CuZn-SOD (SOD1), Mn-SOD (SOD2), and EC-SOD (SOD3) gene structures, evolution, and expression. Free Radic Biol Med. 2002;33(3):337–349. doi:10.1016/S0891-5849(02)00905-X
18. Flekac M, Skrha J, Hilgertova J, Lacinova Z, Jarolimkova M. Gene polymorphisms of superoxide dismutases and catalase in diabetes mellitus. BMC Med Genet. 2008;9(1):30. doi:10.1186/1471-2350-9-30
19. Kinnula VL, Lehtonen S, Koistinen P, et al. Two functional variants of the superoxide dismutase genes in Finnish families with asthma. Thorax. 2004;59(2):116–119. doi:10.1136/thorax.2003.005611
20. Nithya K, Angeline T, Isabel W, Asirvatham AJ. SOD1 gene +35A/C (exon3/intron3) polymorphism in type 2 diabetes mellitus among South Indian population. Genet Res Int. 2016;2016:3787268. doi:10.1155/2016/3787268
21. Yang YM, Xie XR, Jin AL. Genetic polymorphisms in extracellular superoxide dismutase Leu53Leu, Arg213Gly, and Ala40Thr and susceptibility to type 2 diabetes mellitus. Genet Mol Res. 2016;15(4). doi:10.4238/gmr15048418
22. Zhou X, Han X, Wittfeldt A, et al. Long non-coding RNA ANRIL regulates inflammatory responses as a novel component of NF-κB pathway. RNA Biol. 2016;13(1):98–108. doi:10.1080/15476286.2015.1122164
23. Chistiakov DA, Savost’anov KV, Turakulov RI, et al. A new type 1 diabetes susceptibility locus containing the catalase gene (chromosome 11p13) in a Russian population. Diabetes Metab Res Rev. 2004;20(3):219–224. doi:10.1002/dmrr.442
24. Chen N, Liu Y, Greiner CD, Holtzman JL. Physiologic concentrations of homocysteine inhibit the human plasma GSH peroxidase that reduces organic hydroperoxides. J Lab Clin Med. 2000;136(1):58–65. doi:10.1067/mlc.2000.107692
25. Imai H, Nakagawa Y. Biological significance of phospholipid hydroperoxide glutathione peroxidase (PHGPx, GPx4) in mammalian cells. Free Radic Biol Med. 2003;34(2):145–169.
26. Najafi M, Ghasemi H, Roustazadeh A, Alipoor B. Phenotype and genotype relationship of glutathione peroxidase1 (GPx1) and rs 1800668 variant: the homozygote effect on kinetic parameters. Gene. 2012;505(1):19–22. doi:10.1016/j.gene.2012.05.057
27. Monteiro MB, Patente TA, Mohammedi K, et al. Sex-specific associations of variants in regulatory regions of NADPH oxidase-2 (CYBB) and glutathione peroxidase 4 (GPX4) genes with kidney disease in type 1 diabetes. Free Radic Res. 2013;47(10):804–810. doi:10.3109/10715762.2013.828347
28. Admoni SN, Santos-Bezerra DP, Perez RV, et al. Glutathione peroxidase 4 functional variant rs713041 modulates the risk for cardiovascular autonomic neuropathy in individuals with type 1 diabetes. Diab Vasc Dis Res. 2019;16(3):297–299. doi:10.1177/1479164118820641
29. Zaki MA, Moghazy TF, El-Deeb MMK, Mohamed AH, Mohamed NAA. Glutathione S-transferase M1, T1 and P1 gene polymorphisms and the risk of developing type 2 diabetes mellitus in Egyptian diabetic patients with and without diabetic vascular complications. Alexandria Med J. 2015;51(1):73–82. doi:10.1016/j.ajme.2014.03.003
30. Amer MA, Ghattas MH, Abo-Elmatty DM, Abou-El-Ela SH. Influence of glutathione S-transferase polymorphisms on type-2 diabetes mellitus risk. Genet Mol Res. 2011;10(4):3722–3730. doi:10.4238/2011.October.31.14
31. Vats P, Chandra H, Banerjee M. Glutathione S-transferase and Catalase gene polymorphisms with type 2 diabetes mellitus. Dis Mol Med. 2013;1(3):46–53. doi:10.5455/dmm.20131027101207
32. Tabatabaei-Malazy O, Khodaeian M, Bitarafan F, Larijani B, Amoli M. Polymorphisms of antioxidant genes as a target for diabetes management. Int J Mol Cell Med. 2017;6(3):135–147. doi:10.22088/acadpub.BUMS.6.3.135
33. Saadat M. Evaluation of glutathione S-transferase P1 (GSTP1) Ile105Val polymorphism and susceptibility to type 2 diabetes mellitus, a meta-analysis. EXCLI J. 2017;16:1188–1197. doi:10.17179/excli2017-828
34. Santos KG, Crispim D, Canani LH, Ferrugem PT, Gross JL, Roisenberg I. Relationship of endothelial nitric oxide synthase (eNOS) gene polymorphisms with diabetic retinopathy in Caucasians with type 2 diabetes. Ophthalmic Genet. 2012;33(1):23–27. doi:10.3109/13816810.2011.620057
35. Porojan MD, Cătană A, Popp RA, Dumitrascu DL, Bala C. The role of NOS2A −954G/C and vascular endothelial growth factor +936C/T polymorphisms in type 2 diabetes mellitus and diabetic nonproliferative retinopathy risk management. Ther Clin Risk Manag. 2015;11:1743–1748. doi:10.2147/TCRM.S93172
36. Priščáková P, Minárik G, Repiská V. Candidate gene studies of diabetic retinopathy in human. Mol Biol Rep. 2016;43(12):1327–1345. doi:10.1007/s11033-016-4075-y
37. Chen F, Li YM, Yang LQ, Zhong CG, Zhuang ZX. Association of NOS2 and NOS3 gene polymorphisms with susceptibility to type 2 diabetes mellitus and diabetic nephropathy in the Chinese Han population. IUBMB Life. 2016;68(7):516–525. doi:10.1002/iub.1513
38. Al-Ghamdi S, Shubair MM, Aldiab A, et al. Prevalence of overweight and obesity based on the body mass index; a cross-sectional study in Alkharj, Saudi Arabia. Lipids Health Dis. 2018;17(1):134. doi:10.1186/s12944-018-0778-5
39. Friedewald WT, Levy RI, Fredrickson DS. Estimation of the concentration of low-density lipoprotein cholesterol in plasma, without use of the preparative ultracentrifuge. Clin Chem. 1972;18(6):499–502. doi:10.1093/clinchem/18.6.499
40. National Institutes of H. ATP III Guidelines At-a-Glance Quick Desk Reference. NIH publication; 2001: 01–3305.
41. Janssens AC, Moonesinghe R, Yang Q, Steyerberg EW, van Duijn CM, Khoury MJ. The impact of genotype frequencies on the clinical validity of genomic profiling for predicting common chronic diseases. Genet Med. 2007;9(8):528–535. doi:10.1097/GIM.0b013e31812eece0
42. Haschenburger JK, Spinelli JJ. Assessing the goodness-of-fit of statistical distributions when data are grouped. Math Geol. 2005;37(3):261–276.
43. Solé X, Guinó E, Valls J, Iniesta R, Moreno V. SNPStats: a web tool for the analysis of association studies. Bioinformatics. 2006;22(15):1928–1929. doi:10.1093/bioinformatics/btl268
44. Horita N, Kaneko T. Genetic model selection for a case-control study and a meta-analysis. Metagene. 2015;5:1–8.
45. Le S, JoSse J, Husson F. FactoMineR: an R package for multivariate analysis. J Stat Softw. 2008;25(1). doi:10.18637/jss.v025.i01
46. Ma X, Chen Z, Wang L, et al. The pathogenesis of diabetes mellitus by oxidative stress and inflammation: its inhibition by berberine. Front Pharmacol. 2018;9:782. doi:10.3389/fphar.2018.00782
47. Yaribeygi H, Sathyapalan T, Atkin SL, Sahebkar A. Molecular mechanisms linking oxidative stress and diabetes mellitus. Oxid Med Cell Longev. 2020;2020:8609213. doi:10.1155/2020/8609213
48. Liu KL, Kuo WC, Lin CY, et al. Prevention of 4-hydroxynonenal-induced lipolytic activation by carnosic acid is related to the induction of glutathione S-transferase in 3T3-L1 adipocytes. Free Radic Biol Med. 2018;121:1–8. doi:10.1016/j.freeradbiomed.2018.04.567
49. Masoodi TA, Rao Talluri V, Shaik NA, Al-Aama JY, Hasan Q. Functional genomics based prioritization of potential nsSNPs in EPHX1, GSTT1, GSTM1 and GSTP1 genes for breast cancer susceptibility studies. Genomics. 2012;99(6):330–339. doi:10.1016/j.ygeno.2012.04.006
50. Kheradpour P, Kellis M. Systematic discovery and characterization of regulatory motifs in ENCODE TF binding experiments. Nucleic Acids Res. 2014;42(5):2976–2987. doi:10.1093/nar/gkt1249
51. Barnes MR, Gray IC. Bioinformatics for Geneticists. John Wiley & Sons; 2003.
52. Sim N-L, Kumar P, Hu J, Henikoff S, Schneider G, Ng PC. SIFT web server: predicting effects of amino acid substitutions on proteins. Nucleic Acids Res. 2012;40(W1):W452–W457. doi:10.1093/nar/gks539
53. Adzhubei I, Jordan DM, Sunyaev SR. Predicting functional effect of human missense mutations using PolyPhen‐2. Curr Protoc Hum Genet. 2013;76(1):7–20. doi:10.1002/0471142905.hg0720s76
54. Qidwai T, Jamal F. Inducible nitric oxide synthase (iNOS) gene polymorphism and disease prevalence. Scand J Immunol. 2010;72(5):375–387. doi:10.1111/j.1365-3083.2010.02458.x
55. Dhillon SS, Mastropaolo LA, Murchie R, et al. Higher activity of the inducible nitric oxide synthase contributes to very early onset inflammatory bowel disease. Clin Transl Gastroenterol. 2014;5(1):e46. doi:10.1038/ctg.2013.17
56. Ghattas MH, Abo-Elmatty DM. Association of polymorphic markers of the catalase and superoxide dismutase genes with type 2 diabetes mellitus. DNA Cell Biol. 2012;31(11):1598–1603. doi:10.1089/dna.2012.1739
57. Ioannidis JP. Genetic associations: false or true? Trends Mol Med. 2003;9(4):135–138. doi:10.1016/S1471-4914(03)00030-3
58. Kelley R, Ideker T. Systematic interpretation of genetic interactions using protein networks. Nat Biotechnol. 2005;23(5):561–566. doi:10.1038/nbt1096
59. Decharatchakul N, Settasatian C, Settasatian N, et al. Association of genetic polymorphisms in. PeerJ. 2019;7:e7407. doi:10.7717/peerj.7407
60. Sutton A, Imbert A, Igoudjil A, et al. The manganese superoxide dismutase Ala16Val dimorphism modulates both mitochondrial import and mRNA stability. Pharmacogenet Genomics. 2005;15(5):311–319. doi:10.1097/01213011-200505000-00006
61. Lee SJ, Choi MG, Kim DS, Kim TW. Manganese superoxide dismutase gene polymorphism (V16A) is associated with stages of albuminuria in Korean type 2 diabetic patients. Metabolism. 2006;55(1):1–7.
62. Lee SJ, Choi MG. Association of manganese superoxide dismutase gene polymorphism (V16A) with diabetic macular edema in Korean type 2 diabetic patients. Metabolism. 2006;55(12):1681–1688. doi:10.1016/j.metabol.2006.08.011
63. Marseglia L, Manti S, D’Angelo G, et al. Oxidative stress in obesity: a critical component in human diseases. Int J Mol Sci. 2014;16(1):378–400. doi:10.3390/ijms16010378
64. Yan SF, Ramasamy R, Schmidt AM. The RAGE axis: a fundamental mechanism signaling danger to the vulnerable vasculature. Circ Res. 2010;106(5):842–853. doi:10.1161/CIRCRESAHA.109.212217
65. Yi X, Zhu L, Sui G, et al. Inflammation and endothelial function relevant genetic polymorphisms and carotid plaque in Chinese population. J Atheroscler Thromb. 2020;27(9):978–994. doi:10.5551/jat.53074
 © 2021 The Author(s). This work is published and licensed by Dove Medical Press Limited. The
full terms of this license are available at https://www.dovepress.com/terms
and incorporate the Creative Commons Attribution
- Non Commercial (unported, 3.0) License.
By accessing the work you hereby accept the Terms. Non-commercial uses of the work are permitted
without any further permission from Dove Medical Press Limited, provided the work is properly
attributed. For permission for commercial use of this work, please see paragraphs 4.2 and 5 of our Terms.
© 2021 The Author(s). This work is published and licensed by Dove Medical Press Limited. The
full terms of this license are available at https://www.dovepress.com/terms
and incorporate the Creative Commons Attribution
- Non Commercial (unported, 3.0) License.
By accessing the work you hereby accept the Terms. Non-commercial uses of the work are permitted
without any further permission from Dove Medical Press Limited, provided the work is properly
attributed. For permission for commercial use of this work, please see paragraphs 4.2 and 5 of our Terms.