
Back to Journals » Cancer Management and Research » Volume 17

GCDH Promotes Breast Cancer Glutaminolysis Reprogramming by Inducing GLS1 Expression Through Histone Crotonylation at Its Promoter Region
Received 7 July 2025
Accepted for publication 2 December 2025
Published 17 December 2025 Volume 2025:17 Pages 3185—3196
DOI https://doi.org/10.2147/CMAR.S552195
Checked for plagiarism Yes
Review by Single anonymous peer review
Peer reviewer comments 2
Editor who approved publication: Professor Seema Singh
Jianan Zhang, Mengsha Zou
Department of Breast and Thyroid Surgery, The Affiliated Lihuili Hospital of Ningbo University, Ningbo, 315040, People’s Republic of China
Correspondence: Mengsha Zou, Email [email protected]
Objective: Glutaryl-CoA dehydrogenase (GCDH) is a mitochondrial enzyme involved in lysine and tryptophan catabolism, yet its role in cancer metabolism remains poorly understood. This study aimed to investigate the function of GCDH in regulating glutamine metabolism and proliferation in breast cancer cells, and to elucidate its molecular mechanism via epigenetic modulation of glutaminase 1 (GLS1).
Methods: GCDH expression was silenced using siRNAs in human breast cancer cell lines MCF-7 and MDA-MB-231. Cell proliferation was assessed using CCK-8 and EdU assays. Glutamine metabolism was analyzed by quantifying intracellular levels of glutamine, glutamate, α-ketoglutarate (α-KG), and ATP. In vivo effects were evaluated using a xenograft model in BALB/c nude mice. Chromatin immunoprecipitation (ChIP), luciferase reporter assays, and Western blotting were performed to explore the epigenetic regulation of GLS1. Functional interaction between GCDH and GLS1 was further validated through overexpression and knockdown studies, and the requirement for GCDH’s enzymatic activity was tested using a catalytically inactive mutant.
Results: GCDH knockdown significantly suppressed proliferation in MCF-7 and MDA-MB-231 cells (p< 0.001), decreased EdU incorporation (p< 0.01), and impaired glutamine metabolism, as indicated by elevated intracellular glutamine and reduced levels of glutamate, α-KG, and ATP (all p< 0.05). In vivo, GCDH depletion led to reduced tumor growth and weight (p< 0.001), with altered metabolic profiles consistent with impaired glutaminolysis (decreased α-KG, p< 0.05). Mechanistically, GCDH silencing reduced global and GLS1 promoter-specific H3K27 crotonylation (p< 0.01), suppressing GLS1 transcriptional activity (p< 0.001). Overexpression of GLS1 reversed the metabolic and proliferative deficits induced by GCDH knockdown. Furthermore, wild-type GCDH overexpression, but not a catalytically inactive mutant, partially restored glutamate production and ATP levels in GLS1-deficient cells (p< 0.05), indicating a functional interplay that depends on GCDH’s enzymatic activity.
Conclusion: GCDH promotes breast cancer cell proliferation and metabolic activity by enhancing glutaminolysis through epigenetic upregulation of GLS1 via histone crotonylation. Critically, this novel metabolic-epigenetic axis requires the catalytic function of GCDH. These findings not only reveal a novel metabolic-epigenetic axis driven by a specific mitochondrial enzyme but also suggest GCDH as a potential therapeutic target in breast cancer.
Keywords: glutamine metabolism, breast cancer, epigenetic regulation, histone crotonylation
Introduction
Cancer cells undergo extensive metabolic reprogramming to sustain rapid proliferation, ensuring a continuous supply of energy, biosynthetic precursors, and redox balance.1,2 A hallmark of this reprogramming is the aberrant utilization of glucose. Many tumor cells exhibit markedly increased glucose uptake; however, a substantial portion of this glucose is not directed into the tricarboxylic acid (TCA) cycle for oxidative phosphorylation but is instead converted to lactate.3,4 This inefficient, glucose-dependent metabolic mode is insufficient on its own to meet the energetic and anabolic demands of rapidly proliferating cells, as glycolysis provides limited ATP and metabolic intermediates.5,6 Consequently, cancer cells frequently rely on amino acids as auxiliary energy sources. Notably, glutamine, the most abundant amino acid in mammals, serves as a critical alternative carbon source.7,8 Tumors often enhance glutamine uptake and metabolism to support their bioenergetic and biosynthetic requirements.9 Upon cellular entry via the ASCT2 transporter, glutamine is converted to glutamate by glutaminase (GLS). Glutamate is then primarily metabolized by glutamate dehydrogenase 1 (GLUD1) to produce α-ketoglutarate (α-KG), which replenishes the TCA cycle to fuel ATP production.10–12 Beyond its role in energy generation, glutamine also supplies nitrogen for nucleotide and non-essential amino acid synthesis and contributes to glutathione production, thereby aiding cellular defense against oxidative stress.13
Growing evidence indicates that these metabolic adaptations are closely linked to epigenetic regulation, which integrates metabolic signals into gene expression programs.14 Among various histone post-translational modifications (PTMs), crotonylation is a unique, transcriptionally active mark that significantly influences chromatin architecture and gene accessibility.15,16 Distinct from acetylation and methylation, histone crotonylation is catalyzed by “writer” enzymes such as p300/CBP, which utilize crotonyl-CoA, and is enriched at active promoters and enhancers.17,18 Conversely, this modification can be removed by several “erasers,” including sirtuins (SIRT1/2/3) and classical histone deacetylases (HDACs).19,20 Owing to the longer carbon chain of crotonyl-CoA, crotonylation exhibits biophysical properties distinct from acetylation, enabling it to remodel chromatin structure and recruit specific reader proteins, often resulting in more potent transcriptional effects than acetylation.21,22 Furthermore, intracellular crotonyl-CoA levels are tightly coupled to metabolic activity, underscoring the pivotal role of histone crotonylation at the nexus of metabolism and epigenetic regulation.23,24
Recent studies have also revealed the potential involvement of crotonylation in tumorigenesis. For instance, in glioblastoma, glutaryl-CoA dehydrogenase (GCDH)—a mitochondrial enzyme essential for lysine and tryptophan metabolism—was shown to promote immune evasion by redirecting lysine metabolism toward crotonyl-CoA production, thereby elevating global histone crotonylation levels.25 This finding not only links crotonylation to cancer progression but also identifies GCDH as a key metabolic regulator of this epigenetic mark. However, whether GCDH regulates crotonylation in breast cancer—a disease characterized by significant metabolic heterogeneity—remains unexplored.
In this study, we propose that GCDH promotes breast cancer progression by enhancing histone crotonylation and remodeling metabolic gene expression. Using in vivo and in vitro models, we aim to elucidate the role of GCDH in the metabolic reprogramming of breast cancer and to decipher the underlying mechanisms through which this enzyme regulates tumor growth and energy metabolism.
Materials and Methods
Cell Culture and Treatment
Human breast cancer cell lines MCF-7 (ATCC® HTB-22™) and MDA-MB-231 (ATCC® HTB-26™) were obtained from the American Type Culture Collection (ATCC). Cells were cultured in RPMI-1640 medium (Gibco, 11875093) supplemented with 10% fetal bovine serum (FBS; Gibco, 10270106) and 2 mM L-glutamine (Gibco, 25030081). All cell lines were maintained at 37°C in a 5% CO2 humidified incubator (Thermo, Model 3111) and routinely tested for Mycoplasma contamination using PCR (LookOut® Mycoplasma PCR Kit, Sigma, MP0035). Cell line authentication was performed biannually via STR profiling (GenePrint® 10 System, Promega).
For transfection, siRNAs targeting GCDH (siGCDH-1: 5′-GCAUGAAGACUUCGUGAAATT-3′; siGCDH-2: 5′-CCUGGAAGAUCAUCGACAUTT-3′; siGCDH-3: 5′-GGACCAUCUACUACGAGAATT-3′) and GLS1 (siGLS-1: 5′-GCAGGAUGUCAAGAAGAAUTT-3′) were synthesized by RiboBio (Guangzhou, China). Negative control siRNA (siNC: 5′-UUCUCCGAACGUGUCACGUTT-3′) was used as a scramble control. GCDH overexpression plasmid (pcDNA3.1-GCDH-FLAG) and GLS1 overexpression plasmid (pLVX-GLS1-HA) were constructed by GeneChem (Shanghai, China). For rescue experiments, an empty vector control (pcDNA3.1) was included in all experimental groups to ensure specificity. Transient transfections were performed using Lipofectamine RNAiMAX (Invitrogen, 13778150) for siRNAs or Lipofectamine 2000 (Invitrogen, 11668019) for plasmids, according to manufacturer’s instructions. Transfection efficiency and stability were monitored at 24, 48, and 72 h post-transfection by Western blotting. Cells were routinely harvested 48 h post-transfection for subsequent experiments, as this time point showed optimal and stable transfection efficiency without significant cytotoxicity.
In Vivo Xenograft Model
All animal procedures were approved by the Institutional Animal Care and Use Committee (IACUC) of The Affiliated Lihuili Hospital of Ningbo University (Approval No. LLH-2023-0189) and was provided in compliance with the Guidelines for the Care and Use of Laboratory Animals published by the National Institutes of Health. Female BALB/c nude mice (5–6 weeks old, n = 8 per group) were purchased from Vital River Laboratory (Beijing, China) and housed under specific pathogen-free (SPF) conditions (25°C, 55% humidity, 12-h light/dark cycle).
MDA-MB-231 cells (4 × 10⁶ in 50 μL PBS) were subcutaneously injected into the right flanks of mice. When tumors reached ~100 mm3 (Volume = length × width2/2), mice were randomized into two groups: siNC group: Intravenous (IV) injection of control siRNA (20 nmol/kg) complexed with in vivo-jetPEI® (Polyplus, 201–10G) every 3 days. siGCDH group: IV injection of siGCDH-2 (20 nmol/kg) with in vivo-jetPEI®. Tumor volume and body weight were measured twice weekly. After 30 days, mice were euthanized, tumors were excised and weighed. Tumor dimensions were precisely measured using digital calipers, and volumes were calculated as (length × width2)/2. Tissue samples were snap-frozen for biochemical analysis.
Cell Proliferation Assays
Cell viability was determined with the Cell Counting Kit-8 (CCK-8; Solarbio, CA1210). Briefly, 3 × 10³ cells were seeded into each well of a 96-well plate, and after incubation with the CCK-8 reagent for 2 h, absorbance at 450 nm (with 630 nm as reference) was recorded on a TECAN Spark® microplate reader.
To further assess proliferative capacity, an EdU incorporation assay (RiboBio, C10310-1) was carried out. Cells were treated with 20 μM EdU for 2 h, fixed, and stained using Apollo®567 according to the manufacturer’s protocol. Images were acquired using a Leica DMi8 fluorescence microscope (Leica, Germany), and EdU-positive nuclei were quantified from at least five randomly selected fields per well using ImageJ.
Glutamine Metabolism Analysis
Metabolite concentrations were normalized to total protein content (BCA assay) or cell number (hemocytometer).
Intracellular glutamine and glutamate were extracted using 80% methanol following PBS washes and measured using the Glutamine Assay Kit (Abnova, KA1627) and Glutamate Assay Kit (Sigma, MAK004-1KT), respectively.
α-Ketoglutarate (α-KG) levels were detected using the α-KG Assay Kit (Solarbio, BC5425).
ATP content was assessed using the CellTiter-Glo® Luminescent Cell Viability Assay (Promega, G7570). Lysates were mixed 1:1 with reagent, incubated in the dark for 10 min, and luminescence was recorded with a TECAN Spark® reader.
Glutamine consumption was determined by culturing cells in glutamine-free RPMI supplemented with 2 mM glutamine. Culture medium was collected at 0, 24, and 48 h, and residual glutamine levels measured. Consumption rate = ([Gln]initial − [Gln]final) / (cell number × time).
Western Blotting
Cells were harvested and lysed in RIPA buffer (Beyotime, P0013B) supplemented with protease inhibitors. Protein levels were quantified, and equal amounts of lysate (20 μg per lane) were resolved on 10% SDS–PAGE gels, followed by transfer onto PVDF membranes (Millipore, IPFL00010). After blocking with 5% BSA, membranes were incubated overnight at 4 °C with the following primary antibodies: GCDH (Abcam, ab154192; 1:1000), GLS1 (CST, 12855; 1:1000), H3K27cr (PTM Bio, PTM-502; 1:2000), total H3 (Abcam, ab1791; 1:5000), and GAPDH (Proteintech, 60004-1-Ig; 1:10,000).
Secondary detection was performed using HRP-linked antibodies (CST, 7074/7076; 1:5000), and chemiluminescent signals were visualized with the ECL Prime kit (Cytiva, RPN2236) on an Amersham Imager 600 system.
Quantitative PCR (qPCR)
Total RNA was isolated using the RNeasy Mini Kit (Qiagen, 74104). Complementary DNA was synthesized from the extracted RNA with the RevertAid RT Kit (Thermo, K1691). Quantitative PCR was conducted on a QuantStudio 5 real-time system (Applied Biosystems) using SYBR Green Master Mix (Thermo, A25742). The amplification program consisted of an initial denaturation at 95 °C for 10 minutes, followed by 40 reaction cycles of 95 °C for 15 seconds and 60 °C for 30 seconds. The primer sequences were as follows:
- GLS1: F 5′-TGGCTGTCATCAAGGTGAAG-3′, R 5′-GCTGTCCACATCACCATCTG-3′
- GAPDH: F 5′-GGAGCGAGATCCCTCCAAAAT-3′, R 5′-GGCTGTTGTCATACTTCTCATGG-3′
Gene expression levels were quantified using the 2−ΔΔCt approach, with GAPDH serving as the internal reference. Specificity of each reaction was confirmed through melt-curve analysis.
Chromatin Immunoprecipitation (ChIP)
Chromatin immunoprecipitation was carried out with the EZ-ChIP™ Kit (Millipore, 17–371). To preserve protein–DNA interactions, cells were treated with 1% formaldehyde for 10 minutes and subsequently neutralized with glycine. The crosslinked chromatin was disrupted by ultrasonic fragmentation on a Covaris S220 instrument (20% duty cycle, 200 W, 8 min), producing sheared DNA ranging from approximately 200 to 500 bp. Immunoprecipitation was conducted with 5 μg of either anti-H3K27cr antibody (PTM Bio, PTM-502) or normal rabbit IgG (Millipore, 12–370). To assess the specificity of histone crotonylation, additional ChIP assays were performed using antibodies against H3K27ac (Abcam, ab4729) and H3K27me3 (CST, 9733). DNA was purified and analyzed by qPCR using GLS1 promoter-specific primers: F 5′-CCTAGCCTGGGTGACAGAGT-3′, R 5′-GCTGGGATTACAGGCGTGAG-3′ (amplicon from −250 to −50 bp relative to TSS). Data are presented as percent input.
Luciferase Reporter Assay
The GLS1 promoter fragment spanning −2000 to +100 bp was inserted into the pGL3-Basic backbone (Promega, E1751). MCF-7 and MDA-MB-231 cells were transfected with the pGL3 construct (400 ng), together with either pcDNA3.1-GCDH-FLAG or the corresponding empty vector (200 ng), along with 40 ng of the pRL-TK Renilla plasmid for internal normalization. After a 48-h incubation, firefly and Renilla luciferase signals were quantified using the Dual-Luciferase® Reporter Assay System (Promega, E1910). Promoter activity was expressed as the ratio of firefly to Renilla luminescence.
Functional Rescue ExperimentsTo assess the dependency on GCDH’s enzymatic activity, MCF-7 and MDA-MB-231 cells were transfected with the following combinations: 1) siNC + empty vector; 2) siGLS-1 + empty vector; 3) siGLS-1 + GCDH-WT; 4) siGLS-1 + GCDH-Mut; 5) siNC + GCDH-WT. At 48 h post-transfection, cells were harvested for the measurement of glutamate and ATP levels as described above.
Statistical Analyses
All quantitative results are reported as the mean ± standard deviation (SD) based on a minimum of three biologically independent replicates. Normality of data distribution was examined using the Shapiro–Wilk test, and variance equality among groups was evaluated using Levene’s test. For comparisons between two conditions, significance was determined using an unpaired Student’s t-test. When multiple groups were analyzed, one-way ANOVA followed by Tukey’s multiple-comparison procedure was applied. Time-dependent datasets or experiments involving two independent variables were assessed using two-way ANOVA with Bonferroni-adjusted post hoc testing. Statistical evaluations were conducted with GraphPad Prism 8.0 (GraphPad Software) and SPSS 19.0 (IBM). A p value below 0.05 was interpreted as statistically significant.
Results
GCDH Modulates Proliferation and Glutamine Metabolism in Breast Cancer Cells
To investigate the role of GCDH in breast cancer cell proliferation and metabolism, siRNA-mediated knockdown of GCDH was performed in MCF-7 and MDA-MB-231 cells. Western blot analysis confirmed that all three siRNAs (siGCDH-1, siGCDH-2, siGCDH-3) efficiently reduced GCDH protein levels in both cell lines, with siGCDH-2 selected for subsequent experiments due to its robust silencing efficiency (Figure 1A).
 |
Figure 1 GCDH regulates breast cancer cell proliferation and glutamine metabolism. Breast cancer cells were transfected with siNC (negative control) or siGCDH oligonucleotides. (A) GCDH protein levels were assessed by Western blotting. (B) Cell viability was measured using the CCK-8 assay. (C) Representative EdU staining images. (D) Quantification of EdU-positive cells. (E–H) Intracellular levels of (E) glutamate, (F) glutamine, (G) α-ketoglutarate (α-KG), and (H) ATP were measured to evaluate glutamine metabolism. All experiments were independently performed in triplicate. Data are expressed as Mean ± SD. Statistical significance was determined using one-way ANOVA followed by Tukey’s post hoc test for multiple group comparisons and Student’s t-test for pairwise comparisons. ***P < 0.001 vs siNC. |
Cell viability assays conducted over a 4-day period revealed that GCDH knockdown markedly reduced cell viability in both MCF-7 and MDA-MB-231 cells, as reflected by lower OD450 values in the siGCDH-2 group compared with the siNC group (Figure 1B).
EdU incorporation assays further demonstrated that the proportion of proliferating (EdU-positive) cells was significantly reduced in the siGCDH-2 group relative to the siNC group. Microscopic imaging revealed fewer red-stained EdU-positive nuclei in GCDH-depleted cells, confirming impaired proliferative capacity following GCDH knockdown (Figures 1C and D).
Metabolic profiling showed that intracellular glutamine levels were elevated in siGCDH-2–treated cells compared to the siNC group (Figure 1F). In contrast, the levels of glutamate, α-ketoglutarate (α-KG), and ATP were all significantly reduced in cells with GCDH knockdown compared to the control group, indicating impaired glutaminolysis and energy production (Figures 1E, G and H).
GCDH Modulates in Vivo Glutamine Metabolism of Breast Cancer
To assess the in vivo impact of GCDH on glutamine metabolism, a xenograft model was established by subcutaneous injection of MDA-MB-231 cells into BALB/c nude mice. Western blot analysis of tumor tissue confirmed successful knockdown of GCDH protein in the siGCDH group compared to the siNC control group (Figure 2A).
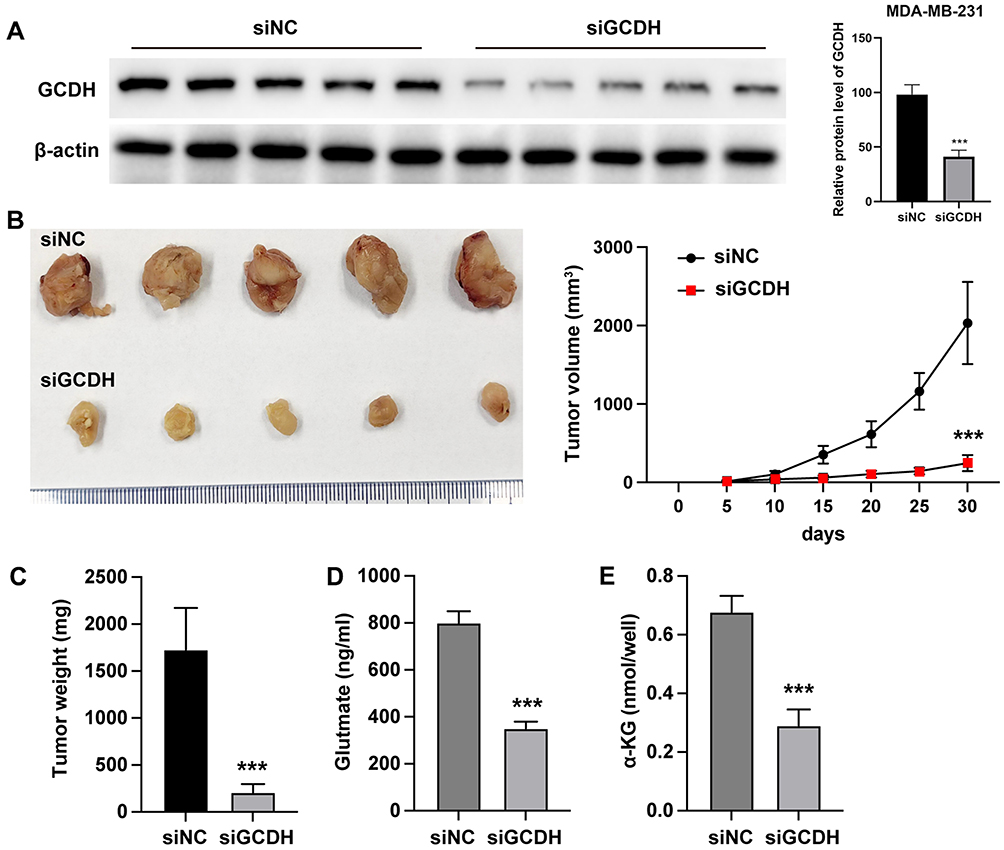 |
Figure 2 GCDH modulates in vivo glutamine metabolism in breast cancer. A xenograft tumor model was established by subcutaneous inoculation of MDA-MB-231 cells into immunodeficient mice. (A) GCDH protein levels in tumor tissues were assessed by Western blot analysis. (B) Representative images of tumors from siNC and siGCDH groups (left), and tumor volume monitored over a 30-day period (right). (C) Tumor weights were measured at the endpoint. (D) Intratumoral glutamate levels were quantified. (E) Intratumoral α-ketoglutarate (α-KG) levels were measured. All experiments were independently performed in triplicate. Data are presented as Mean ± SD. Statistical significance was determined using Student’s t-test for comparisons between two groups. ***P < 0.001. |
Tumor volume measurements over a 30-day period indicated that GCDH silencing significantly suppressed tumor growth, with a slower increase in tumor volume observed in the siGCDH group compared to controls. Upon excision, tumors from the siGCDH group were visually smaller, and statistical analysis revealed a notable reduction in tumor weight compared to the siNC group (Figures 2B and C).
Metabolic analysis of tumor tissues revealed that glutamate levels were significantly decreased in tumors from the siGCDH group relative to the siNC group (Figure 2D), while α-KG levels were substantially reduced, further supporting the notion that GCDH regulates glutamine metabolic flux in vivo (Figure 2E).
GCDH Regulates Histone Crotonylation of GLS1 in Breast Cancer Cells
To uncover the mechanistic link between GCDH and glutamine metabolism, we investigated the effect of GCDH knockdown on histone crotonylation at the GLS1 promoter. Western blot analysis revealed a significant reduction in global H3K27 crotonylation levels in both MCF-7 and MDA-MB-231 cells upon GCDH silencing compared to control cells (Figure 3A).
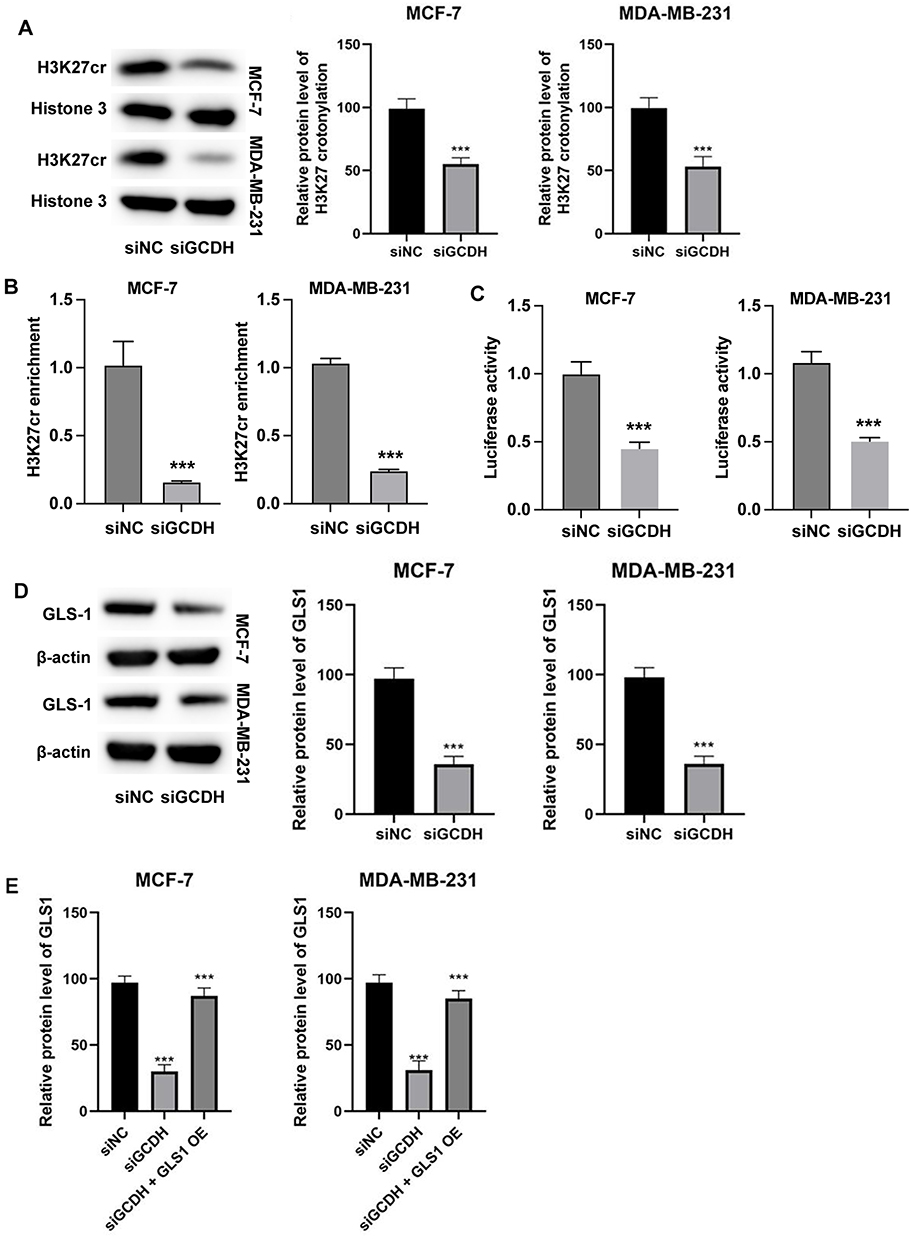 |
Figure 3 GCDH regulates GLS1 expression via histone H3K27 crotonylation in breast cancer cells. (A) Western blot analysis of total H3K27 crotonylation levels in MCF-7 and MDA-MB-231 cells following GCDH knockdown. (B) Enrichment of H3K27 crotonylation at the GLS1 promoter region as assessed by ChIP assay. (C) GLS1 promoter activity measured by luciferase reporter assay. (D) GLS1 protein levels in breast cancer cells transfected with siGCDH. (E) Rescue experiment showing GLS1 protein expression in cells with siGCDH-mediated knockdown and/or GLS1 overexpression (GLS1 OE), analyzed by Western blot. All experiments were independently performed in triplicate. Data are expressed as Mean ± SD. Statistical significance was assessed using Student’s t-test for two-group comparisons (A–D) and one-way ANOVA followed by Tukey’s post hoc test for three-group comparisons (E). ***P < 0.001. |
Chromatin immunoprecipitation (ChIP) assays targeting the GLS1 promoter showed markedly lower enrichment of H3K27 crotonylation in the siGCDH group than in the siNC group, suggesting epigenetic suppression of GLS1 transcription due to GCDH depletion (Figure 3B).
Luciferase reporter assays using a GLS1 promoter construct further validated this finding: promoter activity was significantly lower in cells transfected with siGCDH compared to control cells, confirming transcriptional repression of GLS1 by GCDH loss (Figure 3C).
In line with these results, Western blot analysis demonstrated that GLS1 protein levels were reduced following GCDH knockdown in both breast cancer cell lines (Figure 3D). Importantly, overexpression of GLS1 in GCDH-depleted cells restored GLS1 protein expression to levels comparable to or even higher than those in control cells, thereby reversing the effect of GCDH knockdown (Figure 3E).
GCDH Modulates Glutamine Metabolism Through Regulation of GLS1 in a Catalytic Activity-Dependent Manner
To validate the functional interplay between GCDH and GLS1, combinatorial gain- and loss-of-function experiments were performed in MCF-7 and MDA-MB-231 cells. Western blot analysis confirmed that GLS1 expression was substantially decreased in the siGLS-1 group compared to siNC, while overexpression of GCDH in GLS1-silenced cells partially restored GLS1 protein levels (Figure 4A). In parallel, GCDH protein levels were significantly elevated in GCDH-overexpressing cells regardless of GLS1 status.
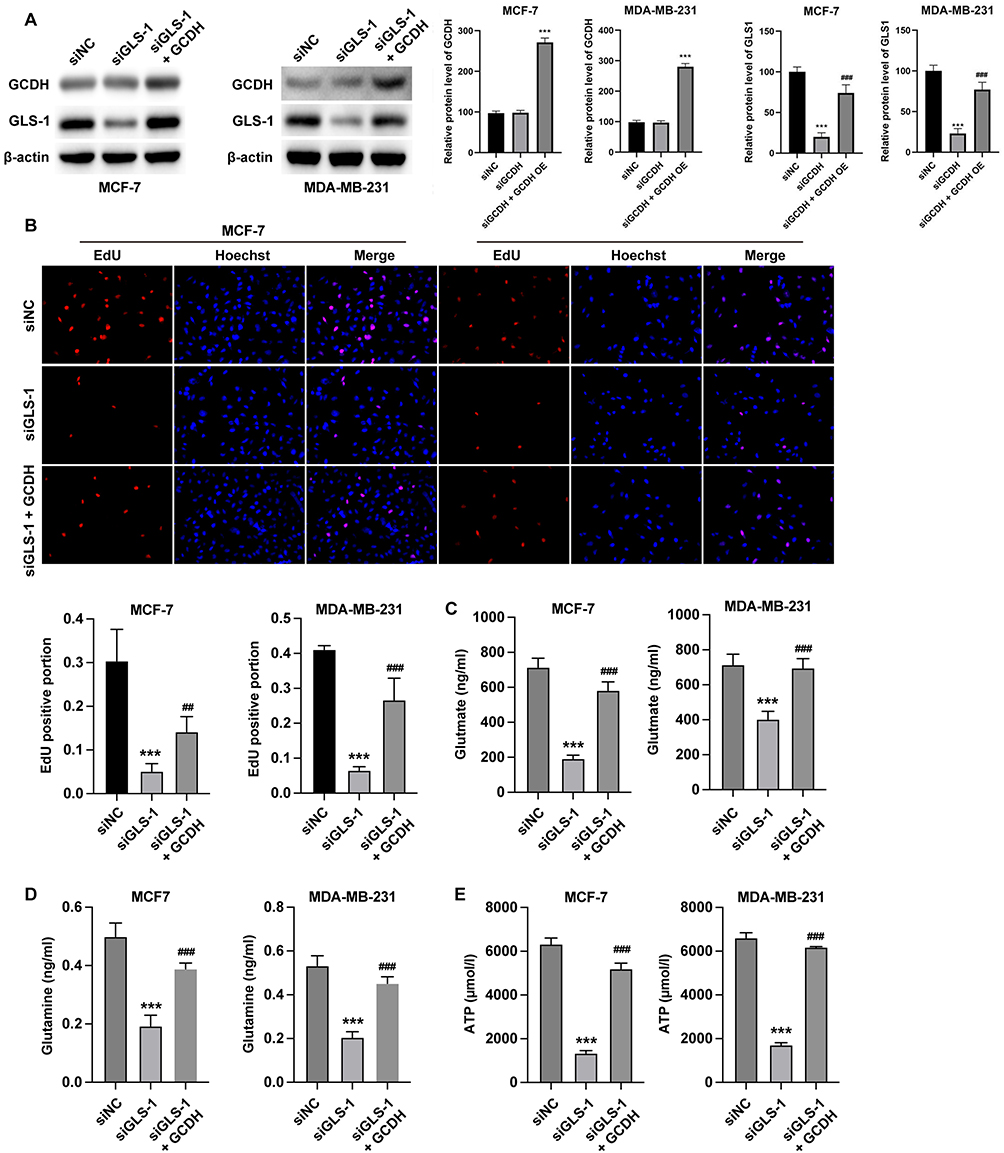 |
Figure 4 GCDH modulates glutamine metabolism and proliferation in breast cancer cells via GLS1. MCF-7 and MDA-MB-231 breast cancer cells were treated with siGLS-1 and/or GCDH overexpression plasmid (GCDH OE). (A) Western blot analysis of GLS1 and GCDH protein expression. (B) Cell proliferation assessed by EdU assay; representative staining images (top) and quantification of EdU-positive cells (bottom) are shown. (C) Glutamate levels were measured to evaluate glutamine metabolism. (D) Intracellular glutamine levels were assessed. (E) ATP levels were quantified. All experiments were independently repeated three times. Data are presented as mean ± SD. ***P < 0.001 vs siNC; ##P < 0.01 vs siGLS-1; ###P < 0.001 vs siGLS-1. Statistical significance was determined by one-way ANOVA followed by Tukey’s post hoc test. |
EdU assays demonstrated that GLS1 knockdown significantly impaired cell proliferation, as indicated by a lower percentage of EdU-positive nuclei in the siGLS-1 group compared to controls. However, this proliferation defect was effectively rescued by GCDH overexpression, which restored the proportion of EdU-positive cells in GLS1-deficient conditions (Figure 4B).
In terms of glutamate production (Figure 4C), GLS1 knockdown resulted in reduced glutamate levels compared to the siNC group. Overexpression of GCDH in these GLS1-deficient cells led to a significant increase in glutamate levels, reversing the inhibitory effect of GLS1 silencing.
Regarding intracellular glutamine levels (Figure 4D), cells transfected with siGLS-1 showed a marked accumulation of glutamine compared to controls, consistent with impaired conversion to glutamate. GCDH overexpression normalized glutamine levels, suggesting that GCDH can compensate for GLS1 loss and restore metabolic balance.
ATP production (Figure 4E) was significantly decreased in cells with GLS1 knockdown, reflecting compromised energy metabolism. Notably, GCDH overexpression reinstated ATP levels in GLS1-deficient cells, further confirming that GCDH plays a compensatory role in maintaining metabolic activity via modulation of GLS1 function.
This compensatory capacity of GCDH prompted us to investigate whether its enzymatic activity is required. We constructed a catalytically inactive GCDH mutant (GCDH-Mut) and tested its rescue efficacy. Strikingly, in contrast to the functional GCDH-WT, the GCDH-Mut completely failed to restore glutamate production (Figure 5A) and ATP levels (Figure 5B) in GLS1-silenced cells. These data provide direct genetic evidence that the enzymatic function of GCDH is indispensable for its role in supporting glutaminolysis, ruling out a mere scaffolding effect.
 |
Figure 5 The catalytic activity of GCDH is required to sustain glutaminolysis. MCF-7 and MDA-MB-231 cells were co-transfected with the indicated siRNA and plasmid combinations: Group 1: siNC + empty vector; Group 2: siGLS-1 + empty vector; Group 3: siGLS-1 + GCDH-WT; Group 4: siGLS-1 + GCDH-Mut; Group 5: siNC + GCDH-WT. (A) Intracellular glutamate levels. (B) Intracellular ATP levels. Data are presented as mean ± SD from three independent experiments. Statistical significance was determined by one-way ANOVA with Tukey’s post hoc test. **p < 0.01, ***p < 0.001. Abbreviation: NS, not significant. |
Discussion
In this study, we systematically investigated the role of GCDH in breast cancer using in vitro and in vivo models. Inhibition of GCDH significantly suppressed tumor cell proliferation and impaired glutamine utilization, as evidenced by intracellular glutamine accumulation coupled with reduced levels of glutamate, α-ketoglutarate (α-KG), and ATP.
Metabolic reprogramming is a hallmark of malignant transformation, often rendering cancer cells highly dependent on glutaminolysis to fulfill the demands of rapid proliferation and biosynthesis.1,9 Our findings identify GCDH as a previously unrecognized key regulator within this metabolic network in breast cancer. Glutamine metabolism is a known driver of breast cancer progression, supplying nucleotides and carbon skeletons to support macromolecular synthesis and mitochondrial function.10,26 Breast cancer cells typically maintain glutamine uptake via transporters such as SLC1A5, SLC6A14, SLC7A5, and SLC7A11 to sustain continuous proliferation.27–29 Upon cellular entry, glutamine is first converted to glutamate by glutaminase (GLS), the rate-limiting step of glutaminolysis.30,31 Glutamate is subsequently metabolized by GLUD1 or GOT2 to generate α-KG, which enters the TCA cycle to fuel oxidative phosphorylation and provide intermediates for nucleotide and lipid biosynthesis.32,33 Consistent with this, we observed that GCDH knockdown led to glutamine accumulation alongside decreased glutamate, α-KG, and ATP, suggesting that GCDH primarily regulates glutaminolytic flux rather than transport. Mechanistically, this effect was associated with a marked downregulation of GLS1 expression upon GCDH loss.
To elucidate how GCDH regulates GLS1, we explored the underlying molecular mechanisms. Our results reveal that a mitochondrial enzyme can influence nuclear gene transcription via an epigenetic pathway, highlighting an unexpected metabolicepigenetic crosstalk. Histone crotonylation is a dynamic acylation modification that responds to cellular metabolic states and participates in transcriptional regulation.22,34 Accumulating evidence underscores the important roles of crotonylation in diverse biological processes and diseases.35,36 For instance, during endoderm differentiation of human embryonic stem cells and in mouse early embryos, enzymes responsible for generating crotonyl-CoA are selectively activated, enhancing histone crotonylation and promoting lineage-specific gene expression.37 Early studies also demonstrated that p300 possesses not only acetyltransferase but also crotonyltransferase activity, with crotonylation sometimes exerting stronger transcriptional activation than acetylation.38 Notably, a recent glioblastoma study showed that GCDH elevates intracellular crotonyl-CoA levels and promotes global histone crotonylation, thereby enhancing immune evasion.25
Building on these observations, our study provides the first evidence in breast cancer that GCDH directly enhances histone crotonylation to regulate metabolic genes. Specifically, we found that GCDH increases crotonylation levels at the GLS1 promoter, facilitating its transcription. The importance of GCDH enzymatic activity was confirmed genetically: a catalytically dead mutant failed to restore GLS1 expression or metabolic function, supporting a model where GCDH-generated crotonyl-CoA contributes to chromatin modification, rather than acting merely structurally. Furthermore, while GLS1 deletion suppressed glutamine metabolism, overexpression of wild-type GCDH, but not the mutant, reversed this metabolic suppression. Collectively, these data establish GLS1 as a key downstream effector in the GCDH-regulated glutaminolytic program. The identified GCDH–crotonylation–GLS1 signaling axis represents a previously unrecognized mechanism governing metabolic plasticity in breast cancer.
Although our data highlight a predominant role for H3K27 crotonylation, crotonylation at other histone sites or on non-histone proteins may also contribute and warrant further investigation. Additionally, directly quantifying intracellular crotonyl-CoA dynamics upon GCDH perturbation would provide deeper mechanistic insight and represents an important direction for future research.
Conclusion
In summary, this study identifies GCDH as a critical metabolic regulator in breast cancer that drives tumor progression by orchestrating glutamine metabolism. We further demonstrate that GCDH promotes glutaminolysis via an epigenetic mechanism: its enzyme activity-dependent enhancement of histone crotonylation at the GLS1 gene locus forms a positive feedback loop, amplifying GLS1 expression and glutamine utilization. These findings not only advance our understanding of how metabolic enzymes can remodel chromatin to influence transcription but also suggest the GCDH–crotonylation–GLS1 axis as a potential therapeutic target for breast cancer.
Acknowledgment
This paper has been uploaded to Preprints.org as a preprint: https://www.preprints.org/manuscript/202506.1950/v1
Funding
Medical and Health Research Project of Zhejiang Province (2024KY1482).
Disclosure
The authors report no conflicts of interest in this work.
References
1. Faubert B, Solmonson A, DeBerardinis RJ. Metabolic reprogramming and cancer progression. Science. 2020;368. doi:10.1126/science.aaw5473
2. Xia L, Oyang L, Lin J, et al. The cancer metabolic reprogramming and immune response. Mol Cancer. 2021;20:28. doi:10.1186/s12943-021-01316-8
3. Ghanavat M, Shahrouzian M, Zayeri ZD, Banihashemi S, Kazemi SM, Saki N. Digging deeper through glucose metabolism and its regulators in cancer and metastasis. Life Sci. 2021;264:118603. doi:10.1016/j.lfs.2020.118603
4. Hay N. Reprogramming glucose metabolism in cancer: can it be exploited for cancer therapy? Nat Rev Cancer. 2016;16:635–649. doi:10.1038/nrc.2016.77
5. Dong S, Li W, Li X, et al. Glucose metabolism and tumour microenvironment in pancreatic cancer: a key link in cancer progression. Frontiers in Immunology. 2022;13:1038650. doi:10.3389/fimmu.2022.1038650
6. Abdel-Wahab AF, Mahmoud W, Al-Harizy RM. Targeting glucose metabolism to suppress cancer progression: prospective of anti-glycolytic cancer therapy. Pharmacol Res. 2019;150:104511. doi:10.1016/j.phrs.2019.104511
7. Lieu EL, Nguyen T, Rhyne S, Kim J. Amino acids in cancer. Experimental & Molecular Medicine. 2020;52:15–30. doi:10.1038/s12276-020-0375-3
8. Sivanand S, Vander Heiden MG. Emerging roles for branched-chain amino acid metabolism in cancer. Cancer Cell. 2020;37:147–156. doi:10.1016/j.ccell.2019.12.011
9. Hensley CT, Wasti AT, DeBerardinis RJ. Glutamine and cancer: cell biology, physiology, and clinical opportunities. J Clin Invest. 2013;123:3678–3684. doi:10.1172/JCI69600
10. Jin J, Byun JK, Choi YK, Park KG. Targeting glutamine metabolism as a therapeutic strategy for cancer. Experimental & Molecular Medicine. 2023;55:706–715. doi:10.1038/s12276-023-00971-9
11. Altman BJ, Stine ZE, Dang CV. From Krebs to clinic: glutamine metabolism to cancer therapy. Nat Rev Cancer. 2016;16:619–634. doi:10.1038/nrc.2016.71
12. Cluntun AA, Lukey MJ, Cerione RA, Locasale JW. Glutamine metabolism in cancer: understanding the heterogeneity. Trends Cancer. 2017;3:169–180. doi:10.1016/j.trecan.2017.01.005
13. Yang WH, Qiu Y, Stamatatos O, Janowitz T, Lukey MJ. Enhancing the efficacy of glutamine metabolism inhibitors in cancer therapy. Trends Cancer. 2021;7:790–804. doi:10.1016/j.trecan.2021.04.003
14. Salovska B, Liu Y. Post-translational modification and phenotype. Proteomics. 2023;23:e2200535. doi:10.1002/pmic.202200535
15. Millán-Zambrano G, Burton A, Bannister AJ, Schneider R. Histone post-translational modifications - cause and consequence of genome function. Nat Rev Genet. 2022;23:563–580. doi:10.1038/s41576-022-00468-7
16. Tan M, Luo H, Lee S, et al. Identification of 67 histone marks and histone lysine crotonylation as a new type of histone modification. Cell. 2011;146:1016–1028. doi:10.1016/j.cell.2011.08.008
17. Brickner JH. Inheritance of epigenetic transcriptional memory through read-write replication of a histone modification. Ann N Y Acad Sci. 2023;1526:50–58. doi:10.1111/nyas.15033
18. Andrés M, García-Gomis D, Ponte I, Suau P, Roque A. Histone H1 post-translational modifications: update and future perspectives. Int J Mol Sci. 2020;21:5941. doi:10.3390/ijms21165941
19. Hu Y, He Z, Li Z, et al. Lactylation: the novel histone modification influence on gene expression, protein function, and disease. Clin Epigenetics. 2024;16:72. doi:10.1186/s13148-024-01682-2
20. Creyghton MP, Cheng AW, Welstead GG, et al. Histone H3K27ac separates active from poised enhancers and predicts developmental state. Proc Natl Acad Sci U S A. 2010;107:21931–21936. doi:10.1073/pnas.1016071107
21. Sun L, Zhang H, Gao P. Metabolic reprogramming and epigenetic modifications on the path to cancer. Protein Cell. 2022;13:877–919. doi:10.1007/s13238-021-00846-7
22. Liu N, Konuma T, Sharma R, et al. Histone H3 lysine 27 crotonylation mediates gene transcriptional repression in chromatin. Mol Cell. 2023;83:2206–2221.e2211. doi:10.1016/j.molcel.2023.05.022
23. Li K, Wang Z. Histone crotonylation-centric gene regulation. Epigenetics Chromatin. 2021;14:10. doi:10.1186/s13072-021-00385-9
24. Fang Y, Xu X, Ding J, et al. Histone crotonylation promotes mesoendodermal commitment of human embryonic stem cells. Cell Stem Cell. 2021;28:748–763.e747. doi:10.1016/j.stem.2020.12.009
25. Lao Y, Cui X, Xu Z, et al. Glutaryl-CoA dehydrogenase suppresses tumor progression and shapes an anti-tumor microenvironment in hepatocellular carcinoma. J Hepatol. 2024;81:847–861. doi:10.1016/j.jhep.2024.05.034
26. Yoo HC, Yu YC, Sung Y, Han JM. Glutamine reliance in cell metabolism. Experimental & Molecular Medicine. 2020;52:1496–1516. doi:10.1038/s12276-020-00504-8
27. Cha YJ, Kim ES, Koo JS. Amino acid transporters and glutamine metabolism in breast cancer. Int J Mol Sci. 2018;19:907. doi:10.3390/ijms19030907
28. Li S, Zeng H, Fan J, et al. Glutamine metabolism in breast cancer and possible therapeutic targets. Biochem Pharmacol. 2023;210:115464. doi:10.1016/j.bcp.2023.115464
29. Damaševičius R. Explainable artificial intelligence methods for breast cancer recognition. Innov Discov. 2024;1(3):25–25. doi:10.53964/id.2024025.
30. Johmura Y, Yamanaka T, Omori S, et al. Senolysis by glutaminolysis inhibition ameliorates various age-associated disorders. Science. 2021;371:265–270. doi:10.1126/science.abb5916
31. Yang L, Venneti S, Nagrath D. Glutaminolysis: a hallmark of cancer metabolism. Annu Rev Biomed Eng. 2017;19:163–194. doi:10.1146/annurev-bioeng-071516-044546
32. Gao M, Monian P, Quadri N, Ramasamy R, Jiang X. Glutaminolysis and transferrin regulate ferroptosis. Mol Cell. 2015;59:298–308. doi:10.1016/j.molcel.2015.06.011
33. Xia X, Cao G, Sun G, et al. GLS1-mediated glutaminolysis unbridled by MALT1 protease promotes psoriasis pathogenesis. J Clin Invest. 2020;130:5180–5196. doi:10.1172/JCI129269
34. Martinez-Moreno JM, Fontecha-Barriuso M, Martín-Sánchez D, et al. The contribution of histone crotonylation to tissue health and disease: focus on kidney health. Frontiers in Pharmacology. 2020;11:393. doi:10.3389/fphar.2020.00393
35. Dang L, Cao X, Zhang T, et al. Nuclear condensation of CDYL links histone crotonylation and cystogenesis in autosomal dominant polycystic kidney disease. J Am Soc Nephrol. 2022;33:1708–1725. doi:10.1681/ASN.2021111425
36. Wu J, Fu T, Bo L, Lei S. Inflammatory markers were associated with the comorbidity patterns. Clin Mol Epidemiol. 2025;2:6. doi:10.53964/cme.2025006
37. Sabari BR, Tang Z, Huang H, et al. Intracellular crotonyl-CoA stimulates transcription through p300-catalyzed histone crotonylation. Mol Cell. 2015;58:203–215. doi:10.1016/j.molcel.2015.02.029
38. Sabari BR, Tang Z, Huang H, et al. Intracellular crotonyl-CoA stimulates transcription through p300-catalyzed histone crotonylation. Mol Cell. 2018;69(3):533. doi:10.1016/j.molcel.2018.01.013
 © 2025 The Author(s). This work is published and licensed by Dove Medical Press Limited. The
full terms of this license are available at https://www.dovepress.com/terms
and incorporate the Creative Commons Attribution
- Non Commercial (unported, 4.0) License.
By accessing the work you hereby accept the Terms. Non-commercial uses of the work are permitted
without any further permission from Dove Medical Press Limited, provided the work is properly
attributed. For permission for commercial use of this work, please see paragraphs 4.2 and 5 of our Terms.
© 2025 The Author(s). This work is published and licensed by Dove Medical Press Limited. The
full terms of this license are available at https://www.dovepress.com/terms
and incorporate the Creative Commons Attribution
- Non Commercial (unported, 4.0) License.
By accessing the work you hereby accept the Terms. Non-commercial uses of the work are permitted
without any further permission from Dove Medical Press Limited, provided the work is properly
attributed. For permission for commercial use of this work, please see paragraphs 4.2 and 5 of our Terms.
Recommended articles
Molecular Insights into Phytochemicals Mediated Epigenetic Regulation in Preclinical Models of Breast Cancer
Pandey P, Alkhathami AG, Saeed M, Alshaghdali K, Kumar S, Tallei TE, Bae H, Park MN, Kumar G, Kim B, Khan F
Drug Design, Development and Therapy 2025, 19:10589-10606
Published Date: 27 November 2025

Emerging Targeted and Multimodal Therapeutic Strategies in Breast Cancer: A Comprehensive Review
Wu W, He Y, Zhang C
Breast Cancer: Targets and Therapy 2026, 18:575936
Published Date: 7 January 2026