Back to Journals » Clinical, Cosmetic and Investigational Dermatology » Volume 19
Exploring the Causal Relationship and Potential Mediating Mechanisms Between Obesity and Facial Aging: A Two-Sample, Multivariable and Mediation Mendelian Randomization Study
Authors Lian J, Zhang Z, Yang W, Pan L, Pan X, Shao Y
Received 7 September 2025
Accepted for publication 21 December 2025
Published 17 January 2026 Volume 2026:19 565342
DOI https://doi.org/10.2147/CCID.S565342
Checked for plagiarism Yes
Review by Single anonymous peer review
Peer reviewer comments 2
Editor who approved publication: Dr Jeffrey Weinberg
Jiaqi Lian,1,* Zhiyun Zhang,1,* Wenzhuo Yang,2 Lin Pan,1 Xuyang Pan,1 Ying Shao1
1Department of Plastic and Reconstructive Surgery, The First Hospital of Jilin University, Changchun, Jilin, People’s Republic of China; 2Department of Neurosurgery, Cancer Hospital of Sun Yat sen University, Guangzhou, Guangdong, People’s Republic of China
*These authors contributed equally to this work
Correspondence: Ying Shao, Department of Plastic and Reconstructive Surgery, The First Hospital of Jilin University, Changchun, Jilin, People’s Republic of China, Email [email protected]
Purpose: Obesity is well established as a key contributor to multiple age-related diseases; however, its impact on facial aging (FA) remains equivocal. We aimed to elucidate the causal effects of various obesity phenotypes on FA with gender- and age-specific attention, as well as determine the potential mediating mechanisms in these relationships.
Patients and Methods: A two-sample, multivariable, and mediation MR analysis was employed. BMI, representing general obesity, and BMI-adjusted WHR, representing central obesity, were derived from the most comprehensive meta-analysis GWAS conducted by the GIANT consortium. Additionally, we utilized sex- and/or age-stratified GWAS summary statistics for both BMI and BMI-adjusted WHR. We performed a two-step MR analysis incorporating 44 potential mediators to elucidate potential mediating pathways underlying this causal relationship. Sensitivity and reverse MR analyses were performed to assess the findings’ robustness rigorously.
Results: MR analyses indicated that higher genetically predicted BMI was associated with accelerated FA, though this effect was not observed in women under 50. As for WHR not stratified by sex and age, no association between WHR and FA was found. However, in men over 50, higher genetically predicted WHR was significantly associated with an increased risk of FA. Furthermore, several factors, including myocardial infarction, smoking, and premature menarche, were identified as independent risk factors for FA, independent of high BMI. Myocardial infarction, daily smoking, circulating levels of RAGEs, ischemic stroke, and multiple sclerosis were also found to mediate the causal relationship between BMI and FA partially.
Conclusion: Our study reveals distinct and significant variations in the effects of different obesity phenotypes on the acceleration of FA, with these effects exhibiting gender- and age-specific patterns. The findings underscore the critical importance of weight management as a potential intervention for mitigating FA. Furthermore, this research contributes to a deeper understanding of the etiology of FA.
Plain Language Summary: Established causal relationship between obesity and accelerated facial aging.Identified gender- and age-specific effects of BMI and WHR on facial aging risk.Uncovered potential mediators like RAGEs and smoking in BMI-FA link.
Keywords: obesity, facial aging, body mass index, waist-to-hip ratio, mediation analysis, Mendelian randomization
Introduction
Facial aging (FA) is a multifaceted process driven by both intrinsic biological aging and extrinsic environmental influences. As intrinsic biological aging advances, there is a marked decline in dermal elasticity and texture, coupled with the progressive atrophy of bone, muscle, and adipose tissue in the maxillofacial region, culminating in an irreversible aged appearance. Concurrently, chronic exposure to ultraviolet (UV) radiation and deleterious lifestyle choices, such as smoking, have been implicated in the acceleration of FA.1,2 The manifestation of FA can profoundly affect an individual’s psychological well-being, potentially instigating or aggravating issues such as diminished self-esteem and eliciting a spectrum of adverse emotional responses, including anger and sadness.3 As a result, there is a huge effort to pursue facial rejuvenation, which also imposes substantial financial burdens on individuals and exacerbates the strain on healthcare systems.4
Obesity has escalated to pandemic proportions and is recognized as a significant etiological factor in age-related pathologies across various organs and systems;5 however, its influence on FA remains equivocal. Individuals with obesity often present with a more youthful facial appearance. Several studies have also observed that individuals with higher body mass index (BMI) tend to exhibit a lower perceived facial age and fewer wrinkles, a phenomenon likely attributable to increased facial adiposity.6 This excess fat may smooth the skin by outwardly stretching it, mimicking the rejuvenating effects achieved through facial fillers in cosmetic procedures.4 However, Gunn et al reported opposing results, with higher BMI associated with higher facial age after adjusting for wrinkle grades.7 The conclusions of current studies are constrained by the methodological limitations inherent to observational designs, including small sample sizes and residual confounding. Consequently, the relationship between obesity and FA remains inconclusive.
Randomized controlled trials (RCTs) are the gold standard for establishing causality, yet their implementation is often hindered by substantial financial, temporal, and human resource constraints, as well as ethical considerations. Mendelian randomization (MR), leveraging genetic variants as instrumental variables, offers an alternative approach to infer causal relationships between exposures and outcomes, mitigating the influence of confounding, measurement error, and reverse causation.8,9 In light of these challenges, the present study employed a range of analytical methodologies, including two-sample, multivariable, and mediation MR, to elucidate for the first time the differential effects of various obesity phenotypes on FA and gender- and age-specific patterns in these effects. Furthermore, prior MR studies on obesity-FA causal relationships and mediators focused solely on a limited set of variables (HbA1C, CHD, IS), with some (eg, HbA1C) relying on small-sample GWAS. To address these limitations, we used larger-sample GWAS and 44 factors across nine categories (cardiovascular, immune, nervous, endocrine, skin-related, plus lifestyle/biological aging markers) to explore mediating mechanisms of this causal association.
Methods
Data Sources
Study Exposure
General and central obesity were quantified using BMI and WHR, respectively. The GWAS summary statistics employed encompassed 322,154 and 212,244 individuals of European ancestry, respectively.10,11 Additionally, GWAS summary statistics stratified by sex (male and female) and by age group (above and below 50 years) were also used in this study. The sample sizes for these stratified categories varied between 50,095 and 171,977 individuals, also of European ancestry.12 All datasets were obtained from the GIANT consortium (Table 1).
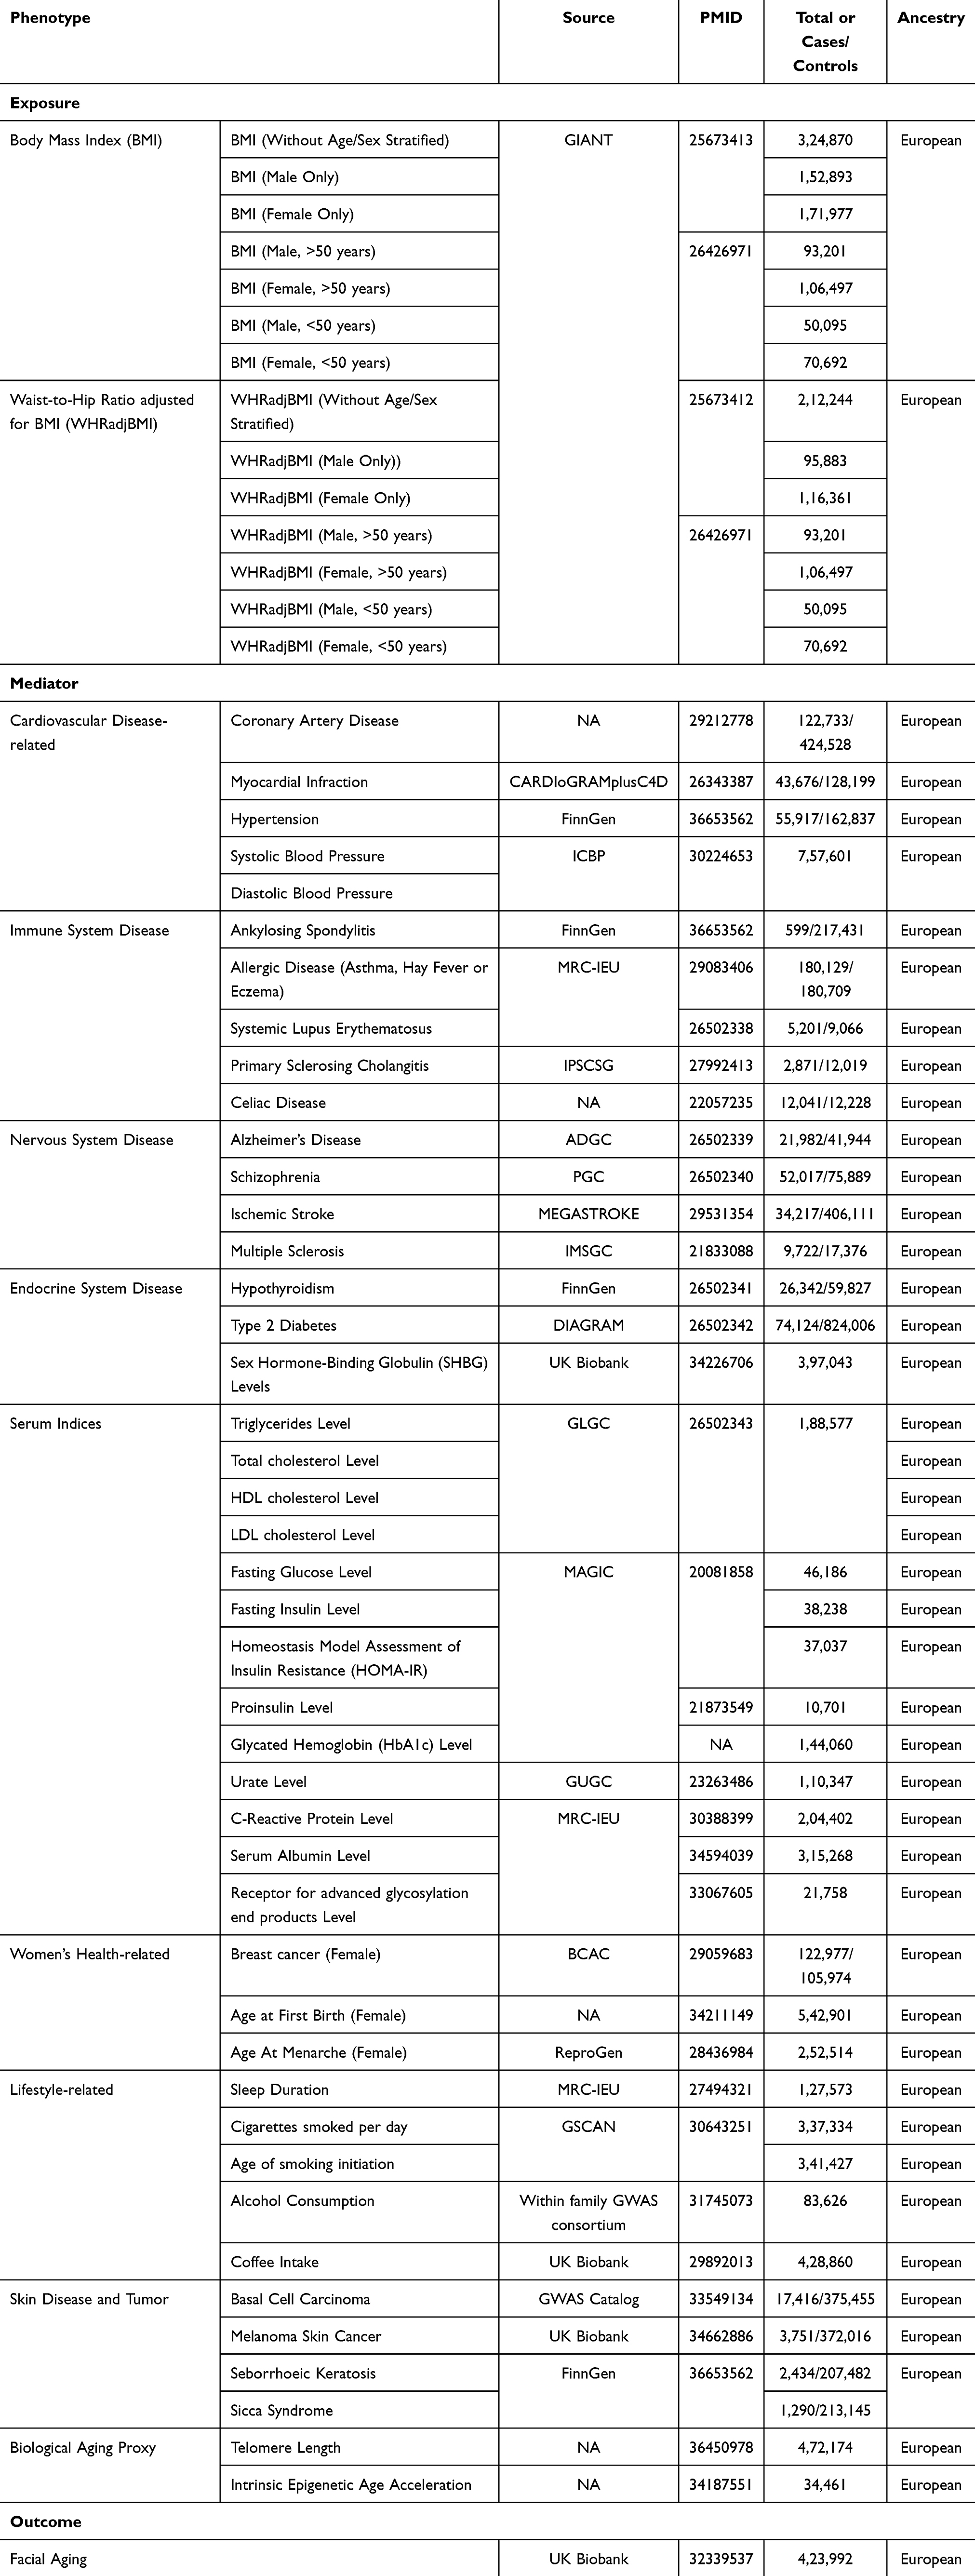 |
Table 1 Data Sources Used in the Analyses for the Current Study |
Study Outcome
The GWAS summary statistics data for FA was obtained from the UK Biobank (UKB). As the most well-known and open biobank in the world, the UKB has collected standardized blood, urine, and saliva samples, as well as comprehensive demographic, socioeconomic, lifestyle, and health information from 500,000 participants across the UK since its establishment in 2006. FA was evaluated through non-subjective perceived age, which was determined via a questionnaire. The findings indicated that out of 419,992 respondents, 8,630 reported appearing older than their biological age, 103,300 reported appearing their biological age, and 312,062 reported appearing younger than their biological age. Participants were categorized as follows: 1 if they reported looking younger, 0 if they reported looking older, and 0.5 if they reported looking their age. These assessments were conducted by third-party observers, independent of the participants and researchers, unaware of the participants’ actual ages. Researchers coded participants’ FAs based on their perceived and actual ages. It utilized a mixed linear model analysis, which considers covariates such as age, sex, and study centre and accounts for relatedness. FA was identified as an ordered categorical variable. Subsequently, statistics on the linear scale were transformed into log odds ratios using a Taylor expansion series (Table 1).13
Other Data Sources
A comprehensive summary of additional data sources is provided in Supplementary Table 1. These sources encompass a diverse array of diseases: coronary artery disease, myocardial infarction, hypertension, ankylosing spondylitis, hypothyroidism, seborrhoeic keratosis, sicca syndrome, systemic lupus erythematosus, alzheimer’s disease, schizophrenia, type 2 diabetes, ischemic stroke, melanoma skin cancer, and basal cell carcinoma; biomarkers: systolic and diastolic blood pressure, c-reactive protein level, serum albumin level, receptor for advanced glycosylation end products (RAGEs) level, lipid levels (including triglycerides, total cholesterol, HDL cholesterol, LDL cholesterol), fasting blood glucose level, fasting insulin level, homeostasis model assessment of insulin resistance (HOMA-IR), proinsulin level, glycated hemoglobin (HbA1c) level, urate levels, sex hormone-binding globulin (SHBG) levels, telomere length, intrinsic epigenetic age acceleration; other phenotypes or traits: sleep duration, age at first birth, age at menarche, cigarettes per day, age of smoking initiation, alcohol consumption, coffee intake. Sample sizes varied from 10,701 to 898,130, with all participants being of European ancestry.
MR Design
MR should be conducted under three fundamental premises: (1) genetic variations are strongly related to exposure; (2) genetic variations are independent of any potential confounders; and (3) genetic variations are independent of the outcome, except by means of exposure (Figure 1). In addition, other assumptions should be met, which include the linearity and absence of statistical interactions.8,14 We conducted a two-sample, multivariable, and mediation MR analysis leveraging data from well-established large cohorts and consortia. Our investigation primarily focused on assessing the causal effect of obesity on FA and discerning whether general and central obesity exert differential effects. Besides, gender- and age-specific patterns in these effects were also studied. In our mediation MR analysis, we incorporated factors that, although not identified as confounders following rigorous confounder screening, could plausibly serve as mediators in the obesity-induced FA pathway due to the similarity between confounding and mediating effects in causal inference.15 Additionally, we included factors previously reported to have a causal association with FA further to elucidate potential mediating mechanisms (Table 1).
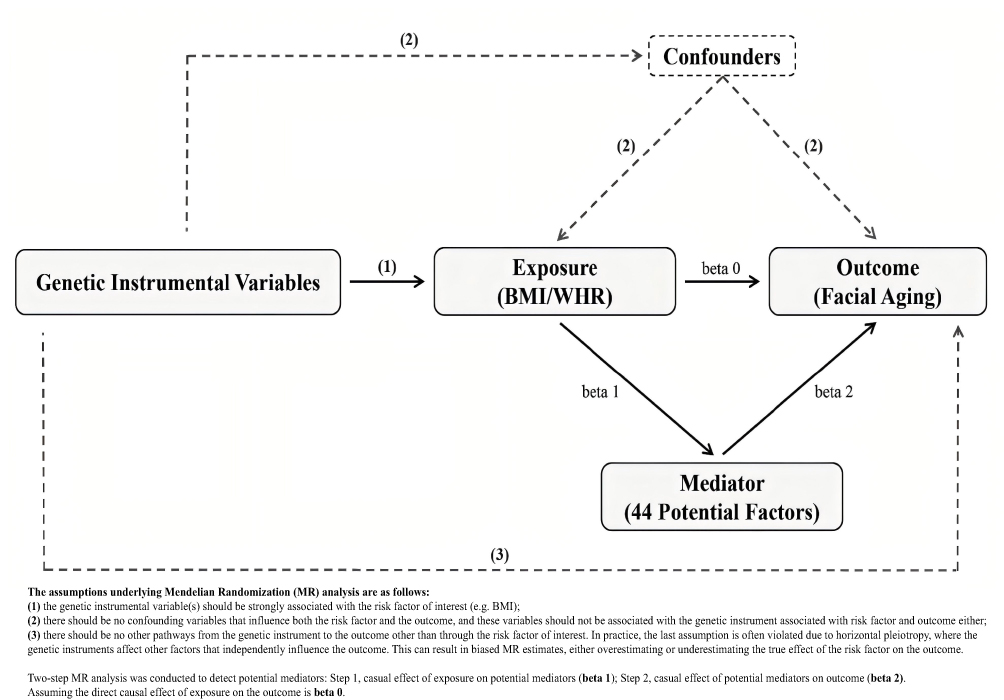 |
Figure 1 Summary of Mendelian Randomization and Its Assumptions. |
Instrumental Variables Selection
To identify enough SNPs (number > 3) in common between exposure and outcome, SNPs with genome-wide suggestive significance (P-value < 5 × 10⁻⁸) were selected. None of the instrumental SNPs were in linkage disequilibrium (LD), as this situation may cause a misleading outcome. To achieve this, a clumping process was employed, wherein SNPs were clumped based on LD in the given genome region. Independent SNPs were identified through the clumping process, using a threshold of r2 < 0.001 and a window size of 10,000 kb. The calculation of R2 and F-statistics utilized the following formulas: R2 = 2 × (1-EAF) × EAF × BETA2 and F = (R2/1-R2) × (N-K-1/K), where EAF denotes the effect allele frequency of the SNP, BETA represents the effect size of the SNP on the phenotype, N stands for the sample size in the GWAS study, and K denotes the number of SNPs selected for the Mendelian randomization analysis after filtering. When F-statistics <10, we deemed the genetic variation used as weak IV, possibly introducing some bias into the results. Hence, SNPs with F-statistics <10 were excluded.16
Statistical Analysis
We primarily employed the fixed effects inverse variance weighted (IVW-FE) method in two-sample MR analysis to explore the causal associations between different types of obesity (proxy by BMI and WHR, respectively) and FA. Furthermore, we applied the weighted median, MR-Egger, and MR-PRESSO methods for additional analyses. The Egger-Intercept method and MR-PRESSO distortion test were used for sensitivity analysis to assess the potential pleiotropic effects of the included SNPs as genetic instrumental variables. This evaluation aimed to detect horizontal pleiotropy, which could bias causal estimates in the main MR analysis. A lack of horizontal pleiotropy was inferred when the P-value > 0.05. Heterogeneity was assessed using Cochran’s Q test and the MR-PRESSO global test. If heterogeneity was detected (P-value < 0.05), the multiplicative random effects IVW (IVW-MRE) should be predominantly used to evaluate causal effects. Additionally, a “leave-one-out” analysis was performed to assess the impact of each SNP on the results. By sequentially excluding each SNP and recalculating the combined effect of the remaining SNPs, we evaluated the suitability of each SNP as a genetic instrumental variable by comparing these effects with previous MR analysis results. Forest, scatter, and funnel plots were also generated to aid in sensitivity analysis (Supplementary Figures 1–52).8,17–19
Although various methods have been employed for sensitivity analysis, we also utilized Phenoscanner V2 to conduct confounding analysis on the SNPs selected for MR analysis.20 No apparent confounding factors were identified below the threshold of P-value < 5 × 10⁻⁸. Hence, we explored traits significantly associated with P-value < 1 × 10⁻⁵. Our multivariable MR analysis employed the IVW method to adjust for multiple factors selected by Phenoscanner V2, within a comprehensive model. Given the nature of multiple comparisons, Bonferroni correction was applied to rectify the outcomes. The critical P-value for correction is contingent upon the number of exposures and outcomes integrated into the model, calculated as critical P-value = 0.05/E/C (where E and C represent the number of exposures and outcomes, respectively). If potential confounding bias is identified after multivariable MR analysis, genetic instrumental variables (SNPs) associated with the confounding factors should be removed. Then, the causal effect needs to be recalculated. If no confounding bias exists, these factors can be included in the following mediation analysis.21
We conducted a mediation analysis (two-step MR analysis), to explore the mediators influencing the causal relationship between exposure and outcome. The method was as follows: Step 1, to extract SNPs from the exposure GWAS, filtering out SNPs in linkage disequilibrium, and then to extract remaining SNPs from the GWAS of mediators. Then, the causal effect (beta 1) of exposure on the mediators was calculated. Step 2 is to use the same methodology to calculate the causal effect (beta 2) of the mediator on the outcome. Assuming the direct causal effect of exposure on the outcome is beta 0. (1) If the P-values for beta 0, beta1, and beta2 were all significant, and there is no evidence of reverse causal relationships, this indicates a causal relationship between the exposure and outcome, potentially mediated in part by the mediators. The proportion of mediation effects was estimated using a specific formula (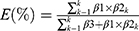 ). In this formula, regression coefficient β1 represents the MR effect of the exposure on mediator k, β2 represents the MR effect of mediator k on the outcome adjusted for genetically determined exposure, and β3 represents the MR effect of exposure on the outcome adjusted for genetically determined mediator k. The indirect causal effect of exposure on the outcome was calculated through β1× β2. All regression coefficients were obtained through the inverse-variance weighted (IVW) method, assuming no correlation between the mediators. (2) if beta 0 shows significant differences but at least one of beta 1 or 2 is insignificant, this indicates that in the causal relationship between exposure and outcome, this mediator variable does not mediate the relationship. (3) If beta 0 does not exhibit significant differences, while both beta 1 and beta 2 are significant, it can be inferred that this mediator completely mediates the relationship between exposure and outcome22(Figure 1).
In this study, we utilized R software (version 4.2.3). Various R packages and their associated functions were employed, including TwoSampleMR, MVMR, MRPRESSO, VariantAnnotation, gwasglue, MendelianRandomization, ieugwasr, data.table, and ggplot2.
Results
Instrumental Variables Selection
In this study, the genetic instrumental variables employed exhibited proportions of variance (R2) ranging from 0.2% (for Melanoma Skin Cancer) to 35.3% (for SHBG Levels). Furthermore, the F-statistics for all instrumental variables (IVs) used for exposure, outcome, and other phenotypes exceeded 10 (range: 13.434 for Primary Sclerosing Cholangitis to 1841.894 for Ankylosing Spondylitis), indicating no weak instrument bias in the genetic IVs employed in this study, as detailed in the Supplementary Table 2.
Causal Association of BMI with FA
Without Age/Gender Stratified
A robust causal relationship between genetically predicted BMI and FA was identified (IVW-MRE: OR = 1.054, 95% CI = 1.040–1.069, P-value = 2.515E-14) (Figure 2 and Supplementary Table 3). While horizontal pleiotropy did not impact the causal inference, some degree of heterogeneity was observed (Supplementary Table 4).
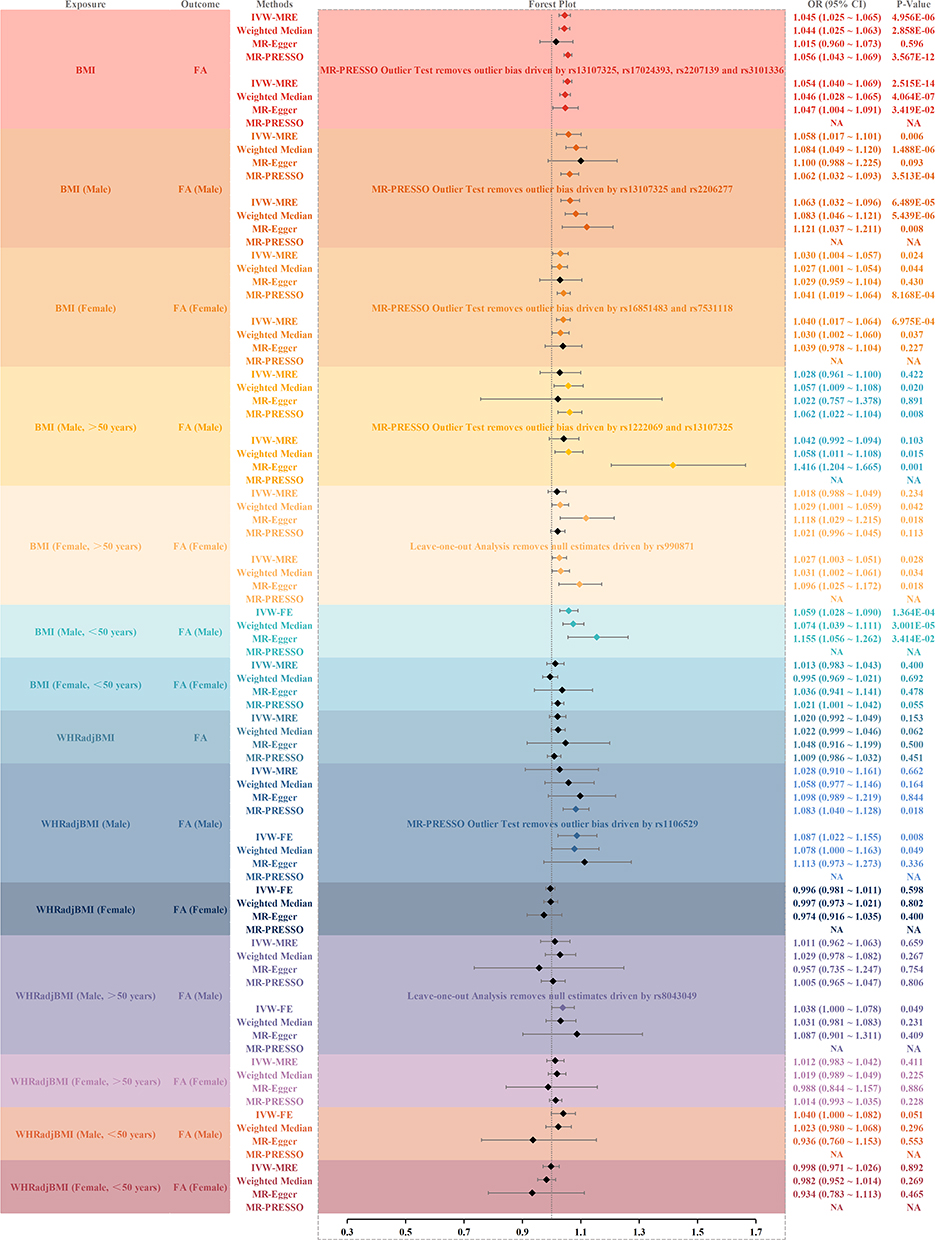 |
Figure 2 Result of Univariate Analysis of Mendelian Randomization estimates of BMI and WHR on Facial Aging. Abbreviations: BMI, Body Mass Index; WHRadjBMI, WHR adjusted for BMI; FA, Facial Aging; IVW-MRE, Inverse Variance Weighted (multiplicative random effects); IVW-FE, Inverse Variance Weighted (fixed effects); MR-PRESSO, Mendelian Randomization Pleiotropy Residual Sum and Outlier. |
Gender Stratified
The analysis revealed a significant causal association between genetically predicted BMI and FA in both males and females (IVW-MRE: Males: OR = 1.063, 95% CI = 1.032–1.096, P-value = 6.489E-05; Females: OR = 1.040, 95% CI = 1.017–1.064, P-value = 6.975E-04) (Figure 2 and Supplementary Table 3). Although horizontal pleiotropy did not affect these results, some degree of heterogeneity was observed (Supplementary Table 4).
Gender and Age Stratified
Among males over 50 years of age, the IVW-MRE did not indicate a statistically significant causal relationship between genetically predicted BMI and FA; however, the Weighted Median and MR-Egger methods demonstrated significance, consistent with the IVW-MRE findings (IVW-MRE: OR = 1.042, 95% CI = 0.992–1.094, P-value = 0.103; Weighted Median: OR = 1.058, 95% CI = 1.011–1.108, P-value = 0.015; MR-Egger: OR = 1.416, 95% CI = 1.204–1.665, P-value = 0.001). In females over 50 years, a significant causal relationship was also observed (IVW-MRE: OR = 1.027, 95% CI = 1.003–1.051, P-value = 0.028). For individuals under 50 years, the only significant finding was in males, where a genetically predicted increase in BMI heightened the risk of FA (IVW-FE: OR = 1.059, 95% CI = 1.028–1.090, P-value = 1.364E-04) (Figure 2 and Supplementary Table 3). These causal associations remained robust against horizontal pleiotropy, with heterogeneity influencing the results only in males under 50 years (Supplementary Table 4). None of the above causal inferences are affected by reverse causation (Supplementary Table 5).
Causal Association of WHR with FA
Without Age/Gender Stratified
IVW, weighted median, MR-Egger, and MR-PRESSO methods demonstrated no evidence of a causal relationship between WHR and FA (Figure 2 and Supplementary Table 3).
Gender Stratified
We identified a significant causal association between genetically predicted WHR and FA exclusively in males (IVW-FE: OR = 1.087, 95% CI = 1.022–1.155, P-value = 0.008) Figure 2 and Supplementary Table 3). Sensitivity analyses confirmed that this finding was robust, with no indication of horizontal pleiotropy or heterogeneity (Supplementary Table 4).
Gender and Age Stratified
A significant causal relationship was observed only in the subgroup of males over 50 years, where higher genetically predicted WHR was associated with an increased risk of FA (IVW-FE: OR = 1.038, 95% CI = 1.000–1.078, P-value = 0.049) (Figure 2 and Supplementary Table 3). Sensitivity analyses supported the reliability of this association, with no evidence of horizontal pleiotropy or heterogeneity (Supplementary Table 4). None of the above causal inferences are affected by reverse causation (Supplementary Table 5).
Confounding Analysis
We conducted a comprehensive confounding analysis on the selected BMI-associated SNPs (Without Age/Gender Stratified), utilizing the Phenoscanner V2 platform. This analysis identified 31 potential confounders, which were systematically categorized into seven principal groups: cardiovascular disease-related, immune system-related, nervous system-related, endocrine system-related, serum indices, women’s health-related, and lifestyle-related factors (Figure 3 and Supplementary Table 1). To evaluate the potential influence of these confounding factors on the causal relationship between BMI and FA, we performed a multivariable Mendelian Randomization (MR) analysis. Our findings demonstrate that none of the identified confounders significantly modulated the causal effect of BMI on FA (IVW: OR = 1.058, 95% CI = 1.023–1.094, P-value = 1.046E-03 < 1.560E-03). Consequently, these 31 factors were subsequently considered as potential mediators in our mediation analysis (Supplementary Table 6).
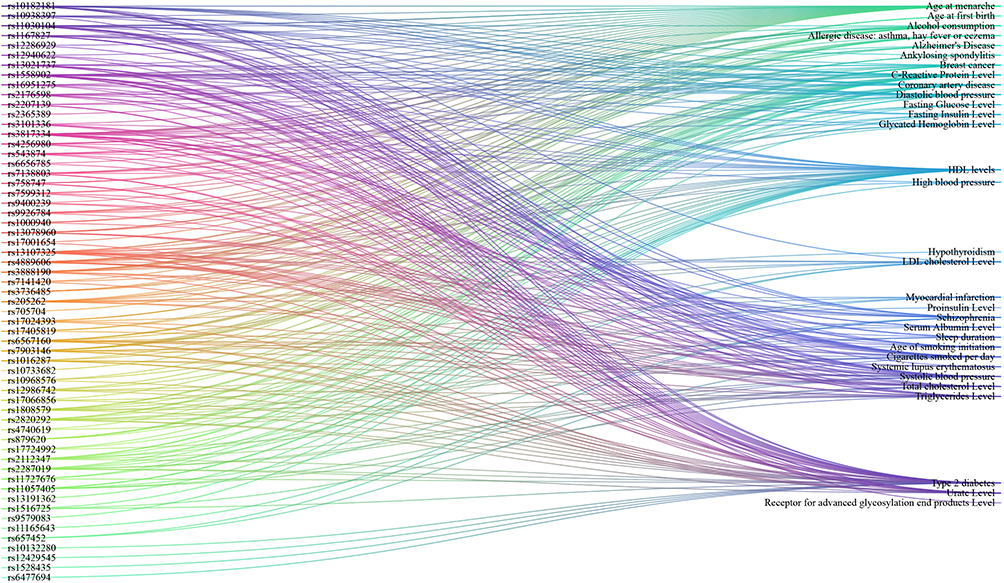 |
Figure 3 Result of Confounding Analysis. |
Mediation MR Analysis
Two-Sample MR Analysis
Potential Mediators on FA
We employed two-sample MR to interrogate the causal relationships between 44 potential mediators—comprising 31 factors identified through confounding analyses and 13 derived from extant literature—across nine categories, and the risk of FA (Table 1). The analysis identified significant causal effects of genetically predicted myocardial infarction, primary sclerosing cholangitis, celiac disease, ischemic stroke, multiple sclerosis, elevated SHBG levels, cigarette consumption, high coffee intake, basal cell carcinoma, melanoma, and sicca syndrome, all of which were associated with an elevated risk of FA. Additionally, genetically predicted lower levels of urate and RAGEs, earlier age at menarche in females, and shorter telomere length were also linked to an increased FA risk. Conversely, there was no causal relationship between HbA1c and FA, although their causal relationship was reported in earlier MR Studies (Figure 4 and Supplementary Table 3). Moreover, our analysis did not reveal any evidence of reverse causality (Supplementary Table 5).
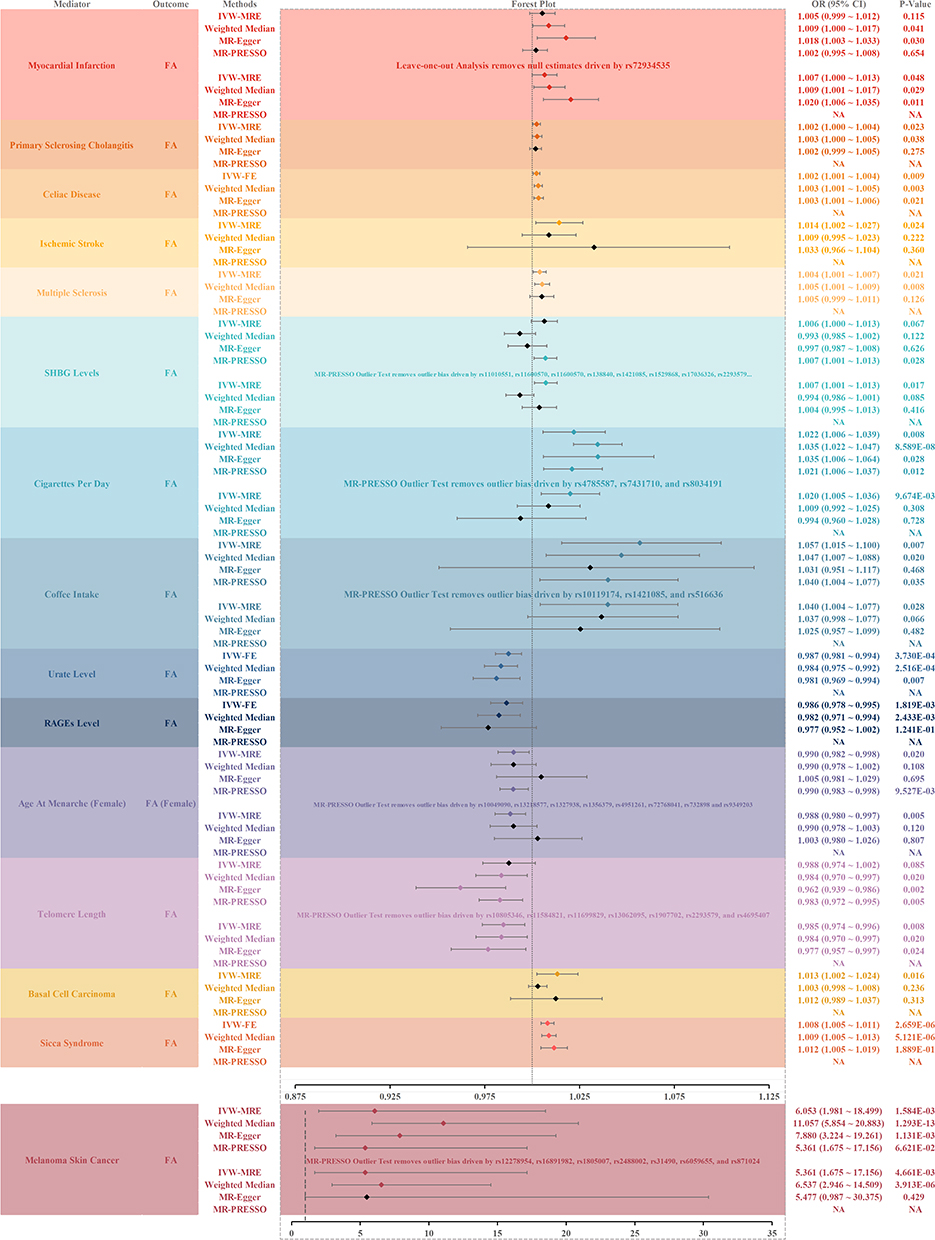 |
Figure 4 Result of Univariate Analysis of Mendelian Randomization estimates of Potential Mediators on Facial Aging. Abbreviations: SHBG, Sex Hormone-Binding Globulin; RAGEs, Receptor for Advanced Glycosylation End Product; FA, Facial Aging; IVW-MRE, Inverse Variance Weighted (multiplicative random effects); IVW-FE, Inverse Variance Weighted (fixedeffects); MR-PRESSO, Mendelian Randomization Pleiotropy Residual Sum and Outlier. |
BMI on Potential Mediators
Our findings demonstrate a causal relationship between genetically predicted BMI and several factors, including myocardial infarction, ischemic stroke, multiple sclerosis, age at menarche (female), cigarette consumption, urate levels, RAGEs levels, SHBG levels, coffee intake, and melanoma (Figure 5 and Supplementary Table 3). Furthermore, we detected evidence of a reverse causal relationship between BMI and age at menarche (female), urate levels, SHBG levels, and coffee intake (Supplementary Table 5).
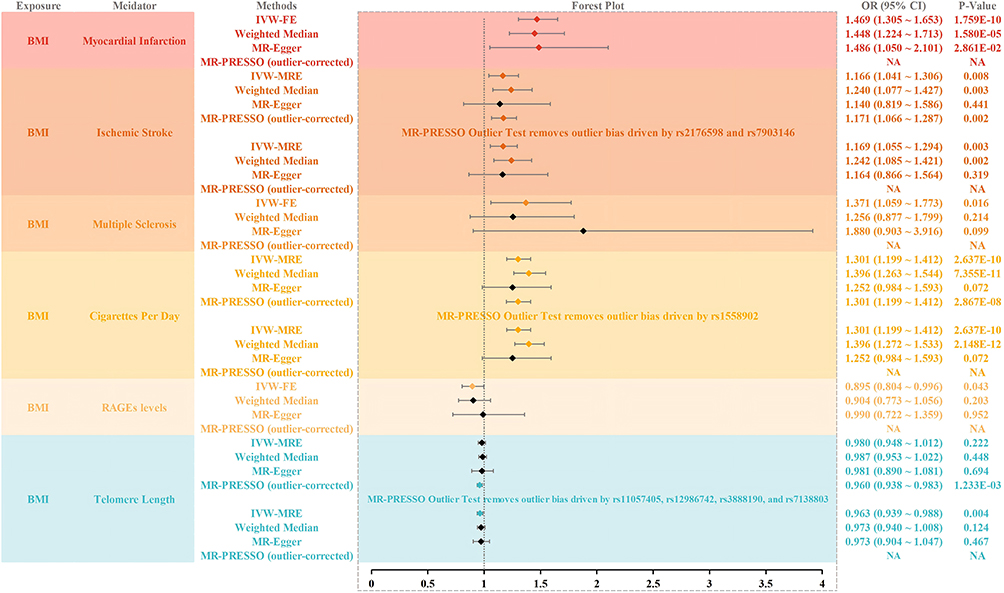 |
Figure 5 Result of Univariate Analysis of Mendelian Randomization estimates of BMI on Potential Mediators. Abbreviations: BMI, Body Mass Index; RAGEs, Receptor for Advanced Glycosylation End Product; IVW-MRE, Inverse Variance Weighted (multiplicative random effects); IVW-FE, Inverse Variance Weighted (fixed effects); MR-PRESSO, Mendelian Randomization Pleiotropy Residual Sum and Outlier. |
Multivariable MR Analysis
Building upon the preceding analyses, we further investigated the mediating roles of myocardial infarction, daily cigarette consumption, RAGEs levels, ischemic stroke, and multiple sclerosis in the causal pathway linking BMI to facial aging. Our findings reveal that the effect of BMI on facial aging is partially mediated by these factors, with myocardial infarction, daily cigarette consumption, RAGEs levels, ischemic stroke, and multiple sclerosis accounting for 7.456% (95% CI: 0.513% ~ 13.252%), 15.660% (95% CI: 6.552% ~ 23.548%), 4.702% (95% CI: 0.007% ~ 31.302%), 5.857% (95% CI: 0.540% ~ 12.525%), and 2.725% (95% CI: 0.064% ~ 6.675%) of the total causal effect, respectively (Figure 6 and Supplementary Table 7).
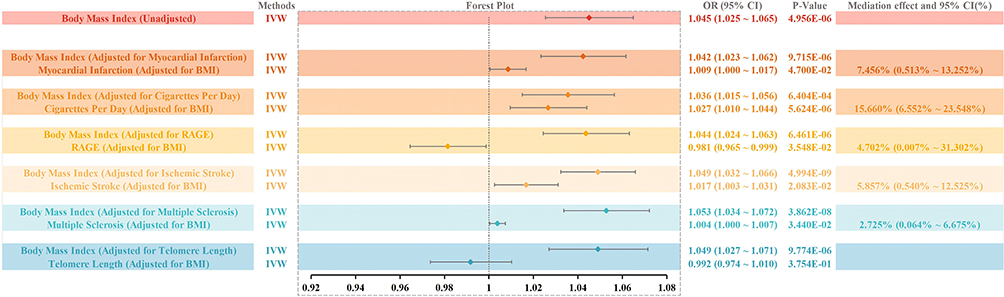 |
Figure 6 Result of Mediation Analysis. |
Discussion
In this study, utilizing the largest sample of GWAS data, we primarily employed two-sample, multivariable, and mediation MR analysis to investigate the relationship between obesity and FA. Our findings revealed that: (1) Genetically predicted higher BMI, indicative of general obesity, was associated with an increased risk of accelerated FA. This association was further corroborated in both sex groups when utilizing sex-stratified GWAS datasets. Notably, when using sex- and age-stratified GWAS summary statistics of BMI, only in women under 50, there was no causal relationship between genetically predicted BMI and FA; (2) A causal relationship between genetically predicted BMI-adjusted WHR, indicative of central obesity, and FA was not observed when using GWAS data of BMI-adjusted WHR not stratified by sex and/or age. However, when utilizing sex-stratified GWAS datasets, a higher genetically predicted WHR was associated with an increased risk of accelerated FA in males. Upon further utilizing sex- and age-stratified GWAS datasets, this association was confined to men over the age of 50; (3) Regardless of obesity or not, genetically predicted myocardial infarction, primary sclerosing cholangitis, celiac disease, ischemic stroke, multiple sclerosis, basal cell carcinoma, melanoma, sicca syndrome, elevated serum levels of SHBG and RAGEs, reduced urate levels, earlier age of menarche in females, daily smoking, high coffee intake, and shorter TL were identified as risk factors for FA. Contrary to previous reports, we did not find a causal relationship between HbA1c levels and FA;21 (4) Myocardial infarction, daily smoking, circulating RAGEs levels, ischemic stroke, and multiple sclerosis might partially mediate the association of BMI on FA.
FA serves as a significant extrinsic manifestation of the aging process.23 With advancing biological age, there is a progressive reduction in bone density, muscle mass, and fat volume within the maxillofacial region, contributing to FA manifestations. Beyond the inherent, irreversible biological aging process, environmental factors such as UV radiation and smoking have been established as external risk factors that exacerbate FA.1,2 Although obesity is strongly associated with various age-related diseases, including coronary heart disease, type 2 diabetes, and non-alcoholic fatty liver disease, etc, it is noteworthy that metabolic disturbances associated with obesity resemble those observed in normal aging, suggesting that obesity may act as an accelerant of the aging process.24,25 However, the impact of obesity on FA remains contentious. Obesity imparts a younger appearance to the face (lower perceived age) by increasing facial adiposity, which can reduce the appearance of wrinkles through the mechanical expansion of the skin.7 Nevertheless, the deleterious effects of obesity on FA may manifest subtly over an extended period. Research has demonstrated that obesity may diminish the water content of the stratum corneum, elevate transepidermal water loss (TEWL), reduce dermal collagen density, thin the dermis, and increase the accumulation of AGEs in the skin, all of which collectively contribute to premature facial skin aging.26 Furthermore, the gradual accumulation of facial fat due to obesity can eventually lead to skin sagging, which is commonly perceived as an aged appearance.7,27 Thus, the onset of FA associated with obesity may not be immediate but rather a protracted process. MR is a robust method for inferring causality based on genetic variations. By leveraging genetic variants, MR effectively mitigates the influence of confounding factors and provides insights into the lifelong effects of risk factors on outcomes. This method is particularly suitable for investigating the impact of obesity on FA.8
Employing Mendelian randomization, we established that genetically predicted elevation in body mass index (BMI), a marker of general obesity, is causally linked to accelerated facial aging (FA), thereby corroborating earlier epidemiological findings.7 The underlying pathophysiology may involve obesity-driven systemic inflammation, oxidative stress, and accumulation of advanced glycation end-products (AGEs), which collectively impair dermal collagen integrity and skin elasticity, culminating in premature aging.7,28 Our study further delineates the sex- and age-stratified effects of obesity on FA. While general obesity accelerated FA across all male age groups, its influence in females was primarily evident after age 50, suggesting a sexually dimorphic pattern. These observations align with anatomical studies indicating that males exhibit greater susceptibility to periocular aging—such as infraorbital hollowing and eyelid ptosis—potentially due to structural differences in midfacial fat distribution and bone support.2,7,29 Additionally, behavioral factors including higher rates of smoking and ultraviolet exposure among men may further exacerbate these morphological changes. In contrast, no significant association was observed between BMI-adjusted waist-to-hip ratio (WHR)—an indicator of central adiposity—and FA in the main analysis. However, stratified analyses revealed a specific risk among older males (>50 years), implicating visceral adipose tissue (VAT) as a potential effector. VAT functions as an active endocrine organ, secreting pro-inflammatory adipokines (eg, IL-6, TNF-α) and mediators such as progranulin (PGRN), which promote tissue remodeling and systemic aging. The age-dependent accumulation of VAT in men may thus underpin the subgroup-specific effect of WHR on FA.30 Overall, general obesity exerted a more consistent influence on FA than central obesity, likely due to its broader impact on subcutaneous facial fat deposition, which may compromise skin biomechanics and facilitate sagging.28,31 Moreover, male participants demonstrated heightened FA susceptibility relative to females, particularly in later life.
As no significant causal relationship between genetically predicted WHR adjusted by BMI and FA was observed in our unstratified analysis, we focused on BMI-related SNPs, GWAS, and disease traits, identifying several potential confounders for inclusion in the multivariate models. This approach provided deeper insights into the causal pathways and potential mediating mechanisms, given the often overlapping nature of confounding and mediation in causal inference.15 Our multivariable MR analysis revealed a robust causal association between elevated BMI and increased risk of FA, which remained consistent even after adjusting for 31 potential confounders. These confounders were then incorporated into the mediation analyses, from which we selected 13 factors strongly associated with FA progression, based on prior research,21,32–36 to explore their mediating roles in the causal relationship between BMI and FA. Obesity is a well-established risk factor for numerous age-related diseases, including coronary heart disease, diabetes, and stroke, and is closely associated with deleterious lifestyle behaviors such as smoking and excessive alcohol consumption. In the first step of our mediation analysis, we confirmed the causal relationships between BMI and myocardial infarction, daily smoking, serum RAGE levels, ischemic stroke, and multiple sclerosis, with no evidence of reverse causality. Furthermore, aging is strongly associated with disruptions in metabolic and energy homeostasis, cardiovascular and renal dysfunction, cognitive decline, respiratory disease, autoimmune disorders, cancer, and unhealthy lifestyle factors like smoking and alcohol use.37 Our second step of mediation analysis highlighted myocardial infarction, daily smoking, low serum RAGE levels, ischemic stroke, and multiple sclerosis as key mediators of the link between elevated BMI (general obesity) and FA progression. Consistent with findings from Chen et al, our results corroborated the mediating roles of ischemic stroke and daily smoking in the causal pathway from obesity to FA, though our analysis, using a larger GWAS dataset, did not identify HbA1c as a mediator as Chen et al founded, nor did it find any causal association with FA.21 While no studies to date have directly established association between FA and either multiple sclerosis or myocardial infarction, both conditions are strongly linked to obesity and aging process,5,37 warranting further investigation. Additionally, lower circulating levels of RAGEs have been shown to correlate negatively with diabetes, obesity, and insulin resistance. RAGEs play a vital role in mitigating the deleterious effects of AGEs (advanced glycation end-products), which contribute to tissue and cellular aging, including skin aging. AGEs accumulation in skin tissues has been employed as a crucial biomarker for assessing skin aging. From a translational standpoint, our findings provide actionable insights into facial aging (FA) alleviation. First, given the consistent causal association between genetically predicted BMI and FA—particularly in males and women over 50—targeted weight management (eg, lifestyle interventions to reduce general adiposity) emerges as a primary strategy to attenuate FA risk, consistent with our observation that BMI-driven FA acceleration is modifiable by targeting obesity directly. Second, as cardiovascular factors (myocardial infarction, ischemic stroke) and circulating RAGE levels function as key mediators, enhancing cardiovascular health (eg, primary prevention of cardiovascular events, dietary or pharmacological modulation of RAGE/AGEs pathways) can indirectly alleviate FA by disrupting these mediating pathways. Third, in subgroups with distinct risk profiles (eg, men over 50 with elevated waist-to-hip ratio [WHR]), personalized interventions integrating weight control and cardiovascular health monitoring may yield greater efficacy, as our stratified analyses underscore this population’s susceptibility to central obesity-related FA. Our study thus not only elucidates the biological mechanisms linking obesity to FA (eg, sex-age specificity, mediating cascades) but also establishes a basis for evidence-based early interventional strategies—including weight management and cardiovascular health optimization—to reduce FA risk in high-risk populations (eg, obese men aged >50 years).
Despite the large sample size of MR studies compared to traditional research, our study still has some unavoidable limitations: (1) Due to the lack of GWAS data from other ethnicities, the GWAS used in our study only included individuals of European descent. (2) There is some heterogeneity in the genetic instrumental variables used in the analysis. As GWAS data were used, it was not possible to explore stratified effects or nonlinear relationships due to age, health status, or gender. (3) MR studies typically explore the lifelong impact of risk factors on outcomes, making it challenging to reveal causal effects at different stages of disease progression. Moreover, we must recognize that MR analysis suggests causality less directly than randomized controlled trials (RCTs), and more high-quality RCT evidence is needed to supplement and support these findings.
Conclusion
Our study demonstrates notable differences in how distinct obesity types affect FA acceleration, which exhibits sex- and age-specific patterns. The findings highlight the significance of weight management as a potential intervention to alleviate FA. Furthermore, this research advances understanding of FA etiology. From a public health standpoint, these results endorse targeted weight management approaches for high-risk groups (eg, obese men aged >50 years) to reduce premature FA, filling a key gap in population-level aging prevention.
Abbreviations
FA, Facial Aging; BMI, Body Mass Index; WHR, Waist-to-Hip Ratio; GWAS, Genome Wide Association Study; MR, Mendelian Randomization; RAGEs, Receptor for Advanced Glycosylation End Products; RCTs, Randomized Controlled Trials; GIANT, Genetic Investigation of ANthropometric Traits; UKB, UK Biobank; HOMA-IR, Homeostasis Model Assessment of Insulin Resistance; HbA1c, Glycated Hemoglobin; SHBG, Sex Hormone-Binding Globulin; LD, linkage Disequilibrium; SNP, Single Nucleotide Polymorphism; IVW-FE, Inverse Variance Weighted; UV, Ultraviolet.
Data Sharing Statement
Details of each of the three two-sample MR methods that were used and calculations of the proportion of the mediation effect are included in the Supplementary Material. The data that support the findings of this study are available within the paper, Supplementary Information, and Source Data File.
Data on BMI and WHR was contributed by GIANT Consortium and can be downloaded from (https://portals.broadinstitute.org/collaboration/giant/index.php/-GIANT_consortium). Data on facial aging was contributed by UK Biobank (http://www.nealelab.-is/uk-biobank). Data on myocardial infraction was contributed by CARDIoGRAMplusC4D (https://www.cardiogram-plusc4d.org/). Data on hypertension, ankylosing spondylitis, hypothyroidism, seborrhoeic keratosis, sicca syndrome was contributed by Finngen (https://www.finngen.fi/en). Data on systolic blood pressure and diastolic blood pressure was contributed by ICBP. ICBP summary data can be assessed through request to ICBP steering committee. Contact Mark Caulfield ([email protected]) or Paul Elliott ([email protected]) to apply for access to the data. Data on allergic disease (asthma, hay fever or eczema), systemic lupus erythematosus, c-reactive protein level, serum albumin level, receptor for advanced glycosylation end products level, and sleep duration was contributed by MRC-IEU (https://gwas.mrcieu.ac.uk/). Data on primary sclerosing cholangitis was contributed by IPSCSG (https://www.ipscsg.org/). Data on Alzheimer's disease was contributed by ADGC (http://www.adgenetics.org/). Data on schizophrenia was contributed by PGC (https://pgc.unc.edu/). Data on ischemic stroke was contributed by MEGASTROKE (https://www.megastroke.org/). Data on multiple sclerosis was contributed by IMSGC (https://imsgc.net/). Data on type 2 diabetes was contributed by DIAGRAM (https://www.diagram-consortium.org/). Data on triglycerides, total cholesterol, HDL cholesterol, LDL cholesterol level was contributed by GLGC (https://www.lipidgenetics.org/). Data on fasting glucose Level, fasting insulin Level, homeostasis model assessment of insulin resistance, proinsulin level, and glycated hemoglobin level was contributed by MAGIC (http://magic-investigators.org/). Data on breast cancer was contributed by BCAC (http://bcac.ccge.med-schl.cam.ac.uk/). Data on age at menarche was contributed by Reprogen (https://www.re-progen.org/). Data on cigarettes smoked per day and age of smoking initiation was contributed by GSCAN (https://genome.psych.umn.edu/index.php/GSCAN). Data on alcohol consumption was contributed by within family GWAS consortium (https://www.withinfamilyconsortium.com/home/). Data on coffee intake, sex hormone-binding globulin (SHBG) levels, and melanoma skin cancer was contributed by UK Biobank (http://www.nealelab.is/uk-biobank). Data on basal cell carcinoma was contributed by GWAS Catalog (https://www.ebi.ac.uk/gwas/).
Ethics Approval and Consent to Participate
Ethical approval was waived as the entirety of the data was sourced from publicly available databases, and no individual-level data were used.
According to Article 32 of the Measures for Ethical Review of Life Science and Medical Research Involving Human Beings adopted by the National Science and Technology Ethics Committee of the People’s Republic of China, ethical review can be exempted because the data used in this study do not cause any harm to human beings, do not involve any sensitive personal information or commercial interests, and the databases selected are open and legal.
Acknowledgments
The authors want to thank the GIANT Consortium, UK Biobank, CARDIoGRAMplusC4D, the FinnGen study, ICBP, MRC-IEU, IPSCSG, ADGC, MEGASTROKE IMSGC, DIAGRAM, GLGC, MAGIC, BCAC, Reprogen, GSCAN, Within family GWAS consortium, and GWAS Catalog for sharing data.
Funding
The author(s) declare financial support was received for the research, authorship, and/or publication of this article. This work was supported by the Jilin Provincial Natural Science Foundation (grant no. YDZJ202401298ZYTS) and Jilin Provincial Special Program for Medical and Health Talents (grant no. JLSWSRCZX2023-17).
Disclosure
The authors report no conflicts of interest in this work.
References
1. Swift A, Liew S, Weinkle S, Garcia JK, Silberberg MB. The facial aging process from the “inside out. Aesthet Surg J. 2021;41:1107–17. doi:10.1093/asj/sjaa339
2. Rexbye H, Petersen I, Johansens M, Klitkou L, Jeune B, Christensen K. Influence of environmental factors on facial ageing. Age Ageing. 2006;35:110–115. doi:10.1093/ageing/afj031
3. Reilly MJ, Tomsic JA, Fernandez SJ, Davison SP. Effect of facial rejuvenation surgery on perceived attractiveness, femininity, and personality. JAMA Facial Plast Surg. 2015;17:202–207. doi:10.1001/jamafacial.2015.0158
4. Crowley JS, Kream E, Fabi S, Cohen SR. Facial rejuvenation with fat grafting and fillers. Aesthet Surg J. 2021;41:S31–S38. doi:10.1093/asj/sjab014
5. Malandrino N, Bhat SZ, Alfaraidhy M, Grewal RS, Kalyani RR. Obesity and aging. Endocrinol Metab Clin North Am. 2023;52:317–339. doi:10.1016/j.ecl.2022.10.001
6. Wong ZY, Ramasamy P, Ingels KJAO, et al. Changes of facial features after bariatric surgery: a systematic review. Obes Surg. 2023;33:332–338. doi:10.1007/s11695-022-06363-8
7. Gunn DA, Dick JL, van Heemst D, et al. Lifestyle and youthful looks. Br J Dermatol. 2015;172:1338–1345.
8. Birney E. Mendelian randomization. Cold Spring Harb Perspect Med. 2022;12. doi:10.1101/cshperspect.a041302
9. Sekula P, Del Greco MF, Pattaro C, Köttgen A. Mendelian randomization as an approach to assess causality using observational data. J Am Soc Nephrol. 2016;27:3253–3265. doi:10.1681/ASN.2016010098
10. Locke AE, Kahali B, Berndt SI, et al. Genetic studies of body mass index yield new insights for obesity biology. Nature. 2015;518:197–206. doi:10.1038/nature14177
11. Shungin D, Winkler TW, Croteau-Chonka DC, et al. New genetic loci link adipose and insulin biology to body fat distribution. Nature. 2015;518:187–196. doi:10.1038/nature14132
12. Winkler TW, Justice AE, Graff M, et al. The influence of age and sex on genetic associations with adult body size and shape: a large-scale genome-wide interaction study. PLoS Genet. 2015;11:e1005378. doi:10.1371/journal.pgen.1005378
13. Roberts V, Main B, Timpson NJ, Haworth S. Genome-Wide Association study identifies genetic associations with perceived age. J Invest Dermatol. 2020;140:2380–2385. doi:10.1016/j.jid.2020.03.970
14. Turner DP, Houle TT. Observational study designs. Headache. 2019;59:981–987. doi:10.1111/head.13572
15. Carter AR, Sanderson E, Hammerton G, et al. Mendelian randomization for mediation analysis: current methods and challenges for implementation. Eur J Epidemiol. 2021;36:465–478.
16. Burgess S, Thompson SG, CRP CHD Genetics Collaboration. Avoiding bias from weak instruments in Mendelian randomization studies. Int J Epidemiol. 2011;40:755–764. doi:10.1093/ije/dyr036
17. Bowden J, Davey Smith G, Burgess S. Mendelian randomization with invalid instruments: effect estimation and bias detection through Egger regression. Int J Epidemiol. 2015;44:512–525. doi:10.1093/ije/dyv080
18. Hemani G, Zheng J, Elsworth B, et al. The MR-base platform supports systematic causal inference across the human phenome. Elife. 2018;7. doi:10.7554/eLife.34408
19. Verbanck M, Chen C-Y, Neale B, Do R. Detection of widespread horizontal pleiotropy in causal relationships inferred from Mendelian randomization between complex traits and diseases. Nat Genet. 2018;50:693–698. doi:10.1038/s41588-018-0099-7
20. Staley JR, Blackshaw J, Kamat MA, et al. PhenoScanner: a database of human genotype-phenotype associations. Bioinformatics. 2016;32:3207–3209. doi:10.1093/bioinformatics/btw373
21. Chen Z, Chen Z, Jin X. Mendelian randomization supports causality between overweight status and accelerated aging. Aging Cell. 2023;22:e13899. doi:10.1111/acel.13899
22. Relton CL, Davey Smith G. Two-step epigenetic Mendelian randomization: a strategy for establishing the causal role of epigenetic processes in pathways to disease. Int J Epidemiol. 2012;41:161–176. doi:10.1093/ije/dyr233
23. Purba MB, Kouris-Blazos A, Wattanapenpaiboon N, et al. Can skin wrinkling in a site that has received limited sun exposure be used as a marker of health status and biological age? Age Ageing. 2001;30:227–234. doi:10.1093/ageing/30.3.227
24. Apovian CM, Guo X-R, Hawley JA, Karmali S, Loos RJF, Waterlander WE. Approaches to addressing the rise in obesity levels. Nat Rev Endocrinol. 2023;19:76–81. doi:10.1038/s41574-022-00777-1
25. Robinson O, Chadeau Hyam M, Karaman I, et al. Determinants of accelerated metabolomic and epigenetic aging in a UK cohort. Aging Cell. 2020;19:e13149. doi:10.1111/acel.13149
26. Ibuki A, Kuriyama S, Toyosaki Y, et al. Aging-like physiological changes in the skin of Japanese obese diabetic patients. SAGE Open Med. 2018;6:2050312118756662. doi:10.1177/2050312118756662
27. Ezure T, Amano S. Increased subcutaneous adipose tissue impairs dermal function in diet-induced obese mice. Exp Dermatol. 2010;19:878–882. doi:10.1111/j.1600-0625.2009.00970.x
28. Pascali MA, Giorgi D, Bastiani L, et al. Face morphology: can it tell us something about body weight and fat? Comput Biol Med. 2016;76:238–249. doi:10.1016/j.compbiomed.2016.06.006
29. Keaney TC. Aging in the male face: intrinsic and extrinsic factors. Dermatol Surg. 2016;42:797–803. doi:10.1097/DSS.0000000000000505
30. Binișor I, Baniță IM, Alexandru D, et al. Progranulin: a proangiogenic factor in visceral adipose tissue in tumoral and non-tumoral visceral pathology. Exp Ther Med. 2021;22:1337. doi:10.3892/etm.2021.10772
31. Ezure T, Amano S. Influence of subcutaneous adipose tissue mass on dermal elasticity and sagging severity in lower cheek. Skin Res Technol. 2010;16:332–338. doi:10.1111/j.1600-0846.2010.00438.x
32. Zhang Z, Liu N, Pan X, et al. Assessing causal associations between neurodegenerative diseases and neurological tumors with biological aging: a bidirectional Mendelian randomization study. Front Neurosci. 2023;17:1321246. doi:10.3389/fnins.2023.1321246
33. Liu X, Li X, Ma J. Beverage consumption and facial skin aging: evidence from Mendelian randomization analysis. J Cosmet Dermatol. 2024;23:1800–1807. doi:10.1111/jocd.16153
34. Liu M, Lan Y, Zhang H, et al. Analyzing the causal relationship between potentially protective and risk factors and cutaneous melanoma: a Mendelian randomization study. J Eur Acad Dermatol Venereol. 2024;38:102–111. doi:10.1111/jdv.19484
35. Zhang Z, Li M, Geng Y, Wang W, Wang W, Shao Y. Genetically proxied autoimmune diseases and the risk of facial aging. Clin Cosmet Investig Dermatol. 2024;17:981–991. doi:10.2147/CCID.S456126
36. van der Poort EKJ, Gunn DA, Beekman M, et al.Basal cell carcinoma genetic susceptibility increases the rate of skin ageing: a Mendelian randomization study. J Eur Acad Dermatol Venereol. 2020;(34):97–100. doi:10.1111/jdv.15880
37. López-Otín C, Blasco MA, Partridge L, Serrano M, Kroemer G. The hallmarks of aging. Cell. 2013;153:1194–1217. doi:10.1016/j.cell.2013.05.039
 © 2026 The Author(s). This work is published and licensed by Dove Medical Press Limited. The
full terms of this license are available at https://www.dovepress.com/terms
and incorporate the Creative Commons Attribution
- Non Commercial (unported, 4.0) License.
By accessing the work you hereby accept the Terms. Non-commercial uses of the work are permitted
without any further permission from Dove Medical Press Limited, provided the work is properly
attributed. For permission for commercial use of this work, please see paragraphs 4.2 and 5 of our Terms.
© 2026 The Author(s). This work is published and licensed by Dove Medical Press Limited. The
full terms of this license are available at https://www.dovepress.com/terms
and incorporate the Creative Commons Attribution
- Non Commercial (unported, 4.0) License.
By accessing the work you hereby accept the Terms. Non-commercial uses of the work are permitted
without any further permission from Dove Medical Press Limited, provided the work is properly
attributed. For permission for commercial use of this work, please see paragraphs 4.2 and 5 of our Terms.
Recommended articles
Correlation of Body Mass Index with Clinicopathologic Parameters in Patients with Idiopathic Membranous Nephropathy
Chen X, Chen S, Li Z, Pan X, Jia Y, Hu Z, Niu K, Liu B, Ren Q
Diabetes, Metabolic Syndrome and Obesity 2022, 15:1897-1909
Published Date: 20 June 2022
All Types Obesity and Physical Inactivity Associated with the Risk of Activity of Daily Living Limitations Among People with Asthma
Alhammad SA, Alwadeai KS
Journal of Multidisciplinary Healthcare 2022, 15:1573-1583
Published Date: 22 July 2022
Association Between Nutritional Knowledge, Dietary Regimen, and Excess Body Weight in Primary School Teachers
Saintila J, Calizaya-Milla YE, Calizaya-Milla SE, Elejabo-Pacheco AA, Sandoval-Valentin GA, Rodriguez-Panta SG
Journal of Multidisciplinary Healthcare 2022, 15:2331-2339
Published Date: 14 October 2022
Causal Association Between Diabetes, Body Mass Index and Lichen Sclerosus: A Bidirectional Two-Sample Mendelian Randomization Analysis
Liu L, Zhang Q, Chang J, Yang K
Clinical, Cosmetic and Investigational Dermatology 2024, 17:931-940
Published Date: 26 April 2024
The Burden of Obesity in Saudi Arabia: A Real-World Cost-of-Illness Study
Nagi MA, Almalki ZS, Thavorncharoensap M, Sangroongruangsri S, Turongkaravee S, Chaikledkaew U, Alqahtani AM, AlSharif LS, Alsubaihi IA, Alzarea AI, Alsultan MM
ClinicoEconomics and Outcomes Research 2025, 17:233-246
Published Date: 21 March 2025