Back to Journals » Clinical Interventions in Aging » Volume 20
Effects of Multicomponent Otago Exercise Program with Added Resistance Training on Sarcopenia in Pre-Frailty Older Adults in Nursing Homes: A Randomized Controlled Trial
Authors Pan N, Chen Y, Wang Z, Liu C, Tong J, He Y, Ossowski ZM ![]()
Received 10 July 2025
Accepted for publication 16 October 2025
Published 11 November 2025 Volume 2025:20 Pages 1927—1943
DOI https://doi.org/10.2147/CIA.S552924
Checked for plagiarism Yes
Review by Single anonymous peer review
Peer reviewer comments 2
Editor who approved publication: Dr Maddalena Illario
Neng Pan,1 Yan Chen,2 Zhaojian Wang,3 Chenming Liu,4 Jun Tong,5 Yuchen He,6 Zbigniew Marcin Ossowski1
1Faculty of Physical Culture, Gdansk University of Physical Education and Sport, Gdansk, Poland; 2Sports Department, Northwest A&F University, Yanglin, Shanxi, People’s Republic of China; 3Sports Department, Yunnan Normal University, Kunming, Yunnan, People’s Republic of China; 4Department of Sports Training, Chendu Sport University, Chendu, Sichuan, People’s Republic of China; 5Sports Department, Kunming Medical University, Kunming, Yunnan, People’s Republic of China; 6Sports Department, Capital University of Physical Education and Sports, Beijing, People’s Republic of China
Correspondence: Zbigniew Marcin Ossowski, Faculty of Physical Culture, Gdansk University of Physical Education and Sport, Kazimierza Gorskiego 1, Gdansk, 80-336, Poland, Tel +48 585547183, Email [email protected]
Background: The Otago Exercise Program (OEP) is suitable for frail older adults but has limited effect on sarcopenia. Resistance training (RT) is commonly used for sarcopenia. This study evaluated the effects of 12 weeks of OEP combined with RT on body composition, physical function, quality of life, and frailty in older adults with pre-sarcopenia in nursing homes.
Methods: Sixty-one pre-frail elderly (aged 65– 89 years) with sarcopenia were randomly divided into experimental group (EG) and control group (CG). EG received OEP+RT training three times a week for 12 weeks, and CG maintained daily activities. The InBody 770 was used to assess body composition, Jamar Plus was used to measure grip strength, and international standard scales were used to assess physical function, quality of life and frailty.
Results: Compared to the CG, the EG showed significant improvements in Skeletal Muscle Index (SMI: 5.79 vs 5.43, p=0.037), Skeletal Muscle Mass (21.8 vs 19.5, p=0.017), hand grip strength (19.31 vs 16.92, p=0.029), gait speed (0.9 vs 0.81, p< 0.001), and the Five-Times-Sit-to-Stand Test (13 vs 14.35, p< 0.001). Within the EG, both SMI and hand grip strength increased significantly compared to baseline levels (p< 0.001), whereas in the CG, they decreased significantly (p< 0.05). There was no significant improvement in frailty status observed in either group.
Conclusion: OEP combined with RT can improve the sarcopenia-related parameters of the elderly in nursing homes. Short-term unreversed frailty may be related to insufficient intervention intensity or single dimension. Improved muscle and physical function may contribute to future improvements in quality of life and frailty.
Keywords: Otago Exercise Program, multicomponent exercise, sarcopenia, pre-frailty, older adults, nursing homes
Introduction
Since 1990, the world has been facing the problem of population aging. One study showed that adults aged 70 and older living in high-income countries and areas with high quality of health services had the highest life expectancy and healthy life expectancy, but the burden of disability remained constant.1 The prevention of aging diseases and the improvement of the quality of life of the elderly have become a matter of concern. Frailty is recognized as a high-prevalence condition among the elderly, and individuals with frailty are at increased risk of multiple comorbidities. Fried et al defined frailty as a clinical syndrome.2 Additionally, they introduced the Fried Frailty Phenotype, a tool for assessing frailty that comprises five core indicators: unintentional weight loss, decreased grip strength, slowed walking speed, reduced physical activity, and self-reported exhaustion. Individuals meeting three or more of these criteria are classified as frail.3 Those meeting one or two criteria are categorized as prefrail, indicating moderate frailty. Frailty and sarcopenia share numerous clinical characteristics, thereby demonstrating a concurrent relationship.4 The progression towards a frail state is significantly influenced by the presence of sarcopenia. The European Working Group on Sarcopenia in Older People (EWGSOP) revised its definition of sarcopenia in 2018: Sarcopenia is a muscle disease (muscle failure) that results from adverse changes in muscles that accumulate over a lifetime.5 The Asian Working Group for Sarcopenia (AWGS) retained its previous definition of sarcopenia in a 2019 paper, but revised diagnostic algorithms, protocols, and some criteria.6 Based on the global consensus regarding frailty and sarcopenia, it is evident that these two conditions can readily enter into a detrimental cycle. For instance, sarcopenia serves as a critical factor in the development of frailty, which subsequently elevates the risk of falls. Such incidents may lead to disability and increased mortality, ultimately imposing a heavier burden on the public healthcare system. Furthermore, studies conducted by Sato and Vatic et al emphasize the severe adverse effects associated with both conditions, including heart failure and heightened mortality rates.7
Resistance training is considered an effective intervention for sarcopenia and frailty, and the biological mechanism by which training promotes muscle hypertrophy is widely recognized.8 However, relying solely on a single mode of exercise presents numerous limitations. For instance, resistance training alone or aerobic exercise may not sufficiently address the multifaceted physiological deficiencies associated with weakness and sarcopenia.9 While resistance training enhances muscle strength, its impact on balance, cardiovascular endurance, and flexibility is relatively limited. We express our concern regarding the multi-component exercise program developed by the University of Otago in New Zealand, known as the Otago Exercise Program (OEP). This intervention is specifically tailored for older adults, with a focus on enhancing muscle strength, coordination, and stability.10,11 It integrates strength training, balance exercises, and walking routines, particularly benefiting frail elderly individuals who are at high risk of falls. Despite the widespread application of OEP in frail elderly populations, its impact on sarcopenia remains to be elucidated. A study conducted in Malaysia indicated that OEP may prevent the decline in upper body strength.12 In addition, the study highlights that the effectiveness of OEP in sarcopenia should be looked at in the future. Gillespie et al observed in their study that while OEP decreases the risk of falls, its direct enhancement of muscle mass is limited, particularly in patients with sarcopenia.13 Currently, existing studies on OEP have largely confirmed its efficacy in addressing weakness; however, the underlying mechanism by which it improves strength and muscle mass remains unclear.
Given the well-documented efficacy of resistance training in addressing sarcopenia and the benefits of OEP in managing frailty, we propose the integration of these two approaches. It is noteworthy that OEP inherently includes resistance training; however, it may not reach adequate intensity levels to effectively counteract sarcopenia. Therefore, for individuals in the early stages of weakness, incorporating additional high-intensity resistance training is essential to promote muscle mass accrual. This represents one of the key innovations of our study. To the best of our knowledge, this is the first instance where OEP has been augmented with supplementary resistance training specifically targeting older adults in the early stages of frailty.
The participants in this study consisted of individuals who had resided in nursing homes for extended periods. Prior similar clinical trials have predominantly focused on elderly individuals within community settings rather than those residing in nursing homes.14 For instance, Albornos-Munoz et al identified 728 participants in a clinical trial, all of whom were involved in an intervention conducted in a community residential setting.15 This highlights the importance of conducting research specifically targeting individuals living in nursing homes.
The primary aim of this study was to verify the effect of OEP-based multi-component exercise on muscle mass and physical function among elderly individuals residing in nursing homes. The secondary aim was to investigate whether improvements in muscle mass and strength in pre-frail populations could contribute to maintaining or reversing frailty, while also emphasizing their quality of life. The practical significance of this study lies in providing low-cost, non-pharmacological intervention programs for nursing homes with limited resources. Additionally, it is essential to advocate for the integration of structured exercise programs into long-term care standards for special populations, thereby enhancing the role of multi-component exercise in addressing sarcopenia.
Methods
Ethics Statement
In accordance with the Declaration of Helsinki, the Ethics Committee of Kunming Medical University approved the research protocol (approval number: KMMU2025MEC120). Prior to the commencement of the study, all participants were provided with comprehensive oral and written information regarding the experiment and subsequently signed informed consent forms. The study protocol was registered on ClinicalTrials.gov on March 7, 2025 (registration number: NCT06882720) under the title “Effects of Otago-based Multicomponent Exercise on Sarcopenia in Pre-Frailty Older Adults in Nursing Homes: A Randomized Controlled Trial.” Following the initiation of the experiment, no substantial modifications were made to the methodology. This study adheres strictly to the principles of openness, transparency, and reproducibility.
Participants
The study involved 61 East Asian individuals aged 65–89 years (M = 81.41 years, SD = 5.14) residing in nursing homes, comprising 30 males and 31 females. Participants were primarily recruited from YI XIN YI YANG, a nursing home located in Kunming, Yunnan Province, China. A total of 68 volunteers within the age range of 65–89 were selected from an initial pool of 86 people who expressed interest in participating in the study. The detailed recruitment process is illustrated in Figure 1. This study employed a combination of pre-test, post-test, and repeated measures designs to track changes in participants over time, while quasi-experimental methods were utilized to evaluate inter-group differences. Participants were randomly assigned to either the experimental or control group with balanced gender ratios. The recruitment and randomization procedures ensured the selection of as homogeneous a group as possible with respect to critical variables such as daily physical activity and health-promoting factors.
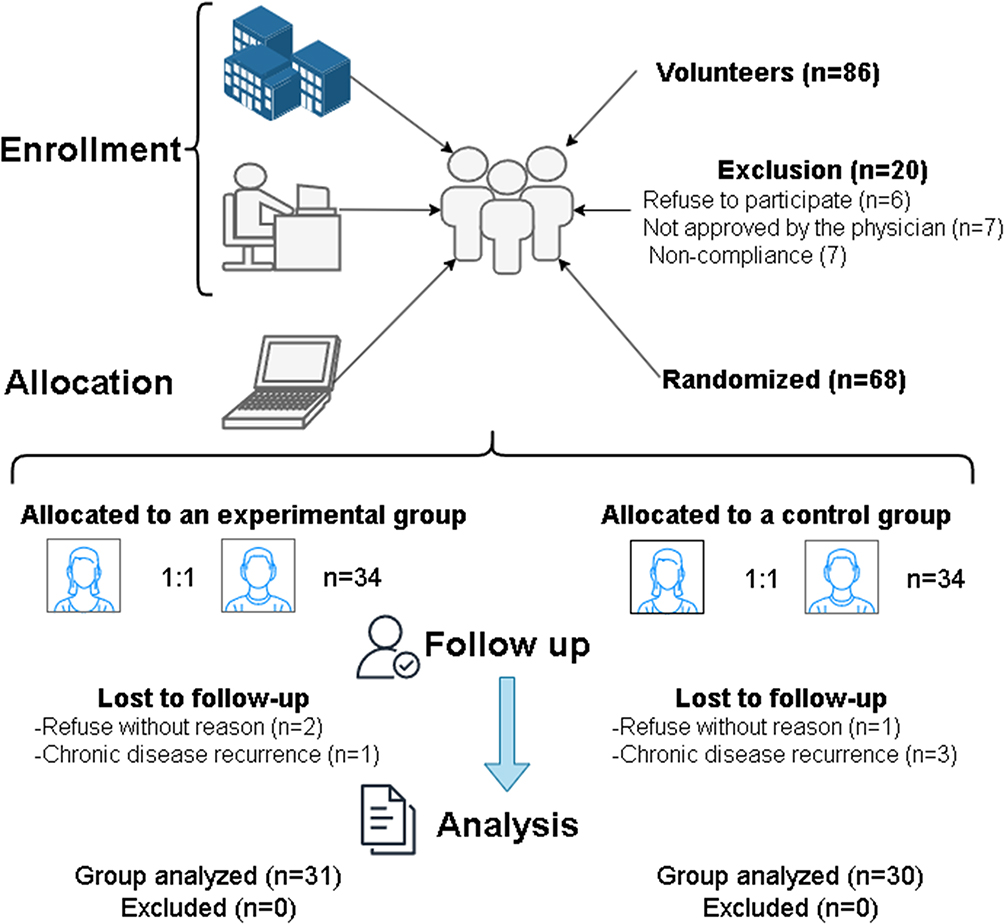 |
Figure 1 Recruitment process. |
There were 31 participants in the experimental group (M = 82.42 years, SD = 5.48 years) and 30 participants in the control group (M = 80.43 years, SD = 4.76 years). Participants in the control group did not engage in any physical activities beyond their daily routines, whereas those in the experimental group were required to participate in a structured training program three times per week, as detailed in the study design section.
Participants were included according to the following criteria: aged 65 years or older; diagnosed with pre-frailty (Fried Frailty Phenotype score of 1–2);2,16 diagnosed with sarcopenia based on the Asian Working Group for Sarcopenia (AWGS) 2019 diagnostic criteria (Grip Strength: male < 28 kg, female < 18 kg; Skeletal Muscle Index: male < 7.0 kg/m2, female < 5.4 kg/m2; Gait Speed ≤ 1.0 m/s. In this study, bioelectrical impedance analysis (BIA) (InBody 770) was used to assess skeletal muscle mass. According to the 2019 Asian Working Group on Sarcopenia (AWGS 2019) consensus, the cut-off value of low skeletal muscle mass index (SMI) defined by BIA method was <7.0 kg/m2 in men and <5.7 kg/m2 in women. Time for the 5-repetition sit-to-stand test ≥ 12 seconds);6 no absolute contraindications to physical exercise, such as chest pain, chest tightness, palpitations, dyspnea, syncope, high fever, severe cough, severe diarrhea, gross hematuria, radiating pain in the waist and leg, fracture, etc.; and provided signed informed consent to participate in the research and physical activity programs.
Participants were excluded based on the following criteria: individuals who had not been diagnosed with pre-frailties (Fried Frailty Phenotype score of 0 or ≥3); those who had not been definitively diagnosed with sarcopenia (failure to meet any of the five parameters outlined in the 2019 edition of the Asian Working Group for Sarcopenia diagnostic criteria); self-reported or clinically diagnosed health conditions that rendered them unsuitable for exercise participation, such as uncontrolled hypertension, coronary artery disease, rheumatoid arthritis, type 2 diabetes, respiratory or pulmonary diseases, etc.; unwillingness to adhere to research protocols; and failure to submit a signed informed consent form.
Participants are required to undergo mandatory medical examinations and disclose detailed information regarding their prescription drug usage. The participants who underwent examination were under the long-term care of a team comprising three medical specialists and five nurses, with a chief physician overseeing the administration and monitoring of prescribed medications.
Sample Size Calculation
The sample size for this study was calculated using Gpower 3.1. In our previous studies, the effect sizes of the main outcome indicators were all greater than 0.8, which belonged to high effect sizes. Therefore, under the conditions of high effect sizes (α=0.7, β=0.8), 68 samples were required for calculation in this study, with 34 samples in each group.
Study Design
Experimental Group
Otago Exercise Program (OEP)
The OEP is an intervention program specifically developed for older adults at the University of Otago in New Zealand.17,18 This program integrates three key components: cardiopulmonary exercises, resistance training, and balance training.19,20 Incorporate a structured 10-minute warm-up and stretching routine both prior to and following each session (In the OPE part of Figure 2, the heart rate was controlled between 50% and 65% of the maximum heart rate). The training follows a progressive approach, transitioning from supported to unsupported strength and balance exercises, as outlined in detail in the OEP Guide manual (https://www.physio-pedia.com/index.php?title=Otago_Exercise_Programme&oldid=342197).
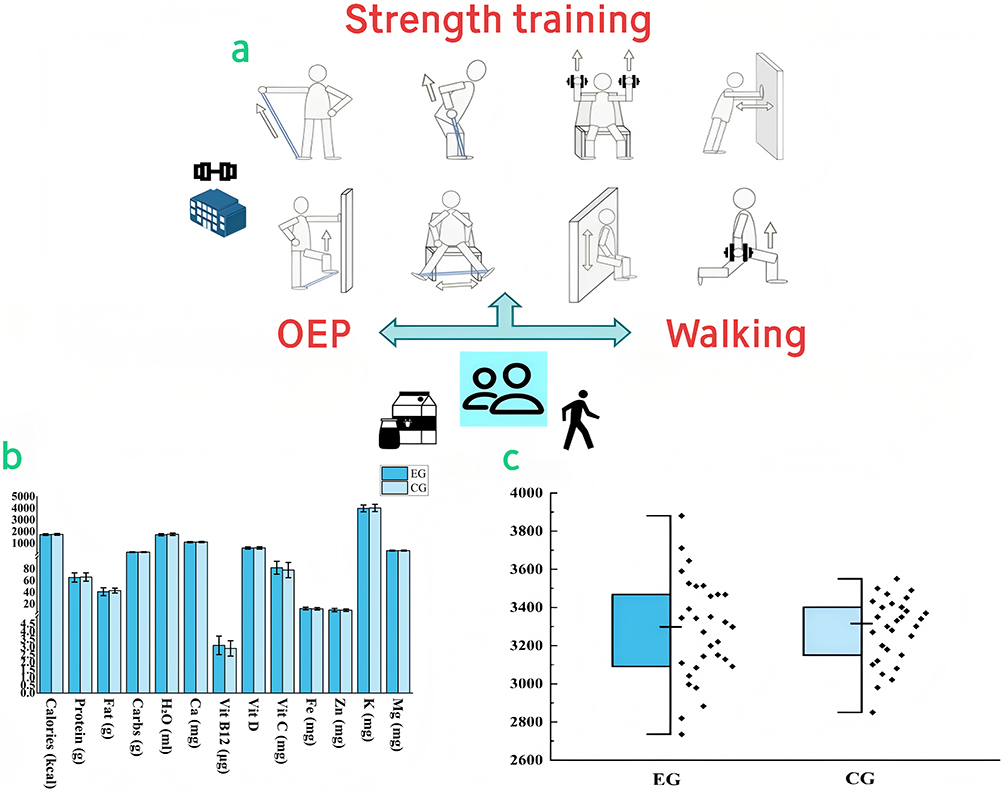 |
Figure 2 Schematic representation of the study protocol. (a) Additional strength training programs; (b): comparison of daily nutrition intake between the experimental group and the control group; (c): Comparison of daily steps between experimental and control groups. Abbreviations: EG, Experimental group; CG, Control group; Carbs, Carbohydrates, H2O, Water; Ca, Calcium; Vit, Vitamin; Fe, Iron; Zn, Zinc; K, Potassium; Mg, Magnesium. |
In our study, participants were instructed to engage in 30 minutes of walking three times per week within a nursing home setting. Alternatively, they could complete three 10-minute sessions on the same day (The heart rate in the walking part of Figure 2 was controlled between 55% and 65% of the maximum heart rate). Participants were required to walk at a moderate pace, allowing them to maintain a conversation while walking.
Strength training included five specific leg-strengthening exercises (Ankle movements, Back knee strengthening exercise, Side hip strengthening exercise, Calf raises, Toe raises). These exercises were performed three times per week, with one day of rest between sessions. The number of repetitions, sets, and duration of each action were strictly adhered to according to the OEP guidelines, with heart rates maintained at 50–60% of the maximum heart rate.
Balance training consisted of twelve prescribed exercises (Knee bends, Backwards walking, Walking and turning around, Sideways walking, Heel toe standing, Heel toe walking, One leg stand, Heel walking, Toe walking, Heel toe walking backwards, Sit to stand, Stair walking). This component was conducted three times per week, with one day of rest between sessions. Each exercise was performed for one set of one repetition, with a one-minute rest interval between exercises. Heart rates during balance training were maintained at 55–65% of the maximum heart rate.
It is important to note that leg-strengthening exercises and balance training were conducted on the same day in the fitness hall of the care home under the supervision of four professional physical trainers. Walking activities were scheduled on non-training days and were supervised and assisted by four nurses to ensure participant safety.
Strength Training
Strength training is carried out in the fitness hall of the nursing home under the guidance of a professional fitness instructor and four nurses who ensure the safety of participants. The program includes 10 minutes of warm-up, 40 minutes of strength training, and 10 minutes of stretching exercises (The strength training section in Figure 2 was controlled between 65% and 75% of the maximum heart rate). The strength training comprises four upper-body exercises and four lower-body exercises, as illustrated in Figure 2a. The exercise intensity adheres to the guidelines provided by the American College of Sports Medicine (ACSM) specifically designed for elderly populations.9 Each exercise consists of 8–12 repetitions, 2–3 sets, with a 1-minute rest interval between sets, conducted three times per week. Sessions are scheduled in the afternoon on the same day as OEP. Notably, the primary equipment used includes elastic resistance bands (ranging from 5 to 25 lbs) and dumbbells (1–2.5 kg), with the option to substitute dumbbells with water bottles of equivalent weight.
Control Group
Participants in the control group continued to participate in their daily activities during the study period and did not engage in any targeted physical exercise program.
Outcome
Primary Outcome Measures
The primary outcome measures consisted of five parameters for assessing sarcopenia: Skeletal Muscle Index (SMI, kg/m2),21 Skeletal Muscle Mass (SMM, kg),21 Hand Grip Strength (HS, kg),22 Gait Speed (GS, m/s),23 and the time required for the 5-repetition Sit-to-Stand Test (5STS, s).24 Based on the criteria for sarcopenia proposed by the Asian Working Group for Sarcopenia (AWGS) in 2019,6 SMI and SMM serve as indicators of body composition, whereas HS, GS, and 5STS are utilized to evaluate physical function. The threshold values for these parameters to diagnose sarcopenia were outlined in the participant inclusion criteria. SMI and SMM were assessed using the InBody 770 multi-frequency bioelectrical impedance analyzer (InBody Co, Seoul, Korea).25 The HS test was conducted with the Jamar Plus digital dynamometer (Sammons Preston, USA), where each hand was tested three times at one-minute intervals, and the maximum value was recorded. The GS test measured the time taken for the middle 6 meters of a 10-meter straight walk.23 In the 5STS test, participants initially sat on a chair of appropriate height, performed five consecutive sit-to-stand movements, and concluded in the seated position while the time was recorded.24
Secondary Outcome Measures
Secondary outcome measures also included seven parameters commonly used to assess body composition and physical function in the context of sarcopenia: Body fat mass (BFM, kg), skeletal muscle lean mass (SLM, kg), fat-free mass (FFM, kg), Time Up and Go test (TUG, s), Arm Curl test (AC, times/30s), 6-minute walking test (6MWT, m/6min), and Tandem Balance test (TB, s).26,27 BFM, SLM, and FFM were assessed using the InBody 770 multifrequency Bioelectrical Impedance Analyzer (InBody Co., Seoul, Korea).25 The TUG test evaluates the time required for participants to rise from a seated position, walk 3 meters, turn around, return to the chair, and sit down.28 During the AC test, participants were instructed to sit in a chair and perform as many arm curls as possible within 30 seconds while holding a 2-kg weight in one hand.29 Prior to the 6MWT, participants completed a 2–3 minute warm-up session and then walked back and forth along a 100-meter corridor for 6 minutes, with the total distance covered recorded.30 For the TB test, participants were asked to walk 2 meters in a straight line using a “heel-to-toe” technique at their fastest pace, with the time taken recorded.31
Other Outcome Measures
We selected five outcome measures that have not been traditionally employed for the evaluation of sarcopenia. Body weight (BW, kg) and body mass index (BMI, kg/m2) are commonly utilized to assess health status.32 Quality of life was evaluated using the EuroQol Five-Dimensional Five-Level Questionnaire (EQ-5D-5L), which includes both utility values and a visual analog scale (VAS).33 This questionnaire employs a 5-level scale across five dimensions: mobility, self-care, ability to perform daily activities, pain/discomfort, and anxiety/depression. Higher scores indicate better health status. The Short Physical Performance Battery (SPPB), developed by the National Institute on Aging, was used to evaluate lower limb function, balance, and mobility.34 Based on combined scores from three simple tests, it can predict risks such as falls, disability, hospitalization, and mortality. The SPPB comprises a balance test, a 4-meter walking test, and a chair stand test. Lower scores reflect poorer physical fitness. Frailty was assessed using the Fried frailty phenotype scale, which identifies frailty in older adults through five physiological criteria (unintentional weight loss, weakened grip strength, fatigue, reduced walking speed, and diminished physical activity) to predict adverse health outcomes, including falls, disability, hospitalization, and mortality.3 Each criterion reaching a specified threshold is assigned one point; higher scores indicate greater frailty.
Reliability and Validity
A total of three scales were employed in this study: the three mentioned in the outcome indicators (EQ-5D-5L, SPPB, and Fried). A score below 21 is typically indicative of cognitive impairment. Despite the widespread recognition and application of these scales, a reliability and validity assessment was conducted in this study to account for potential variations due to differences in language and cultural background. The results are shown in Supplementary Table S1 of the supplementary materials.
The results of the reliability and validity analysis are summarized as follows: Cronbach’s α was employed to assess internal consistency, and the findings revealed that all scales achieved an acceptable standard (α < 0.7), thereby confirming satisfactory consistency among the subitems of each scale. The KMO test values ranged from 0.702 to 0.874, while the Bartlett’s test of sphericity was significant (p < 0.001), both of which indicate that the data were suitable for factor analysis. The cumulative variance explanation rate (CVE) of the single-factor model ranged from 51.9% to 66.3%, surpassing the threshold of 50%, thus validating the reasonableness of the underlying factor structure. Additionally, the factor loading range (FLR) for all scales varied between 0.51 and 0.92, demonstrating a robust correlation between the subitems and the main factors.
Adherence
Participant compliance management: (1) Eliminate individuals who may relocate within the next six months during the screening process and carefully document when and why participants enter or leave the nursing home; (2) On-site reminders provided by nurses 24 hours before each intervention; (3) Monitoring and recording of participants’ daily medication and dietary intake. During the intervention period, nurses recorded the participants’ daily diet, including 13 parameters, using the mobile application (My Fitness Pal). There were significant differences in all parameters between the experimental group and the control group during the intervention period (p > 0.05), as shown in Figure 2b; (4) Participants were asked to wear a sports watch (Xiao Mi Bracelet 9 Pro) at any time except for bathing and sleeping time to record the length of daily activity and the number of steps. Data is uploaded weekly to the designated application (Xiao Mi Sports Health). Participants’ daily steps were recorded by the researchers during the intervention, and participants in the EG group did not wear a watch while participating in exercise. There was no significant difference in the number of daily walking steps between the two groups during the intervention period (EG: M=3280.14 ± 267.17, CG: M=3279.11 ± 172.64, p > 0.05), as shown in Figure 2c; (5) To motivate participants, the research team will work with the nursing home to provide monthly gifts (such as cups, pillows, blankets).
Quality control of the research team: (1) Development of comprehensive operating procedures, including distribution, intervention implementation (OEP guide manual and self-developed strength training guide manual for this study) and data recording; Role-playing exercises (simulating participant recruitment and follow-up, instruction and safety controls during the intervention, standardized data collection practices) are conducted prior to the start of the experiment to ensure that all members fully understand the processes involved; (3) Two researchers independently recorded and cross-checked key data.
Randomisation
Subjects were stratified by sex and randomly assigned to the experimental or control group using block randomization (block size = 4). An independent statistician generated the random sequences using Stata 17.0, which were then sorted by sex into consecutively numbered, opaque, sealed envelopes. After subjects completed the baseline assessment, the study nurse opened the envelopes to reveal the group assignments, ensuring that the results remained concealed from both the subjects and evaluators. Each group (experimental and control) consisted of 34 subjects (17 males and 17 females), with gender distribution strictly balanced. Given the nature of the intervention in this study, blinding of the study staff and participants was not feasible; therefore, only the statistical and analytical staff were blinded.
Statistical Methods
The present study employed difference tests and correlation analyses to compare the EG group and CG group. Initially, the Shapiro–Wilk test was conducted to assess the normality of all continuous variables (significance level: p < 0.05). Based on the results, parametric or non-parametric methods were selected accordingly. For inter-group comparisons (EG vs CG), independent sample t-tests were applied for variables with a normal distribution and homogeneity of variance (Levene’s test: p > 0.05), while the Mann–Whitney U-test was utilized for variables with non-normal distributions or heterogeneous variances. Regarding intra-group differences (pre- vs post-intervention), paired sample t-tests were performed for normally distributed data, whereas the Wilcoxon signed-rank test was used for non-normally distributed data. In correlation analysis, Pearson’s correlation coefficient was employed to evaluate the linear relationships between normally distributed variables, and Spearman’s rank correlation coefficient was used to analyze monotonic relationships for non-normally distributed variables. Effect sizes were quantified using Cohen’s d (small: d = 0.2; medium: d = 0.5; large: d = 0.8) and Rank-Biserial correlation coefficient (small: r = 0.1; medium: r = 0.3; large: r = 0.5). All statistical analyses were conducted using SPSS 27, with results presented as mean ± standard deviation or median (interquartile range). Finally, all visualizations were generated using OriginPro 2024b, RStudio 4.4.2, and draw.io online compositing software.
Results
Baseline Characteristics
This study included a total of 61 samples, with 31 assigned to the Experimental Group (EG) and 30 to the Control Group (CG). No significant differences were observed in the distribution or parameters between the two groups (p > 0.05), as detailed in Supplementary Table S2.
Primary Outcomes
Comparison of EG
SMI was significantly increased by 8.22% after the experiment (Pre: 5.35, Post: 5.79, p < 0.001, r = 1); SMM was significantly increased by 11.22% after the experiment (Pre: 19.6, Post: 21.8, p < 0.001, r = 1); HS-R was significantly increased by 11.43% after the experiment (Pre: 17.33, Post: 19.31, p < 0.001, r = 1); HS-L was significantly increased by 5.14% after the experiment (Pre: 16.74, Post: 17.6, p < 0.001, r = 0.96); 5 STS decreased significantly by 13.33% after the experiment (Pre: 15, Post: 13, p < 0.001, d = 3.272); GS was significantly increased by 5.95% after the experiment (Pre: 0.84, Post: 0.89, p < 0.001, r = 0.984). The specific data distribution is shown in Figure 3a, and the specific values are shown in Supplementary Table S3.
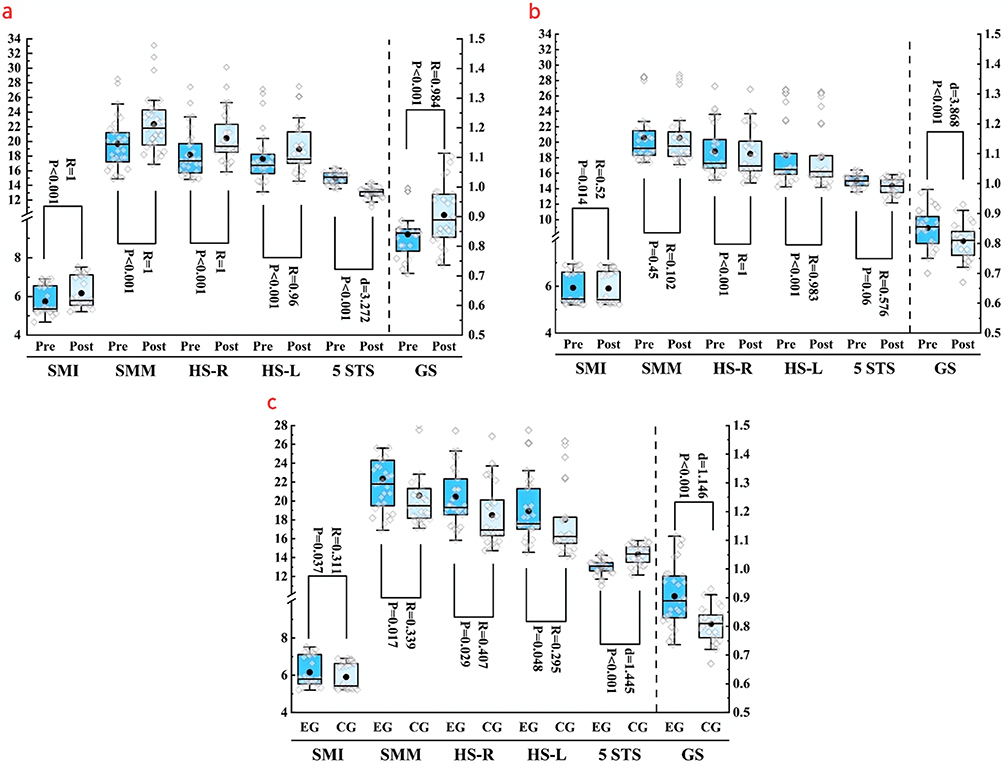 |
Figure 3 Parameter comparison of primary outcomes. (a) Comparison of experimental group before and after intervention; (b): Comparison of control group before and after intervention; (c): Comparison between the experimental group and the control group after intervention. Confidence interval 5%. Abbreviations: SMI, Skeletal Muscle Index; SMM, Skeletal Muscle Mass; HS-R, Handgrip Strength-Right; HS-L, Handgrip Strength-Left; 5 STS, 5-repetition Sit-to-Stand Test; GS, Gait Speed. Pre, before the experiment; Post, after the experiment. d, Cohen’s d; R, Rank-Biserial correlation coefficient; EG, experimental group; CG, control group. |
Comparison of CG
SMI was significantly decreased by 0.55% after the experiment (Pre: 5.46, Post: 5.43, p = 0.014, r = 0.52); HS-R was significantly decreased by 2.14% after the experiment (Pre: 17.29, Post: 16.92, p < 0.001, r = 1); HS-L was significantly decreased by 1.46% after the experiment (Pre: 16.47, Post: 16.23, p < 0.001, r = 0.983); GS was significantly decreased by 5.81% after the experiment (Pre: 0.86, Post: 0.81, p < 0.001, d = 3.868). There was no significant difference in other parameters. The specific data distribution is shown in Figure 3b, and the specific values are shown in Supplementary Table S3.
Comparison of EG and CG
SMI exhibited a 6.22% intervention-induced increase in the EG relative to the CG (EG: 5.79 vs CG: 5.43; p = 0.037, r = 0.311); SMM exhibited a 10.55% intervention-induced increase in the EG relative to the CG (EG: 21.8 vs CG: 19.5; p = 0.017, r = 0.339); HS-R exhibited a 12.38% intervention-induced increase in the EG relative to the CG (EG: 19.31 vs CG: 16.92; p = 0.029, r = 0.407); HS-L exhibited a 7.78% intervention-induced increase in the EG relative to the CG (EG: 17.6 vs CG: 16.23; p = 0.048, r = 0.295); 5 STS exhibited a 9.41% intervention-induced decrease in the EG relative to the CG (EG: 13 vs CG: 14.35; p < 0.001, d = 1.445); GS exhibited a 10% intervention-induced increase in the EG relative to the CG (EG: 0.9 vs CG: 0.81; p < 0.001, d = 1.146). The specific data distribution is shown in Figure 3c, and the specific values are shown in Supplementary Table S3.
Secondary Outcomes
Comparison of EG
6WMT was significantly increased by 10.59% after the experiment (Pre: 304, Post: 340, p < 0.001, r = 0.966); BFM was significantly decreased by 4.42% after the experiment (Pre: 19.7, Post: 18.83, p < 0.001, r = 0.923); SLM was significantly increased by 5.68% after the experiment (Pre: 34.21, Post: 36.27, p < 0.001, d = 0.829); FFM was significantly increased by 2.55% after the experiment (Pre: 38.67, Post: 39.68, p < 0.001, d = 0.773); TUG was significantly decreased by 6.31% after the experiment (Pre: 15.54, Post: 14.56, p < 0.001, d = 0.923); TB was significantly decreased by 9.32% after the experiment (Pre: 10.84, Post: 9.83, p < 0.001, d = 1.563); AC-R was significantly increased by 7.69% after the experiment (Pre: 12, Post: 13, p = 0.005, r = 0.644); AC-L was significantly increased by 7.69% after the experiment (Pre: 12, Post: 13, p < 0.001, r = 1). The specific data distribution is shown in Figure 4a, and the specific values are shown in Supplementary Table S4.
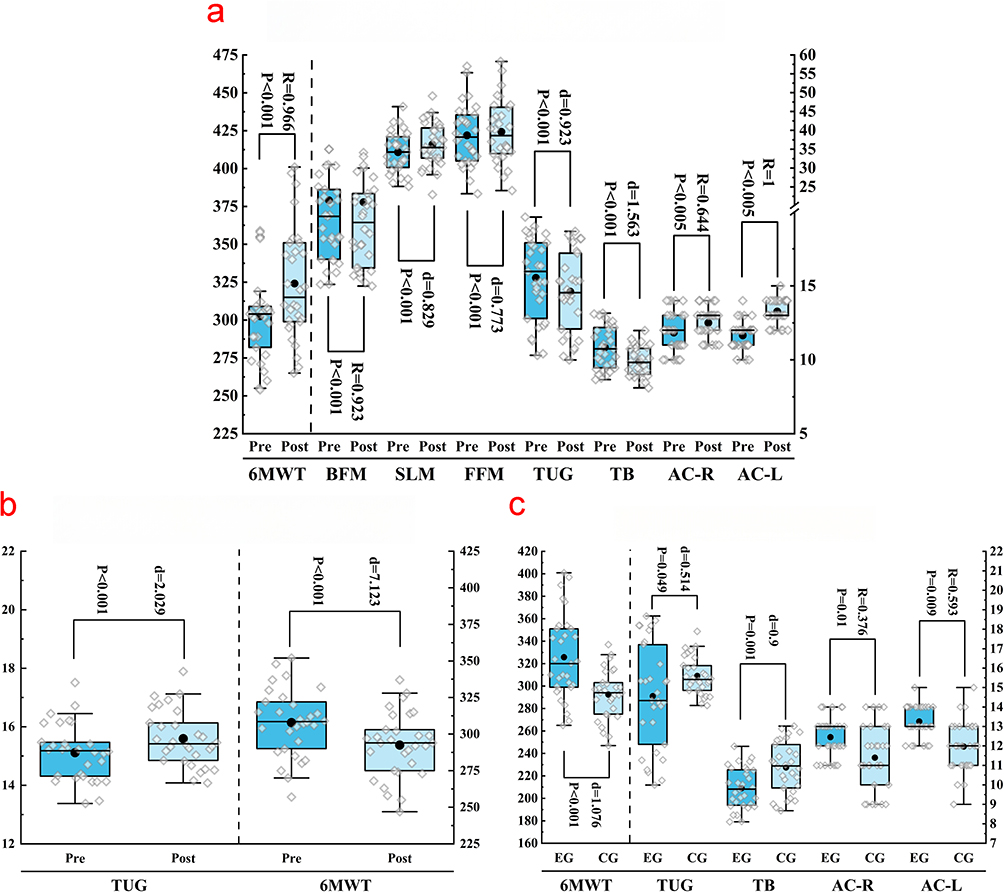 |
Figure 4 Parameter comparison of secondary outcomes. (a) Comparison of experimental group before and after intervention; (b): comparison of control group before and after intervention; (c): Comparison between the experimental group and the control group after intervention. Confidence interval 5%. Abbreviations: 6MWT, 6-Minute Walk Test; BFM, Body Fat Mass; SLM, Skeletal Lean Mass; FFM, Fat-Free Mass; TUG, Timed Up and Go Test; TB, Tandem Balance test; AC-R, Arm Curl-Right; AC-L, Arm Curl-Left. Pre, before the experiment; Post, after the experiment. d, Cohen’s d; R, Rank-Biserial correlation coefficient; EG, experimental group; CG, control group. |
Comparison of CG
TUG was significantly increased by 3.08% after the experiment (Pre: 15.12, Post: 15.6, p < 0.001, d = 2.029); 6MWT was significantly decreased by 5.19% after the experiment (Pre: 308, Post: 292, p < 0.001, d = 7.123). There was no significant difference in other parameters. The specific data distribution is shown in Figure 4b, and the specific values are shown in Supplementary Table S4.
Comparison of EG and CG
6MWT exhibited a 10.43% intervention-induced increase in the EG relative to the CG (EG: 326 vs CG: 292; p < 0.001, d = 1.076); TUG exhibited a 6.67% intervention-induced decrease in the EG relative to the CG (EG: 14.56 vs CG: 15.6; p = 0.049, d = 0.514); TB exhibited a 9.73% intervention-induced decrease in the EG relative to the CG (EG: 9.83 vs CG: 10.89; p = 0.001, d = 0.9); AC-R exhibited a 15.38% intervention-induced increase in the EG relative to the CG (EG: 13 vs CG: 11; p = 0.01, r = 0.376); AC-L exhibited a 7.69% intervention-induced increase in the EG relative to the CG (EG: 13 vs CG: 12; p = 0.009, r = 0.593); The specific data distribution is shown in Figure 4c, and the specific values are shown in Supplementary Table S4.
Other Outcomes
Comparison of EG
SPPB was significantly increased by 10% after the experiment (Pre: 9, Post: 10, p < 0.001, r = 1); EQ-VAS was significantly increased by 0.8% after the experiment (Pre: 68.58, Post: 69.13, p = 0.002, d = 0.593); EQ-5D-5L was significantly increased by 1.3% after the experiment (Pre: 0.76, Post: 0.77, p < 0.001, d = 0.975). There was no significant difference in other parameters. The specific data distribution is shown in Figure 5a, and the specific values are shown in Supplementary Table S5.
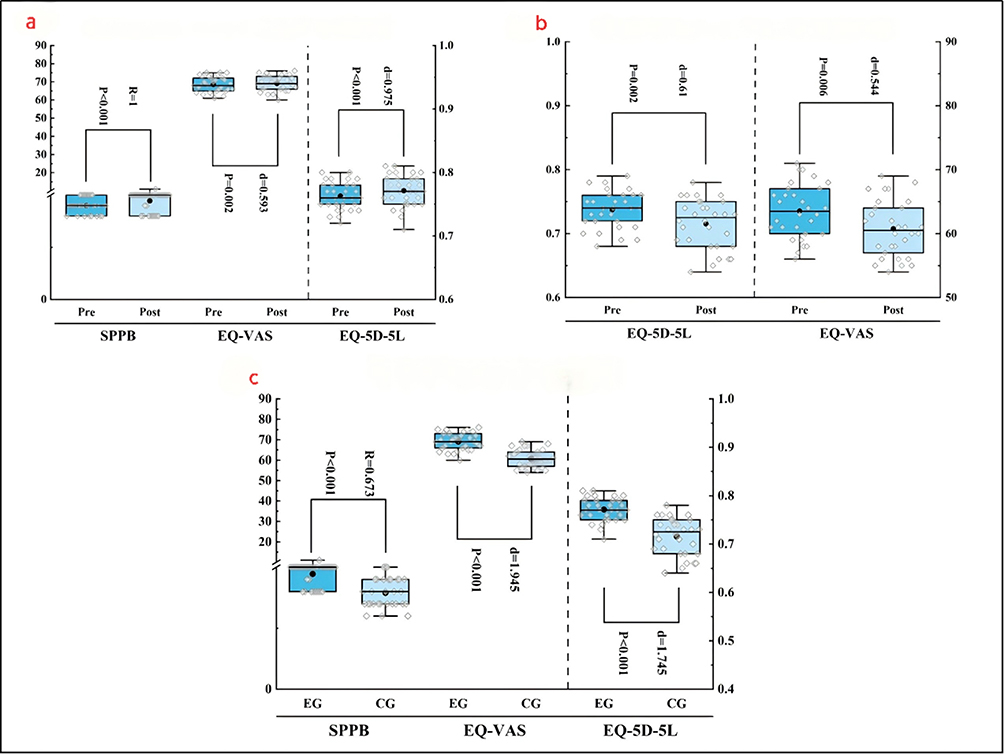 |
Figure 5 Parameter comparison of other outcomes. (a) Comparison of experimental group before and after intervention; (b): comparison of control group before and after intervention; (c): Comparison between the experimental group and the control group after intervention. Confidence interval 5%. Abbreviations: SPPB, Short Physical Performance Battery; EQ-VAS, EuroQol-Visual Analog Scale; EQ-5D-5L, EuroQol Five-Dimensional Five-Level Questionnaire. Pr, before the experiment; Post, after the experiment. d, Cohen’s d; R, Rank-Biserial correlation coefficient; EG, experimental group; CG, control group. |
Comparison of CG
EQ-5D-5L was significantly decreased by 2.7% after the experiment (Pre: 0.74, Post: 0.72, p = 0.002, d = 0.61); EQ-VAS was significantly decreased by 4.34% after the experiment (Pre: 63.53, Post: 60.77, p = 0.006, d = 0.544). There was no significant difference in other parameters. The specific data distribution is shown in Figure 5b, and the specific values are shown in Supplementary Table S5.
Comparison of EG and CG
SPPB exhibited a 20% intervention-induced increase in the EG relative to the CG (EG: 10 vs CG: 8; p < 0.001, r = 0.673); EQ-VAS exhibited a 12.09% intervention-induced increase in the EG relative to the CG (EG: 69.13 vs CG: 60.77; p < 0.001, d = 1.945); EQ-5D-5L exhibited a 6.49% intervention-induced increase in the EG relative to the CG (EG: 0.77 vs CG: 0.72; p < 0.001, d = 1.745). There was no significant difference in other parameters. The specific data distribution is shown in Figure 5c, and the specific values are shown in Supplementary Table S5.
Correlation Analysis
Correlation of Daily Active Steps with Other Parameters
The number of daily active steps was significantly positively correlated with HS (r = 0.252, p < 0.05) and GS (r = 0.559, p < 0.001). EG was also positively correlated with SPPB and FFP (r = 0.424, p < 0.05; r = 0.398, p < 0.05, respectively). CG was also positively correlated with SMI, SMM, 5 STS and EQ-VAS (r = 0.415, p < 0.05; r = 0.591, p < 0.001; r = 0.552, p < 0.01; r = 0.373, p < 0.05, respectively), as shown in Figure 6.
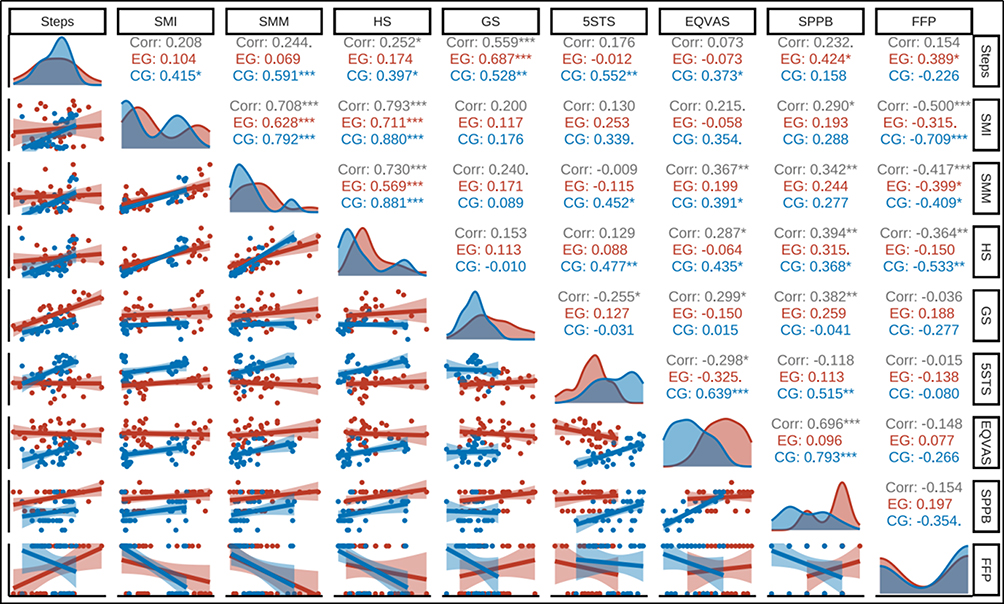 |
Figure 6 Correlation comparison of important parameters. Blue image and text, Experimental Group; Red image and text, Control group; Gray image and text, Correlation *,**,***: It was significant at the 0.05, 0.01, and 0.001 levels. Abbreviations: Steps, daily active steps; SMI, Skeletal Muscle Index; SMM, Skeletal Muscle Mass; HS, Maximum hand grip strength; GS, Gait Speed; 5 STS, 5-repetition Sit-to-Stand Test; EQ-VAS, EuroQol-Visual Analog Scale; SPPB, Short Physical Performance Battery; FFP, Fried frailty phenotype scale; Corr, Correlation coefficient; EG, Experimental group; CG, Control group. |
Correlation of Body Composition with Other Parameters
SMI was positively correlated with SMM, HS and SPPB (r = 0.708, p < 0.001; r = 0.793, p < 0.001; r = 0.29, p < 0.05, respectively). However, SMI was significantly negatively correlated with FFP (r = −0.5, p < 0.001). SMM was positively correlated with HS, EQ-VAS and SPPB (r = 0.73, p < 0.05; r = 0.367, p < 0.01; r = 0.342, p < 0.01, respectively). However, SMM was significantly negatively correlated with FFP (r = −0.417, p < 0.001), as shown in Figure 6.
Correlation of Physical Function with Other Parameters
HS was positively correlated with EQ-VAS and SPPB (r = 0.287, p < 0.05; r = 0.394, p < 0.01, respectively). However, HS was significantly negatively correlated with FFP (r = −0.364, p < 0.01). GS was positively correlated with EQ-VAS and SPPB (r = 0.299, p < 0.05; r = 0.382, p < 0.01, respectively). However, GS was significantly negatively correlated with 5 STS (r = −0.255, p < 0.05). Five STS was significantly negatively correlated with EQ-VAS (r = −0.298, p < 0.05). It should be noted that CG showed a significant positive correlation (r = 0.639, p < 0.001), as shown in Figure 6.
Correlation of Quality of Life with Other Parameters
EQ-VAS was positively correlated with SPPB (r = 0.696, p < 0.001). It should be noted that only CG showed a significant positive correlation (r = 0.793, p < 0.001), as shown in Figure 6.
Discussion
This study demonstrated that 12 weeks of OEP combined with strength training significantly ameliorated sarcopenia in pre-frail elderly individuals residing in nursing homes. Notable improvements were observed across all primary outcome measures in the experimental group, both compared to baseline and relative to the control group. In the experimental group, body composition showed an increase in SMI by 8.22% and SMM by 11.22%; physical function exhibited enhancements in HS-R, HS-L, and GS by 11.43%, 5.14%, and 5.59%, respectively; quality of life metrics improved, with SPPB increasing by 10% and EQ-5D-5L by 1.3%. However, in the control group, several parameters were observed to decrease to varying degrees of significance, as shown by: SMI decreased by 0.55%, HS-R decreased by 2.14%, HS-L decreased by 1.46%, GS decreased by 5.81%, TUG decreased by −3.17%, 6MWT decreased by 4.99%, EQ-5D-5L decreased by 2.7%, and EQ-VAS decreased by 4.34%.
This suggests that body composition, physical function, and quality of life in the control group may have deteriorated at varying rates and to varying degrees over 12 weeks.
This seems to warn people that intervention for such patients are urgent and necessary. These findings address the limitations of prior community-based studies and, for the first time, validate the feasibility of multi-component exercise interventions incorporating resistance training for institutionalized elderly populations.
All outcome measures included in this study are worthy of discussion. We observed significant intra-group and inter-group differences and significant deterioration in the CG group for parameters such as SMI, HS-R, HS-L, GS, 6MWT, TUG, EQ-VAS, EQ-5D-5L. In a meta-analysis, Yi Mo et al reported significant improvements in grip strength (SMD = 1.68, p = 0.04), exercise capacity (SMD = −2.15, p < 0.01), and quality of life (SMD = −1.571, p = 0.07) with OEP.10 In another meta-analysis reported by Shuang Wu et al, subgroup analysis shows that a course longer than 30 minutes is more effective than a course shorter than 30 minutes (p < 0.001), and a course longer than 12 weeks is more effective than a course shorter than 12 weeks (p = 0.02).35 A meta-analysis by Linqian Lu et al reported significant improvements in resistance training for GS (SMD = 2.01, p < 0.0001) and TUG (SMD = −0.66, p < 0.0001).36 Haotian Zhao et al reported in their meta-analysis that resistance training can significantly improve SMI (p < 0.05), GS (p < 0.05), HS (p < 0.05).37 At the same time, they considered 40 to 60 minutes of elastic band training, 3 times a week, for more than 12 weeks to be the most effective exercise prescription for sarcopenia (p < 0.05). These studies are generally consistent with our results. However, we did not find any studies that reported a further deterioration in these parameters in the same control group that performed only daily activities for 12 weeks. Next, we observed significant intra-group and inter-group differences in parameters such as SMM, 5 STS, TB, AC-R, AC-L, and SPPB. Anne-Gabrielle Mittaz Hager et al reported that OEP improved 5 STS (p = 0.002) and SPPB scores (p = 0.027) in a multicenter randomized controlled trial.38 Sanna Vikberg et al reported in a randomized controlled trial that resistance training also had a positive effect on 5 STS (- 0.9s, p = 0.01) and SPPB scores (+0.5, p = 0.02),39 and we found that the results were even more significant (5 STS −1.35s, p < 0.001; SPPB +2, p < 0.001). The difference may be due to the fact that our intervention combined OEP and strength training and lasted an additional 2 weeks. Hung-Ting Chen reported in a clinical trial that 12 weeks of resistance training significantly increased SMM (p = 0.005).40 Montserrat Otero et al reported in a clinical trial that 24 weeks of exercise (3 times per week, including 20 minutes of strength training) significantly improved AC (80%, p < 0.001).41 Our study showed an increase of only 15.38%. This may be due to differences in participants and intervention cycles. Thereafter, BFM, SLM, and FFM were observed to exhibit significant improvements only at the baseline of EG and three months thereafter. It is evident that the synergistic effect of muscle gain and fat loss confers substantial benefits to individuals with sarcopenia. As reported by Sanna Vikberg et al in a randomized controlled trial, resistance training resulted in an increase of lean body mass by 1147 grams while simultaneously reducing fat mass by 553 grams.39 Our findings indicate that SLM increased by 5.68%, whereas BFM decreased by 4.42%. Finally, no significant differences were observed in Weight, BMI, and Freid scores. Notably, the frailty of participants in both the EG and CG exhibited a worsening trend based on the data (EG pre: 1.39±0.5, EG post: 1.52±0.51; CG pre: 1.53±0.51, CG post: 1.63±0.49). A twelve-week intervention combining OEP with strength training did not appear to mitigate Frailty effectively. These findings raise questions regarding the efficacy of exercise interventions alone for frail older adults. Additionally, we are concerned by the report from Tsung-Jen Hsieh et al, who conducted a randomized controlled trial demonstrating that an intervention combining exercise with nutritional supplementation was beneficial for frail older adults (Freid score −0.34, p < 0.001).42 In future clinical trials, we aim to focus on integrating exercise with nutritional strategies for frail older adults, particularly emphasizing the development of a detailed nutritional supplementation plan as suggested by S. K. Jyvakorpi et al in the SPRINTT project. Nutritional goals should include a daily protein intake of 1.0–1.2 g/kg body weight, a daily energy intake of 25–30 kcal/kg body weight, and a serum vitamin D concentration of ≥75 mmol/L.43
Our results include correlation analysis among the parameters. First, we found a significant positive correlation between daily Steps (Steps) and GS (r = 0.559, p < 0.001). This means that an appropriate increase in the number of daily steps taken in the intervention may increase the participants’ gait speed. Secondly, we found that SMI was significantly positively correlated with HS (r = 0.793, p < 0.001) and negatively correlated with FFP (r = −0.5, p < 0.001). Meanwhile, SMM was positively correlated with HS, EQ-VAS and SPPB (r = 0.73, p < 0.001; r = 0.367, p < 0.01; r = 0.342, p < 0.01) was significantly negatively correlated with FFP (r = −0.417, p < 0.001). This means that increased skeletal muscle may lead to improvements in grip strength and quality of life, while reducing the degree of frailty. Finally, we found that HS was significantly positively correlated with SPPB (r = 0.394, p < 0.01) and negatively correlated with FFP (r = −0.364, p < 0.01). At the same time, GS was significantly positively correlated with SPPB (r = 0.382, p < 0.01), and negatively correlated with 5STS (r = −0.255, p < 0.05). This means that improvements in physical function may lead to improvements in quality of life, increased grip strength may reduce frailty, and increased lower limb strength may improve gait speed and 5 STS time. In summary, the increase of skeletal muscle is closely related to physical functional performance, and their interaction is positive. Both clinical interventions and daily care need to consider options that enhance both skeletal muscle mass and physical functional performance to improve quality of life and reduce frailty.
Limitations and Future Directions
Limitations
First of all, we only recruited in one nursing center, and the recruitment conditions were strict, resulting in a small sample size and skewed distribution of some data, which limited our further analysis. Secondly, the problems exposed by this short-term three-month experiment do not fully illustrate the problems that exist in the real world, and longer intervention cycles are needed to prove these problems. Last but not least, the study could not be blinded between the intervention and control groups, which led to potential expectancy bias, particularly with respect to self-reported quality-of-life measures.
Future Research Should
First, it is necessary to recruit from multiple institutions and expand the study sample size, such as conducting multi-center randomized controlled trials. Second, we suggest that future studies carry out subgroup analyses to expose gender-specific issues. Finally, if you want to intervene for patients with sarcopenia in the early stage of frailty, it is best to combine exercise and nutrition. It is worth mentioning that we observed during the intervention period that older patients with pre-frailty and sarcopenia (Age: 81.41±5.14) needed longer intervals to ensure the quality of the completed movements. The lack of improvement or even slight worsening of frailty scores in pre-frail patients may indicate that the intensity of the intervention was still insufficient or that it did not incorporate a multidimensional intervention including nutrition, cognition and social engagement.
Conclusion
This study is the first to demonstrate that a multicomponent exercise intervention program that adds additional resistance training to the Otago Exercise Program (OEP) can significantly improve sarcopenia parameters in pre-frailty older adults in nursing home settings. Secondly, the effect of the program on frailty was not as good, possibly because the intensity of the intervention was insufficient or the multidimensional intervention including nutrition, cognition and social engagement was not included. Finally, improved skeletal muscle and physical performance may lead to better quality of life and reduced frailty.
Institutional Review Board Statement
This study was conducted in accordance with the principles of the World Medical Association Declaration of Helsinki and was approved by the Ethics Committee of Kunming Medical University (KMMU2025MEC120). The full study protocol is registered at ClinicalTrials.gov (NCT06882720). After the experiment began, the research method did not change significantly. The study follows standards for transparency, openness, and reproducibility of research and complies with CONSORT standards.
Data Sharing Statement
The datasets generated during and/or analyzed during the current study are available from the first author (Neng Pan, Email: [email protected]) or the corresponding (Zbigniew Ossowski) upon reasonable request.
Informed Consent Statement
The participants provided informed consent before testing.
Acknowledgments
We would like to thank Kunming Medical University, Kunming YI XIN YI YANG Nursing Home and all participants for their support of this study.
Author Contributions
All authors made a significant contribution to the work reported, whether that is in the conception, study design, execution, acquisition of data, analysis and interpretation, or in all these areas; took part in drafting, revising or critically reviewing the article; gave final approval of the version to be published; have agreed on the journal to which the article has been submitted; and agree to be accountable for all aspects of the work.
Funding
No external funding was provided for this study.
Disclosure
The authors declare no conflicts of interest in this work.
References
1. Global, regional, and national burden of diseases and injuries for adults 70 years and older: systematic analysis for the global burden of disease 2019 Study. BMJ. 2022;376:e068208.
2. Walston J, Fried LP. Frailty and the older man. Med Clin North Am. 1999;83(5):1173–1194. doi:10.1016/S0025-7125(05)70157-7
3. Fried LP, Tangen CM, Walston J, et al. Frailty in older adults: evidence for a phenotype. J Gerontol a Biol Sci Med Sci. 2001;56(3):M146–156. doi:10.1093/gerona/56.3.M146
4. Ye L, Liang R, Liu X, Li J, Yue J, Zhang X. Frailty and sarcopenia: a bibliometric analysis of their association and potential targets for intervention. Ageing Res Rev. 2023;92:102111. doi:10.1016/j.arr.2023.102111
5. Cruz-Jentoft AJ, Bahat G, Bauer J, et al. Sarcopenia: revised European consensus on definition and diagnosis. Age Ageing. 2019;48(1):16–31. doi:10.1093/ageing/afy169
6. Chen LK, Woo J, Assantachai P, et al. Asian working group for sarcopenia: 2019 consensus update on sarcopenia diagnosis and treatment. J Am Med Dir Assoc. 2020;21(3):300–307.e302. doi:10.1016/j.jamda.2019.12.012
7. Sato R, Vatic M, Peixoto da Fonseca GW, Anker SD, von Haehling S. Biological basis and treatment of frailty and sarcopenia. Cardiovasc Res. 2024;120(9):982–998. doi:10.1093/cvr/cvae073
8. Schiaffino S, Reggiani C, Akimoto T, Blaauw B. Molecular Mechanisms of Skeletal Muscle Hypertrophy. J Neuromuscul Dis. 2021;8(2):169–183. doi:10.3233/JND-200568
9. Chodzko-Zajko WJ, Proctor DN, Fiatarone Singh MA, et al. American college of sports medicine position stand. exercise and physical activity for older adults. Med Sci Sports Exerc. 2009;41(7):1510–1530. doi:10.1249/MSS.0b013e3181a0c95c
10. Yi M, Zhang W, Zhang X, Zhou J, Wang Z. The effectiveness of Otago exercise program in older adults with frailty or pre-frailty: a systematic review and meta-analysis. Arch Gerontol Geriatr. 2023;114:105083. doi:10.1016/j.archger.2023.105083
11. Yang Y, Wang K, Liu H, et al. The impact of Otago exercise programme on the prevention of falls in older adult: a systematic review. Front Public Health. 2022;10:953593. doi:10.3389/fpubh.2022.953593
12. Liew LK, Tan MP, Tan PJ, et al. The modified otago exercises prevent grip strength deterioration among older fallers in the malaysian falls assessment and intervention trial (MyFAIT). J Geriatr Phys Ther. 2019;42(3):123–129. doi:10.1519/JPT.0000000000000155
13. Gillespie LD, Robertson MC, Gillespie WJ, et al. Interventions for preventing falls in older people living in the community. Cochrane Database Syst Rev. 2012;2012(9):Cd007146. doi:10.1002/14651858.CD007146.pub3
14. Nicholson WK, Silverstein M, Wong JB, et al. Interventions to prevent falls in community-dwelling older adults: us preventive services task force recommendation statement. JAMA. 2024;332(1):51–57. doi:10.1001/jama.2024.8481
15. Albornos-Muñoz L, Blanco-Blanco J, Cidoncha-Moreno M, et al. Efficacy of the Otago-Exercise-Programme to reduce falls in community-dwelling adults aged 65-80 when delivered as group or individual training: non-inferiority-clinical-trial. BMC Nurs. 2024;23(1):705. doi:10.1186/s12912-024-02310-3
16. Martin FC. O’Halloran AM: tools for assessing frailty in older people: general concepts. Adv Exp Med Biol. 2020;1216:9–19.
17. Gardner MM, Buchner DM, Robertson MC, Campbell AJ. Practical implementation of an exercise-based falls prevention programme. Age Ageing. 2001;30(1):77–83. doi:10.1093/ageing/30.1.77
18. Benavent-Caballer V, Rosado-Calatayud P, Segura-Ortí E, Amer-Cuenca JJ, Lisón JF. The effectiveness of a video-supported group-based Otago exercise programme on physical performance in community-dwelling older adults: a preliminary study. Physiotherapy. 2016;102(3):280–286. doi:10.1016/j.physio.2015.08.002
19. Sherrington C, Whitney JC, Lord SR, Herbert RD, Cumming RG, Close JC. Effective exercise for the prevention of falls: a systematic review and meta-analysis. J Am Geriatr Soc. 2008;56(12):2234–2243. doi:10.1111/j.1532-5415.2008.02014.x
20. Liu-Ambrose T, Davis JC, Best JR, et al. Effect of a home-based exercise program on subsequent falls among community-dwelling high-risk older adults after a fall: a randomized clinical trial. JAMA. 2019;321(21):2092–2100. doi:10.1001/jama.2019.5795
21. Han DS, Chang KV, Li CM, et al. Skeletal muscle mass adjusted by height correlated better with muscular functions than that adjusted by body weight in defining sarcopenia. Sci Rep. 2016;6:19457. doi:10.1038/srep19457
22. Liu CJ, Marie D, Fredrick A, Bertram J, Utley K, Fess EE. Predicting hand function in older adults: evaluations of grip strength, arm curl strength, and manual dexterity. Aging Clin Exp Res. 2017;29(4):753–760. doi:10.1007/s40520-016-0628-0
23. Mehmet H, Robinson SR, Yang AWH. Assessment of gait speed in older adults. J Geriatr Phys Ther. 2020;43(1):42–52. doi:10.1519/JPT.0000000000000224
24. Bohannon RW. Reference values for the five-repetition sit-to-stand test: a descriptive meta-analysis of data from elders. Percept Mot Skills. 2006;103(1):215–222.
25. McLester CN, Nickerson BS, Kliszczewicz BM, McLester JR. Reliability and agreement of various inbody body composition analyzers as compared to dual-energy x-ray absorptiometry in healthy men and women. J Clin Densitom. 2020;23(3):443–450. doi:10.1016/j.jocd.2018.10.008
26. Ribeiro SM, Kehayias JJ. Sarcopenia and the analysis of body composition. Adv. Nutr. 2014;5(3):260–267. doi:10.3945/an.113.005256
27. Patrizio E, Calvani R, Marzetti E, Cesari M. Physical Functional Assessment in Older Adults. J Frailty Aging. 2021;10(2):141–149. doi:10.14283/jfa.2020.61
28. Podsiadlo D, Richardson S. The timed “Up & Go”: a test of basic functional mobility for frail elderly persons. J Am Geriatr Soc. 1991;39(2):142–148. doi:10.1111/j.1532-5415.1991.tb01616.x
29. Ramsey KA, Rojer AGM, D’Andrea L, et al. The association of objectively measured physical activity and sedentary behavior with skeletal muscle strength and muscle power in older adults: a systematic review and meta-analysis. Ageing Res Rev. 2021;67:101266. doi:10.1016/j.arr.2021.101266
30. Nejatian Hoseinpour A, Bassami M, Ahmadizad S, et al. The influence of resistance training on inflammatory markers, body composition and functional capacity in healthy older adults: a systematic review and meta-analysis. Arch Gerontol Geriatr. 2025;130:105731. doi:10.1016/j.archger.2024.105731
31. Beck Jepsen D, Robinson K, Ogliari G, et al. Predicting falls in older adults: an umbrella review of instruments assessing gait, balance, and functional mobility. BMC Geriatr. 2022;22(1):615. doi:10.1186/s12877-022-03271-5
32. Meng S, He X, Fu X, et al. The prevalence of sarcopenia and risk factors in the older adult in China: a systematic review and meta-analysis. Front Public Health. 2024;12:1415398. doi:10.3389/fpubh.2024.1415398
33. Zhou T, Guan H, Wang L, Zhang Y, Rui M, Ma A. Health-related quality of life in patients with different diseases measured with the EQ-5D-5L: a systematic review. Front Public Health. 2021;9:675523. doi:10.3389/fpubh.2021.675523
34. Pavasini R, Guralnik J, Brown JC, et al. short physical performance battery and all-cause mortality: systematic review and meta-analysis. BMC Med. 2016;14(1):215. doi:10.1186/s12916-016-0763-7
35. Wu S, Guo Y, Cao Z, et al. Effects of Otago exercise program on physical function in older adults: a systematic review and meta-analysis of randomized controlled trials. Arch Gerontol Geriatr. 2024;124:105470. doi:10.1016/j.archger.2024.105470
36. Lu L, Mao L, Feng Y, Ainsworth BE, Liu Y, Chen N. Effects of different exercise training modes on muscle strength and physical performance in older people with sarcopenia: a systematic review and meta-analysis. BMC Geriatr. 2021;21(1):708. doi:10.1186/s12877-021-02642-8
37. Zhao H, Cheng R, Song G, et al. The effect of resistance training on the rehabilitation of elderly patients with sarcopenia: a meta-analysis. Int J Environ Res Public Health. 2022;19(23).
38. Hager AM, Mathieu N, Carrard S, Bridel A, Wapp C, Hilfiker R. Partially supervised exercise programmes for fall prevention improve physical performance of older people at risk of falling: a three-armed multi-centre randomised controlled trial. BMC Geriatr. 2024;24(1):311. doi:10.1186/s12877-024-04927-0
39. Vikberg S, Sörlén N, Brandén L, et al. Effects of resistance training on functional strength and muscle mass in 70-year-old individuals with pre-sarcopenia: a randomized controlled trial. J Am Med Dir Assoc. 2019;20(1):28–34. doi:10.1016/j.jamda.2018.09.011
40. Chen HT, Wu HJ, Chen YJ, Ho SY, Chung YC. Effects of 8-week kettlebell training on body composition, muscle strength, pulmonary function, and chronic low-grade inflammation in elderly women with sarcopenia. Exp Gerontol. 2018;112:112–118. doi:10.1016/j.exger.2018.09.015
41. Otero M, Esain I, Á m G-S, Gil SM. The effectiveness of a basic exercise intervention to improve strength and balance in women with osteoporosis. Clin Interv Aging. 2017;12:505–513. doi:10.2147/CIA.S127233
42. Hsieh TJ, Su SC, Chen CW, et al. Individualized home-based exercise and nutrition interventions improve frailty in older adults: a randomized controlled trial. Int J Behav Nutr Phys Act. 2019;16(1):119. doi:10.1186/s12966-019-0855-9
43. Jyväkorpi SK, Ramel A, Strandberg TE, et al. The sarcopenia and physical frailty in older people: multi-component treatment strategies (SPRINTT) project: description and feasibility of a nutrition intervention in community-dwelling older Europeans. Eur Geriatr Med. 2021;12(2):303–312. doi:10.1007/s41999-020-00438-4
 © 2025 The Author(s). This work is published and licensed by Dove Medical Press Limited. The
full terms of this license are available at https://www.dovepress.com/terms
and incorporate the Creative Commons Attribution
- Non Commercial (unported, 4.0) License.
By accessing the work you hereby accept the Terms. Non-commercial uses of the work are permitted
without any further permission from Dove Medical Press Limited, provided the work is properly
attributed. For permission for commercial use of this work, please see paragraphs 4.2 and 5 of our Terms.
© 2025 The Author(s). This work is published and licensed by Dove Medical Press Limited. The
full terms of this license are available at https://www.dovepress.com/terms
and incorporate the Creative Commons Attribution
- Non Commercial (unported, 4.0) License.
By accessing the work you hereby accept the Terms. Non-commercial uses of the work are permitted
without any further permission from Dove Medical Press Limited, provided the work is properly
attributed. For permission for commercial use of this work, please see paragraphs 4.2 and 5 of our Terms.
Recommended articles
Physical Activity Mediates the Relationship Between Sarcopenia and Cognitive Function Among Older Adults in Nursing Homes
Yao X, Liu B, Hua N, Huang J, Zhao X
Clinical Interventions in Aging 2023, 18:1863-1871
Published Date: 13 November 2023
Imaging of Sarcopenia in Type 2 Diabetes Mellitus
Wang D, Zhang G, Yu Y, Zhang Z
Clinical Interventions in Aging 2024, 19:141-151
Published Date: 26 January 2024
Four-Step Co-Designing of the Reablement Strategies Targeting Sarcopenia (ReStart-S): An Exercise-Based Multicomponent Program for Older Adults Residing in Long-Term Care Settings
Kumar P, Umakanth S, Marzetti E, Kalra S, N G
Journal of Multidisciplinary Healthcare 2024, 17:1415-1433
Published Date: 28 March 2024
Interprofessional Management of (Risk of) Malnutrition and Sarcopenia: A Grounded Theory Study from the Perspective of Professionals
Boxum SD, van Exter SH, Reinders JJ, Koenders N, Drenth H, van den Berg MGA, Tieland M, Spoorenberg SLW, Finnema EJ, van der Wees PJ, Jager-Wittenaar H
Journal of Multidisciplinary Healthcare 2024, 17:4677-4692
Published Date: 9 October 2024
Semaglutide Therapy and Accelerated Sarcopenia in Older Adults with Type 2 Diabetes: A 24-Month Retrospective Cohort Study
Ren Q, Zhi L, Liu H
Drug Design, Development and Therapy 2025, 19:5645-5652
Published Date: 3 July 2025