Back to Journals » International Journal of Chronic Obstructive Pulmonary Disease » Volume 17
Differential Expression of Serum Proteins in Chronic Obstructive Pulmonary Disease Assessed Using Label-Free Proteomics and Bioinformatics Analyses
Authors Li R ![]() , Zhao X, Liu P, Wang D, Chen C, Wang Y, Zhang N, Shen B
, Zhao X, Liu P, Wang D, Chen C, Wang Y, Zhang N, Shen B ![]() , Zhao D
, Zhao D ![]()
Received 27 July 2022
Accepted for publication 2 November 2022
Published 15 November 2022 Volume 2022:17 Pages 2871—2891
DOI https://doi.org/10.2147/COPD.S383976
Checked for plagiarism Yes
Review by Single anonymous peer review
Peer reviewer comments 4
Editor who approved publication: Professor Min Zhang
Renming Li,1,* Xiaomin Zhao,1,* Pengcheng Liu,1 Dandan Wang,1 Chen Chen,1 Yu Wang,1 Ningning Zhang,1 Bing Shen,2 Dahai Zhao1
1Department of Respiratory and Critical Care Medicine, the Second Affiliated Hospital of Anhui Medical University, Hefei, 230601, People’s Republic of China; 2School of Basic Medical Sciences, Anhui Medical University, Hefei, 230032, People’s Republic of China
*These authors contributed equally to this work
Correspondence: Dahai Zhao, Department of Respiratory and Critical Care Medicine, the Second Affiliated Hospital of Anhui Medical University, 678 Furong Road, Hefei, 230601, People’s Republic of China, Tel +86-551-63869656, Email [email protected] Bing Shen, School of Basic Medical Sciences, Anhui Medical University, 81 Meishan Road, Hefei, 230032, People’s Republic of China, Tel +86-551-65161132, Fax +86-551-65161126, Email [email protected]
Purpose: As a common respiratory disease, chronic obstructive pulmonary disease (COPD) has a high morbidity and mortality. Current clinical therapies are not ideal and do not improve lung function or long-term life quality. It is very important to find new potential pathogenic mechanisms, biomarkers, and targets with therapeutic value in COPD.
Methods: Serum samples collected from acute exacerbation and stable COPD and healthy participants were analyzed using label-free liquid chromatography tandem mass spectrometry to identify the differentially expressed proteins (DEPs) between two groups. Bioinformatics analyses were performed to determine the biological processes associated with those DEPs. Key proteins were validated by enzyme linked immunosorbent assay (ELISA).
Results: In total, 661 proteins were detected in serum from patients with COPD and healthy participants. Compared with healthy participants, patients with acute exacerbation of COPD had 45 DEPs, 13 were upregulated and 32 were downregulated; and patients with stable COPD had 79 DEPs, 18 were upregulated and 61 were downregulated. Gene Ontology functional annotation results indicated that the DEPs identified in patients with COPD were associated with the terms cellular anatomical entity, binding, and cellular process. Kyoto Encyclopedia of Genes and Genomes functional annotation analysis and the Clusters of Orthologous Genes database analysis indicated that the functions of these DEPs were primarily in signal transduction mechanisms and amino acid transport and metabolism. The ELISA results for three key proteins of IGFBP2, LRG1 and TAGLN were consistent with the LC-MS/MS results and the area under the receiver operating characteristic of the combined index was 0.893 (95% CI: 0.813, 0.974).
Conclusion: Our findings suggested pathogenic mechanisms underlying COPD stages and indicated three key proteins that may warrant further study as potential biomarkers for early diagnosis or prognosis of COPD or as therapeutic targets.
Keywords: chronic obstructive pulmonary disease, respiration, proteomics, differentially expressed proteins, bioinformatics, LC-MC/MS
Introduction
Chronic obstructive pulmonary disease (COPD) is a common, preventable, and treatable disease. Characterization of COPD includes persistent respiratory symptoms and airflow limitation due to airway or alveolar abnormalities typically caused by significant exposure to noxious particles or gases.1 It is well documented that COPD is a heterogeneous and multifaceted disease affected by genetic and environmental factors.2 The World Health Organization reports that by 2030, COPD will rank third among chronic diseases that cause morbidity and death.3 Studies also predict that every year, 4.5 million people will die of COPD and its related diseases by 2030, and more than 5.4 million by 2060.4 China Pulmonary Health analyzed data from 50,991 people, including 21,446 men and 29,545 women, to determine the prevalence of spirometry-defined COPD to be 8.6%. The report further pointed out that there are approximately 99.9 million people with COPD in China, of which the prevalence rate among males is 11.9%, and among females, it is 5.4%. The prevalence rate among people aged 40 years or older is higher than that among people aged 20 to 39 years.5,6 COPD has a high incidence, disability rate, and mortality rate worldwide. Therefore, studies leading to increased prevention and treatment for COPD are urgent.
Given the higher risks and expenses associated with surgical therapies, few patients select this treatment. Thus, at present, treatment of COPD mainly relies on internal medicine therapies. The three classes of clinical therapeutic agents currently used to treat COPD exacerbations are bronchodilators, antibiotics and corticosteroids.7–9 COPD is a recurrent disease that requires long-term drug control, which can lead to drug resistance and adverse effects, such as immunosuppression, osteoporosis, glaucoma, and cataracts. Although those agents dilate bronchi, improve symptoms, and reduce deterioration, they do not target the specific causes inducing COPD. In addition, no study has shown that these drugs improve the lung function of patients, medication compliance, and long-term quality of life. Therefore, the development of new therapeutic agents for etiological treatment rather than symptomatic treatment of COPD are needed.10,11
With the relatively recent development of proteomics using high-sensitivity mass spectrometry (MS), the sensitivity, accuracy, and speed of protein profiling technology have been greatly improved, aiding the study of COPD.12 For example, Nicholas et al collected sputum samples from 15 patients with COPD and 18 healthy smokers, and used two-dimensional gel electrophoresis and mass spectrometric identification techniques to identify 40 DEPs between the two groups.13 Such studies analyzing proteomics and peptide profiles in serum samples obtained from patients with COPD may identify biomarkers linked to the occurrence and development of the disease. Liquid chromatography tandem mass spectrometry (LC-MS/MS) is a powerful proteomics methods that can identify many differentially expressed proteins (DEPs) with high sensitivity and specificity. We may effectively find key proteins involving the occurrence and development of COPD through LC-MS/MS experiment. Thus, the present study used this strategy. We collected serum samples from healthy control participants, patients with acute exacerbation of COPD, and patients with stable COPD, and utilized label-free LC-MS/MS methods to identify DEPs. We further employed bioinformatics methods to analyze the signaling pathways associated with the DEPs and to determine whether any of them may be associated with the development of acute exacerbation or stable COPD.
Materials and Methods
Clinical Information and Sample Collection
From August to September 2021, among patients admitted to the Department of Respiratory and Critical Care Medicine, the Second Affiliated Hospital of Anhui Medical University, 11 serum samples were collected for LC-MC/MS experiments. Of them, eight serum samples were collected from patients with COPD, of which five patients were in an acute exacerbation stage and three patients were in a stable stage, and the remaining three samples were from healthy control volunteers. All clinical diagnoses followed the Global Initiative for Chronic Obstructive Lung Disease in 2021 guidelines.
The research was in compliance with the Declaration of Helsinki. Before the experiment, the research proposal was submitted to the Medical Research Ethics Committee of the Second Affiliated Hospital of Anhui Medical University, which approved the study (Anhui Medical Ethics Approval Number: YX2021-103). The informed consent of each patient was obtained in writing before the study.
Protein Extraction, Quantification, and Quality Control
We used Pierce Top 12 Abundant Protein Depletion Spin Columns (Cat. No. 85165, Thermo) to extract proteins. To determine the concentration of the extracted proteins, we used the Bradford method. All serum samples were subjected to sodium dodecyl sulfate–polyacrylamide gel electrophoresis (SDS-PAGE) to determine the total amount of undegraded protein, and silver staining was used to detect the proteins in the polyacrylamide gel.
Enzymatic Hydrolysis of Protein by Trypsin
We combined 60 μg of the quantified protein with 5 μL of dithiothreitol solution (1 M) in a centrifuge tube. The mixture was kept at 37 °C for 1 h. Then, 20 μL of iodoacetamide solution was added to the centrifuge tube in the dark, and the mixture was left at room temperature for another hour. After centrifuging all samples, we discarded the supernatant. The pellet was mixed with 100 µL of uric acid buffer (8 M urea, 100 mM Tris-HCl; pH 8.0). After three episodes of centrifugation and the removal of the supernatant each time, the resulting precipitate was mixed with NH4HCO3 (50 mM, 100 µL). The mixture was centrifuged three more times and the supernatant was discarded each time. Trypsin was added to an ultrafiltration tube in a ratio of 50:1 protein to trypsin. The samples were digested at 37 °C for 12–16 h.
LC-MS/MS Analysis
To identify the DEPs between the groups, an LC-MS/MS spectroscopic system was used. After the labeled sample was mixed with 40 µL of formic acid aqueous solution (0.1%), the polypeptides in the mixture were separated using a nanoliter flow rate high-performance LC liquid phase system. Phase A of the mobile phase was 0.1% formic acid in water, and phase B was 0.1% formic acid in acetonitrile. The following B phase gradient parameters were used: 0–50 min, increased to 26%; 50–70 min, increased to 38%; 70–71 min, increased to 100%; and 71–78 min, remained at 100%. The obtained peptides were detected using an Orbitrap Fusion Lumos mass spectrometer (Cat. No. 85165, Thermo Scientific).
Sequence Database Search and Analysis
The data obtained through LC-MS/MS analyses were assessed using Proteome Discoverer, version 2.4 software (Thermo Fisher Scientific). Peptide identification was performed by using the human proteomic database containing UniProt sequences.
Gene Ontology (GO), Kyoto Encyclopedia of Genes and Genomes (KEGG), and Clusters of Orthologous Group (COGs) of Proteins Signaling Pathway Analyses
The Gene Ontology Resource (http://www.geneontology.org/) is currently the most common database used to retrieve gene functions, and compared with other databases, it has the most comprehensive content.14,15 The GO knowledge base uses the definition of gene functions (GO terms) to connect these classes to find specific relationships.16 The GO knowledge base defines and describes the functions of genes and proteins and is often used to clarify the roles played by genes and proteins in cells. The GO knowledge base also includes GO annotations, which are primarily used to link terms in the ontology to specific genetic products. To explore the significance of enrichment of the DEPs, we carried out GO functional annotation analysis. All identified DEPs were mapped to their respective GO terms, and then significantly enriched GO functional terms were identified through analyses to determine the significant related biological functions.
KEGG is a set of databases containing various signaling pathways in cellular processes and is mainly used to understand advanced biological functions and utility at the genomic and molecular levels.17 The KOBAS online analysis database (http://kobas.cbi.pku.edu.cn/kobas3) functions include gene/protein functional annotation and functional gene enrichment. This database was used to determine the biochemical metabolic pathways and signal transduction pathways associated with the DEPs.
The COGs database is annotated with the functions of homologous proteins and includes the KOG database (eukaryotic homologous protein clusters) and COG database (prokaryotic homologous protein clusters).18 The number of proteins in the COGs was obtained by comparing the sequence of the proteome with the COG database. Protein functional descriptions and classifications were obtained.19
Enzyme Linked Immunosorbent Assay (ELISA)
In order to verify the results of the LC-MS/MS experiment, serum samples from 30 patients with acute exacerbation of COPD and 30 healthy control volunteers were used to detect leucine-rich alpha-2-glycoprotein (LRG1), insulin-like growth factor binding protein 2 (IGFBP2) and transgelin (TAGLN) protein concentration. All operations are carried out under the guidance of the kit instructions.
Statistical Analysis
In the present study, the Fisher’s chi-square test was used to compare the categorical variable (only gender data). Values are expressed as means ± SEM, and a value of P < 0.05 was considered statistically significant. For the comparison of indicators between two groups, the indicators with normal distribution were tested by independent-samples t test, and the indicators without normal distribution were tested by Mann–Whitney U-test and expressed by P50 (P25, P75). The count data were expressed by case number (n) and percentage (%). We used the ELISA data to draw the receiver operating characteristic (ROC) curves to evaluate the predictive performance of these indicators for the diagnosis of COPD. The main software used for statistical analysis includes GraphPad Prism (version, 9.0.0), SPSS (version, 26.0) and MedCalc (version, 19.6.4).
Results
Participants
There was no significant difference in age between the groups of patients with acute exacerbation of COPD and the healthy control group (67.8 ± 1.2 vs 69.0 ± 2.3 years; P = 0.62), or between the groups of patients with stable COPD and the healthy control group (69.7 ± 2.2 vs 69.0 ± 2.3 years; P = 0.84). The clinical diagnoses and demographic characteristics of the 11 participants are shown in Table 1.
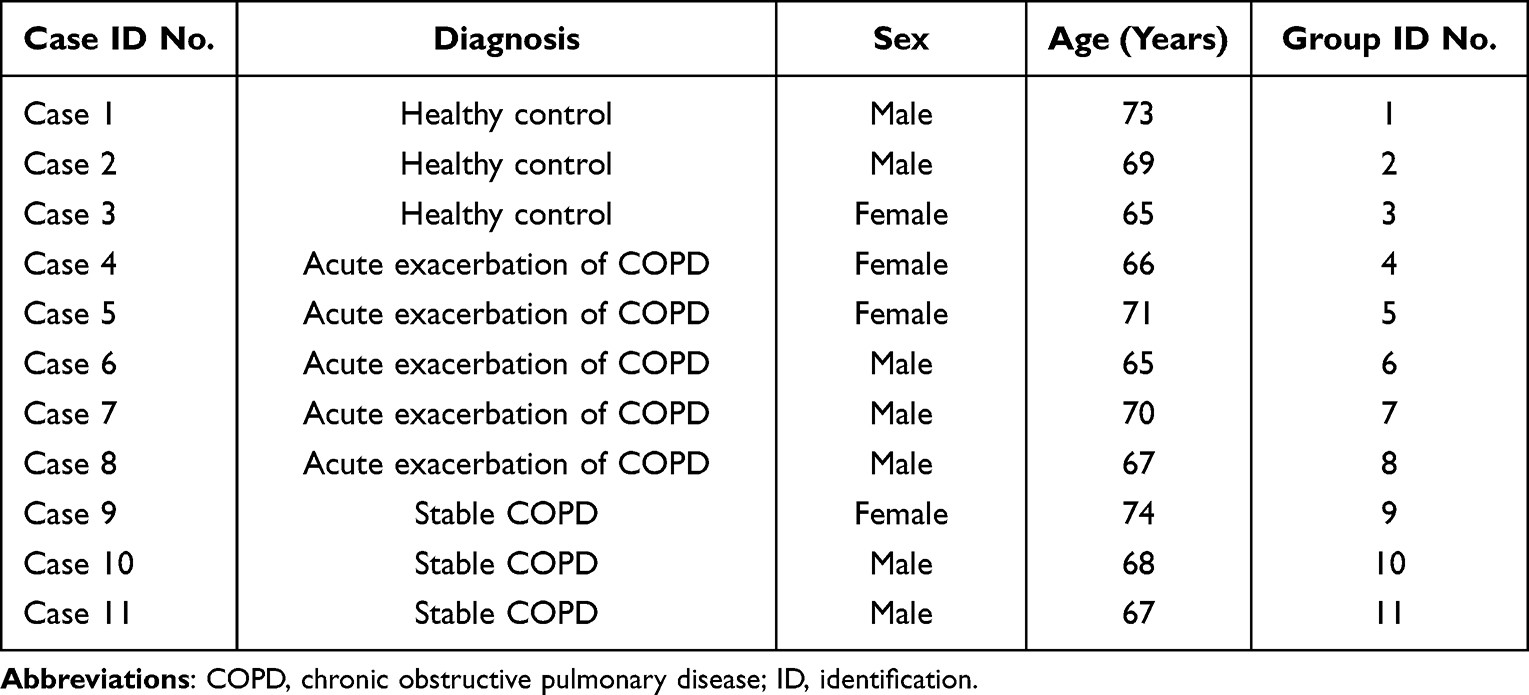 |
Table 1 Clinical Diagnoses and Demographic Characteristics of Participants |
SDS-PAGE
All 11 serum samples were separated by SDS-PAGE, and the proteins were effectively isolated in the molecular weight range of 15–220 kDa without protein degradation. Protein levels were sufficient for subsequent experiments (Figure 1).
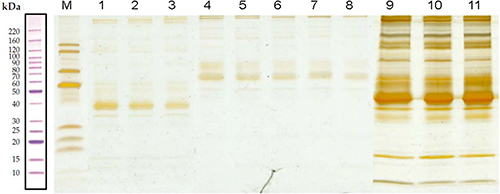 |
Figure 1 Sodium dodecyl sulfate-polyacrylamide gel electrophoresis. Lane M contains markers. Lanes 1–3 are proteins without the highly abundant proteins obtained from serum samples of healthy controls. Lanes 4–8 are proteins without the highly abundant proteins obtained from serum samples of patients with acute COPD, whereas lanes 9–11 are proteins without the highly abundant proteins obtained from serum samples of patients with stable COPD. |
LC-MS/MS Analysis and Identification of DEPs
LC-MS/MS is a tool for identifying proteins in mixed samples. A total of 661 proteins were detected in patients with acute exacerbation of COPD and participants in the healthy control group, of which 45 were DEPs, with 13 upregulated and 32 downregulated (Table 2). In addition, 661 proteins were detected in the group of patients with stable COPD and the group of healthy participants, of which 79 were DEPs, with 18 upregulated and 61 downregulated (Table 3). A volcano plot based on the size of the fold change (log2 FC) shows the distribution of all protein expression changes (Figure 2A and C). The cluster analyses of these DEPs indicated that the protein expression patterns of the group with acute exacerbation of COPD were clustered together and group with stable COPD were clustered together and that the expression pattern of each of these groups was significantly different from that of the healthy control group (Figure 2B and D).
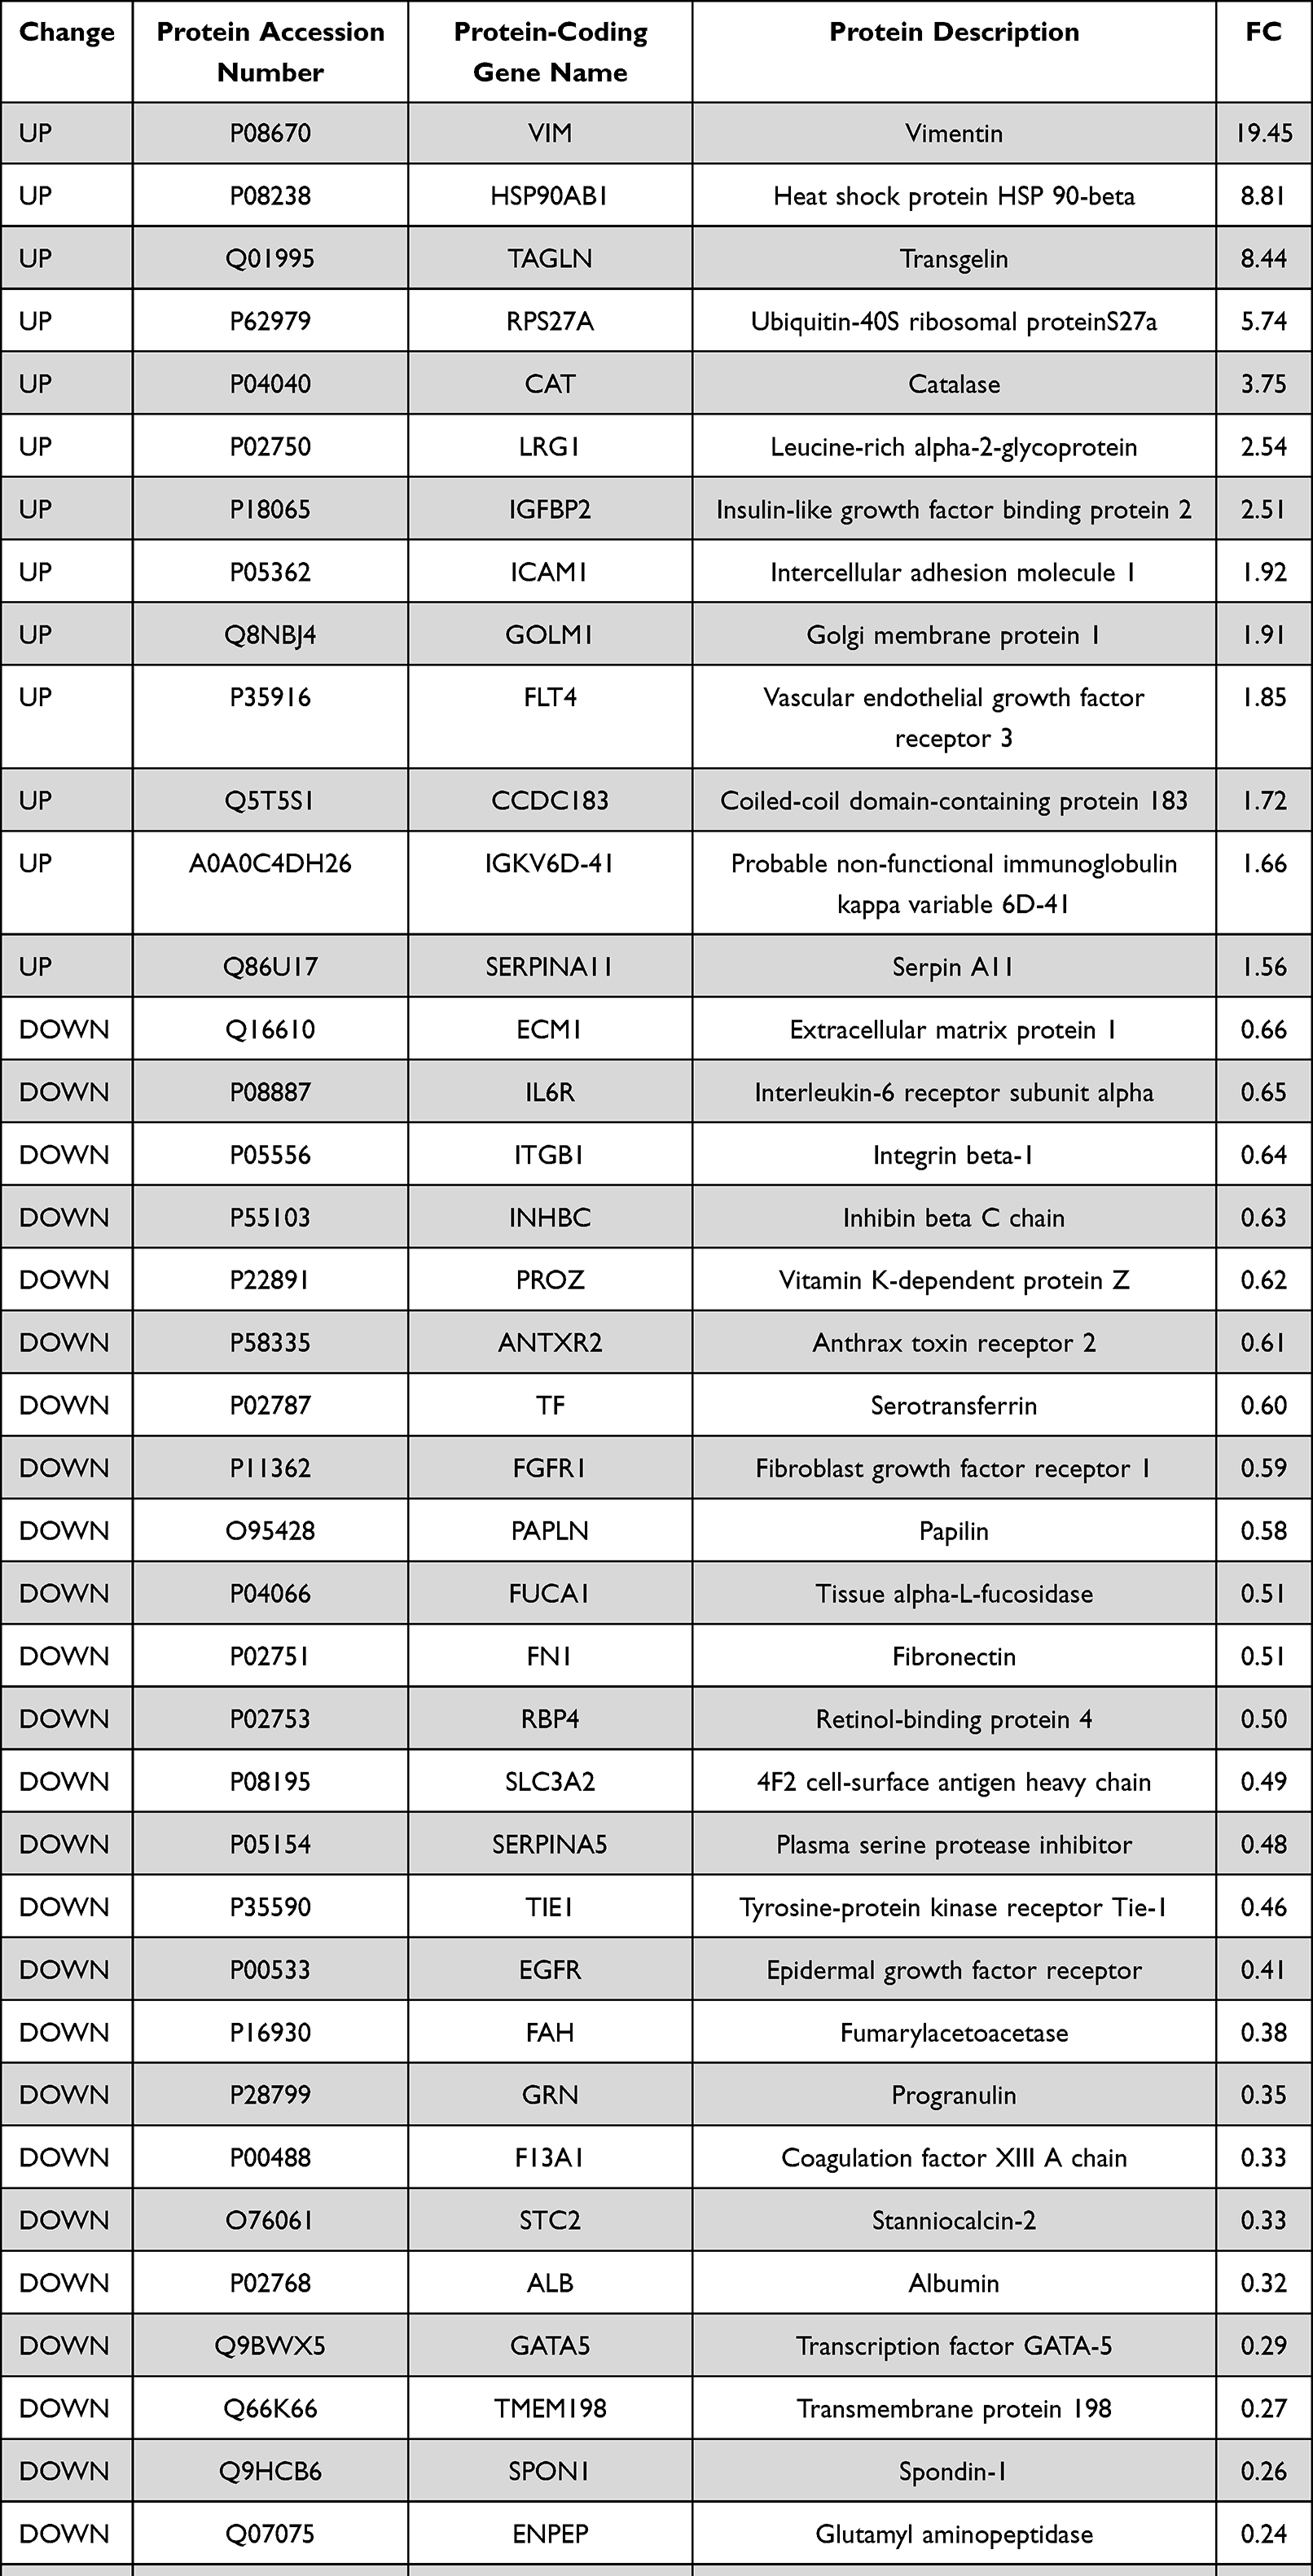 |
Table 2 Serum Proteins Differentially Expressed Between Patients with Acute Exacerbation of COPD and Healthy Control Participants |
 |
Table 3 Serum Proteins Differentially Expressed Between Patients with Stable COPD and Healthy Control Participants |
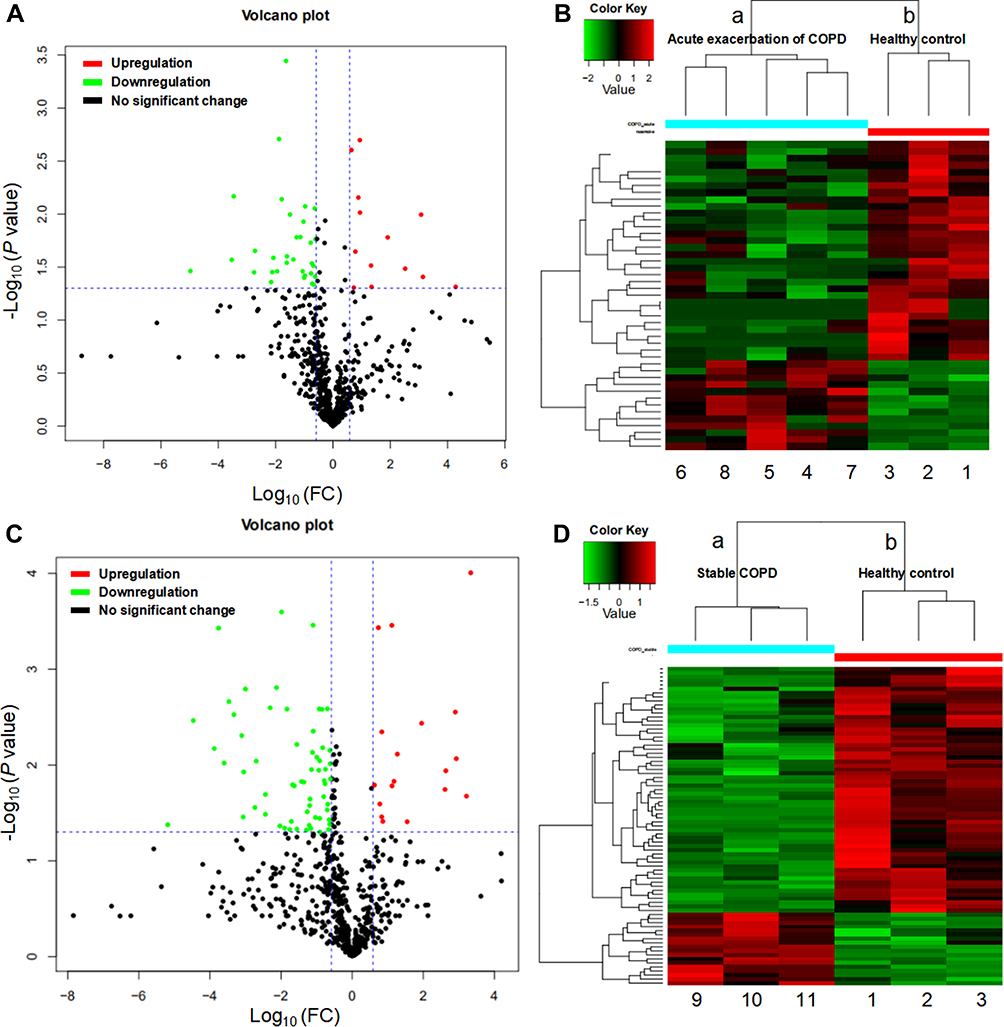 |
Figure 2 Differentially expressed proteins (DEPs). (A and C) Volcano plots showing upregulated proteins represented by red dots, downregulated proteins represented by green dots, proteins with no significant represented by black dots (absolute log10 fold change and P < 0.05 as the standard) between the group with acute exacerbation of COPD and the healthy control group (A), and between the group with stable COPD and the healthy control group (C). (B and D) Heat map showing the clustergram of the upregulated and downregulated DEPs between the acute COPD group ((B): a, 4–8) and the healthy control group ((B): b, 1–3), and between the stable COPD group ((D): a, 9–11) and the healthy control group ((D): b, 1–3). Each row represents a protein, each column represents a sample, and colors represent different levels of expression (log2 values of quantitative values are median-corrected during heat mapping). |
GO Functional Annotation and Enrichment Analysis
Gene ontology is a comprehensive approach that indicates the properties of genes and gene products in organisms. GO terms are categorized into three components: biological process, cellular component, and molecular function. The results of the GO functional annotation of DEPs between the group with acute exacerbation of COPD and the healthy control group are shown in Figure 3A. For the cellular component category, 45 DEPs were associated with the GO term cellular anatomical entity, and the top three upregulated proteins for this term were VIM, HSP90AB1, and TAGLN. For the molecular function category, 40 DEPs were associated with the GO term binding, and the top three upregulated proteins for this term were VIM, HSP90AB1, and TAGLN. For the biological process category, 40 DEPs were associated with the GO term cellular process, and the top three upregulated proteins for this term were VIM, HSP90AB1, and TAGLN.
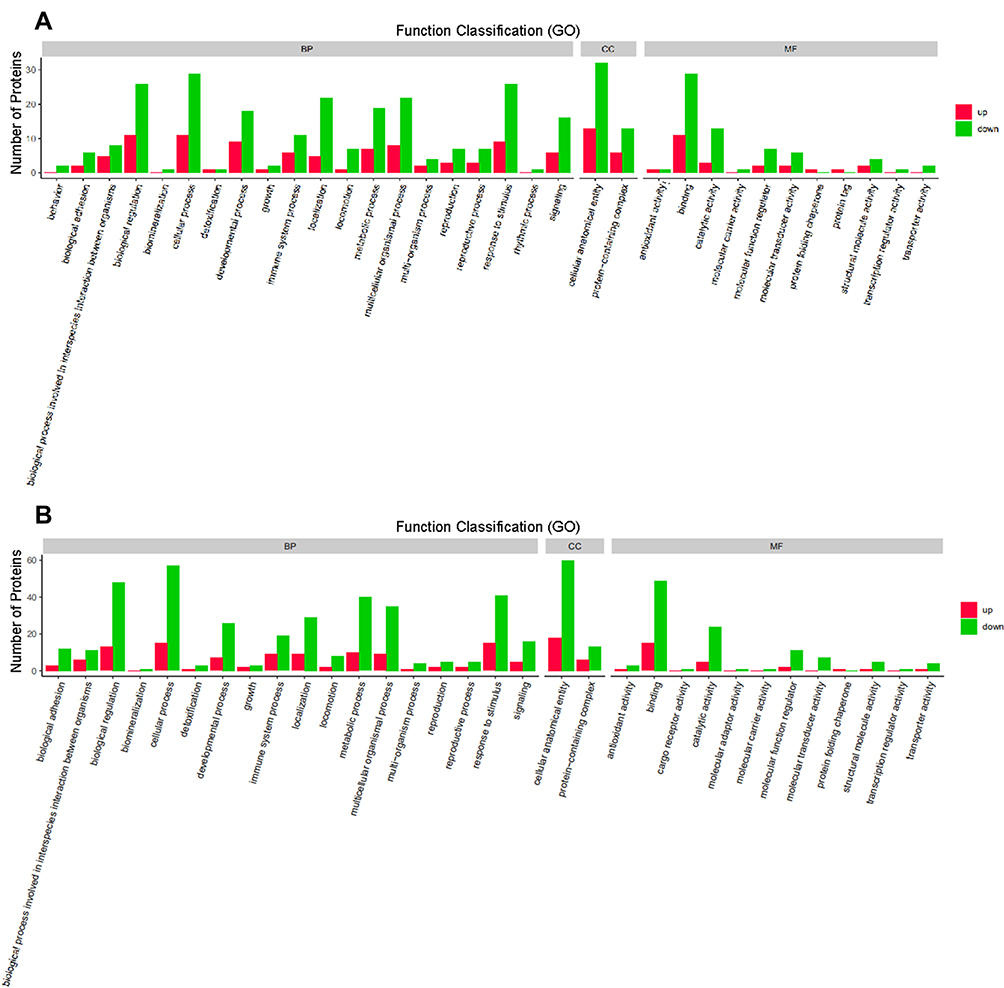 |
Figure 3 Gene ontology (GO) functional annotation. Upregulated and downregulated proteins in the GO categories of biological processes, cellular components, and molecular functions between the group with acute exacerbation of COPD and the healthy control group (A), and between the group with stable COPD and the healthy control group (B). |
The GO functions for proteins differentially expressed between the group with stable COPD and the healthy control group are shown in Figure 3B. For the cellular component category, 78 DEPs were associated with the GO term cellular anatomical entity, and the top three upregulated proteins for this term were CAMP, TMEM198, and VCAN. For the molecular function category, 64 DEPs were associated with the GO term binding, and the top three upregulated proteins for this term were CAMP, VCAN, and HSP90AB1. For the biological process category, 72 DEPs were associated with the GO term cellular process, and the top three upregulated proteins in this process were CAMP, TMEM198, and VCAN.
The assessment of the GO functional enrichment analysis of the DEPs between the acute COPD group and the healthy control group (Figure 4A) indicated that the terms mainly included positive regulation of cell communication, positive regulation of signaling, positive regulation of signal transduction, and apical plasma membrane. The GO functional enrichment analysis of the DEPs between the stable COPD group and the healthy control group (Figure 4B) indicated that the terms mainly included lipid binding, primary metabolic process, intracellular membrane-bounded organelle, and cellular metabolic process.
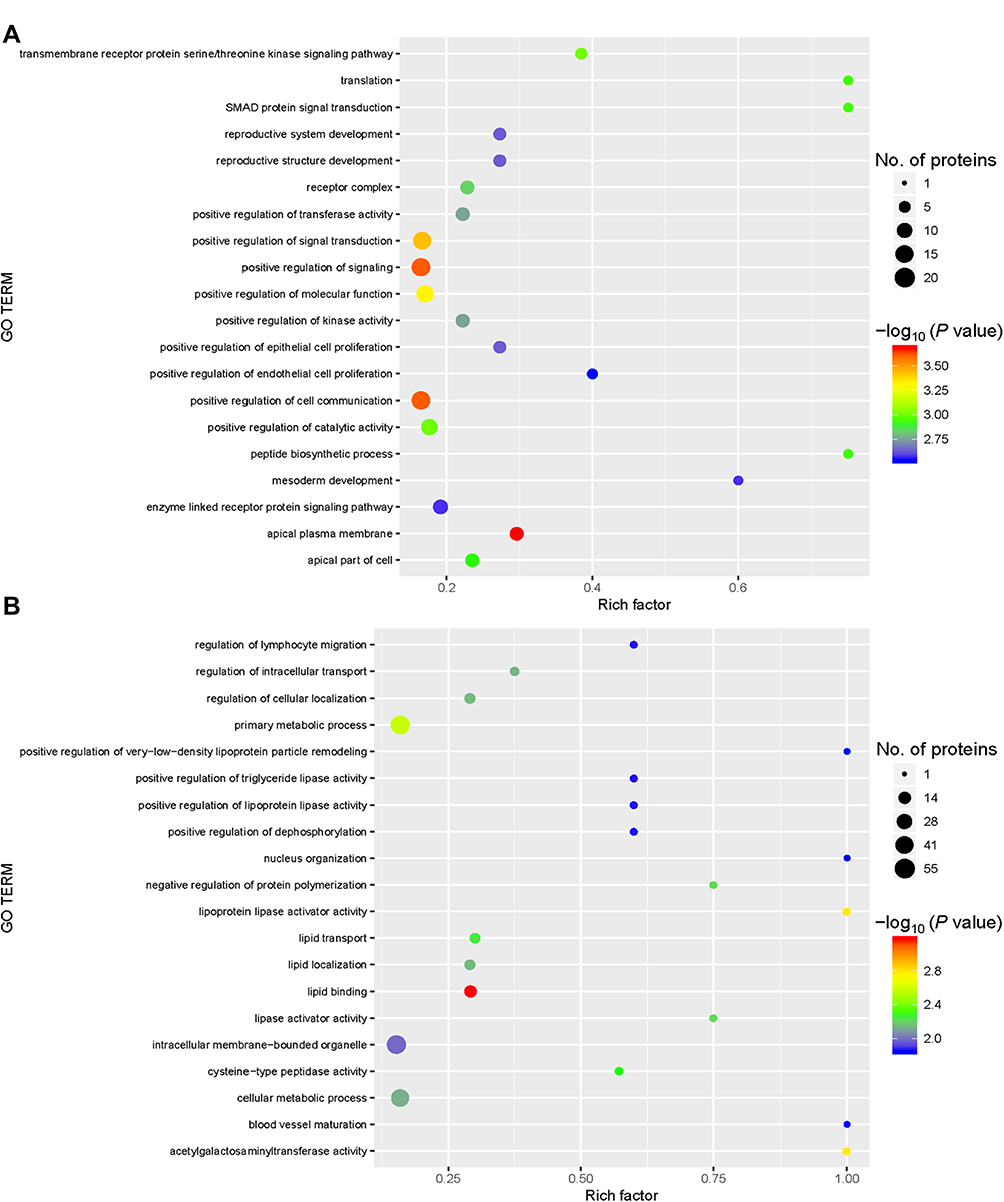 |
Figure 4 Gene ontology (GO) functional enrichment. Enriched GO terms and the associated numbers of proteins between the group with acute exacerbation of COPD and the healthy control group (A), and between the group with stable COPD and the healthy control group (B). The circle size represents the number of differentially expressed proteins in the GO term. The circle color indicates the -log10 P value representing the significant degree of enrichment. |
KEGG Pathway Analysis
KEGG is a public database that can be analyzed to identify the most important biochemical metabolic pathways and signal transduction pathways associated with DEPs. In this study, DEPs identified in serum samples between the group with acute exacerbation of COPD and the healthy control group were analyzed with KEGG functional annotation. The results showed that the KEGG pathways annotated with the DEPs included pathways in cancer, the PI3K-Akt signaling pathway, and proteoglycans in cancer (Figure 5A). In addition, DEPs identified in serum samples between the group with stable COPD and the healthy control group were also analyzed. The results showed that KEGG pathways annotated with the DEPs included metabolic pathways, complement and coagulation cascades, and regulation of actin cytoskeleton (Figure 5B).
 |
Figure 5 Kyoto Encyclopedia of Genes and Genomes (KEGG) pathway enrichment. KEGG pathways enriched for the upregulated and downregulated proteins and the associated numbers of proteins between the group with acute exacerbation of COPD and the healthy control group (A), and between the group with stable COPD and the healthy control group (B). |
KEGG pathway enrichment analysis showed that the main signaling pathways associated with the group with acute exacerbation of COPD were pathways in cancer, the PI3K-Akt signaling pathway, and proteoglycans in cancer (Figure 6A). Propanoate metabolism, regulation of actin cytoskeleton, fluid shear stress, and atherosclerosis were the main signaling pathways associated with the group having stable COPD (Figure 6B).
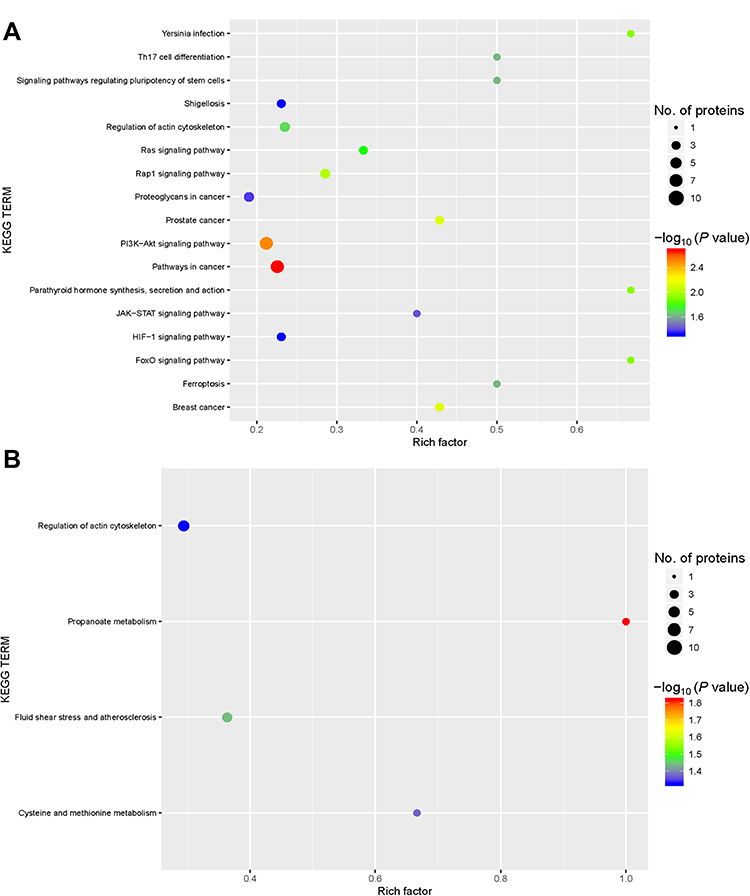 |
Figure 6 Kyoto Encyclopedia of Genes and Genomes (KEGG) pathway annotation. KEGG pathway annotation for the upregulated and downregulated proteins and the associated number of protein between the group with acute exacerbation of COPD and the healthy control group (A), and between the group with stable COPD and the healthy control group (B). The circle size represents the number of differentially expressed proteins in the GO term. The circle color indicates the −log10 P value representing the significant degree of enrichment. |
COG Protein Functional Analysis
The COG database was used to analyze DEPs detected in the serum samples between patients with acute exacerbation of COPD and healthy control participants. We predicted the possible functions of these proteins and performed functional classification statistics (Figure 7A). The results showed that the functions of these DEPs were mainly focused on signal transduction mechanisms, extracellular structures, amino acid transport and metabolism, and carbohydrate transport and metabolism. The results analyzing the DEPs between the group with stable COPD and the healthy participants (Figure 7B) indicated that the functions of these DEPs were mainly focused on signal transduction mechanisms, amino acid transport and metabolism, extracellular structures, and posttranslational modification, protein turnover, and chaperones.
 |
Figure 7 Clusters of Orthologous Groups (COGs) annotated for differentially expressed proteins. COG annotation for the upregulated and downregulated proteins and their associated frequency between the group with acute exacerbation of COPD and the healthy control group (A), and between the group with stable COPD and the healthy control group (B). The x-axis represents the functional class in the COG database. The y-axis represents the frequency of each functional class. |
Key Protein Concentration in Serum
We use ELISA to verify the results of LC-MS /MS experiment and select a key protein IGFBP2, LRG1 and TAGLN mainly from the perspective of clinical significance. The demographic and biomarker information of the participants in the ELIAS experiment are shown in Table 4. ELISA data showed a significant increase in the group with acute exacerbation of COPD compared with the the healthy control group, which was consistent with the LC-MS /MS data (Figure 8).
 |
Table 4 Demographic and Biomarker Data of Patients Used for ELISA |
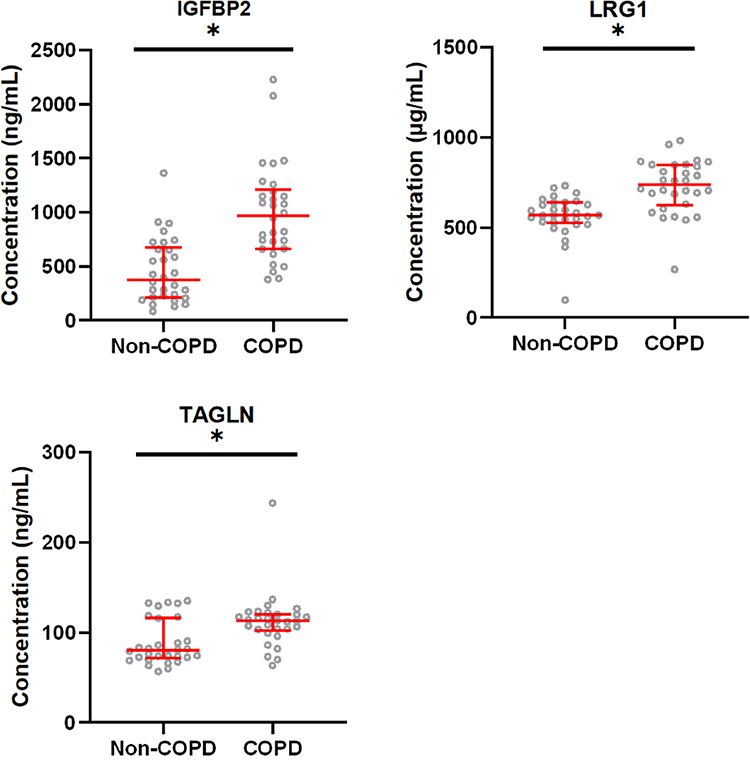 |
Figure 8 Comparison of biomarker levels between patients with acute exacerbation of COPD and healthy control participants. The horizontal axis represents the healthy control group and the group with acute exacerbation of COPD. The y-axis indicates the concentration of biomarker. Values are shown as median with interquartile range; n = 30. *P < 0.005 indicates a significant difference for the healthy control group (Non-COPD) vs the group with acute exacerbation of COPD analyzed by Mann–Whitney U-test. Abbreviations: IGFBP2, insulin-like growth factor binding protein 2; LRG1, leucine-rich alpha-2-glycoprotein; TAGLN, transgelin. |
Predictive Performance of Key Protein for the Diagnosis of COPD
By drawing the ROC curve, we obtained the area under the receiver operating characteristic (AUROC) of the three key proteins (Table 5, Figure 9). The AUROC value of the combined index of the three key proteins was 0.893 (95% CI: 0.813, 0.974) indicating that the combined indicator had high accuracy for the diagnosis of COPD.
 |
Table 5 Biomarker Levels in Patients with Acute Exacerbation of COPD and Healthy Control Participants |
 |
Figure 9 The receiver operating characteristic curves of these biomarkers. Abbreviations: IGFBP2, insulin-like growth factor binding protein 2; LRG1, leucine-rich alpha-2-glycoprotein; TAGLN, transgelin; COPD, chronic obstructive pulmonary disease; AUROC, the area under the receiver operating characteristic; Combination, the combination of the three key protein. |
Discussion
The discovery of new protein biomarkers and signaling pathways may be achieved by using a proteomics approach. Previous studies have used this approach to find biomarkers for COPD. For example, Liu et al obtained lung tissues from three patients with COPD and three healthy controls, and then used high-resolution LC-MS/MS and quantitative tandem mass spectrometry labeling (6-fold) to identify and analyze the DEPs, including GP6 and PF4, which are involved in platelet activation and wound healing.20 Our approach differed in the present study in that we used a label-free method and we assessed serum protein levels to determine DEPs between patients with acute exacerbation of COPD and healthy control participants. We identified 661 proteins, of which the levels of 45 proteins were significantly different between the two groups, with 13 proteins upregulated and 32 proteins downregulated. According to our GO functional annotation analyses, these significantly changed proteins were primarily included in the GO terms cellular anatomical entity, binding, and cellular process. The main upregulated proteins were VIM, HSP90AB1, and TAGLN. For the proteomic analysis of the DEPs in serum between the group with stable COPD and the healthy participant group, among 661 detected proteins, 79 proteins were significantly differentially expressed: 18 were upregulated and 61 were downregulated. According to our GO functional annotation analyses, these significantly changed proteins were mainly included in the terms cellular anatomical entity, binding, and cellular process. The main upregulated proteins were CAMP, TMEM198, VCAN, and HSP90AB1.
The proteins upregulated in the group with acute exacerbation of COPD included IGFBP2 (insulin-like growth factor binding protein 2). IGFBP2 binds to IGF-I and IGF-II in the blood to inhibit IGF-mediated growth and development rates, or binds to many different ligands within cells to perform the corresponding functions.21 Six structurally similar IGFBPs with high-affinity to IGFs are composed of an N-terminal domain and C-terminal domain connected by an L-terminal domain. Both the N-terminal domain and C-terminal domain are highly conserved and can bind independently to IGFs. Because the dissociation kinetics of the C-terminal are slower than the N-terminal, the binding of the C-terminal with IGF can produce more effects.22 The L-terminal domain of IGFBP2 is a relatively active linkage region and is sensitive to proteases. The L-terminal domain can be proteolyzed by proteases such as MMPs, PAPP-A, and cathepsin-D.23 IGFBP2 is highly expressed in rapidly dividing cell populations and in regions directly adjacent to cell growth and differentiation, such as the ectoderm after early implantation, the ventricular zone of rostral neuroepithelium, and the apical ectoderm ridge as well as in progenitor cells of the spleen.24,25 Many studies have also reported that IGFBP2 is a tumorigenic factor with key oncogenic functions in the vast majority of human cancers and is a viable therapeutic target.26 In the present study, we found that compared with that in the serum of healthy participants, the expression of IGFBP2 was significantly increased in the serum of patients with acute exacerbation of COPD and thus may be involved in COPD. But the detailed mechanisms for the involvement of IGFBP2 in the occurrence or development—or indeed the relationship—with acute exacerbation of COPD is still unknown, and future experimental study will be needed.
VCAN (Versican core protein) was found to be upregulated in the group with stable COPD. VCAN is a proteoglycan whose biochemical structure consists of four different types of core proteins accompanied by a glycosaminoglycan, which can undergo varying degrees of sulfonation. VCAN functions primarily in cell migration and inflammation.27 COPD is a chronic inflammatory disease of the airways and lung parenchyma and blood vessels, and the remodeling of the airways results in persistent airflow restriction. The extracellular matrix (ECM) is constantly reshaped in the human body and contributes to the airway structure.28 Inflammatory cells secrete various proteases and cytokines/chemokines in the early stages of inflammation. Some proteases bind to the ECM, and the ECM degrades under these interactions. Cytokines/chemokines activate interstitial fibroblasts and endothelial cells, and VCAN is expressed in activated fibroblasts, endothelial cells, and infiltrated macrophages. When white blood cells pass through the vascular endothelium, they interact with the ECM. The ECM affects the generation of internal signals needed to regulate key reactions in the inflammatory cascade.29,30 Covalently bound glycosaminoglycans form prostaglandins, which can undergo various degrees of sulfation. Proteoglycan molecules regulate cell behavior in the ECM and act on lung infection, inflammation, and tissue repair.31 VCAN is one of the deposited proteoglycans and an important participant in COPD.32 Generally, VCAN as an ECM molecule, participates in the inflammatory response; therefore, VCAN may be an important target for investigating the pathogenesis of stable COPD and may have potential therapeutic value in the future.
Studies have found that the occurrence of emphysema is related to sphingomyelin, and glycosphingolipids are closely related to COPD deterioration.33 Nicholas et al collected sputum from patients with COPD and healthy smokers and applied two-dimensional gel electrophoresis and mass spectrometry to identify the DEPs in the specimens between the groups. The study detected 1325 individual proteins, of which 40 were DEPs. The expression of APOA-I (apolipoprotein A-I) was greatly decreased in the specimens from patients with COPD.13 Li et al used enzyme linked immunosorbent assays to determine the levels of ApoM and pentraxin-3 in 110 patients with COPD and 110 controls. In addition, they used automated biochemical analyzers to assess the levels of C-reactive protein, cholesterol, and triglycerides. Their results showed that the degree of increase in ApoM is positively correlated with the exacerbation of COPD, with the serum ApoM level increased most in patients with severe COPD.34 In our study assessing the DEPs between the groups of patients with stable COPD and healthy control participants, we found that ApoA-V (apolipoprotein A-V) was decreased in stable COPD. The discovery of ApoA-V was based on comparative sequencing of mouse and human genomes and was first described in 2001.35 This molecule is located on chromosome 11q23 and exists in the ApoA1-C3-A4 gene cluster. The liver is the only site where ApoA-V is synthesized, and there it is translated into a 366 amino acid pre-protein. After the intracellular proprotein is cleaved to a signal peptide of 23 amino acids and ApoA-V matures, it appears in the plasma together with other apolipoproteins.36,37 Through the analysis of human and mouse data, it has been concluded that the main effect of ApoA-V is to reduce plasma triglyceride levels.35 The mechanism by which apolipoprotein A-V reduces plasma triglyceride levels remains unclear. The same apolipoprotein may be regulated differently in different cells in COPD and may play different roles in the final pathogenesis of COPD. Therefore, it may be of great significance to study the cell-specific changes and functions of apolipoprotein in COPD.
In the present study, we mainly provide proteomics analysis for COPD, but deep replication experiments to verify our findings is still limited. Therefore, further study should be valuable for clarifying the importance of these key DEPs. In addition, our data did not exam the clinical known blood protein markers, such as SP-D. This may be caused by the concentration is not enough to be tested by label-free LC-MS/MS.
Conclusions
In summary, we used label-free LC-MS/MS experiment to identify DEPs in the serum of patients with acute exacerbation of COPD and patients with stable COPD compared with healthy participants. Our study identified multiple key proteins and important signaling pathways maybe involved in the pathogenesis of COPD. Our study also provided three potential biomarkers including IGFBP2, LRG1 and TAGLN that may be potentially useful for the early diagnosis of COPD. Signaling pathway analyses further provided key proteins that may be involved in the occurrence and development of COPD, and these proteins may become new potential therapeutic targets for future COPD study and treatment.
Abbreviations
COPD, chronic obstructive pulmonary disease; DEPs, the differentially expressed proteins; IGBP2, insulin-like growth factor binding protein 2; LRG1, leucine-rich alpha-2-glycoprotein; TAGLN, transgelin; VCAN, versican core protein; APOA-I, apolipoprotein A-I; ApoA-V, apolipoprotein A-V; GO, gene Ontology; KEGG, Kyoto Encyclopedia of Genes and Genomes; COGs, clusters of Orthologous Group; AUROC, the area under the receiver operating characteristic; CI, confidence interval; COP, cutoff point; SEN, sensitivity; SPE, specificity; ELISA, enzyme linked immunosorbent assay; LC-MS/MS, liquid Chromatography-Mass Spectrometry; SDS-PAGE, sodium dodecyl sulfate–polyacrylamide gel electrophoresis.
Data Sharing Statement
Experimental data related to this study can be obtained from the corresponding author upon reasonable request.
Ethics Approval
The authors are accountable for all aspects of the work in ensuring that questions related to the accuracy or integrity of any part of the work are appropriately investigated and resolved. The research proposal was submitted to the Medical Research Ethics Committee of the Second Affiliated Hospital of Anhui Medical University, which approved the study (Anhui Medical Ethics Approval Number: YX2021-103).
Funding
This study was supported by the Anhui Province Natural Science Foundation (No. 2208085MH194), the Hefei Municipal Natural Science Foundation (No. 2021037), Research Fund of Anhui Institute of Translational Medicine (No. 2021zhyx-c67), Collaborative Chinese and Western Medicine Research Project for Major Difficult Diseases (No. 2021zdynjb06), Natural Science research project of Anhui Universities (No. KJ2020ZD13, KJ2021ZD0028), Scientific Research Platform and Base Upgrading Plan of Anhui Medical University (No. 2021xkjT048).
Disclosure
The authors declare no conflicts of interest in this work.
References
1. Lareau SC, Fahy B, Meek P, Wang A. Chronic Obstructive Pulmonary Disease (COPD). Am J Respir Crit Care Med. 2019;199(1):P1–P2. doi:10.1164/rccm.1991P1
2. Huang ZY, Lin S, Long LL, et al. Predicting the morbidity of chronic obstructive pulmonary disease based on multiple locally weighted linear regression model with K-means clustering. Int J Med Inform. 2020;139:104141. doi:10.1016/j.ijmedinf.2020.104141
3. Stevenson CS, Koch LG, Britton SL. Aerobic capacity, oxidant stress, and chronic obstructive pulmonary disease--a new take on an old hypothesis. Pharmacol Ther. 2006;110(1):71–82. doi:10.1016/j.pharmthera.2005.09.006
4. Tillmann T. Global, regional, and national age–sex specific all-cause and cause-specific mortality for 240 causes of death, 1990–2013: a systematic analysis for the Global Burden of Disease Study 2013. The Lancet. 2015;385(9963):117–171. doi:10.1016/s0140-6736(14)
5. Wang C, Xu J, Yang L, et al. Prevalence and risk factors of chronic obstructive pulmonary disease in China (the China Pulmonary Health [CPH] study): a national cross-sectional study. The Lancet. 2018;391(10131):1706–1717. doi:10.1016/S0140-6736(18)30841-9
6. Vela E, Cleries M, Monterde D, et al. Performance of quantitative measures of multimorbidity: a population-based retrospective analysis. BMC Public Health. 2021;21(1):1881. doi:10.1186/s12889-021-11922-2
7. Vogelmeier CF, Roman-Rodriguez M, Singh D, Han MK, Rodriguez-Roisin R, Ferguson GT. Goals of COPD treatment: focus on symptoms and exacerbations. Respir Med. 2020;166:105938. doi:10.1016/j.rmed.2020.105938
8. Ancochea J, García TG, de Miguel Díez J. Hacia un tratamiento individualizado e integrado del paciente con EPOC. Arch de Bronconeumología. 2010;46:14–18. doi:10.1016/S0300-2896(10)70051-X
9. Ferreira J, Drummond M, Pires N, et al. Optimal treatment sequence in COPD: can a consensus be found? Rev Port Pneumol. 2016;22(1):39–49. doi:10.1016/j.rppnen.2015.10.009
10. Garudadri S, Woodruff PG. Targeting Chronic Obstructive Pulmonary Disease Phenotypes, Endotypes, and Biomarkers. Ann Am Thorac Soc. 2018;15(Suppl 4):S234–S238. doi:10.1513/AnnalsATS.201808-533MG
11. Kunutsor SK, Jae SY, Makikallio TH, Kurl S, Laukkanen JA. High fitness levels offset the increased risk of chronic obstructive pulmonary disease due to low socioeconomic status: a cohort study. Respir Med. 2021;189:106647. doi:10.1016/j.rmed.2021.106647
12. Rotello RJ, Veenstra TD. Mass Spectrometry Techniques: principles and Practices for Quantitative Proteomics. Curr Protein Pept Sci. 2021;22(2):121–133. doi:10.2174/1389203721666200921153513
13. Nicholas BL, Skipp P, Barton S, et al. Identification of lipocalin and apolipoprotein A1 as biomarkers of chronic obstructive pulmonary disease. Am J Respir Crit Care Med. 2010;181(10):1049–1060. doi:10.1164/rccm.200906-0857OC
14. Fang Y, Wang P, Xia L, et al. Aberrantly hydroxymethylated differentially expressed genes and the associated protein pathways in osteoarthritis. PeerJ. 2019;7:e6425. doi:10.7717/peerj.6425
15. Zhang W, Xue X, Xie C, et al. CEGSO: boosting Essential Proteins Prediction by Integrating Protein Complex, Gene Expression, Gene Ontology, Subcellular Localization and Orthology Information. Interdiscip Sci. 2021;13(3):349–361. doi:10.1007/s12539-021-00426-7
16. Zhang J, Xing Z, Ma M, et al. Gene ontology and KEGG enrichment analyses of genes related to age-related macular degeneration. Biomed Res Int. 2014;2014:450386. doi:10.1155/2014/450386
17. Zhu N, Zhang D, Wang W, et al. A Novel Coronavirus from Patients with Pneumonia in China, 2019. N Engl J Med. 2020;382(8):727–733. doi:10.1056/NEJMoa2001017
18. Tatusov RL, Koonin EV, Lipman DJ. A genomic perspective on protein families. Science. 1997;278(5338):631–637. doi:10.1126/science.278.5338.631
19. Tatusov RL, Natale DA, Garkavtsev IV, et al. The COG database: new developments in phylogenetic classification of proteins from complete genomes. Nucleic Acids Res. 2001;29(1):22–28. doi:10.1093/nar/29.1.22
20. Liu Y, Liu H, Li C, Ma C, Ge W. Proteome Profiling of Lung Tissues in Chronic Obstructive Pulmonary Disease (COPD): platelet and Macrophage Dysfunction Contribute to the Pathogenesis of COPD. Int J Chron Obstruct Pulmon Dis. 2020;15:973–980. doi:10.2147/COPD.S246845
21. Li T, Forbes ME, Fuller GN, Li J, Yang X, Zhang W. IGFBP2: integrative hub of developmental and oncogenic signaling network. Oncogene. 2020;39(11):2243–2257. doi:10.1038/s41388-020-1154-2
22. Carrick FE, Forbes BE, Wallace JC. BIAcore analysis of bovine insulin-like growth factor (IGF)-binding protein-2 identifies major IGF binding site determinants in both the amino- and carboxyl-terminal domains. J Biol Chem. 2001;276(29):27120–27128. doi:10.1074/jbc.M101317200
23. Firth SM, Baxter RC. Cellular actions of the insulin-like growth factor binding proteins. Endocr Rev. 2002;23(6):824–854. doi:10.1210/er.2001-0033
24. Pintar JE, Wood TL, Streck RD, Havton L, Rogler L, Hsu MS. Expression of IGF-II, the IGF-II/mannose-6-phosphate receptor and IGFBP-2 during rat embryogenesis. Adv Exp Med Biol. 1991;293:325–333. doi:10.1007/978-1-4684-5949-4_29
25. van Kleffens M, Groffen C, Lindenbergh-Kortleve DJ, et al. The IGF system during fetal-placental development of the mouse. Mol Cell Endocrinol. 1998;140(1–2):129–136. doi:10.1016/s0303-7207(98)
26. Verma BK, Kondaiah P. Regulation of beta-catenin by IGFBP2 and its cytoplasmic actions in glioma. J Neurooncol. 2020;149(2):209–217. doi:10.1007/s11060-020-03596-4
27. Andersson-Sjoland A, Hallgren O, Rolandsson S, et al. Versican in inflammation and tissue remodeling: the impact on lung disorders. Glycobiology. 2015;25(3):243–251. doi:10.1093/glycob/cwu120
28. Annoni R, Lancas T, Yukimatsu Tanigawa R, et al. Extracellular matrix composition in COPD. Eur Respir J. 2012;40(6):1362–1373. doi:10.1183/09031936.00192611
29. Wight TN, Kang I, Merrilees MJ. Versican and the control of inflammation. Matrix Biol. 2014;35:152–161. doi:10.1016/j.matbio.2014.01.015
30. Frey H, Schroeder N, Manon-Jensen T, Iozzo RV, Schaefer L. Biological interplay between proteoglycans and their innate immune receptors in inflammation. FEBS J. 2013;280(10):2165–2179. doi:10.1111/febs.12145
31. Gill S, Wight TN, Frevert CW. Proteoglycans: key regulators of pulmonary inflammation and the innate immune response to lung infection. Anat Rec. 2010;293(6):968–981. doi:10.1002/ar.21094
32. Hallgren O, Nihlberg K, Dahlback M, et al. Altered fibroblast proteoglycan production in COPD. Respir Res. 2010;11:55. doi:10.1186/1465-9921-11-55
33. Bowler RP, Jacobson S, Cruickshank C, et al. Plasma sphingolipids associated with chronic obstructive pulmonary disease phenotypes. Am J Respir Crit Care Med. 2015;191(3):275–284. doi:10.1164/rccm.201410-1771OC
34. Li H, Liu Y, Wang L, et al. High apolipoprotein M serum levels correlate with chronic obstructive pulmonary disease. Lipids Health Dis. 2016;15(1):59. doi:10.1186/s12944-016-0228-1
35. Pennacchio LA, Olivier M, Hubacek JA, et al. An apolipoprotein influencing triglycerides in humans and mice revealed by comparative sequencing. Science. 2001;294(5540):169–173. doi:10.1126/science.1064852
36. Forte TM, Shu X, Ryan RO. The ins (cell) and outs (plasma) of apolipoprotein A-V. J Lipid Res. 2009;50(Suppl):S150–155. doi:10.1194/jlr.R800050-JLR200
37. Tosheska Trajkovska K, Topuzovska S. High-density lipoprotein metabolism and reverse cholesterol transport: strategies for raising HDL cholesterol. Anatol J Cardiol. 2017;18(2):149–154. doi:10.14744/AnatolJCardiol.2017.7608
 © 2022 The Author(s). This work is published and licensed by Dove Medical Press Limited. The
full terms of this license are available at https://www.dovepress.com/terms
and incorporate the Creative Commons Attribution
- Non Commercial (unported, 3.0) License.
By accessing the work you hereby accept the Terms. Non-commercial uses of the work are permitted
without any further permission from Dove Medical Press Limited, provided the work is properly
attributed. For permission for commercial use of this work, please see paragraphs 4.2 and 5 of our Terms.
© 2022 The Author(s). This work is published and licensed by Dove Medical Press Limited. The
full terms of this license are available at https://www.dovepress.com/terms
and incorporate the Creative Commons Attribution
- Non Commercial (unported, 3.0) License.
By accessing the work you hereby accept the Terms. Non-commercial uses of the work are permitted
without any further permission from Dove Medical Press Limited, provided the work is properly
attributed. For permission for commercial use of this work, please see paragraphs 4.2 and 5 of our Terms.
Recommended articles
A Novel Metabolic Score for Predicting the Acute Exacerbation in Patients with Chronic Obstructive Pulmonary Disease
Peng L, You H, Xu MY, Dong ZY, Liu M, Jin WJ, Zhou C
International Journal of Chronic Obstructive Pulmonary Disease 2023, 18:785-795
Published Date: 5 May 2023
Prevalence of Cardiovascular Disease and Rate of Major Adverse Cardiovascular Events in Severe Alpha-1 Antitrypsin Deficiency COPD
Ellis P, Bailey E, Choate R, Holm KE, Sandhaus RA, Turner AM, Newnham M
International Journal of Chronic Obstructive Pulmonary Disease 2024, 19:149-159
Published Date: 17 January 2024
Targeting Non-Eosinophilic Immunological Pathways in COPD and AECOPD: Current Insights and Therapeutic Strategies

Razia DEM, Gao C, Wang C, An Y, Wang F, Liu L, Lin H
International Journal of Chronic Obstructive Pulmonary Disease 2025, 20:511-532
Published Date: 5 March 2025
Increased Stress Hyperglycemia Ratio Predicts Poor Clinical Outcome in Critically Ill COPD Patients: A Retrospective Study
Qiao M, Yang H, Qin M, Li Y, Wang H
International Journal of Chronic Obstructive Pulmonary Disease 2025, 20:1203-1215
Published Date: 24 April 2025
Long COVID in Elderly COPD Patients: Clinical Features, Pulmonary Function Decline, and Proteomic Insights
Li S, Zhao H, Zhang M, Yuan T, Chai D, Shen Z, Qin C, Li Y, Pan M
International Journal of Chronic Obstructive Pulmonary Disease 2025, 20:2337-2347
Published Date: 8 July 2025