Back to Journals » Journal of Inflammation Research » Volume 18
Development of Predictive Models for Long-Term Endoscopic Response to Ustekinumab in Crohn’s Disease Based on Plasma Proteomics
Authors Wu C ![]() , Zheng J, Qian X
, Zheng J, Qian X ![]() , Peng C
, Peng C ![]() , Zhou F, Wang L
, Zhou F, Wang L
Received 1 September 2025
Accepted for publication 3 December 2025
Published 22 December 2025 Volume 2025:18 Pages 17983—17996
DOI https://doi.org/10.2147/JIR.S563462
Checked for plagiarism Yes
Review by Single anonymous peer review
Peer reviewer comments 2
Editor who approved publication: Dr Alberto Caminero
Chenchen Wu,1 Jiawen Zheng,2 Xin Qian,3 Chunyan Peng,4 Fan Zhou,4 Lei Wang1,4
1Department of Gastroenterology, Nanjing Drum Tower Hospital, Nanjing Drum Tower Hospital Clinical College of Jiangsu University, Nanjing, People’s Republic of China; 2Zhenjiang Hospital of Chinese Traditional and Western Medicine, Zhenjiang, People’s Republic of China; 3Department of Gastroenterology, Nanjing Drum Tower Clinical Medical College, Nanjing University of Chinese Medicine, Nanjing, People’s Republic of China; 4Department of Gastroenterology, Nanjing Drum Tower Hospital Affiliated with Medical School of Nanjing University, Nanjing, People’s Republic of China
Correspondence: Fan Zhou, Department of Gastroenterology, Nanjing Drum Tower Hospital, Nanjing University Medical School, No. 321 Zhongshan Road, Nanjing, Jiangsu, 210008, People’s Republic of China, Tel +86-15895969717, Email [email protected] Lei Wang, Department of Gastroenterology, Nanjing Drum Tower Hospital, Clinical College of Jiangsu University, Nanjing, Jiangsu, 210008, People’s Republic of China, Tel +86-13851579216, Email [email protected]
Purpose: Ustekinumab (UST) is effective for Crohn’s disease (CD), yet reliable biomarkers for predicting long-term response remain scarce. This study aimed to identify novel plasma proteomic biomarkers and develop predictive models for long-term endoscopic response to UST therapy in patients.
Methods: Baseline plasma inflammatory proteins were profiled using the Olink platform in 40 CD patients treated with UST (20 responders, 20 non-responders). Differentially expressed proteins (DEPs) were identified after adjusting for age, age at diagnosis, and SES-CD scores. Stable DEPs were selected via bootstrap resampling and further validated in an independent patient group from the same center (n=20) using ELISA. Predictive models were constructed using logistic regression, random forest, and support vector machine (SVM) algorithms.
Results: Non-responders had elevated baseline interleukin-8 (IL8) and CD6 levels and reduced thymic stromal lymphopoietin (TSLP) compared to responders. ELISA confirmed differential expression of IL8, CD6, and TSLP, with CD6 showing the best diagnostic accuracy (AUC=0.800). The logistic regression model combining these markers achieved an AUC of 0.828 (95% CI: 0.701– 0.954), outperforming random forest (AUC=0.745) and SVM (AUC=0.775).
Conclusion: Baseline plasma IL8, CD6, and TSLP are potential predictive biomarkers of long-term endoscopic response to UST in CD, providing a basis for personalized treatment strategies.
Plain Language Summary: We analyzed baseline plasma from Crohn’s disease patients receiving ustekinumab and found that elevated levels of IL-8 and CD6, with reduced TSLP expression, predict poor response. Measuring these proteins may guide more personalized treatment decisions.
Keywords: crohn disease, ustekinumab, biomarkers, proteomics
Introduction
Inflammatory bowel disease (IBD) is a chronic, progressive, immune-mediated disorder affecting the gastrointestinal tract, often leading to complications such as strictures, obstruction, and intestinal malignancy.1,2 The incidence of Crohn’s disease (CD), a major subtype of IBD, is particularly high in Europe and North America, reaching 322 per 100,000 in Germany and 319 per 100,000 in Canada. Since 1990, its incidence has been steadily rising in newly industrialized countries across Africa, South America, and Asia.3 Biologic agents have become a cornerstone of CD management in recent years. Ustekinumab (UST) is a fully human monoclonal antibody that targets the common p40 subunit shared by interleukin (IL)-12 and IL-23, thereby blocking their interactions with receptors and inhibiting downstream signaling. Both IL-12 and IL-23 are key cytokines involved in intestinal immune regulation and have been implicated in the pathogenesis of inflammatory bowel disease. In particular, IL-23 drives intestinal inflammation through the activation of Th17 cells and other innate immune subsets, leading to chronic mucosal inflammation. By targeting the shared p40 subunit, UST effectively attenuates these inflammatory responses and restores intestinal immune balance.4 According to the latest ECCO guidelines, UST is recommended for both induction and maintenance therapy in patients with moderate-to-severe CD.5 However, a substantial proportion of patients experience primary or secondary nonresponse to UST. A meta-analysis of 63 observational studies involving 8,529 patients reported pooled clinical response rates of 60% (95% CI: 54–67%) in the short term (8–14 weeks), 64% (95% CI: 57–71%) in the medium term (16–24 weeks), and 64% (95% CI: 52–74%) in the long term (48–52 weeks).6 Therefore, accurately predicting therapeutic response to UST before treatment initiation remains a critical unmet need.
Various clinical, biological, and pharmacological factors have been investigated as potential predictors of UST response.7 However, clinical characteristics such as age, sex, smoking status, disease duration, and disease location have shown limited or inconsistent associations with treatment outcomes.8–10 Similarly, studies examining the correlation between plasma UST levels and clinical efficacy have yielded conflicting results.11,12 While disease severity and prior surgical history have shown some predictive value, findings across studies remain heterogeneous.13 Current prediction strategies suffer from several limitations: (1) existing clinical predictors of UST response exhibit limited discriminative power; (2) these indicators often lack a biological rationale, making it difficult to uncover the underlying molecular mechanisms;14 (3) and while the majority of existing literature on UST evaluates treatment efficacy based on clinical remission,15,16 the STRIDE-II consensus explicitly identifies endoscopic healing as the long-term therapeutic target in CD.17
Recent advances in proteomics have enabled high-resolution characterization of disease-related protein signatures.18 Among these technologies, the proximity extension assay (PEA), developed by Olink, allows for high-throughput and highly specific quantification of low-abundance proteins.19 The Olink Immuno-Oncology panel has demonstrated predictive value in multiple disease settings, including immunotherapy response in esophageal cancer20 and its utility in biomarker discovery has been increasingly recognized across various inflammatory and neoplastic diseases.21–23 Given that CD is characterized by complex immune dysregulation and inflammation-driven tissue damage, profiling plasma inflammatory proteins may offer critical insights into UST treatment response mechanisms.24
In this study, we aimed to identify novel inflammatory protein biomarkers that predict response to ustekinumab in patients with Crohn’s disease. We employed the Olink® Target 96 Inflammation Panel to analyze baseline plasma samples from these patients. Furthermore, we constructed predictive models to uncover molecular signatures associated with therapeutic response and to explore potential mechanisms underlying treatment failure. These findings may facilitate early molecular stratification of patients and contribute to the development of more precise, individualized treatment strategies.
Materials and Methods
Study Design and Participants
This was a retrospective analysis derived from a prospectively maintained institutional registry of CD at Nanjing Drum Tower Hospital. Between January 2021 and January 2024, we retrospectively identified 40 eligible patients with moderate-to-severe CD who received UST and had complete clinical, endoscopic, and biospecimen data, including 20 endoscopic responders and 20 non-responders. Patients received ustekinumab according to the standard clinical regimen, with an intravenous induction dose administered at week 0 based on body weight (≤55 kg: 260 mg; >55–85 kg: 390 mg; >85 kg: 520 mg), followed by subcutaneous maintenance of 90 mg starting at week 8 and continuing every 8 weeks thereafter. The route and schedule of UST administration were protocolized as above for all patients. Concomitant therapies at baseline (eg, corticosteroids, immunomodulators) were systematically recorded. Inclusion criteria was: (1) 18–70 years old; (2) confirmed diagnosis of CD and treatment with UST (induction and maintenance phases) for at least 24 weeks; (3) colonoscopy performed within six months prior to treatment and within one year after treatment; and (4) written informed consent provided. Exclusion criteria included: (1) inability to assess the Simplified Endoscopic Score for Crohn’s Disease (SES-CD) due to endoscopic limitations; (2) presence of intra-abdominal abscess; and (3) loss to follow-up. Plasma samples were processed using anonymized study IDs, and laboratory personnel conducting proteomic assays were blinded to clinical data, endoscopic results, and response status until the database was locked. All colonoscopies were performed by two associate chief physicians at the center, following a standardized bowel preparation and imaging protocol. To mitigate inter-observer variability, both endoscopists used a standardized scoring worksheet and resolved any ambiguities by consensus. Endoscopic non-response was defined as a <50% reduction in SES-CD from baseline at weeks 24–52, consistent with prior studies.25
Sample Collection
Peripheral venous blood (3 mL) was collected from each participant into EDTA tubes in the morning after overnight fasting and prior to the first induction dose of UST. Plasma was separated by centrifugation at 3,000 rpm for 15 minutes and stored at –80 °C until further analysis.
Proteomic Analysis
Proteomic profiling was performed using the Olink® Target 96 Inflammation panel (Olink Proteomics AB, Uppsala, Sweden), following the manufacturer’s protocol. This platform utilizes PEA technology to simultaneously quantify 92 inflammation-related proteins from 1 μL of plasma. Briefly, oligonucleotide-labeled antibody pairs bind to target proteins, enabling hybridization and extension by DNA polymerase. The resulting DNA sequences were quantified using real-time PCR (Signature Q100, LC-Bio Technology, Hangzhou, China). Normalization was performed using internal and inter-plate controls to correct for technical variation. Protein expression levels were reported as Normalized Protein expression (NPX) values on a log2 scale. Higher NPX values indicate greater protein abundance. Assay validation is available at www.olink.com. NPX values falling below the assay’s limit of detection (LOD) were replaced with the corresponding LOD threshold. In accordance with the Olink protocol, samples that did not pass quality control in the PEA assay were treated as missing. To address missingness, we applied multiple imputation using chained equations (MICE, version 3.18.0 in R). This approach imputes missing entries in an iterative manner, drawing on the conditional distributions of the observed variables to generate plausible values.
Bioinformatics Analysis of Differentially Expressed Proteins (DEPs)
Protein expression data were log2-transformed and analyzed using the limma package in R. A design matrix was constructed to adjust for age, age at diagnosis, and SES-CD. Empirical Bayes moderation was applied to stabilize variance estimates. Proteins with nominal P-values <0.05 were considered differentially expressed. To ensure robustness, 500 iterations of 50% bootstrap resampling were conducted, and proteins consistently significant in ≥80 iterations were defined as stable DEPs. Visualization was performed using volcano plots, heatmaps, and boxplots generated with ggplot2 and pheatmap. Additionally, a sensitivity analysis was performed by further adjusting for prior biologic exposure (bio-naïve status) in the limma model to assess the robustness of differential expression results.
Biomarker Validation via ELISA
To validate the proteomic results, ELISA assays were performed on plasma samples from other 10 UST responders and 10 non-responders from our center. Commercial kits were used to measure interleukin-8 (IL8) (D8000C, R&D Systems, USA), CD6 (EH112RB, Thermo Fisher, USA), and thymic stromal lymphopoietin (TSLP) (DTSLP0, R&D Systems, USA). All assays were performed in accordance with the manufacturers’ instructions. Optical density was measured at 450 nm using a multimode microplate reader (Molecular Devices, CA, USA).
Machine Learning Model Construction and Validation
To predict treatment response, we developed and validated three machine learning models: logistic regression, random forest, and support vector machine (SVM). The logistic regression model was built using the glm function with a binomial link, and variable importance was assessed using the vip package. The random forest model was constructed using the caret package, with the mtry parameter optimized via repeated five-fold cross-validation (100 repetitions). The SVM model underwent hyperparameter tuning using a grid search across a range of gamma (10−6 to 101) and cost (10−5 to 105) values, optimized through five-fold cross-validation.
For all models, performance was evaluated using the area under the receiver operating characteristic (ROC) curve (AUC), along with sensitivity, specificity, accuracy, precision, positive predictive value (PPV), negative predictive value (NPV), and F1 score. To ensure model robustness and reduce overfitting, internal validation was conducted via 500 bootstrap iterations and leave-one-out cross-validation (LOOCV). A nomogram and a bootstrap-corrected calibration curve were further generated for the logistic regression model using the rms package.
Data Analysis
All statistical analyses were conducted using R software (v4.4.2). Continuous variables are presented as mean ± standard deviation (SD) or median (interquartile range, IQR), and compared using Student’s t-test or Mann–Whitney U-test, as appropriate. Categorical variables were analyzed using the chi-square test. ROC curves were constructed to evaluate diagnostic performance, and AUC was calculated to assess model discrimination. A two-sided P-value < 0.05 was considered statistically significant.
Results
Characteristics of Responder and Non-Responder Groups
A total of 40 moderate-to-severe CD patients were enrolled, including 20 responders and 20 non-responders. The clinical characteristics of the two groups are presented in Table 1.
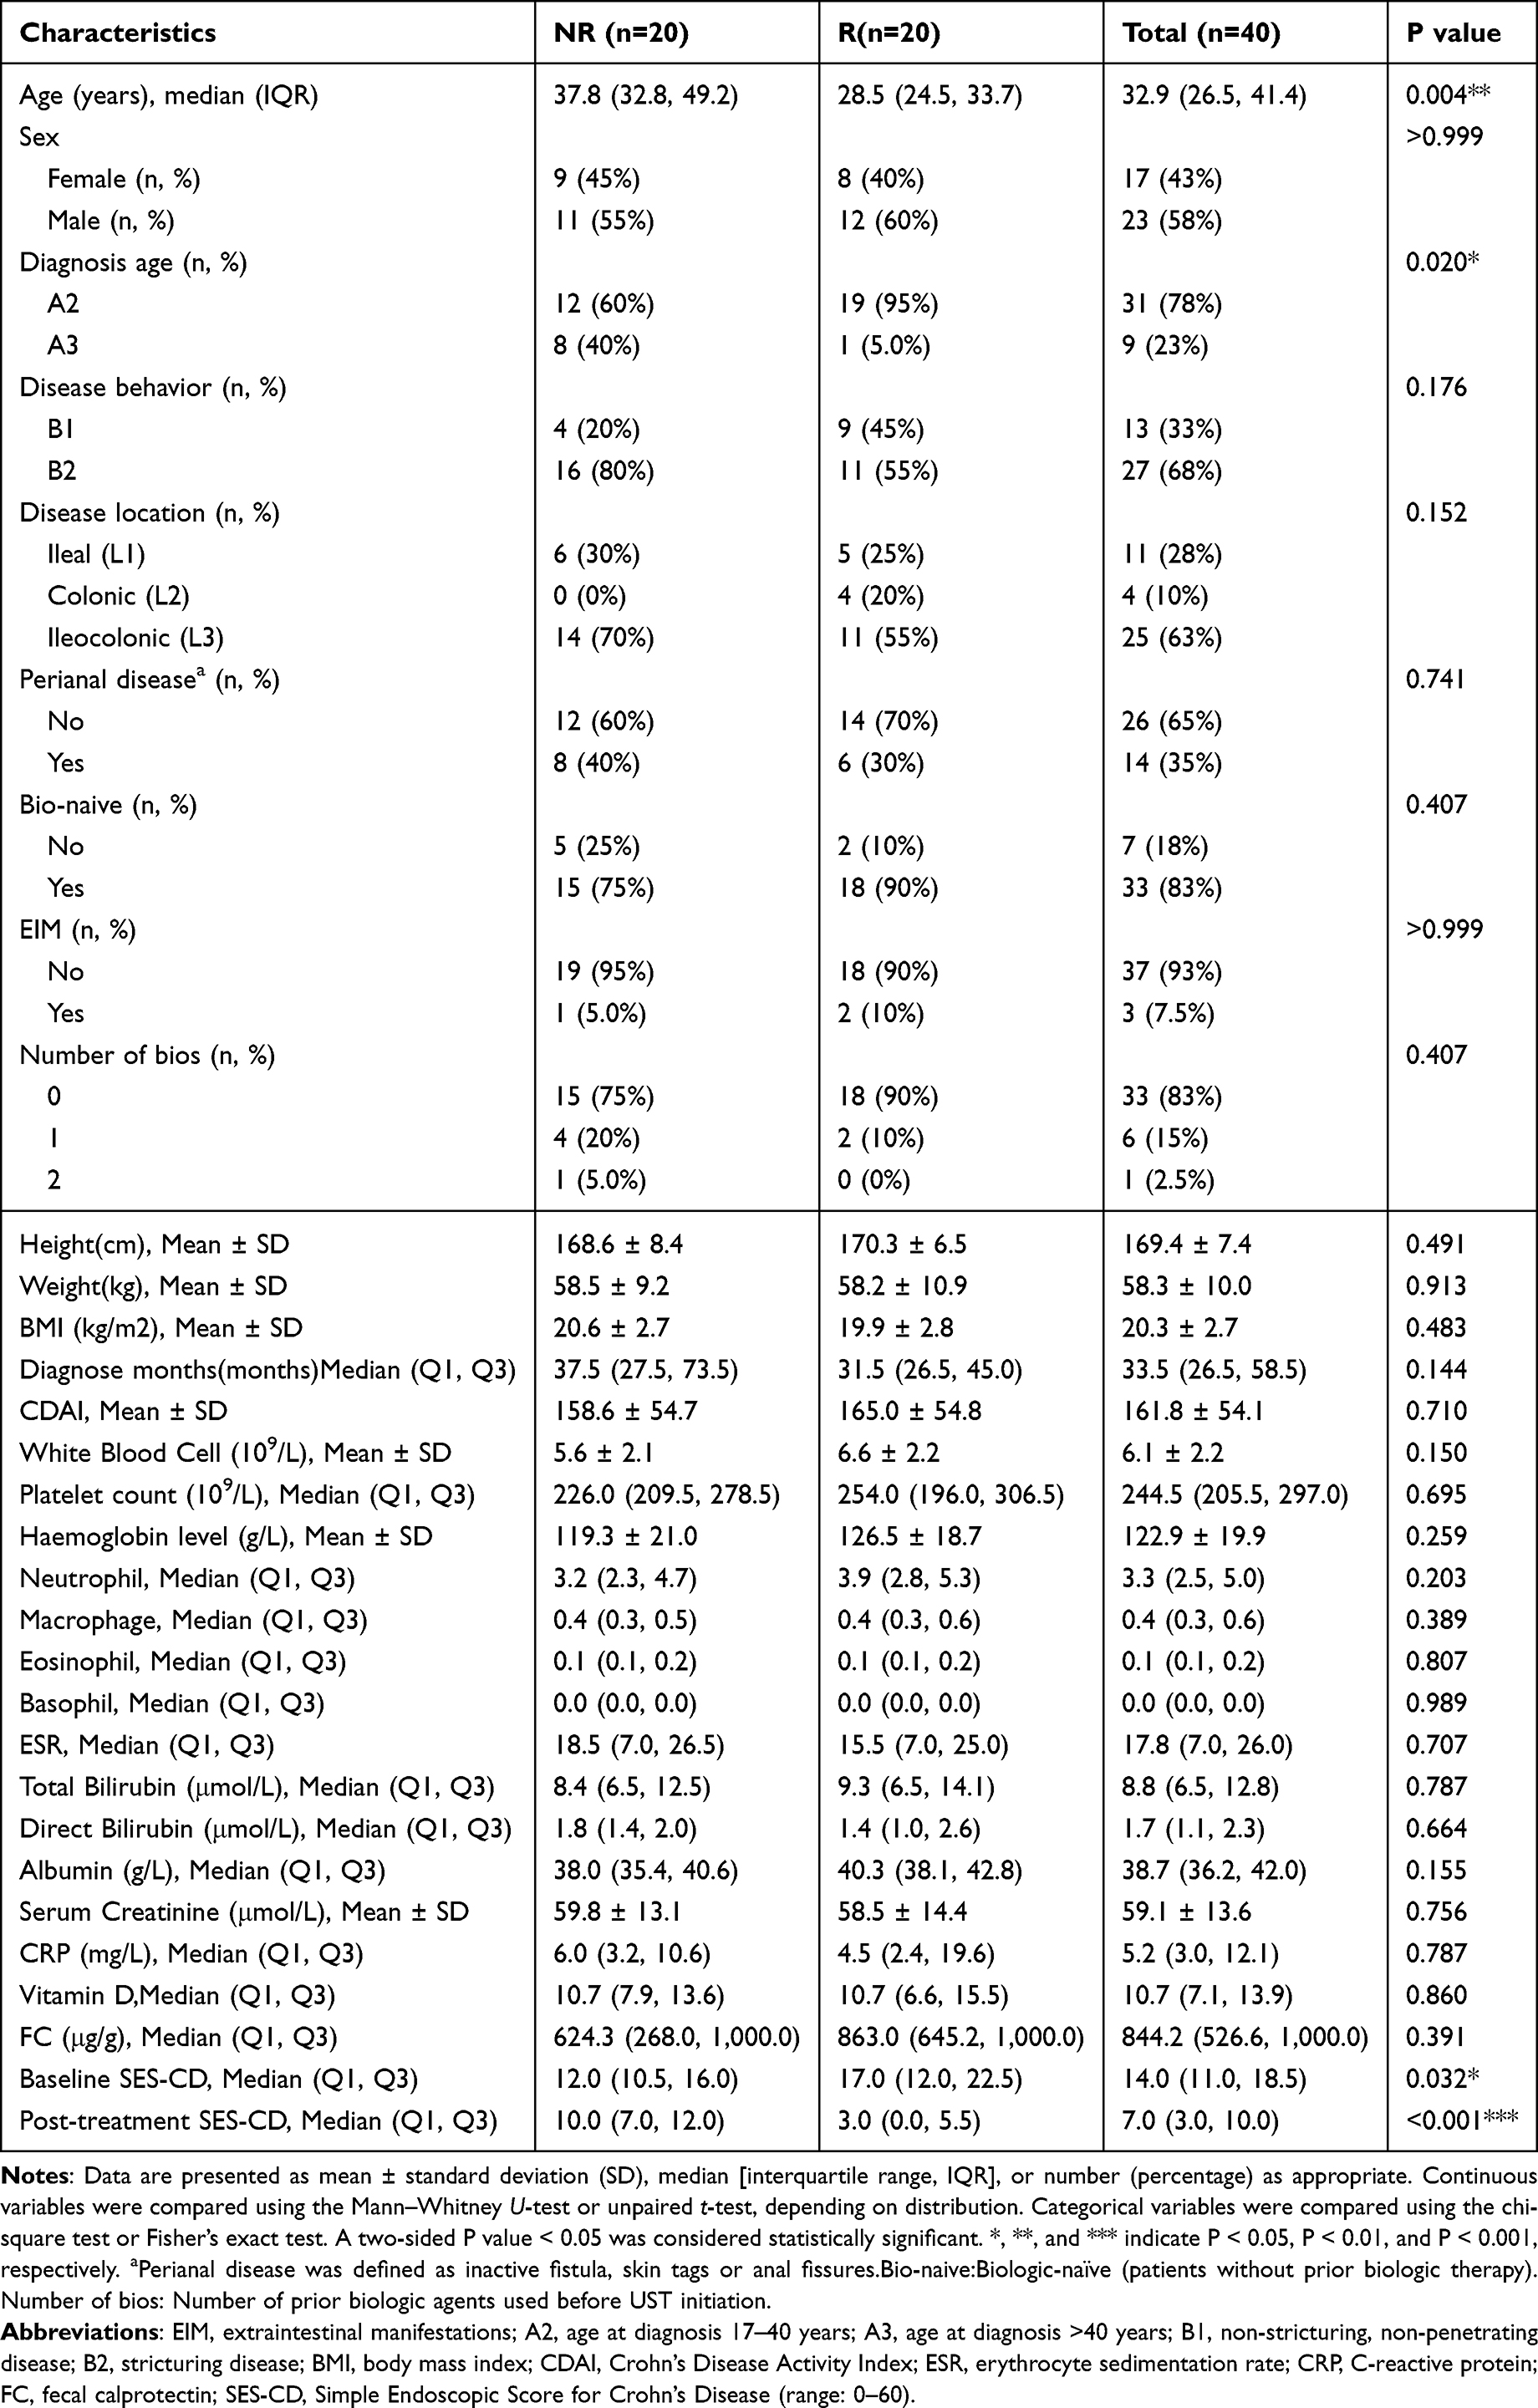 |
Table 1 Demographics of Clinical Samples |
Among the 40 patients included, 23 (58%) were male. The median age of participants was 33 years (IQR: 27–41 years), and the median disease duration was 34 months (IQR: 27–59 months). A majority of patients (83%) were biologic-naïve, while 15% had previously received one biologic agent other than UST, and 2% had used two different biologics prior to UST. Among non-responders, five patients had prior exposure to biologics: one patient had sequential exposure to infliximab followed by adalimumab, two patients had previously received infliximab only, and two patients had previously received adalimumab only. Among responders, two patients had prior biologic exposure: one patient received infliximab and the other adalimumab. All these patients were switched to UST because of insufficient response to prior biologic therapy, including persistent intestinal inflammation, elevated inflammatory markers, low drug concentrations, or high anti-drug antibody titers. Regarding age at diagnosis, 31 patients (78%) were diagnosed between 17–40 years, and 9 patients (23%) were diagnosed after the age of 40. In terms of disease location, 11 patients had ileal-type disease, 4 had colonic-type, and 25 had ileocolonic-type. As for disease behavior, 13 patients (33%) were classified as non-stricturing, non-penetrating, while 27 (68%) had stricturing disease. At baseline, perianal disease was present in 14% of patients. There were no significant differences between the two groups in laboratory parameters, including hemoglobin, fecal calprotectin, erythrocyte sedimentation rate (ESR), C-reactive protein (CRP), and Crohn’s Disease Activity Index (CDAI). However, compared to responders, non-responders were significantly older (P = 0.004), had a later age at disease onset (P = 0.020), and exhibited lower baseline SES-CD values (P = 0.032).
Analysis of Inflammation-Related Biomarkers by Olink
To evaluate differences in inflammation-related protein expression between UST responders and non-responders, we utilized the Olink® Inflammation panel. After adjusting for key baseline covariates—including age, age at diagnosis, and baseline SES-CD score—three DEPs were identified between the two groups (Supplementary Table 1). Specifically, IL8 and CD6 were significantly upregulated, while TSLP was downregulated in the non-responder group (Figure 1A and B). The expression patterns of these DEPs across all samples are illustrated in the heatmap shown in Figure 1C. Furthermore, the individual predictive performance of each protein was evaluated using ROC curve analysis, yielding AUC values of 0.605 for IL8, 0.655 for CD6, and 0.720 for TSLP, respectively (Figure 1D–F). Among them, TSLP demonstrated the highest AUC, suggesting a superior predictive capacity relative to the other DEPs.
 |
Figure 1 Differential expression of inflammation-related proteins between UST responders and non-responders.(A) Volcano plot illustrating the differential expression of 92 inflammation-related proteins measured using the Olink® platform. Red dots represent significantly upregulated proteins, blue dots indicate significantly downregulated proteins, and gray dots denote non-significant proteins. (B) Box-and-scatter plots showing the NPX of IL8, CD6, and TSLP in UST responders versus non-responders. (C) Heatmap depicting the expression profiles of the three DEPs across all participants. (D) ROC curve of IL8. (E) ROC curve of CD6. (F) ROC curve of TSLP. Abbreviations: NR, non-responder; R, responder; UST, ustekinumab; DEPs, differentially expressed proteins; NPX, normalized protein expression. Note: P < 0.05 was considered statistically significant. *P < 0.05. |
As a sensitivity analysis, we further adjusted the model for prior biologic exposure (bio-naïve status). After this adjustment, IL8 and TSLP remained differentially expressed between responders and non-responders, while CD6 showed attenuated differences (Supplementary Table 2). These findings indicate that the main results were largely robust to potential confounding by prior biologic exposure.
ELISA Validation and Diagnostic Value of the DEPs
To validate the findings of the Olink proteomic analysis, plasma levels of the identified DEPs were further measured using ELISA in an independent validation cohort of 20 patients (10 responders and 10 non-responders). The baseline demographic and clinical characteristics of the two groups were well balanced, with no significant differences in age, sex, CDAI, and fecal calprotectin levels. (Table 2; see Supplementary Table 3 for full details). In the non-responder group, IL8 (P= 0.043) and CD6 (P = 0.023) levels were significantly elevated, whereas TSLP expression was significantly higher in the responder group (P = 0.036) (Figure 2A). ROC curve analysis was conducted to evaluate the diagnostic performance of each biomarker. For IL8, the AUC was 0.77 (95% CI: 0.536–1). CD6 yielded an AUC of 0.8 (95% CI: 0.81–1). TSLP showed an AUC of 0.78 (95% CI: 0.562–0.998) (Figure 2B).
 |
Table 2 Demographics of ELISA Validation Cohort |
 |
Figure 2 External ELISA validation and diagnostic performance of DEPs.(A) Validation of plasma protein levels in an independent cohort of responders (n = 10) and non-responders (n = 10) using ELISA. Box plots show the distribution of IL8, CD6, and TSLP concentrations between groups. (B) ROC curves evaluating the diagnostic value of each biomarker. Abbreviations: DEPs, differentially expressed proteins. Note: *P < 0.05. |
Performance of the Logistic Regression Model
A multivariate logistic regression model was constructed based on the three identified DEPs: IL8, CD6, and TSLP. Variable importance analysis indicated that TSLP was the most influential predictor, followed by IL8 and CD6 (Figure 3A). The model demonstrated good discriminative ability, with an AUC of 0.828 (95% CI: 0.701–0.954) in the original dataset (Figure 3B). At the optimal cutoff point, the model achieved an accuracy of 77.5%, sensitivity of 90.0%, specificity of 65.0%, PPV of 72.0%, NPV of 86.7%, and an F1 score of 0.80 (Figure 4).
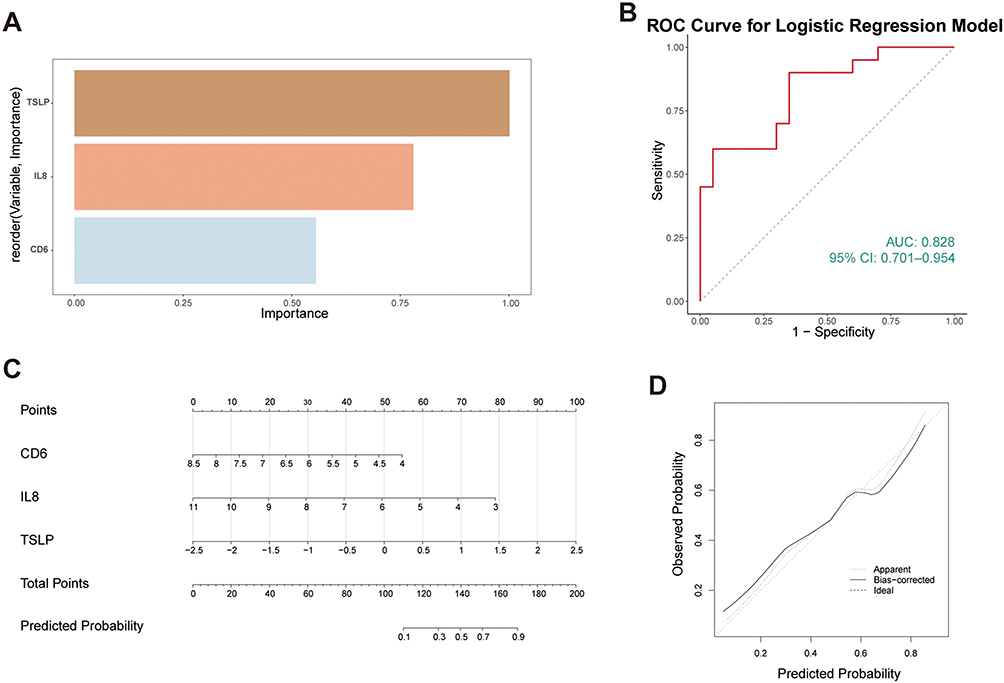 |
Figure 3 Performance and visualization of the logistic regression model for predicting response to UST.(A) Variable importance plot of the multivariate logistic regression model based on three differentially expressed proteins (IL8, CD6, and TSLP).(B) ROC curve of the model in the original dataset.(C) Nomogram constructed based on the logistic regression model to facilitate individualized prediction of UST response.(D) Calibration curve generated using 500 bootstrap resamples, assessing agreement between predicted and observed probabilities. Abbreviations: UST, ustekinumab; DEPs, differentially expressed proteins; ROC: Receiver Operating Characteristic; AUC, area under the curve. |
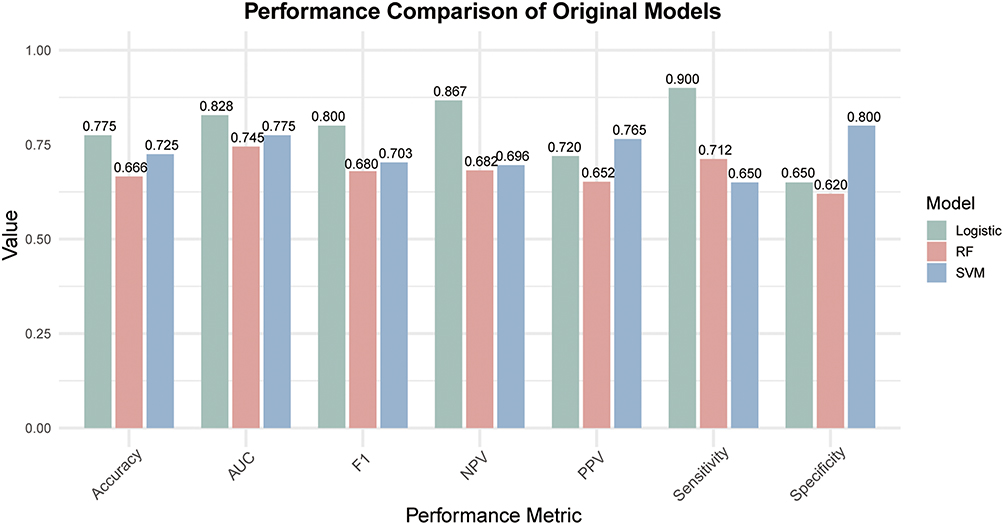 |
Figure 4 Comparison of predictive performance across original models: logistic regression, random forest, and SVM.Bar plots illustrate key classification metrics for each model, including accuracy, AUC, F1 score, PPV, NPV, sensitivity, and specificity. All results were derived from the original (non-cross-validated) models applied to the baseline dataset. Abbreviations: AUC, area under the curve; PPV, positive predictive value; NPV, negative predictive value; RF: random forest; SVM, support vector machine. |
Model robustness was further supported by 500 bootstrap resampling iterations, yielding a mean AUC of 0.850 (95% CI: 0.720–0.953) (Supplementary Figure 1). LOOCV also demonstrated consistent performance, with an AUC of 0.775 (95% CI: 0.629–0.921), although some variability was observed across individual folds (Supplementary Figure 2). To facilitate clinical application, a nomogram was developed based on the logistic regression model (Figure 3C). However, the calibration curve derived from bootstrap resampling (Figure 3D) revealed slight over- and underestimation in predicted probabilities, indicating the need for further refinement and external validation.
Performance of the Random Forest and Support Vector Machine Models
In parallel, a random forest model was developed. After hyperparameter optimization via repeated five-fold cross-validation, the model achieved an AUC of 0.745 (95% CI: 0.736–0.753) on the original dataset (Figure 4). Model robustness was confirmed through 500 bootstrap iterations, yielding a mean AUC of 0.769 (95% CI: 0.500–0.964). LOOCV further supported the model’s generalizability, with an AUC of 0.777 (95% CI: 0.633–0.922) (Supplementary Figures 1 and 2).
Additionally, a SVM model was constructed using grid search to optimize gamma and cost parameters. The final SVM model achieved an AUC of 0.775 (95% CI: 0.628–0.922) in the original dataset (Figure 4). Bootstrap validation (n = 500) produced a mean AUC of 0.766 (95% CI: 0.476–1.000), while LOOCV yielded an AUC of 0.757 (95% CI: 0.600–0.915), indicating moderate and consistent generalizability across validation strategies (Supplementary Figures 1 and 2).
Discussion
In this study, we employed Olink proteomics technology to systematically compare baseline plasma inflammatory protein profiles between UST long-term endoscopic responders and non-responders. After adjusting for potential confounders, three DEPs were identified: IL8 and CD6 were significantly upregulated in the non-responder group, whereas TSLP was elevated in the responder group. When combined in a traditional logistic regression model, the three-protein panel achieved an AUC of 0.828. Furthermore, both random forest and SVM algorithms yielded similarly robust predictive performance, reinforcing the reliability of the protein-based model. Combined with the predictive model results, these proteins may serve as potential predictive plasma biomarkers for UST non-responders.
Given the central role of inflammation in the pathogenesis of Crohn’s disease, we selected the Olink inflammation panel as the screening platform for predictive biomarkers in this study. Large cohort clinical studies have found that CXCL9 can accurately predict the occurrence of Crohn’s disease at an early stage, and plasma proteomics not only serves as predictive biomarkers but may also reveal potential biological pathways that lead to the preclinical onset of CD.26 Furthermore, a study on anti-TNF-α therapy showed that inflammatory protein levels in the blood or intestinal mucosa at the initiation of treatment (such as IL-17A, OSM, IL-7R, etc.) could predict later response status.27 These pieces of evidence suggest that inflammatory proteins are not only involved in disease onset and progression but also reflect the potential molecular mechanisms of drug response and non-response, holding important research and application prospects in the context of precision medicine. However, despite some studies focusing on the relationship between inflammatory factors and drug efficacy, most research on UST non-response has primarily concentrated on clinical indicators,13,28–30 and there is still limited systematic exploration of inflammation-related proteins. In genomics and proteomics, recent studies have identified varying differentially expressed proteins or genes.31–33
IL8 is a chemokine secreted predominantly by monocytes, macrophages, endothelial cells, and neutrophils, playing a pivotal role in recruiting neutrophils to sites of inflammation.34 Elevated IL8 levels have been widely reported in various chronic inflammatory diseases, including rheumatoid arthritis, chronic obstructive pulmonary disease, and psoriasis, as well as in several gastrointestinal malignancies such as colorectal cancer, hepatocellular carcinoma, and pancreatic cancer.35 Although its role in ulcerative colitis has been recognized,36 evidence regarding IL8 in Crohn’s disease, especially as a predictive biomarker for treatment response, remains limited. Our study revealed significantly higher IL8 levels in non-responders, suggesting a persistent neutrophil-driven inflammatory milieu that may undermine the efficacy of IL-12/23 blockade. CD6, a membrane glycoprotein of the immunoglobulin superfamily, is primarily expressed on T cells, and CD56^dim NK cells. It is implicated in T cell activation, immune synapse formation, and regulation of adaptive immunity.37 Genetic and functional studies have implicated CD6 in the pathogenesis of multiple autoimmune diseases, including multiple sclerosis,38 psoriasis39 and rheumatoid arthritis.40 In IBD, CD6 gene polymorphisms have been associated with increased disease susceptibility.41 However, studies on CD6 protein expression in CD are scarce. The upregulation of CD6 in non-responders may reflect aberrant T cell activation and immune dysregulation, contributing to insufficient response to UST. TSLP is an epithelial-derived cytokine expressed in mucosal tissues, exerting immunomodulatory effects via dendritic cell activation and Th2 immune skewing.42 In IBD, TSLP plays a context-dependent role: reduced expression has been associated with aggravated Th1-driven inflammation in CD, whereas elevated levels are linked to Th2-dominant ulcerative colitis.43 In our cohort, TSLP was significantly downregulated in non-responders, indicating a deficiency in counter-regulatory signaling that may exacerbate Th1/Th17-driven inflammation and compromise treatment outcomes.
Although previous studies reported baseline IL-23 levels as predictive of ustekinumab response in Crohn’s disease,28 our primary proteomic analysis did not directly quantify IL-23 because the Olink Inflammation panel lacks IL-23A and instead measures IL-12/23p40, a shared subunit that does not specifically reflect IL-23 heterodimer levels. Importantly, during the initial phase of our data analysis, we performed targeted ELISA measurements using the same set of 40 plasma samples to directly validate IL-23 levels. Consistent with prior reports, IL-23 concentrations were significantly higher in responders than in non-responders (P = 0.008), confirming that our cohort exhibits the expected IL-23 expression pattern and supporting the biological relevance of IL-23 in UST treatment response (Supplementary Figure 3). In contrast, our proteomic data revealed differential expression of IL-8, CD6, and TSLP, biomarkers that were not extensively evaluated in earlier studies. Divergence from prior literature may be partly attributable to methodological differences—high-throughput PEA proteomics versus single-target ELISA—as well as heterogeneity in cohort characteristics, baseline inflammatory burden, and timing of sample collection, all of which may influence cytokine dynamics. Notably, the multiplex proteomic platform enabled a broader and unbiased assessment of systemic inflammation, allowing the identification of complementary biomarkers beyond IL-23.
Notably, patients with a history of prior biologic failure have been reported to exhibit significantly poorer responses to subsequent biologic therapies compared with those who discontinued previous agents due to intolerance.44 This observation suggests that prior biologic failure may delineate a subgroup of patients with intrinsically refractory disease biology. Consequently, such differences could introduce bias into biomarker discovery, as the observed protein alterations might reflect generalized treatment resistance rather than mechanisms specifically related to ustekinumab response. In our cohort, baseline rates of prior biologic exposure did not differ significantly between responders and non-responders. Nevertheless, to assess the robustness of our findings, we performed a sensitivity analysis by including prior biologic exposure (bio-naïve status) as an additional covariate in the limma model. After this adjustment, IL8 and TSLP remained significantly differentially expressed, whereas CD6 showed an attenuated difference. These results indicate that the main proteomic signals—particularly IL8 and TSLP—were largely robust to the potential confounding effects of prior biologic therapy. Despite this, residual confounding cannot be completely excluded. Prior biologic therapy may influence immune homeostasis, pharmacokinetic profiles, and cytokine signaling pathways, thereby affecting downstream protein expression. Given our limited sample size, the stability of differential protein identification might also be sensitive to small changes in model specification. The sensitivity analysis therefore reinforces the reliability of IL8 and TSLP while underscoring the need for cautious interpretation of CD6. Future studies with larger, stratified cohorts and longitudinal sampling are warranted to validate these findings and to disentangle ustekinumab-specific proteomic effects from general markers of refractory disease.
A previous tissue-based sequencing study reported a multivariable logistic regression model incorporating HSD3B1, MUC4, CF1, and CCL11, which achieved an AUC of 0.746.14 Prior studies have successfully developed models to predict infliximab response in Crohn’s disease, typically integrating clinical, laboratory, and omics data to enable precision medicine applications such as disease activity monitoring, treatment selection, and relapse risk assessment.45,46
Building on this, our study aimed to develop a predictive model for UST response using baseline plasma proteomic profiles. Given the limited sample size (n = 40), we applied logistic regression, random forest, and SVM algorithms while carefully managing overfitting risk. Model performance was evaluated through internal validation strategies tailored to small datasets, including 500 bootstrap iterations and LOOCV. These complementary approaches allowed us to assess both performance stability and generalizability. Notably, the logistic regression model demonstrated favorable discriminative ability across multiple metrics. While external validation is still needed, the consistency across internal validation methods supports the robustness of our findings. Together, our models highlight candidate protein biomarkers, offering new insights for individualized therapeutic strategies in CD.
Collectively, these findings highlight IL8, CD6, and TSLP as potential immunological mediators of response to UST in Crohn’s disease. Their differential expression between responders and non-responders suggests potential utility as predictive biomarkers and implicates them in the underlying mechanisms of treatment failure. Importantly, this study utilized readily accessible peripheral blood samples, offering practical advantages for clinical translation. If confirmed in larger cohorts, baseline proteomic profiling could inform subsequent treatment decisions and help guide individualized therapy. Looking forward, the management of IBD is likely to be increasingly shaped by precision and personalized medicine approaches, and our results may provide a novel foundation and inspiration for such strategies. However, several limitations should be noted. (1) This was a single-center retrospective study with a relatively small sample size, which may limit statistical power and generalizability. Although robust internal validation was performed using bootstrap resampling and leave-one-out cross-validation, external validation in independent cohorts remains essential. (2) The proteomic analysis was restricted to a single-omics platform (Olink inflammation panel), which may have excluded other potentially relevant biomarkers. (3) While the proposed mechanistic links among IL8, CD6, TSLP, and UST response appear biologically plausible, they remain hypothetical; our findings reflect associations rather than causal relationships. (4) Responders and non-responders differed in certain baseline characteristics (eg, age, age at diagnosis, and SES-CD score). Although covariate adjustment was conducted, residual confounding cannot be completely excluded and may influence biomarker associations and model performance. Despite these limitations, our findings provide important insights into the potential immuno-inflammatory mediators of UST response. Future studies should aim to validate these findings in larger, multicenter cohorts and integrate multi-omics approaches—such as genomics and transcriptomics—to provide a more comprehensive understanding of the molecular determinants of UST response.
Conclusion
This study identified three inflammation-related plasma proteins—IL-8, CD6, and TSLP—at baseline that accurately predict long-term endoscopic response to ustekinumab in patients with Crohn’s disease. Differential expression of these proteins was confirmed by ELISA, and a logistic regression model combining the three markers achieved robust predictive performance (AUC = 0.828), outperforming random forest (AUC = 0.745) and SVM (AUC = 0.775) models. These findings provide a basis for developing personalized treatment strategies and guide future research focused on validating and exploring the mechanistic roles of these biomarkers in larger, independent cohorts.
Data Sharing Statement
The datasets generated and/or analyzed during the current study, as well as the analysis methods and relevant materials, are included in this article or can be obtained from the corresponding authors, Fan Zhou and Lei Wang, upon reasonable request.
Ethics Approval and Consent to Participate
This study was conducted in accordance with the principles of the Declaration of Helsinki. The study protocol was reviewed and approved by the Ethics Committee of Nanjing Drum Tower Hospital (Approval No. 2024-614-01). Written informed consent was obtained from all participants prior to enrollment.
Acknowledgments
The authors sincerely thank all patients who participated in this study and the clinical staff who assisted with sample collection and data management. We also acknowledge the technical support from the Olink proteomics platform.
Author Contributions
CW: Conceptualization, Methodology, Investigation, Data Curation, Formal Analysis, Visualization, Writing – Original Draft.
JZ: Methodology, Investigation, Data Curation, Formal Analysis, Visualization, Writing – Review & Editing.
XQ: Methodology, Investigation, Data Curation, Writing – Review & Editing.
CP: Conceptualization, Writing – Review & Editing.
FZ: Conceptualization, Project Administration, Supervision, Writing – Review & Editing.
LW: Conceptualization, Methodology, Project Administration, Supervision, Writing – Review & Editing.
All authors took part in drafting, revising, or critically reviewing the article; gave final approval of the version to be published; have agreed on the journal to which the article has been submitted; and agree to be accountable for all aspects of the work.
Funding
This work was supported by the Natural Science Foundation of Jiangsu Province (Grant No. BK20220178).
Disclosure
CW, JZ, FZ and LW report grants from Natural Science Foundation of Jiangsu Province (BK20220178) during the course of the study. The authors declare no other financial or non‑financial conflicts of interest that could influence the interpretation or presentation of this study. The authors confirm that no affiliations, consultancies, grants, patents, royalties, equity interests, or personal relationships relevant to the submitted manuscript exist.
References
1. Agrawal M, Spencer EA, Colombel JF, Ungaro RC. Approach to the management of recently diagnosed inflammatory bowel disease patients: a user’s guide for adult and pediatric gastroenterologists. Gastroenterology. 2021;161(1):47. doi:10.1053/j.gastro.2021.04.063
2. Dolinger M, Torres J, Vermeire S. Crohn’s disease. Lancet. 2024;403(10432):1171–1191 doi:10.1016/S0140-6736(23)02586-2
3. Ng SC, Shi HY, Hamidi N, et al. Worldwide incidence and prevalence of inflammatory bowel disease in the 21st century: a systematic review of population-based studies. Lancet. 2017;390(10114):2769–2778. doi:10.1016/S0140-6736(17)32448-0
4. Verstockt B, Salas A, Sands BE, et al. IL-12 and IL-23 pathway inhibition in inflammatory bowel disease. Nat Rev Gastroenterol Hepatol. 2023;20(7):433–446. doi:10.1038/s41575-023-00768-1
5. Gordon H, Minozzi S, Kopylov U, et al. ECCO guidelines on therapeutics in crohn’s disease: medical treatment. J Crohn’s Colitis. 2024;18(10):1531–1555. doi:10.1093/ecco-jcc/jjae091
6. De Célix C R, Chaparro M, Gisbert JP. Real-world evidence of the effectiveness and safety of ustekinumab for the treatment of crohn’s disease: systematic review and meta-analysis of observational studies. JCM. 2022;11(14):4202. doi:10.3390/jcm11144202
7. Feagan BG, Sandborn WJ, Gasink C, et al. Ustekinumab as induction and maintenance therapy for crohn’s disease. N Engl J Med. 2016;375(20):1946–1960. doi:10.1056/NEJMoa1602773
8. Subramanian S, Ekbom A, Rhodes JM. Recent advances in clinical practice: a systematic review of isolated colonic Crohn’s disease: the third IBD? Gut. 2017;66(2):362–381. doi:10.1136/gutjnl-2016-312673
9. Khorrami S, Ginard D, Marín-Jiménez I, et al. Ustekinumab for the treatment of refractory crohn’s disease: the spanish experience in a large multicentre open-label cohort. Inflamm Bowel Dis. 2016;22(7):1662–1669. doi:10.1097/MIB.0000000000000842
10. Casas Deza D, García López S, Lafuente Blasco M, et al. Efficacy and safety of ustekinumab in real clinical practice. Retrospective multicentre study. ARAINF cohort Gastroenterol Hepatol. 2020;43(3):126–132. doi:10.1016/j.gastrohep.2019.09.011
11. Hanžel J, Zdovc J, Kurent T, et al. Peak concentrations of ustekinumab after intravenous induction therapy identify patients with crohn’s disease likely to achieve endoscopic and biochemical remission. Clin Gastroenterol Hepatol. 2021;19(1):111–118.e10. doi:10.1016/j.cgh.2020.02.033
12. Shehab M, Abdullah I, Alfadhli A, Alrashed F. Relationship between Ustekinumab trough concentrations and clinical, biochemical and endoscopic outcomes in Crohn’s disease: a multi-center nationwide retrospective study (TARGET STUDY). Medicine. 2024;103(27):e38804. doi:10.1097/MD.0000000000038804
13. Gisbert JP, Chaparro M. Predictors of primary response to biologic treatment [anti-tnf, vedolizumab, and ustekinumab] in patients with inflammatory bowel disease: from basic science to clinical practice. J Crohn’s Colitis. 2020;14(5):694–709. doi:10.1093/ecco-jcc/jjz195
14. Wang C, Gu Y, Chu Q, et al. Gut microbiota and metabolites as predictors of biologics response in inflammatory bowel disease: a comprehensive systematic review. Microbiol Res. 2024;282:127660. doi:10.1016/j.micres.2024.127660
15. He M, Li C, Tang W, Kang Y, Zuo Y, Wang Y. Machine learning gene expression predicting model for ustekinumab response in patients with Crohn’s disease. Immunity Inflam Dis. 2021;9(4):1529–1540. doi:10.1002/iid3.506
16. Roblin X, Duru G, Papamichael K, et al. Development of antibodies to ustekinumab is associated with loss of response in patients with inflammatory bowel disease. JCM. 2023;12(10):3395. doi:10.3390/jcm12103395
17. Turner D, Ricciuto A, Lewis A, et al. STRIDE-II: an Update on the Selecting Therapeutic Targets in Inflammatory Bowel Disease (STRIDE) Initiative of the International Organization for the Study of IBD (IOIBD): determining Therapeutic Goals for Treat-to-Target strategies in IBD. Gastroenterology. 2021;160(5):1570–1583. doi:10.1053/j.gastro.2020.12.031
18. Bowser BL, Robinson RAS. Enhanced multiplexing technology for proteomics. Annual Rev Anal Chem. 2023;16(1):379–400. doi:10.1146/annurev-anchem-091622-092353
19. Lundberg M, Eriksson A, Tran B, Assarsson E, Fredriksson S. Homogeneous antibody-based proximity extension assays provide sensitive and specific detection of low-abundant proteins in human blood. Nucleic Acids Res. 2011;39(15):e102. doi:10.1093/nar/gkr424
20. Gao M, Wu X, Jiao X, et al. Prognostic and predictive value of angiogenesis-associated serum proteins for immunotherapy in esophageal cancer. J ImmunoTherap Cancer. 2024;12(2):e006616. doi:10.1136/jitc-2022-006616
21. Tu X, Chen X, Xu L, et al. Serum olink targeted proteomics identifies IL-17A as a prospective inflammatory marker for the prediction and diagnosis of kawasaki disease. J Inflamm Res. 2025;18:3093. doi:10.2147/JIR.S506154
22. Wang T, Yang S, Long Y, Li Y, Wang T, Hou Z. Olink proteomics analysis uncovers the landscape of inflammation-related proteins in patients with acute compartment syndrome. Front Immunol. 2023;14:1293826. doi:10.3389/fimmu.2023.1293826
23. Bao XH, Chen BF, Liu J, et al. Olink proteomics profiling platform reveals non-invasive inflammatory related protein biomarkers in autism spectrum disorder. Front Mol Neurosci. 2023;16:1185021. doi:10.3389/fnmol.2023.1185021
24. Petagna L, Antonelli A, Ganini C, et al. Pathophysiology of Crohn’s disease inflammation and recurrence. Biology Direct. 2020;15:23. doi:10.1186/s13062-020-00280-5
25. Rutgeerts P, Gasink C, Chan D, et al. Efficacy of ustekinumab for inducing endoscopic healing in patients with crohn’s disease. Gastroenterology. 2018;155(4):1045–1058. doi:10.1053/j.gastro.2018.06.035
26. Leibovitzh H, Lee SH, Garay JAR, et al. Immune response and barrier dysfunction-related proteomic signatures in preclinical phase of Crohn’s disease highlight earliest events of pathogenesis. Gut. 2023;72(8):1462–1471. doi:10.1136/gutjnl-2022-328421
27. Cui G, Fan Q, Li Z, Goll R, Florholmen J. Evaluation of anti-TNF therapeutic response in patients with inflammatory bowel disease: current and novel biomarkers. EBioMedicine. 2021;66:103329. doi:10.1016/j.ebiom.2021.103329
28. Bertani L, Antonioli L, Fornili M, et al. baseline assessment of serum cytokines predicts clinical and endoscopic response to ustekinumab in patients with crohn’s disease: a prospective pilot study. Inflamm Bowel Dis. 2024;30(12):2449–2456. doi:10.1093/ibd/izae133
29. Be S, C J, Bg F, et al. Efficacy and Safety of MEDI2070, an antibody against interleukin 23, in patients with moderate to severe crohn’s disease: a phase 2a study. Gastroenterology. 2017;153(1):77–86.e6. doi:10.1053/j.gastro.2017.03.049
30. González LL, Delgado TV, Morón JV, et al. Ustekinumab in Crohn’s disease: real-world outcomes and predictors of response. Rev Esp Enferm Dig. 2022;114(5):272–279. doi:10.17235/reed.2020.7352/2020
31. Li Q, Huang Z, Yang H, et al. Intestinal mRNA expression profiles associated with mucosal healing in ustekinumab-treated Crohn’s disease patients: bioinformatics analysis and prospective cohort validation. J Transl Med. 2024;22(1):595. doi:10.1186/s12967-024-05427-w
32. Van den berghe N, Alsoud D, Verstockt B, Vermeire S, Declerck P, Thomas D. Evaluation of serum cytokines and acute phase proteins as possible pharmacodynamic biomarkers to monitor endoscopic remission during ustekinumab therapy in patients with Crohn’s disease. Therap Adv Gastroenterol. 2023;16:17562848231189110. doi:10.1177/17562848231189110
33. Xu Y, Wang S, Ye Z, Zhang H. Identifying hub genes in response to ustekinumab and the impact of ustekinumab treatment on fibrosis in Crohn’s disease. Front Immunol. 2024;15:1401733. doi:10.3389/fimmu.2024.1401733
34. Kuttappan D, Muttathukonam SH, Amalaradjou MA. Cheese starter cultures attenuate inflammation in the in vitro Caco-2 model. AIMS Microbiol. 2025;11(2):369. doi:10.3934/microbiol.2025017
35. Cambier S, Gouwy M, Proost P. The chemokines CXCL8 and CXCL12: molecular and functional properties, role in disease and efforts towards pharmacological intervention. Cell. Mol. Immunol. 2023;20(3):217. doi:10.1038/s41423-023-00974-6
36. Subramanian S, Rhodes JM, Hart AC, et al. Characterization of epithelial IL-8 response to inflammatory bowel disease mucosal E. coli and its inhibition by mesalamine. Inflamm Bowel Dis. 2008;14(2):162. doi:10.1002/ibd.20296
37. Gurrea-Rubio M, Fox DA, Castresana JS. CD6 in human disease. Cells. 2025;14(4):272. doi:10.3390/cells14040272
38. Li Y, Singer NG, Whitbred J, Bowen MA, Fox DA, Lin F. CD6 as a potential target for treating multiple sclerosis. Proc Natl Acad Sci USA. 2017;114(10):2687–2692. doi:10.1073/pnas.1615253114
39. Parthasaradhi A. Safety and efficacy of itolizumab in the treatment of psoriasis: a case series of 20 patients. JCDR. 2016;10(11):WD01–3. doi:10.7860/JCDR/2016/21040.8848
40. Li Y, Ruth JH, Rasmussen SM, et al. Attenuation of murine collagen‐induced arthritis by targeting CD6. Arthritis Rheumatol. 2020;72(9):1505–1513. doi:10.1002/art.41288
41. Ma C, Wu W, Lin R, et al. Critical Role of CD6highCD4+ T Cells in Driving Th1/Th17 Cell immune responses and mucosal inflammation in IBD. J Crohn’s Colitis. 13;4:510–524 doi:10.1093/ecco-jcc/jjy179
42. Liu YJ, Soumelis V, Watanabe N, et al. TSLP: an epithelial cell cytokine that regulates T cell differentiation by conditioning dendritic cell maturation. Ann Rev Immunol. 2007;25:193–219. doi:10.1146/annurev.immunol.25.022106.141718
43. Park JH, Jeong DY, Peyrin-Biroulet L, Eisenhut M, Shin JI. Insight into the role of TSLP in inflammatory bowel diseases. Autoimmunity Rev. 2017;16(1):55–63. doi:10.1016/j.autrev.2016.09.014
44. Samnani S, Wong ECL, Hamam H, et al. Outcomes of patients with prior biologic intolerance are better than those with biologic failure in clinical trials of inflammatory bowel disease. J Crohns Colitis. 2025;19(3):jjae151. doi:10.1093/ecco-jcc/jjae151
45. Magalhaes D, Santiago M, Patita M, et al. Serum neutrophil biomarkers to predict crohn’s disease progression and infliximab treatment outcomes. UEG Journal. 2025;13(2):229–239. doi:10.1002/ueg2.12712
46. Noor NM, Lee JC, Bond S, et al. A biomarker-stratified comparison of top-down versus accelerated step-up treatment strategies for patients with newly diagnosed Crohn’s disease (PROFILE): a multicentre, open-label randomised controlled trial. Lancet Gastroenterol Hepatol. 2024;9(5):415. doi:10.1016/S2468-1253(24)00034-7
 © 2025 The Author(s). This work is published and licensed by Dove Medical Press Limited. The
full terms of this license are available at https://www.dovepress.com/terms
and incorporate the Creative Commons Attribution
- Non Commercial (unported, 4.0) License.
By accessing the work you hereby accept the Terms. Non-commercial uses of the work are permitted
without any further permission from Dove Medical Press Limited, provided the work is properly
attributed. For permission for commercial use of this work, please see paragraphs 4.2 and 5 of our Terms.
© 2025 The Author(s). This work is published and licensed by Dove Medical Press Limited. The
full terms of this license are available at https://www.dovepress.com/terms
and incorporate the Creative Commons Attribution
- Non Commercial (unported, 4.0) License.
By accessing the work you hereby accept the Terms. Non-commercial uses of the work are permitted
without any further permission from Dove Medical Press Limited, provided the work is properly
attributed. For permission for commercial use of this work, please see paragraphs 4.2 and 5 of our Terms.
Recommended articles
Proteomic Analysis of Cerebrospinal Fluid: Toward the Identification of Biomarkers for Early Central Nervous System Infection
Ding Y, Wang H, Li K, Zhao S, Li D
Infection and Drug Resistance 2026, 19:570645
Published Date: 2 February 2026