Back to Journals » ImmunoTargets and Therapy » Volume 9
Development of Anti-Yersinia pestis Human Antibodies with Features Required for Diagnostic and Therapeutic Applications
Authors Lillo AM ![]() , Velappan N
, Velappan N ![]() , Kelliher JM
, Kelliher JM ![]() , Watts AJ
, Watts AJ ![]() , Merriman SP, Vuyisich G, Lilley LM, Coombs KE
, Merriman SP, Vuyisich G, Lilley LM, Coombs KE ![]() , Mastren T, Teshima M
, Mastren T, Teshima M ![]() , Stein BW
, Stein BW ![]() , Wagner GL, Iyer S, Bradbury ARM
, Wagner GL, Iyer S, Bradbury ARM ![]() , Harris JF
, Harris JF ![]() , Dichosa AE
, Dichosa AE ![]() , Kozimor SA
, Kozimor SA
Received 10 June 2020
Accepted for publication 16 September 2020
Published 27 November 2020 Volume 2020:9 Pages 299—316
DOI https://doi.org/10.2147/ITT.S267077
Checked for plagiarism Yes
Review by Single anonymous peer review
Peer reviewer comments 2
Editor who approved publication: Professor Michael Shurin
Antonietta M Lillo,1 Nileena Velappan,1 Julia M Kelliher,1 Austin J Watts,1 Samuel P Merriman,1 Grace Vuyisich,2 Laura M Lilley,2 Kent E Coombs,1 Tara Mastren,2 Munehiro Teshima,1 Benjamin W Stein,2 Gregory L Wagner,2 Srinivas Iyer,1 Andrew RM Bradbury,3 Jennifer Foster Harris,1 Armand E Dichosa,1 Stosh A Kozimor2
1Bioscience Division, Los Alamos National Laboratory, Los Alamos, NM, USA; 2Chemistry Division, Los Alamos National Laboratory, Los Alamos, NM, USA; 3Specifica Inc., Santa Fe, NM, USA
Correspondence: Antonietta M Lillo
USA Department of Energy, In Care of Los Alamos National Laboratory, Bikini Atoll Road, SM-30, TA-43, Building 0001, Room 220, Los Alamos, NM 87545, USA
Tel +1 505-606-0578
Fax +1 505-665-9030
Email [email protected]
Background: Yersinia pestis is a category A infective agent that causes bubonic, septicemic, and pneumonic plague. Notably, the acquisition of antimicrobial or multidrug resistance through natural or purposed means qualifies Y. pestis as a potential biothreat agent. Therefore, high-quality antibodies designed for accurate and sensitive Y. pestis diagnostics, and therapeutics potentiating or replacing traditional antibiotics are of utmost need for national security and public health preparedness.
Methods: Here, we describe a set of human monoclonal immunoglobulins (IgG1s) targeting Y. pestis fraction 1 (F1) antigen, previously derived from in vitro evolution of a phage-display library of single-chain antibodies (scFv). We extensively characterized these antibodies and their effect on bacterial and mammalian cells via: ELISA, flow cytometry, mass spectrometry, spectroscopy, and various metabolic assays.
Results: Two of our anti-F1 IgG (αF1Ig 2 and αF1Ig 8) stood out for high production yield, specificity, and stability. These two antibodies were additionally attractive in that they displayed picomolar affinity, did not compete when binding Y. pestis, and retained immunoreactivity upon chemical derivatization. Most importantly, these antibodies detected < 1,000 Y. pestis cells in sandwich ELISA, did not harm respiratory epithelial cells, induced Y. pestis agglutination at low concentration (350 nM), and caused apparent reduction in cell growth when radiolabeled at a nonagglutinating concentration (34 nM).
Conclusion: These antibodies are amenable to the development of accurate and sensitive diagnostics and immuno/radioimmunotherapeutics.
Keywords: immunodiagnostic, radioimmunotherapy, RIT, immunotherapy, radiolabeling, immunoantibiotic, lateral flow assay, LFA
Introduction
Yersinia pestis is a Gram negative bacterium listed as a category A infective agent that causes bubonic, septicemic, and pneumonic plague.1 The latter form is of special interest to biodefense, as it is highly lethal and transmitted through aerosol.2 Fraction 1 (F1) is the dominant surface antigen of Y. pestis and an important determinant in the virulence of this microorganism. F1 is produced from the Caf1 (capsular antigen F1) region of pMT1 plasmid in high yields at 35°C–37°C, and is displayed on the bacterial surface.3,4 After the initial intracellular stage of infection, F1-positive Y. pestis strains are released from macrophages and express large amounts of F1,5 some of which can be found in serum, urine, and buboes, and can be used as a diagnostic marker.6,7 Together with other antiphagocytic factors, F1 efficiently limits phagocytosis of Y. pestis by host cells and contributes to the extracellular survival of Y. pestis in vivo.8,9 Not surprisingly, F1-negative Y. pestis strains have lower virulence.5,10 However it is important to note that highly virulent F1-negative strains have been described.11–14 While anti-F1 antibodies will not be effective against these strains, they have shown efficacy in ameliorating the effects of F1-positive Y. pestis infection.15–19 These antibodies are mainly polyclonal and animal-derived, and are thus unsuitable for human therapy. The presence of F1 in specimens from infected individuals and the positive contribution of F1 to the success of Y. pestis infections makes this antigen an ideal target for the development of antibody-based diagnostics6,20,21 and novel antiplague therapeutics with the potential to fight drug resistance.22
Antibody-based diagnostics are popular for analysis of complex samples, owing to limited sample-processing needs, high specificity, and limited instrumentation requirements.23 Antibody-based therapeutics, on the other hand, while popular in targeted treatment of cancer and autoimmune diseases,24–27 have only recently been deployed more broadly in the medical field. Examples include the proposition that antibodies could be quite effective in fighting antibiotic-resistant bacteria, provided that they bind the target with high specificity (only the pathogen is recognized) and high affinity (low dissociation constant [KD], and low dosage requirement),28–30 have favorable pharmacokinetics, and can be produced in large quantities. There are currently three FDA-approved antibodies (raxibacumab, obiltoxaximab, and bezlotoxumab) that protect infected individuals through neutralization of bacterial exotoxins.31 Nine other antibodies are currently in clinical trials, five of which act through specific binding of bacteria, rather than toxin neutralization.31 The FDA-approved antibiotic antibodies are administered intravenously;32–34 however, methods for inhalation strategies for more targeted treatments are under exploration. Antibiotic antibodies, when highly selective for the target bacteria, should not affect healthy tissue or the natural microbiota (even when administered intravenously), promising higher efficacy and safety than traditional antibiotics.35
Currently, there are no well-established methods to ensure that antibodies selected for binding bacterial antigens have antimicrobial activity. Therefore, for therapeutic (and most definitely for diagnostic) applications, derivatization of antibodies with cytotoxic molecules, DNA, or fluorophores is usually required. While site-selective derivatization of antibodies to avoid the antigen-binding region is possible,36–39 popular methods to obtain antibody conjugates exploit natural amino-acid side-chain reactivity, commonly free amines on lysine residues and/or solvent-exposed thiols on cystine residues.40 These strategies require optimization so as to avoid partial or total loss of immunoreactivity and/or fragmentation.41 It is also critical that unconjugated antibodies have affinity and specificity high enough that upon derivatization for therapeutic/diagnostic use, they retain a level of immunoreactivity compatible with efficient treatment/detection. For antibiotic use in humans, it is preferable that therapeutic antibodies be human-derived or humanized to avoid an adverse immunoresponse. Finally, a therapeutic cocktail of antibodies is preferable to a single antibody in fighting drug resistance. When a single antibody is used, minimal mutation of the target antigen might result in resistance to antibody treatment.42–45 However, mutations in multiple epitopes of a functional antigen (eg, Y. pestis F1 antigen) are unlikely to happen, since they might result in loss of function (eg, Y. pestis efficiency in escaping host-cell phagocytosis). Therefore, an antibody cocktail targeting multiple epitopes of an antigen is better suited to fight resistance than a single antibody. This oligoclonal antibody approach is analogous to the clinical administration of multiple classes of small-molecule antibiotics so as to attack resistance-prone bacteria simultaneously and reduce chances of emerging resistance.46,47
In vitro selection of antibodies from display libraries,48 (mainly using phage49,50 and yeast51 display methods), enables identification of highly specific monoclonal antibodies and offers advantages over more common methods (eg, in vivo selection approaches). A library presubtraction step can be added to the in vitro selection process, allowing elimination of antibody binding to negative targets, which is not possible in animals.52–55 Furthermore, toggling between different display platforms that relay on the protein-production machinery of different organisms (eg, phage-producing Escherichia coli and yeast Saccharomyces cerevisiae) increases the likelihood of selecting antibodies that are well expressed and stable. Finally, in vitro selections allow improvement in antibody affinity for the target (when needed) by a process known as affinity maturation.56
We have previously selected a set of seven human anti-F1 single-chain antibodies (scFvs) from a large phage-display library57 and demonstrated their specificity for F1-positive Y. pestis as phage-displayed antibodies.58 The motivation of the present work was to further develop these antibodies for potential diagnostic and therapeutic applications. The results have potential for creating new biodefense tools and advancing the field of immunoantibiotics in general. While the majority of this study was focused on determining affinity and specificity (as free, chemically derivatized, and radiolabeled proteins) of two antibodies binding to Y. pestis non-competitively, we also characterized these antibodies’ stability and effect on human cells and Y. pestis . Also included are “proof-of-principle” experiments that highlight potential use of these antibodies as targeted α-therapeutics. The results suggested that these antibodies are amenable to the development of accurate and sensitive diagnostics and immuno/radioimmunotherapeutics.
Methods
Bacterial Target Preparation
Y. pestis A1122 and Bacillus anthracis Sterne were obtained from archived culture stocks in the Los Alamos National Laboratory. Y. pseudotuberculosis ATCC 27,802 and Pseudomonas fluorescens ATCC 13,475 were obtained from the American Tissue Culture Collection. E. coli BL21 DE3 cells were purchased from New England Biolabs (Ipswich, MA, USA). All bacterial species were grown from single clones on tryptic soy broth (TSB; MP Biomedicals, Irvine, CA, USA) agar plates incubated at 26°C overnight, and liquid cultures were prepared in brain–heart infusion (BHI) broth (BD Biosciences, Franklin Lakes, NJ, USA) at 37°C overnight. F1-positive Y. pestis was cultured at 37°C in BHI medium supplemented with 2.5 mM CaCl2. F1-negative Y. pestis cultures were grown at 23°C without CaCl2. Live cells were washed and resuspended in PBS prior to antibody staining. Bacterial cell fixation was achieved using cold 4% paraformaldehyde (Sigma-Aldrich, St Louis, MO, USA), and cells were washed with PBS before and after fixation. Cell washing was performed by centrifugation at 8,500 g for 10 minutes. Absence of live cells (before using fixed cells in BSL1 conditions) was assessed by plating 100 µL fixed cell suspension on a TSB agar plate and checking for colony formation after incubation at 26°C overnight. Fixed cells were stored at 4°C for several months in the presence of 0.1% sodium azide.
Antibodies
The previously described anti-F1 scFv antibodies58 were converted to IgGs by inserting the amino-acid sequences corresponding to the variable heavy (VH) and variable light (VL) antibody regions into a standard IgG1 scaffold. The resulting protein sequences were submitted to ATUM (Newark, CA, USA) for codon-optimized back-translation, gene synthesis, and expression as full-length IgG1 antibodies in HEK293 cells. Commercial anti-F1 YPF19 from Advanced ImmunoChemical (Long Beach, CA, USA) was used as positive control and natural human IgG1 (Abcam, Cambridge, MA, USA) as negative control in various binding assays. In addition, scFv and IgG formats of an anti-influenza M2 scFv59 were also used as negative controls, since these antibodies use the same vector systems as the anti-F1 antibodies described here. Enzymatic and/or fluorescent labeling of antibodies (eg, horseradish peroxidase [HRP], phycoerythrin [PE], and allophycocyanine [APC]) was performed using Lightning Link kits (Novus Biologicals, Centennial, CO, USA) according to the manufacturer’s instructions. All antibody-binding assays were performed at 25°C.
Preparation of Biotinylated F1 Antigen
Purified F1V (BEI Resources, Manassas, VA) and negative-control antigen myoglobin (Sigma-Aldrich) were biotinylated using an NHS LC-LC biotinylation kit (Thermo Fisher Scientific, Waltham, MA, USA) as per the manufacturer’s instructions. Protein quality was assessed by gel electrophoresis and Coomassie staining. Biotinylation was assessed by Western blot analysis with streptavidin HRP (Thermo Fisher Scientific). Protein quantification was performed using absorbance at 280 nm.
Yeast Display–Based Screening of scFvs
Yeast-display construct preparation, yeast staining, and flow cytometry–based analysis were performed as previously described.54,55,60,61 Briefly, the αF1 scFvs-encoding genes were amplified from phage-display vector plasmids previously described58 using specific primers containing regions of DNA overlapping with the yeast-display vector pDNL6.55,61 The yeast vector was digested with restriction enzymes BssH II, Nhe I and Nco I (NEB) and purified using PCR purification columns (Qiagen, German Town, MD, USA). Vector and scFv fragments were cotransformed into yeast cells using a Yeast 1 kit (Sigma-Aldrich) to allow cloning by gap repair.60 Yeast cells were labeled with anti-SV5-PE to assess scFv-display levels. Streptavidin labeled with Alexa 633 (Thermo Fisher Scientific) was used to detect binding of biotinylated proteins. Recognition signal was assessed at 500 nM concentration of F1V or myoglobin (negative control antigen). The scFv Z359 (recognizes M2 protein of influenza A) was used as negative-control antibody.
ELISA-Based Characterization of Antibodies
General Protocol
Most ELISAs were based on a slight modification of a previously described protocol,58 and are briefly outlined herein. F1V dimer–enriched protein (BEI), fixed bacterial cells, or live bacterial cells were used as ELISA targets. Biotinylated F1V (1 mg) or 104 bacterial cells in 100 µL PBS per well were used. Target attachment to 96-well MaxiSorp ELISA plates (Thermo Fisher Scientific) was achieved with overnight incubation at 4°C followed by PBS washes. Plate blocking was achieved by adding 250 µL Wonder Block (WB; 0.3% BSA, 0.3% skimmed milk, and 0.3% fish gelatin in PBS) to each well and incubating for 1 hour. The primary antibody stock (LANL anti-F1 IgGs, commercial anti-F1 YPF19, or natural human) was serially diluted in 1:10 PBS-diluted WB (light WB [LWB]), and 100 µL dilution was added to each antigen-coated and blocked well. After 1 hour’s incubation, the antibody solution was removed and the plate washed three times with 250 µL/well cold PBST (PBS + 0.05% Tween 20) and three times with PBSLT (PBS + 0.005% Tween 20). To detect the amount of primary antibody bound to the immobilized target, HRP-conjugated anti-human antibody (Abcam) diluted 1:1,000 in LWB was added and the plate incubated at 25°C for 1 hour. After washing as described above, 100 µL/well TMB substrate (Sigma-Aldrich) was added to each well and the reaction stopped by adding 100 µL/well 0.18 M H2SO4. The absorbance at λ 450 nm of each well was measured with a plate reader (Infinite M200; Tecan, Männedorf, Switzerland). Experiments were performed in triplicate. Background absorbance (obtained for negative-control antibody) was subtracted from each data point, and the averages of the resulting numbers plus standard deviations were plotted against the corresponding primary-antibody concentration using Microsoft Excel (version 16.34) and/or KaleidaGraph (version 4.5).
Measurement of Affinity for Cell-Expressed F1
For this set of ELISAs, we used fixed cells and serially diluted primary antibodies (starting concentrations 17–180 nM). Data were plotted using KaleidaGraph and fitted to the Michaelis–Menten equation adapted for antibody binding: AB = ABmax× [A]/(KD+[A], where AB = antibody binding, ABmax = maximum antibody binding, [A] = initial antibody concentration, and KD = antibody-dissociation constant.
Epitope Binning
This ELISA protocol was similar to that just described, except that : 1) the MaxiSorp plate was coated with 50 µL/well 170 nM capturing antibody; 2) cells were added after the blocking step; 3) plate-attached cells were saturated with the capturing antibody at 60 nM; and 4) the solution containing excess antibody was removed and used to serially dilute the other member of the antibody pair labeled with HRP.
Limit of Cell Detection by Sandwich ELISA
For this ELISA application, the protocol was similar to the epitope binning, except that: 1) cells were serially diluted, starting at a density of 7×10⁶ cells in 100 µL in LWB (22 two-fold dilutions in total) before the capturing step, 2) cells were not saturated with the capturing antibody; and 3) captured cells were incubated with HRP-labeled αF1Ig 8 at a fixed concentration of 30 nM in LWB.
Determination of Antibody Stability
Antibodies were dissolved in PBS plus 1% BSA, 0.02% NaN3, and 10% glycerol at concentrations of 0.5 mg/mL (αF1Ig 2) and 2.7 mg/mL (αF1Ig 8), and aliquoted in various PCR tubes (20 µL/tube) equipped with tight-fitting flat caps (VWR, Radnor, PA, USA). Antibodies were incubated at 37°C in a PCR thermocycler (Applied Biosystems, Foster City, CA, USA). One tube/antibody was removed from the incubation and stored at −20°C at regular 1-week intervals for a total of 3 weeks. The binding curve of each antibody sample before storage at 37°C (week 0) was obtained by whole-cell ELISA. This initial test allowed determination of the antibody-concentration range corresponding to the linear increment portion of the binding curve. The samples subjected to the stability studies were diluted to this concentration range and analyzed in triplicate by whole-cell ELISA. All plots obtained were linear (lowest R2=0.95). The slopes of these lines were used as a measure of activity (the higher the slope, the higher the activity). They were averaged, plotted (with the corresponding standard deviations) against the storage times, and fitted to a basic sigmoidal Boltzmann function, using ProFit 7.0.15.
Flow Cytometry–Based Characterization of Antibodies
Fixed Y. pestis and labeled antibodies were prepared as already described: 1×10⁸ cells/mL in a 1.5 mL Eppendorf tube (for general assessment of F1 expression) or in a multi-well plate (Thermo Fisher Scientific, for assessment of multiple antibody binding) were used in these assays. The resulting cell suspension was incubated with the labelled antibody in LWB for 1 hour with shaking at 1,000 rpm. Cells were washed twice and analyzed with Accuri Plus6 flow cytometry (BD Biosciences). Unlabeled cells were used as controls to set the flow-cytometry parameters.
Epitope Binning
In all these experiments, we used fixed cells. In the first experiment, sample preparation was conducted as already described above, with the following modifications. APC-labeled αF1Ig 8 was used to stain cells at saturating concentration (150 nM, 1 hour’s incubation). Without washing, cells were subsequently incubated with PE-labeled αF1Ig 2 serially diluted from 6.9 nM. For a second set of experiments, a saturating concentration of unlabeled αF1Ig 8 (500 nM) was added to Y. pestis cells and incubated for 1 hour (some of the cells were not saturated with αF1Ig 8 and used as a control). Aliquots (100 µL) of the saturated cells were pipetted in a 96 conical well plate (Thermo Fisher Scientific) and harvested by centrifugation. Supernatants were used to serially dilute PE-labeled αF1Ig 2 in a separate plate, starting at a concentration of 250 nM. Dilutions were used to resuspend the washed pellets in the plate, followed by 1 hour’s incubation. Cells were washed twice and analyzed by flow cytometry.
Detection of F1V Antigen by Lateral Flow Assay (LFA)
Antibody–Colloidal Gold Conjugation
αF1Ig 2 (27.5 nM, from stock in 10 mM phosphate buffer pH 7.4) in 200 µL colloidal gold (DCN, Carlsbad, CA) brought to pH 8.5 with K2CO3 was incubated for 15 minutes at 37°C with agitation. The reaction was stopped by adding 20 µL 50 mM borate buffer pH 9 plus 10% BSA and incubating at 37°C for 30 minutes with agitation. The resulting suspension was centrifuged for 20 minutes (14,000 rcf), the supernatant removed, and the colloidal gold pellet resuspended in 15 µL 50 mM borate buffer pH 9 plus 1% BSA.
LFA-Strip Preparation
αF1Ig 8 (1 µL of a 1 mg/mL solution) in PBS plus 20% sucrose and 5% trehalose was deposited at the test region of a FF170HP nitrocellulose (NC)-membrane strip (2.5×0.5 cm, DCN). Mouse anti-human antibody (65 ng; Abcam) in the same buffer was deposited at the control region of the NC strip. The strip was dried at 50°C for 30 minutes, reinforced with an adhesive baking card, and equipped with a wicking pad at the top. Various amounts of F1V antigen (BEI, monomer-enriched, 5–10 ng) in 50 µL PBS plus 1% Tween, 1% BSA, and 4 µL colloidal gold–conjugated αF1Ig 2 were allowed to travel through the NC membrane.
Analysis of Mixed Bacterial Communities
Preparation of Stained Mixed Bacterial Communities
The bacterial species were grown and prepared as described before. Live bacterial cells were used in these assays. The 10% F1-positive Y. pestis A1122 suspension was prepared by overnight cultures being diluted to 0.2 OD600 in sterile TSB, 200 µL of each of the control bacterial species and 100 µL of F1 positive Y. pestis being pooled, and 100 µL of TSB making up the remaining 1 mL volume. The resulting cell suspension was centrifuged at 5,000 g for 10 minutes and, upon supernatant removal, the cell pellet was resuspended in 1 mL sterile LWB and stored on ice for subsequent immunostaining.
FACS Analysis and Sorting
Cells were stained by incubation with 150 nM PE-labeled αF1Ig 2 or 8 at 25°C for 1 hour. They were subsequently washed by three cycles of centrifugation, removal of the supernatant, and resuspension in PBS. Stained cells were resuspended in sterile PBS to a density of OD600 = 0.1 and transferred to a 5 mL culture tube for fluorescence-activated cell sorting (FACS) analysis. FACS was performed with a BD Influx flow cytometer/cell sorter (BD Biosciences). Cytometry setup, analysis, and sorting procedures were performed as previously described.62 Data analysis and cytograph generation were done with FlowJo version 10.0 (FlowJo, Ashland, OR, USA). Unstained mock community samples (ie, without antibody) were first analyzed to determine placement of bacterial cells under SSC (side scatter, y-axis) vs FSC (forward scatter, x-axis). The total unstained cell population was gated and secondarily analyzed under SSC (y-axis) vs 530/40 (x-axis) to verify the absence of any fluorescence signal. After establishing the voltages of these parameters, the antibody-stained mock community samples were analyzed under identical conditions, whereby the fluorescence-emitting population under 530/40 were considered to be the target F1-positive Y. pestis and the remaining nonfluorescent population the other bacterial constituents. Separate gates of these two populations were established and used for genome-based identification.
Molecular Assays: Whole-Genome Amplification and PCR
Fluorescent cells (suspected Y. pestis) and nonfluorescent cells (other bacterial species) were gated and sorted for subsequent whole-genome amplification and PCR assays, as previously described.62,63 Populations from each antibody-stained community were single-sorted into PCR-reaction tubes containing 2 µL high-alkaline lysis buffer with four replicates per population. Four such populations were collected for analysis: stained with αF1Ig 2, stained with αF1Ig 8, unstained population, and a population depicting the entire bacterial constituents. DNA templates were used to amplify various specific regions using two sets of primers targeting 1) the bacterial 16S rRNA gene, 8F (5′-AGAGTTTGATCCTGGCTCAG) and 1492R (5′-GGTTACCTTGTTACGACTT) or 2) a Y. pestis–specific genomic region, YpA forward (5ʹ-TTGAAACAGCCAACCGCC) and YpA reverse (5ʹ-GGAGAGGGGATGATGCAGG) to produce 1,500 bp amplicons and 200 bp amplicons, respectively. PCR controls included purified YpA (positive control) and Yps (negative control) genomes. PCR amplicons were assessed on 1% agarose gel.
Effect of αF1 IgGs on Human Epithelial Cells and Y. pestis
Upper respiratory human bronchial epithelial cells (HBTECs) and lower respiratory airway human small-airway epithelial cells (HSAECs) were purchased from LifeLine Cell Technology and cultured in BronchiaLife Media w/Lifefactor (Lifeline Cell Technology, Franklin, MD, USA). Cells were used at passage 1–2 in all experiments. Y. pestis or Y. pseudotuberculosis were grown as described previously.
Respiratory Cells Cultured with Antibodies and Y. pestis
For studies using respiratory cells, HBTECs or HSAECs were seeded into a 96-well CellBIND plate (Corning, NY, USA) at 121,000 cells/cm2 in BronchiaLife Media with Lifefactor with antibiotics, 48 hour prior to bacterial or antibody exposure to allow the cells to form a confluent monolayer overnight. Y. pestis was also grown 1 day prior to exposure from a glycerol stock overnight in 5 mL TSB. The day of exposure, respiratory cells were washed twice in PBS and put in BronchiaLife Media with Lifefactor containing no antibiotics. Bacteria were pelleted at 10,000 g for 10 minutes at 4°C and diluted in BronchiaLife Media with Lifefactor containing no antibiotics to 0.3 OD600. This bacterial suspension (2 µL) or IgGs (final concentration = 0.35 µM) were added to the cells(final volume = 220 µL). The plate was then incubated for 18 hours before imaging.
Respiratory Cell Tolerance to IgGs
HBTECs and HSAECs were seeded into a 96-well CellBind plate at 120,000 cells/cm2 in BronchiaLife media with LifeFactor and incubated overnight. IgGs were added to expose the cells to 0.35 µM final concentration of antibody. Cells were incubated with antibody overnight before cell metabolism/viability and damage were assessed using a WST1 Kit (Roche, Mannheim, Germany) and an LDH kit (ScienCell; Carlsbad, CA, USA) as per manufacturers’ instructions.
Effect of Radiolabeled Antibodies on Y. pestis
Conjugation of αF1Ig 2 and αF1Ig 8 with DTPA
Pellets were then resuspended in BronchiaLife media with Lifefactor without antibiotic and cell density measured. The suspension was then diluted so that 103 Y. pestis cells could be plated into a 96-well plate at a final volume of 200 µL. Antibodies αF1Ig 2, αF1Ig 8, and αM2IgG were then added to each well at concentrations of 0.35–0.09 µM. The plate was incubated at 37°C into a Biotek NTX Plate reader (capable of shaking) and cell-density readings (OD600) were taken overnight every 10 minutes after 1 minute’s shaking to track bacterial growth. αF1Igs were conjugated with p-SCN-Bn-CHX-A”-DTPA (Macrocyclics, Plano, TX, USA), through solvent-exposed lysines' condensation to thiourea. Briefly, a 10 mg/mL solution of p-SCN-Bn-CHX-A”-DTPA was prepared in DMSO. The antibodies were buffer-exchanged into NaHCO3 (0.1 M, pH 8.5) using a Zeba Spin desalting column (Thermo Fisher Scientific), and a molar ratio of 10:1 p-SCN-Bn-CHX-A”-DTPA in DMSO was added. The reaction was allowed to proceed for 1 hour at 37°C with vigorous shaking. Excess p-SCN-Bn-CHX-A”-DTPA and salts were removed by a second buffer exchange into NH4CH3COO (0.1 M, pH 5.5) with a second Zeba spin desalting column. The final concentration of antibody was determined with a Bradford assay.
MALDI Analysis of Unconjugated and DTPA-Conjugated IgGs
Matrix assisted laser desorption/ionization (MALDI) analysis of unconjugated and conjugated antibodies was performed using a previously described matrix combination.64 MALDI-MS analysis was performed in positive-ion mode with a 4800 MALDI–TOF/TOF system (Applied Biosystems, Framingham, MA, USA). Laser intensity was set to 3,000–5,000. Mass range was set to 20,000–200,000. As expected at this mass range, the peak widths were broad, and multiply-charged peaks were observed. We calculated an average mass based on clearly discernible multiply-charged peaks and used that information to determine the approximate conjugation efficiency.
213Bi-Generator Preparation
A 225Ac/213Bi generator was prepared by adapting a published procedure 65 (Supplementary Figure S10). Starting from pure 229Th (legacy material courtesy of the DOE isotope program), 225Ac/223Ra was separated by anion-exchange chromatography (AG 1×8 200–400 mesh, Cl– form), where in HNO3 (8 M) the 229Th anion is retained and the 225Ac/223Ra is eluted in subsequent wash fractions (adaptation of a published prodedure66). The 225Ac can then be obtained pure by separation on a DGA (N,N,N',N'-tetra-n-octyldiglycolamide, 100–200 mesh Eichrom) column, where the 225Ac is retained on the column in HNO3 (6 M) and the daughters are removed in subsequent washes. Pure 225Ac is obtained by elution in HCl (0.1 M), followed by the removal of organics by passing the solution through prefilter resin (100–200 mesh Eichrom).67 The resulting 225Ac generator is prepared by reducing the solution to soft dryness, resuspending in HCl (concentrated three times) then loading 40 µCi 225Ac onto the generator cation resin AG MP-500 (Bio-Rad, Hercules, CA, USA), with 60 mg of resin for the generator and a 30 mg catcher column. Separations were monitored by γ-spectroscopy using an EG&G Ortec model GMX-35200-S HPGe detector system in combination with a Canberra model 35 Plus multichannel analyzer and GammaVision software.
Radiolabeling of IgGs
213Bi was eluted as the BiI4– anion from the generator by flowing a solution of HCl/NaI (0.1 M) dropwise through the generator. The pH of the resulting solution was adjusted to 5.5 with NH4CH3COO. Conjugated antibodies αF1Ig 2–DTPA and αF1Ig 8–DTPA (3 µg) were then radiolabeled with the pH-adjusted 213Bi by incubation for ~30 minutes at 37°C. Excess 213Bi and salts were removed by the Zeba spin desalting column. Final 213Bi labeling was determined by γ-spectroscopy using a 2470 Wizard2 NI automatic γ-counter and protein concentration determined with NanoDrop 2000 microvolume UV-vis spectrophotometry (Thermo Fisher Scientific). Final radiolabeling efficiency was 80% or greater.
Binding of Radiolabeled IgGs to Y. pestis
Two, 10 mL cultures of Y. pestis A1122 were grown overnight in TSB, one at 37 ºC (F1 +) and the other at ambient temperature (F1 –). Two dilutions of each culture were prepared at 106 CFU/mL and blocked for 1 hour with 10% WB in TSB. Cells were pelleted by centrifugation at 10,000 x g and washed 3 times with PBS. Cells were resuspended in LWB and incubated with 1 µg of 213Bi labeled αF1Ig 8. One set of samples was incubated for 1.3 hours the other set was washed immediately (within 10 minutes) by centrifugation and gamma counted on a Wizard2 gamma spectrometer at the 411 keV gamma line recorded in counts per minute (cpm). This process was repeated for the sample incubated for 1.3 hours.
Effect of Radiolabeled IgGs on Y. pestiss
Efficacy of growth inhibition by αF1Ig 2–213Bi-DTPA and αF1Ig 8–213Bi-DTPA was evaluated in a 96-well plate. The Y. pestis cultured as described earlier and diluted to 106 organisms/well was determined by OD600 on a BioPhotometer Plus (Eppendorf, Hamburg, Germany). Cells were plated in a Corning 96-well plate and blocked with WB. Plated cells were treated with three serial dilutions of each radiolabeled antibody (1 µg, 0.1 µg, and 0.01 µg)-]. Negative controls included untreated cells and cells treated with unlabeled αF1Ig 2 and αF1Ig 8 (1 µg). Cells were incubated at 37°C with periodic orbital shaking overnight. Absorbance at 600 nm was measured overnight every 10 minutes (after 1 min shaking) on a Synergy HTX multimode microplate reader (BioTek Instruments, Winooski, VT, USA)
Sequence Comparison of αF1Ig 2 and αF1Ig 8 with Anti-F1 m252 Antibody
The variable regions of anti-F1 m252 sequence68 and either αF1Ig 2 or αF2Ig 8 were imported to the “Pairwise sequence alignment” tool available at https://www.ebi.ac.uk, which uses the program Emboss Needle to calculate percentage identity and homology. CRDs were identified based on the Kabat definition.69
Results
Screening of Antibody Set
A set of seven previously selected human anti-F1 scFvs58 were evaluated for their ability to recognize recombinant F1 antigen as yeast-displayed antibodies by flow cytometry (Supplementary Figure S1). Expression and activity as yeast-displayed proteins can be used as a proxy for proper folding.70 Six of the seven scFvs were well expressed and active, so they were converted to full-length IgG1s with ATUM (www.atum.bio) and called αF1Ig X (where X indicated the number of a specific clone). Production yield was above average (>0.1 mg/mL culture, Table 1), with αF1Ig 8 yield being particularly remarkable (0.6 mg/mL). All αF1Igs were subsequently tested for specificity of interaction with whole F1-positive biosafety level 2 (BSL2) Y. pestis A1122.71 Capsular antigen F1 was well expressed on Y. pestis surfaces during growth at 37°C; however, it was not expressed at detectable levels at 23°C. Therefore, in most experiments described herein, Y. pestis grown at 23°C and/or Y. pseudotuberculosis (a F1-negative mildly pathogenic Yersinia) were used as negative control bacteria. Based on ELISA using whole Y. pestis cells (whole-cell ELISA, Figure 1A) or recombinant F1V antigen (Supplementary Figure S2), five of six αF1Igs bound F1-positive Y. pestis (both live and fixed) and four of six αF1Igs bound F1V. The discrepancy between efficiency of antibody binding to cell-expressed F1 versus purified F1V antigen might be due to the higher stability of the former versus the latter. Taken together, the results of these assays suggest that αF1Ig 2, 3, 6, and 8 are the strongest antibodies. The whole-cell ELISA experiment (Figure 1A) revealed that immunoreactivity of our antibodies did not change significantly when using live versus fixed cells. These data gave us the option of performing experiments in BSL1 conditions. Antibody specificity for F1+ Y. pestis was further confirmed by flow-cytometry analyses of bacteria stained with PE-conjugated antibodies (Figure 1B). We were able to distinguish the F1+ from the F1– Y. pestis even by the naked eye, since only the F1+ cell pellet, obtained after antibody staining and centrifugation, appeared pink, whereas the F1– pellet was cream-colored (Figure 1B insets). We included anti-F1 mouse antibody YPF19, a popular commercial antiplague antibody,72 as a positive control, and a polyclonal mixture of human IgGs as negative control. F1+ Y. pestis treated with any of the LANL antibodies and the commercial positive control were significantly more fluorescent than the same cells treated with the negative-control antibody(Figure 1B, left side), and more fluorescent than F- Y. pestis treated in the same way (Figure 1B, right side). As expected, αF1Ig 4, which performed poorly in whole-cell ELISA, afforded the weakest fluorescence. All other LANL antibodies and YPF19 generated fluorescent staining up to three orders of magnitude higher than the negative-control antibody. This flow-cytometry experiment not only confirmed the whole-cell ELISA results (Figure 1A) but also revealed that amine-mediated conjugation with a large protein (PE MW = 250 kDA, average IgG:PE ratio of 1:1 indicated by the vendor of the labeling kit used) did not affect recognition of F1+ Y. pestis.
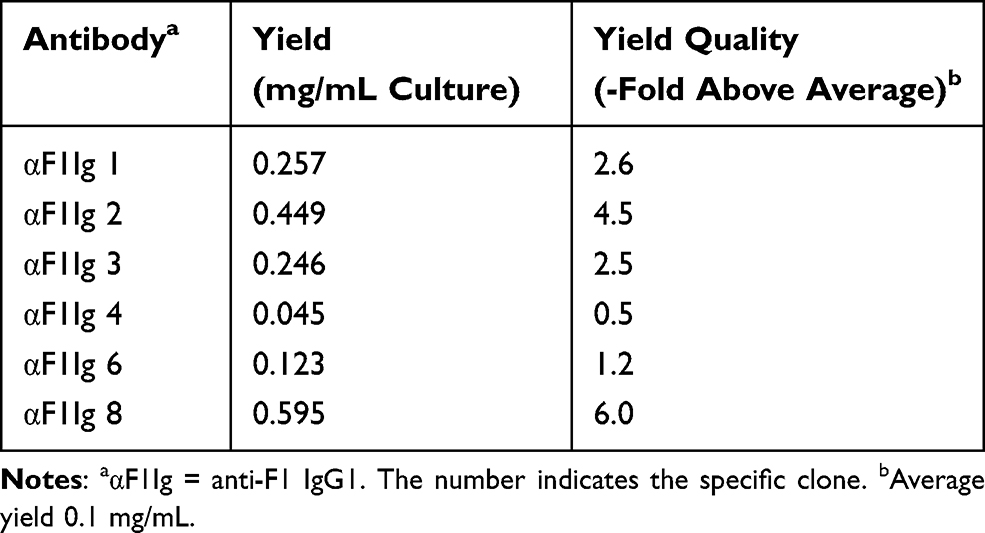 |
Table 1 Yields of Antibody Production |
 |
Figure 1 Antibody specificity of binding to F1–positive Yersinia pestis. (A) Whole-cell ELISA. Plastic-bound whole Y. pestis or Y. pseudotuberculosis were used as “antigens”. Cells are indicated as YP (Y. pestis) or YPS (Y. pseudotuberculosis) 37 or 23 (grown at 37°C or 23°C respectively), F1+ or F1–(F1 positive or negative respectively). The binding of primary antibodies (anti-F1 IgG isotype 1: αF1Ig 1 [gray], αF1Ig 2 [red], αF1Ig 3 [green], αF1Ig 4 [purple], αF1Ig 6 [yellow], αF1Ig 8 (blue), or negative-control natural human IgG1 [brown]) to cells was detected using a goat anti-human-horseradish peroxidase (HRP) conjugate and HRP substrate TMB (whose acidified product causes absorbance at 450 nM (Abs450). All αF1Ig types bound to F1+ Y. pestis, both live and fixed, but not to F1–Y. pestis grown at 23°C, live or fixed, or to F1– Y. pseudotuberculosis grown at 37°C, live or fixed. (B) Flow cytometry. Live Y. pestis grown at 37°C (left side) or at 23°C (right side) were incubated with phycoerythrin-conjugated antibodies (same color coding as for ELISA, αF1Ig 1 not included) and analyzed with flow cytometry. Commercial anti-F1 mouse antibody YPF19 (black) and natural human IgG1 (brown) were used as positive and negative controls, respectively. All αF1Ig clones bound to F1+ Y. pestis significantly more than the negative-control antibody (left), but did not bind to F1– Y. pestis (right). F1+ Y. pestis treated with PE-labeled αF1 antibodies could be distinguished from its F1- counterpart even by naked-eye observation of the cell pellets obtained after antibody treatment (insets, only αF1Ig 2–PE staining is shown, but other antibody conjugates behaved similarly). |
Antibody avidity (functional affinity) for cell-expressed F1 was measured by whole-cell ELISA using various concentrations of antibody (Supplementary Figure S3A). Functional KDs were determined as described previously,73 using the Michaelis–Menten equation adapted to antibody binding: KD = [A] × (ABmax – AB)/AB. The term [A] stands for antibody concentration during the experiment, ([A] initial – [A] bound), and can be approximated to the initial antibody concentration ([A] initial), based on the assumption that the concentration of bound antibody is much less then total antibody ([A] initial » [A] bound). At the lowest concentration of antibody used in this study (1.7 femtomoles/well), approximately 109 molecules of antibody were added to 104 of Y. pestis. Assuming that each Y. pestis cell bears as many as 104 F1 molecules (total 108 F1, an overestimate) and assuming that all of the antibody molecules are bound (also an overestimate), ([A] initial – [A] bound) would only be 10% lower than [A] initial, resulting in a 10% error in KD. Experiments were performed in triplicate, and average functional KD values with corresponding standard deviations are reported in Table 2. Results indicated that αF1Ig 2, 3, 8 were the antibodies with the highest avidity (lowest functional KD). Furthermore, the avidity of these antibodies seems to be between 17- and 48-fold higher than the commercial antibody YPF19.
 |
Table 2 Affinity of Anti-F1 IgGs for Cell-expressed F1 |
Epitope Targeting and Stability of Best Antibodies
The two antibodies with the highest affinity and production yield, αF1Ig 2 and αF1Ig 8, were tested in a set of competition experiments (Figure 2 and Supplementary Figure S4) to assess their performance as capturer/detector pair. Results suggest that the two antibodies do not compete in binding Y. pestis. The first competition experiment was a sandwich ELISA (Figure 2A). After cell capture and blocking with αF1Ig 8, αF1Ig 2-HRP conjugate bound Y. pestis with affinity similar to the unconjugated counterpart (KD ~0.5 nM for αF1Ig2–HRP vs KD 0.23 nM for αF1Ig 2). After cell capture and preblocking with αF1Ig 2, αF1Ig 8–HRP also bound cells with fairly high affinity (KD ~1 nM); however, the reduction of affinity with respect to the unconjugated counterpart binding to unblocked cells was more pronounced (KD ~1 nM for αF1Ig 8–HRP vs KD 0.08 nM for αF1Ig 8) than for αF1Ig2–HRP. Note that affinity reduction of labeled vs unlabeled antibodies, especially when the conjugated molecule is as large as HRP (MW 44 kDa), and when labeling can occur in various antibody regions containing solvent-exposed primary amines, is expected to influence antigen binding. In conclusion, our data suggest that αF1Ig 8 and αF1Ig 2 affected each other’s binding very minimally, and that αF1Ig 2 and αF1Ig 8 worked best as an affinity-reagent pair when αF1Ig 8 was used as the cell-capturing antibody and αF1Ig 2 as the cell-detecting antibody. To measure the detecting sensitivity of this configuration, we performed a noncompetitive sandwich ELISA (Figure 2B). We used αF1Ig 8 to capture a variable number of Y. pestiscells, and a saturating concentration of αF1Ig 2–HRP to detect the captured cells. The detection signal increased linearly with the number of cells in the thousand-cell range (Figure 2B inset). Fewer than 1,000 were detected.
 |
Figure 2 αF1Ig 2 and αF1Ig 8 did not compete in binding Y. pestis–expressed F1 antigen and worked well in sandwich ELISA. (A) αF1Ig 2–HRP (blue squares) and αF1Ig 8–HRP (red circles) bound to Y. pestis (captured with immobilized αF1Ig 8 and αF1Ig 2, respectively) with high affinity, despite Y. pestis presaturation with αF1Ig 8 and αF1Ig 2, respectively, and despite conjugation of the detecting antibodies with HRP (a 44 kDa protein). (B) Using αF1Ig 8 as capturing antibody and αF1Ig 2–HRP as detecting antibody in whole-cell sandwich ELISA, we tested various numbers of cells. The correlation between cell number and antibody binding was linear in the thousand-cell range (inset) showing that <1,000 Y. pestis cells can be detected. |
Confirmation that αF1Ig 8 and αF1Ig 2 influenced each other’s binding very minimally was obtained by flow cytometry (Supplementary Figure S4). In the first flow-cytometry experiment (Supplementary Figure S4A), Y. pestis cells were presaturated with αF1Ig 8–APC and subsequently incubated with αF1Ig 2–PE. APC labeling remained at saturation levels when cells were treated with various concentrations of αF1Ig 2–PE, even when saturation concentration of this antibody was used (highest red bar). In the second flow experiment (Supplementary Figure S4B), Y. pestis cells presaturated with unlabeled αF1Ig 8 or not were incubated with αF1Ig 2–PE. In both cases, αF1Ig 2–PE bound cells with the same affinity (same functional KD within error); however, the maximum amount of αF1Ig 2–PE binding was reduced when cells were presaturated with αF1Ig 8. This was probably due to the steric clash of the bulky PE with the F1-bound αF1Ig 8. PE labeling also seemed to negatively influence αF1Ig 2 affinity (KD ~18 nM for conjugate vs KD 0.23 nM for unconjugated αF1Ig 2). Notice that the reduction in affinity was much less pronounced for αF1Ig 2–HRP (Figure 2A) than for αF1Ig 2–PE (Supplementary Figure S4B), supporting our theory that conjugated molecules suffer from steric hindrance (HRP is around fivefold smaller than PE).
The experiments described so far suggest that αF1Ig 2 and 8 might recognize orthogonal regions of F1 antigen. This conclusion was supported by the ability to detect as little as 5 ng monomeric F1 in a lateral flow assay using αF1Ig 8 and αF1Ig 2–colloidal gold conjugate as the capturing and detecting antibody, respectively (Supplementary Figure S5). In order to predict their shelf life, αF1Ig 2 and αF1Ig 8 were dissolved in a preservative mixture of BSA, glycerol, and sodium azide, and were tested for retention of immunoreactivity at 37°C for 3 weeks. Based on the slope of the linear portion of the binding curve obtained by whole-cell ELISA (Supplementary Figure S6), we estimate that αF1Ig 2 and αF1Ig 8 were stable for about 12 days (Figure 3).
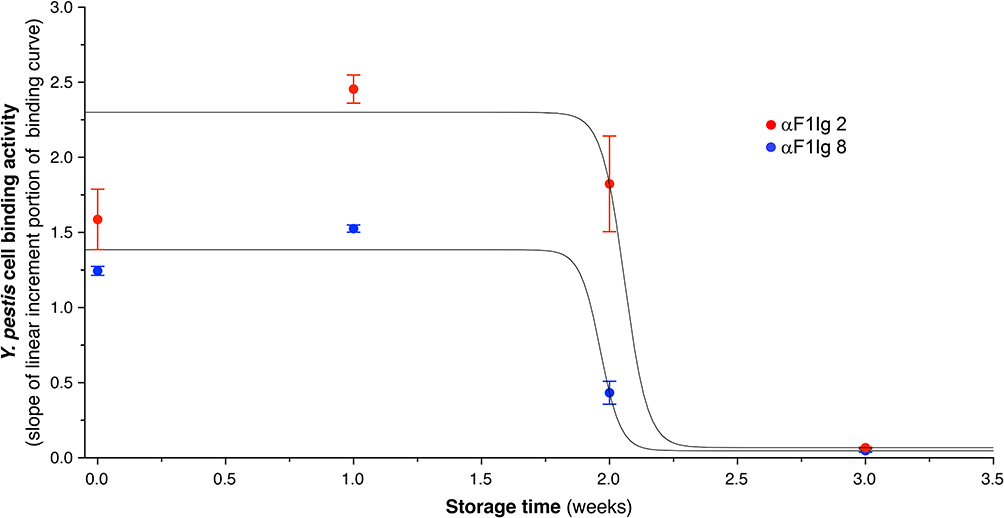 |
Figure 3 Assessment of antibody stability at 37°C. αF1Ig 2 (red circles) and αF1Ig 8 (blue circles) were evaluated for stability at 37°C for 3 weeks. We used the slope of the linear increment portion of the binding activity of these two antibodies (see Figure S5) as a proxy of stability. The data points are averages of two or more experiments with corresponding standard deviations. αF1Ig 2 and αF1Ig 8 seemed be as active at time 0 as after about 1.8 weeks. |
Antibody Ability to Recognize Y. pestis in a Mixed Bacterial Community
αF1Ig 2 and αF1Ig 8 were further tested for their ability to recognize Y. pestis (10% representation) within a mixed bacterial community of Y. pseudotuberculosis, B. anthracis Sterne, P. fluorescens, and E. coli (each equally represented at 22.5%, 90% of total cell population). Even in this set of experiments, we immediately visually distinguished the community containing F1+ Y. pestis from that containing F1– Y. pestis by the pink color imparted to the pellet of the former by αF1Ig2–PE (Figure 4A). The stained mixed communities were analyzed by flow cytometry (Figure 4B) and single events (dots in figure), stained (right side of the graphs) and unstained (left side of the graphs) were sorted and characterized by PCR (Figure 4C). A 16S rRNA-encoding region (16S RNA, present in any bacteria, 1,500 bp in length) or a fragment (~200 bp) unique to the genome of Y. pestis (putative “helix-turn-helix” [HTH] protein) were targeted for PCR amplification. While flow-sorted stained and unstained single events tested positive for the 16S rRNA (confirming that the sorted events were bacteria), only the stained bacteria tested positive for HTH and were thus identified as Y. pestis. The discrepancy between the intended Y. pestis representation (10%) and percentages of fluorescent cells (13.9% and 15.7% for αF1Ig 2–PE and αF1Ig 8–PE staining, respectively) was likely due to the inaccuracy of the relationship between OD600 (optical density based on Abs600, OD600) and cell numbers. Note that various bacterial suspensions used in this experiment were assumed to contain 108 cells/mL when OD600 was 0.2.
 |
Figure 4 αF1Ig 2 and αF1Ig 8 recognize Y. pestis (YP) in a mixed bacterial community. (A) A mixed bacterial community of Y. pseudotuberculosis, Pseudomonas fluorescens, Escherichia coli, and Bacillus anthracis Sterne (represented equally at 22.5% each) was spiked with YP (10% representation) grown either at 37°C (YP 37, F1+) or 23°C (YP 23, F1–). The resulting cell suspensions were stained with αF1Ig 2–phycoerythrin (PE). After one wash, the bacterial pellet containing YP 37 (F1+) appeared lightly pink, whereas the pellet containing YP 23 (F1–) appeared white. (B) The mixed community spiked with YP 37 (F1+), stained with either αF1Ig 2–PE or αF1Ig 8–PE was analyzed by flow cytometry. Proportionally, 13.9% (αF1Ig 2–PE staining) and 15.7% (αF1Ig 8–PE staining) of the total events were fluorescent (gated events detected by side scatter, SSC, and PE fluorescence). (C) Single cells sorted during the flow experiment depicted in B were lysed. The resulting DNA was used as template for PCR amplification of either the 16S rRNA–encoding region (16S RNA, present in any bacteria, 1,500 bp in length) or a fragment (~200 bp) unique to the genome of Y. pestis (putative “helix-turn-helix” protein [HTH]). While flow-sorted stained and unstained single events tested positive for the 16S rRNA (showing that the detected events were actually bacteria), only the fluorescently labeled bacteria tested positive for HTH and were thus confirmed to be Y. pestis. The discrepancy between the intended YP representation and the representation measured by flow was likely due to inaccuracy in the relationship between cell density (OD600) and cell number, which for the various bacteria used in this experiment was assumed to be OD600 = 0.2 → ×108 cells/mL. |
Antibody Effect on Y. pestis and Respiratory Epithelial Cells
Cell densitometry (Abs600 or OD600) analysis suggested that αF1Ig 8 and αF1Ig 2 had a negative influence on Y. pestis growth (Figure 5A), but not on Y. pseudotuberculosis growth (Figure 5B) at 340 nM and even 85 nM (αF1Ig 2, Supplementary Figure S7A). However, microscopy showed evidence of antibody-mediated cell agglutination (Supplementary Figure S7B), which could account for the lower cell density of the treated Y. pestis cultures. Under such conditions, bacteria may still be healthy and dividing. Agglutination could have favorable implications in the potential therapeutic (and diagnostic) application of our antibodies, since it is widely recognized that cell size and morphology can affect virulence among pathogenic microbes,74 and in particular that antibody-mediated agglutination promotes complement-dependent cell phagocytosis in S. pneumoniae and H. influenzae infections.75,76 Additional in vivo studies will of course be needed to investigate the potential protective effect of our antibodies in their unmodified form.
 |
Figure 5 Effect of antibodies on Yersinia pestis. F1–positive Yersinia pestis (A) and F1–negative Yersinia pseudotuberculosis (B) growth was monitored by densitometry (Abs600) for 20 hours in the absence (gray) or the presence of F1–specific αF1Ig 2 (red), αF1Ig 8 (blue), or negative-control antibody αM2Ig (black) at a final concentration of 340 nM. Each point represents the average of three measurements with corresponding standard deviation (error bar). |
Based on two assays (cell damage assessed by lactic acid dehydrogenase Supplementary Figure S8A, and cell viability assessed by metabolization of water-soluble tetrazolium Supplementary Figure S8B) lower respiratory airway epithelial cells were not affected by these antibodies. The fact that αF1Ig 2 and αF1Ig 8 are not toxic to the respiratory epithelia is critical for potential therapeutic application. Next, αF1Ig 2 and αF1Ig 8 were conjugated with metal chelator p-SCN-BN-CHX-A”-diethylenetriamine pentaacetic acid (DTPA-SCN) through solvent-exposed free amines. Based on MS analysis (MALDI-TOF, Supplementary Figure S9) of the conjugates, the chelator:antibody ratio was ~1:1 (αF1Ig 2–DTPA) and 2:1 (αF1Ig 8–DTPA) (Table 3). This level of conjugation did not affect antibody affinity, as confirmed by kinetic studies showing a minimal difference in functional KD between free and conjugated antibody (Table 3 and Supplementary Figure S3). DTPA-conjugated αF1Ig 8 was then labeled with radioactive bismuth (213Bi). The resulting complex was found capable of delivering radioactivity specifically to F1–positive Y. pestis (Figure 6A), as shown by the significantly higher detection of 213Bi on cells grown at 37°C vs 23°C. Further, both 213Bi-radiolabeled αF1Ig 2 and 8 stunted Y. pestis growth at antibody concentrations that do not affect cell growth in the absence of radiolabeling (34 nM). Y. pestis growth was significantly impacted at ~103 cpm, this can be approximated to single µCis activity, well within amounts amenable for therapeutic use in humans. In both the αF1Ig 2– and 8–DTPA–213Bi treatments in the 10 cpm range, there was a slight but noticeable increase in growth that can be attributed to accelerated proliferation from oxidative stress. Small amounts of radioactive materials create reactive oxygen species, which at sufficient concentrations can prove lethal to cells, but at lower doses can increase cell proliferation.77
 |
Table 3 Affinity of Chelator–Antibody Conjugates and Efficiency of Conjugation |
 |
Figure 6 Specificity of binding and effect on Y. pestis growth of radiolabeled IgGs. (A) αF1Ig 8 conjugated with p-SCN-BN-CHX-A-diethylenetriamine pentaacetic acid (DTPA) and labeled with 213Bi (αF1Ig 8–DTPA–213Bi) bound significantly more to F1+ Y. pestis (37°C, red bars) than to F1– Y. pestis (23°C, blue bars) immediately after washing (time 0) and 1.3 hours after washing (B) ~103 cpm αF1Ig 2–DTPA–213Bi (red circles in top graph) and αF1Ig 8–DTPA–213Bi (dark-blue circles in bottom graph) had a deleterious effect on Y. pestis growth at antibody concentration of 34 nM. Treatment with 102 cpm αF1Ig 2–DTPA–213Bi (orange circles in top graph) and αF1Ig 8–DTPA–213Bi (blue circles in bottom graph) showed little effect on cell growth compared to the control in the absence of antibody (black circles in both graphs). A small amount (~10 cpm) αF1Ig 2–DTPA–213Bi (yellow circles in top graph) and αF1Ig 8-DTPA–213Bi (light blue circles in bottom graph) appeared to favor Y. pestis growth. Each point represents the average of three measurements with corresponding standard deviation (error bar). |
Comparison with Human Anti-F1 m252 Antibody
Comparison of αF1Ig 2 and 8 to a previously described human anti-F1 antibody m25268 revealed that these antibodies have similar affinity for F1 (although different methods were used for their kinetic study) and high specificity for the target. We could not compare the production yield or stability, since these characteristics were not reported for m252. Sequence alignment revealed very low similarity (Supplementary Figure S11), supporting the uniqueness of our antibodies and our contribution of two novel human orthogonal F1–targeting IgGs to the pull of antibodies with potential for development of plague diagnostics and therapeutics.
Discussion
In a world plagued by emerging pathogenic threats, there remains a great need for targeting strategies that enable accurate and sensitive diagnostics and effective therapeutics. Human monoclonal antibodies, like the ones presented herein, offer the opportunity for accurate and sensitive immunodiagnostics and/or potent imnunoantibiotics. Ideally, these antibodies have no adverse effects on human microbiota/tissue while binding their pathogen-derived antigens with high specificity and high affinity. Immunoantibiotics might provide unique resilience to pathogen mutations, as they can be deployed as an oligoclonal mixture, ie, targeting different epitopes of the same antigen. Developing antibodies with these characteristics is possible using in vitro evolution of human-antibody libraries by various display technologies. This approach allows for the selection of pathogen-specific antibodies, especially when negative selection steps are included to deplete the library of antibodies interacting with human cells and/or other microorganisms. Furthermore, the use of complementary display platforms (eg, phage and yeast, as previously described54,61) allows selection of reagents that tend to be relatively well expressed in comparison to traditional selection methods. This results in high-specificity human antibodies that are more likely to retain immunoreactivity outside the display context and thus rapidly developable into commercial products. Affinity of these antibodies can eventually be increased by in vitro affinity maturation, should the need arise.
Here, we carefully characterized a set of previously reported antibodies obtained by in vitro selection of a phage-display library of single-chain human antibodies for binding to recombinant Y. pestis virulence factor F1.58 Among these antibodies, we downselected αF1Ig 2 and αF1Ig 8, based on features required for development of accurate, sensitive, and portable diagnostics, and targeted therapeutics. We further derivatized αF1Ig 2 and αF1Ig 8 to bind radiometals for alternative antibiotic applications. Their retention of immunoreactivity as phage-58 and yeast-displayed scFvs (Supplementary Figure S1), indicates that the functionality of αF1Ig 2 and αF1Ig 8 is unaffected by display context. Their above-average expression yield as IgG1s in mammalian cells (Table 1) and their affinity preservation after prolonged storage at 37°C (Figure 3) suggests that αF1Ig 2 and αF1Ig 8 could be developed into commercial products. These antibodies are particularly attractive in that they selectively bind F1-positive Y. pestis (Figure 1). We observed this specificity even in a mixed bacterial community of five organisms where Y. pestis was the sole immunostained organism (Figure 4). B. anthracis Sterne and Y. pseudotuberculosis were primarily selected for the mixed microbial community, owing to their relevance in the biodefense/potential human pathogen space, much like Y. pestis. Y. pseudotuberculosis was also selected to demonstrate no cross-reactivity with a member of the same Yersinia genus, but of a different species. P. fluorescens and E. coli were selected to demonstrate no cross-reactivity to other Gram-negative bacteria of different genera. The specificity of αF1Ig 2 and αF1Ig 8 for F1-positive Y. pestis (Figures 1 and 4), the minimal interference with each other’s binding (Figures 2, S4 and S5), their picomolar affinity for Y. pestis–expressed F1 antigen (Table 2 and Supplementary Figure S3), and retention of specificity upon conjugation with the large fluorophore PE and the enzyme HRP (Figures 1B, 2 and 4) indicates their potential to yield accurate and sensitive diagnostics.
High affinity and specificity for the antigen, and targeting of two F1 epitopes are also features supporting eventual therapeutic use of these antibodies. The specificity of these antibodies might even result in lack of cross-reactivity with other organisms in the human microbiome, since the mixed microbial community used for cross-reactivity studies represent the Firmicutes and Gammaproteobacteria taxonomic groups normally found in the human gut and skin microbiomes in large abundance. Of course, additional studies using a mixed community that better represent the human microbiome are needed to support this claim. Ideally, a continuation of this work would also include identification of the epitopes targeted by αF1Ig 2 and 8, which might provide hints on potential for protective effects, based on previously studied protective antibodies.68 An additional promising feature supporting the safety of our antibodies (and potential therapeutic application) is their lack of effect on respiratory epithelial cell metabolism and viability (Supplementary Figure S8). Furthermore, our antibodies promote Y. pestis agglutination (Figure 5 and Supplementary Figure S7), which might favor bacterial clearance by the immune system during infection.74–76 Notably, we also demonstrate that radiolabeled αF1Ig 2–DTPA–213Bi antibodies retained specificity of interaction with F1-positive Y. pestis (Figure 6A) and that both αF1Ig 2–DTPA–213Bi and αF1Ig 8–DTPA–213Bi adversely affected growth of Y. pestis at concentrations that do not affect cell density in the absence of radioactive labeling (Figure 6B). In sum, these data suggest that αF1Ig 2 and αF1Ig 8, if not protective as unmodified proteins, could be used to selectively deliver small lethal doses of radionuclides (and possibly antibiotics78). In either case, further in vitro and/or in vivo experiments are needed to support protection against plague. We are aware of only one human anti-F1 antibody described in the literature.68 We are pleased to contribute two high-yield/stability/affinity/specificity orthogonal anti-F1 human antibodies to further the pool of potential diagnostics/therapeutics against plague.
Conclusion
We have developed a set of two human IgG1s, αF1Ig 2 and 8, specifically binding Y. pestis–expressed F1 antigen noncompetitively, with picomolar affinity. These antibodies show promising commercial developability (high expression yield and stability) and might be safe for use in humans (high specificity for the target bacterium and no effect on human epithelial cells). Although we have shown that these antibodies cause agglutination of Y. pestis, which could play a role in infection clearance, additional in vitro/in vivo experiments will be needed to demonstrate eventual protective effect of these antibodies as unmodified proteins. Importantly, however, these antibodies retain high specificity and affinity upon chemical conjugation to metal chelators, and have adverse effects on Y. pestis growth when radiolabeled. This result highlights that our antibodies could be excellent agents for selective delivery of cytotoxic compounds. We conclude that αF1Ig 2 and 8 have many of the features desirable for developing accurate/sensitive diagnostic reagents and therapeutics alternative to traditional antibiotics.
Abbreviations
213Bi, bismuth isotope 213; APC, allopycocyanine; BHI, brain–heart infusion; CaCl2, calcium chloride; BSL, biosafety level; Caf1, capsular antigen F1; DGA, N,N,N',N'-tetra-n-octyldiglycolamide; DTPA, diethylenetriamine pentaacetic acid; F1, fraction 1; FACS, fluorescence-activated cell sorting; HBTECs, human bronchial epithelial cells; FFS, forward scatter; HRP, horseradish peroxidase; HSAECs, human small-airway epithelial cells; KD, dissociation constant; LDH, lactic acid dehydrogenase; LWB, light wonder block; MALDI, matrix-assisted laser-desorption ionization; NHS, N-hydroxysuccinimide; PBSLT, PBS light tween; PBST, PBS tween; PE, phycoerythrin; scFv, single chain–fragment variable; SSC, side scatter; TMB, tetramethylbenzidine; TOF, time of flight; TSB, tryptic soy broth; VH, variable heavy; VL, variable light; WST, water-soluble tetrazolium.
Ethical Approval and Informed Consent
The HEK293 cells used for this work were purchased commercially by MIGS, then transferred to ATUM (then DNA2.0) when ATUM purchased MIGS’s assets. Please see ATUM press release: https://www.atum.bio/resources/company/press-releases.
Acknowledgments
We thank: 1) the Los Alamos National Laboratory Directed Research and Development (LANL LDRD 20180005DR) and the US Department of Energy Isotope Program, managed by the Office of Science for Nuclear Physics, for funding and supporting this research; 2) Claire Sanders and Kay Carr for assistance with the flow-cytometry analyses; 3) Andrew Lakes for critical reading of the manuscript; 4) Andrew Beveridge for plotting the antibody-stability data; and 5) BEI Resources, NIAID, NIH, for supplying the various forms of Yersinia pestis F1–V fusion protein (NR-2561 and NR-2563) used for this work.
Disclosure
The authors report no conflicts of interest in this work.
References
1. Riedel S. Biological warfare and bioterrorism: a historical review.
2. Bertherat E, Thullier P, Shako JC, et al. Lessons learned about pneumonic plague diagnosis from 2 outbreaks, Democratic Republic of the Congo. Emerg Infect Dis. 2011;17(5):778. doi:10.3201/eid1705.100029
3. Sebbane F, Jarrett C, Gardner D, Long D, Hinnebusch BJ. The Yersinia pestis caf1M1A1 fimbrial capsule operon promotes transmission by flea bite in a mouse model of bubonic plague. Infect Immun. 2009;77(3):1222–1229. doi:10.1128/IAI.00950-08
4. Quenee LE, Cornelius CA, Ciletti NA, Elli D, Schneewind O. Yersinia pestis caf1 variants and the limits of plague vaccine protection. Infect Immun. 2008;76(5):2025–2036. doi:10.1128/IAI.00105-08
5. Du Y, Rosqvist R, Forsberg Å. Role of fraction 1 antigen of Yersinia pestis in inhibition of phagocytosis. Infect Immun. 2002;70(3):1453–1460. doi:10.1128/IAI.70.3.1453-1460.2002
6. Chanteau S, Rahalison L, Ratsitorahina M, et al. Early diagnosis of bubonic plague using F1 antigen capture ELISA assay and rapid immunogold dipstick. Int J Med Microbiol. 2000;290(3):279–283. doi:10.1016/S1438-4221(00)80126-5
7. Splettstoesser WD, Rahalison L, Grunow R, Neubauer H, Chanteau S. Evaluation of a standardized F1 capsular antigen capture ELISA test kit for the rapid diagnosis of plague. FEMS Immunol Med Mic. 2004;41(2):149–155. doi:10.1016/j.femsim.2004.02.005
8. Bhunia AK. Yersinia enterocolitica and Yersinia pestis. In: Foodborne Microbial Pathogens. Springer; 2018:301–313.
9. Ke Y, Chen Z, Yang R. Yersinia pestis: mechanisms of entry into and resistance to the host cell. Front Cell Infect Microbiol. 2013;3:106. doi:10.3389/fcimb.2013.00106
10. Weening EH, Cathelyn JS, Kaufman G, et al. The dependence of the Yersinia pestis capsule on pathogenesis is influenced by the mouse background. Infect Immun. 2011;79(2):644–652.
11. Sha J, Endsley JJ, Kirtley ML, et al. Characterization of an F1 deletion mutant of Yersinia pestis CO92, pathogenic role of F1 antigen in bubonic and pneumonic plague, and evaluation of sensitivity and specificity of F1 antigen capture-based dipsticks. J Clin Microbiol. 2011;49(5):1708–1715. doi:10.1128/JCM.00064-11
12. Davis KJ, Fritz DL, Pitt ML, Welkos SL, Worsham PL, Friedlander AM. Pathology of experimental pneumonic plague produced by fraction 1-positive and fraction 1-negative Yersinia pestis in African green monkeys (cercopithecus aethiops). Arch Pathol Lab Med. 1996;120(2):156–163.
13. Winter CC, Cherry WB, Moody MD. An unusual strain of Pasteurella pestis isolated from a fatal human case of plague. Bull World Health Organ. 1960;23(2–3):408.
14. Anisimov AP, Lindler LE, Pier GB. Intraspecific diversity of Yersinia pestis. Clin Microbiol Rev. 2004;17(2):434–464. doi:10.1128/CMR.17.2.434-464.2004
15. Hill J, Copse C, Leary S, Stagg AJ, Williamson ED, Titball RW. Synergistic protection of mice against plague with monoclonal antibodies specific for the F1 and V antigens of Yersinia pestis. Infect Immun. 2003;71(4):2234–2238. doi:10.1128/IAI.71.4.2234-2238.2003
16. Hill J, Eyles JE, Elvin SJ, Healey GD, Lukaszewski RA, Titball RW. Administration of antibody to the lung protects mice against pneumonic plague. Infect Immun. 2006;74(5):3068–3070. doi:10.1128/IAI.74.5.3068-3070.2006
17. Anderson GW
18. Liu W, Ren J, Zhang J, et al. Identification and characterization of a neutralizing monoclonal antibody that provides complete protection against Yersinia pestis. PLoS One. 2017;12(5):e0177012. doi:10.1371/journal.pone.0177012
19. Hill J, Leary S, Griffin KF, Williamson ED, Titball RW. Regions of Yersinia pestis V antigen that contribute to protection against plague identified by passive and active immunization. Infect Immun. 1997;65(11):4476–4482. doi:10.1128/IAI.65.11.4476-4482.1997
20. Chanteau S, Rahalison L, Ralafiarisoa L, et al. Development and testing of a rapid diagnostic test for bubonic and pneumonic plague. Lancet. 2003;361(9353):211–216. doi:10.1016/S0140-6736(03)12270-2
21. Tomaso H, Thullier P, Seibold E, et al. Comparison of hand-held test kits, immunofluorescence microscopy, enzyme-linked immunosorbent assay, and flow cytometric analysis for rapid presumptive identification of Yersinia pestis. J Clin Microbiol. 2007;45(10):3404–3407. doi:10.1128/JCM.00458-07
22. Welch TJ, Fricke WF, McDermott PF, et al. Multiple antimicrobial resistance in plague: an emerging public health risk. PLoS One. 2007;2(3):e309. doi:10.1371/journal.pone.0000309
23. Gubala V, Klein R, Templeton DM, Schwenk M. Immunodiagnostics and immunosensor design (IUPAC technical report). Pure Appl Chem. 2014;86(10):1539–1571. doi:10.1515/pac-2013-1027
24. Weichselbaum RR, Liang H, Deng L, Fu Y-X. Radiotherapy and immunotherapy: a beneficial liaison? Nat Rev Clin Oncol. 2017;14(6):365. doi:10.1038/nrclinonc.2016.211
25. Scott AM, Wolchok JD, Old LJ. Antibody therapy of cancer. Nat Rev Cancer. 2012;12(4):278. doi:10.1038/nrc3236
26. Schrama D, Reisfeld RA, Becker JC. Antibody targeted drugs as cancer therapeutics. Nat Rev Drug Discov. 2006;5(2):147. doi:10.1038/nrd1957
27. Grilo AL, Mantalaris A. The increasingly human and profitable monoclonal antibody market. Trends Biotechnol. 2019;37(1):9–16. doi:10.1016/j.tibtech.2018.05.014
28. Spellberg B, Guidos R, Gilbert D, et al. The epidemic of antibiotic-resistant infections: a call to action for the medical community from the infectious diseases society of America. Clin Infect Dis. 2008;46(2):155–164. doi:10.1086/524891
29. Masihi KN. Immunomodulators in infectious diseases: panoply of possibilites. Int J Immunopharmacol. 2000;22(12):1083–1091. doi:10.1016/S0192-0561(00)00074-6
30. McConnell MJ. Where are we with monoclonal antibodies for multidrug-resistant infections? Drug Discov Today. 2019;24(5):1132–1138. doi:10.1016/j.drudis.2019.03.002
31. Wang-Lin S, Balthasar J. Pharmacokinetic and pharmacodynamic considerations for the use of monoclonal antibodies in the treatment of bacterial infections. Antibodies. 2018;7(1):5. doi:10.3390/antib7010005
32. Inc. HGS. A study to evaluate the safety and tolerability of raxibacumab in healthy subjects. NLM; 2018. Available from: https://clinicaltrials.gov/ct2/show/NCT00639678.
33. Therapeutics E. An open label field study of anthim (obiltoxaximab) in subjects exposed to B. anthracis. NLM; 2020. Available from: https://clinicaltrials.gov/ct2/show/NCT03088111.
34. Corp MSD. Bezlotoxumab (MK-6072) versus placebo in children with clostridium difficile infection (CDI) (MK-6072-001) (MODIFY III); 2020. Available from: https://clinicaltrials.gov/ct2/show/NCT03182907.
35. Bebbington C, Yarranton G. Antibodies for the treatment of bacterial infections: current experience and future prospects. Curr Opin Biotechnol. 2008;19(6):613–619. doi:10.1016/j.copbio.2008.10.002
36. Junutula JR, Raab H, Clark S, et al. Site-specific conjugation of a cytotoxic drug to an antibody improves the therapeutic index. Nat Biotechnol. 2008;26(8):925. doi:10.1038/nbt.1480
37. Panowski S, Bhakta S, Raab H, Polakis P, Junutula JR. Site-specific antibody drug conjugates for cancer therapy.
38. Axup JY, Bajjuri KM, Ritland M, et al. Synthesis of site-specific antibody-drug conjugates using unnatural amino acids. PNAS. 2012;109(40):16101–16106. doi:10.1073/pnas.1211023109
39. Posnett DN, McGrath H, Tam JP. A novel method for producing anti-peptide antibodies. Production of site-specific antibodies to the T cell antigen receptor beta-chain. J Biol Chem. 1988;263(4):1719–1725.
40. Yao H, Jiang F, Lu A, Zhang G. Methods to design and synthesize antibody-drug conjugates (ADCs). Int J Mol Sci. 2016;17(2):194. doi:10.3390/ijms17020194
41. Dennler P, Fischer E, Schibli R. Antibody conjugates: from heterogeneous populations to defined reagents. Antibodies. 2015;4(3):197–224. doi:10.3390/antib4030197
42. Di Marzo Veronese F, Reitz M, Gupta G, et al. Loss of a neutralizing epitope by a spontaneous point mutation in the V3 loop of HIV-1 isolated from an infected laboratory worker. J Biol Chem. 1993;268(34):25894–25901.
43. Ivanenkov VV, Crawford PA, Toyama A, Sévigny J, Kirley TL. Epitope mapping in cell surface proteins by site-directed masking: defining the structural elements of NTPDase3 inhibition by a monoclonal antibody. Protein Eng Des Sel. 2010;23(7):579–588. doi:10.1093/protein/gzq027
44. Zhang S, Vogt MR, Oliphant T, et al. Development of resistance to passive therapy with a potently neutralizing humanized monoclonal antibody against West Nile virus. J Infect Dis. 2009;200(2):202–205. doi:10.1086/599794
45. Reslan L, Dalle S, Dumontet C. Understanding and circumventing resistance to anticancer monoclonal antibodies.
46. Worthington RJ, Melander C. Combination approaches to combat multidrug-resistant bacteria. Trends Biotechnol. 2013;31(3):177–184. doi:10.1016/j.tibtech.2012.12.006
47. Worthington RJ, Blackledge MS, Melander C. Small-molecule inhibition of bacterial two-component systems to combat antibiotic resistance and virulence. Future Med Chem. 2013;5(11):1265–1284. doi:10.4155/fmc.13.58
48. Bradbury AR, Sidhu S, Dübel S, McCafferty J. Beyond natural antibodies: the power of in vitro display technologies. Nat Biotechnol. 2011;29(3):245. doi:10.1038/nbt.1791
49. Smith GP, Petrenko VA. Phage display. Chem Rev. 1997;97(2):391–410. doi:10.1021/cr960065d
50. Lillo AM, McKenzie KM, Janda KD. Phage-displayed antibody libraries. In: Cell Biology. Elsevier; 2006:491–496.
51. Boder ET, Wittrup KD. Yeast surface display for directed evolution of protein expression, affinity, and stability. In: Methods in Enzymology. Vol. 328. Elsevier; 2000:430–444.
52. Kim Y, Lillo AM, Steiniger SC, et al. Targeting heat shock proteins on cancer cells: selection, characterization, and cell-penetrating properties of a peptidic GRP78 ligand. Biochemistry. 2006;45(31):9434–9444. doi:10.1021/bi060264j
53. Martinez JS, Close DW, Lillo AM, et al. Genetically engineered polymer libraries and methods of using them. United States patent US20170029812A1. In: Google Patents. 2017.
54. Phipps ML, Lillo AM, Shou Y, et al. Beyond helper phage: using” helper cells” to select peptide affinity ligands. PLoS One. 2016;11(9). doi:10.1371/journal.pone.0160940.
55. Velappan N, Mahajan A, Naranjo L, et al. Selection and characterization of FcεRI phospho-ITAM specific antibodies.
56. Li B, Fouts AE, Stengel K, et al. In vitro affinity maturation of a natural human antibody overcomes a barrier to in vivo affinity maturation.
57. Sblattero D, Bradbury A. Exploiting recombination in single bacteria to make large phage antibody libraries. Nat Biotechnol. 2000;18(1):75–80. doi:10.1038/71958
58. Lillo AM, Ayriss JE, Shou Y, Graves SW, Bradbury AR. Development of phage-based single chain Fv antibody reagents for detection of Yersinia pestis. PLoS One. 2011;6(12):e27756. doi:10.1371/journal.pone.0027756
59. Wang R, Song A, Levin J, et al. Therapeutic potential of a fully human monoclonal antibody against influenza A virus M2 protein. Antiviral Res. 2008;80(2):168–177. doi:10.1016/j.antiviral.2008.06.002
60. Boder ET, Wittrup KD. Optimal screening of surface‐displayed polypeptide libraries. Biotechnol Prog. 1998;14(1):55–62. doi:10.1021/bp970144q
61. Ferrara F, Naranjo LA, Kumar S, et al. Using phage and yeast display to select hundreds of monoclonal antibodies: application to antigen 85, a tuberculosis biomarker. PLoS One. 2012;7(11):e49535. doi:10.1371/journal.pone.0049535
62. Close DW, Ferrara F, Dichosa AE, et al. Using phage display selected antibodies to dissect microbiomes for complete de novo genome sequencing of low abundance microbes. BMC Microbiol. 2013;13(1):270. doi:10.1186/1471-2180-13-270
63. Dichosa AE, Daughton AR, Reitenga KG, Fitzsimons MS, Han CS. Capturing and cultivating single bacterial cells in gel microdroplets to obtain near-complete genomes. Nat Protoc. 2014;9(3):608. doi:10.1038/nprot.2014.034
64. Signor L, Erba EB. Matrix-assisted laser desorption/ionization time of flight (MALDI-TOF) mass spectrometric analysis of intact proteins larger than 100 kDa. J Vis Exp. 2013;(79):e50635.
65. McDevitt MR, Finn RD, Sgouros G, Ma D, Scheinberg DA. An 225Ac/213Bi generator system for therapeutic clinical applications: construction and operation. Appl Radiat Isot. 1999;50(5):895–904. doi:10.1016/S0969-8043(98)00151-1
66. Apostolidis C, Molinet R, Rasmussen G, Morgenstern A. Production of Ac-225 from Th-229 for targeted α therapy. Anal Chem. 2005;77(19):6288–6291. doi:10.1021/ac0580114
67. Ferrier MG, Batista ER, Berg JM, et al. Spectroscopic and computational investigation of actinium coordination chemistry. Nat Commun. 2016;7(1):1–8. doi:10.1038/ncomms12312
68. Xiao X, Zhu Z, Dankmeyer JL, et al. Human anti-plague monoclonal antibodies protect mice from Yersinia pestis in a bubonic plague model. PLoS One. 2010;5(10):e13047. doi:10.1371/journal.pone.0013047
69. Abhinandan K, Martin AC. Analysis and improvements to Kabat and structurally correct numbering of antibody variable domains. Mol Immunol. 2008;45(14):3832–3839. doi:10.1016/j.molimm.2008.05.022
70. Cherf GM, Cochran JR. Applications of yeast surface display for protein engineering. In: Yeast Surface Display. Springer; 2015:155–175.
71. Jawetz E, Meyer K. Avirulent strains of pasteurella pestis. J Infect Dis. 1943;73(2):124–143. doi:10.1093/infdis/73.2.124
72. Available from: https://www.biocompare.com/pfu/110447/soids/598/Antibodies/Yersinia_pestis.
73. Benedict CA, MacKrell AJ, Anderson WF. Determination of the binding affinity of an anti-CD34 single-chain antibody using a novel, flow cytometry based assay. J Immunol Methods. 1997;201(2):223–231. doi:10.1016/S0022-1759(96)00227-X
74. Yang DC, Blair KM, Salama NR. Staying in shape: the impact of cell shape on bacterial survival in diverse environments. Microbiol Mol Biol Rev. 2016;80(1):187–203.
75. Roche A, Richard A, Rahkola J, Janoff E, Weiser J. Antibody blocks acquisition of bacterial colonization through agglutination. Mucosal Immunol. 2015;8(1):176–185. doi:10.1038/mi.2014.55
76. Dalia AB, Weiser JN. Minimization of bacterial size allows for complement evasion and is overcome by the agglutinating effect of antibody. Cell Host Microbe. 2011;10(5):486–496. doi:10.1016/j.chom.2011.09.009
77. Spooner R, Yilmaz Ö. The role of reactive-oxygen-species in microbial persistence and inflammation. Int J Mol Sci. 2011;12(1):334–352. doi:10.3390/ijms12010334
78. Mariathasan S, Tan M-W. Antibody–antibiotic conjugates: a novel therapeutic platform against bacterial infections. Trends Mol Med. 2017;23(2):135–149. doi:10.1016/j.molmed.2016.12.008
 © 2020 The Author(s). This work is published and licensed by Dove Medical Press Limited. The
full terms of this license are available at https://www.dovepress.com/terms
and incorporate the Creative Commons Attribution
- Non Commercial (unported, 3.0) License.
By accessing the work you hereby accept the Terms. Non-commercial uses of the work are permitted
without any further permission from Dove Medical Press Limited, provided the work is properly
attributed. For permission for commercial use of this work, please see paragraphs 4.2 and 5 of our Terms.
© 2020 The Author(s). This work is published and licensed by Dove Medical Press Limited. The
full terms of this license are available at https://www.dovepress.com/terms
and incorporate the Creative Commons Attribution
- Non Commercial (unported, 3.0) License.
By accessing the work you hereby accept the Terms. Non-commercial uses of the work are permitted
without any further permission from Dove Medical Press Limited, provided the work is properly
attributed. For permission for commercial use of this work, please see paragraphs 4.2 and 5 of our Terms.