Back to Journals » International Journal of Chronic Obstructive Pulmonary Disease » Volume 21
Development of a Clinical Nomogram for Predicting Densitometric Osteoporosis in Patients with Chronic Obstructive Pulmonary Disease Based on NHANES Data
Received 29 September 2025
Accepted for publication 1 March 2026
Published 25 March 2026 Volume 2026:21 571149
DOI https://doi.org/10.2147/COPD.S571149
Checked for plagiarism Yes
Review by Single anonymous peer review
Peer reviewer comments 2
Editor who approved publication: Prof. Dr. Richard Russell
Peng Jiang,1 Tingting Chen2
1Orthopaedic Surgery, Changxing County People’s Hospital, Huzhou, Zhejiang, People’s Republic of China; 2Respiratory and Critical Care Medicine, Changxing County People’s Hospital, Huzhou, Zhejiang, People’s Republic of China
Correspondence: Tingting Chen, Respiratory and Critical Care Medicine, Changxing County People’s Hospital, Huzhou, Zhejiang, People’s Republic of China, Email [email protected]
Objective: This study aimed to identify factors associated with densitometric osteoporosis (OP) in patients with Chronic Obstructive Pulmonary Disease (COPD) and develop a predictive model for OP.
Methods: Retrospective analysis was conducted using data from COPD patients in the National Health and Nutrition Examination Survey database. OP was defined with a T-score of ≤ − 2.5 at the lumbar spine or femoral neck. Variables with more than 25% missing values were excluded, while others were imputed. Collinearity analysis was performed, and data were randomly divided into a 7:3 train-test set ratio. The Least Absolute Shrinkage and Selection Operator and Boruta algorithms were used for feature selection. The selected variables were evaluated with Receiver Operating Characteristic (ROC) analysis to identify the optimal predictive model, which was then used to construct a nomogram. The nomogram’s efficacy and stability were validated in the test set.
Results: Data from 1351 COPD patients were included. Age, weight, height, OP history of self-report, hemoglobin, and high-density lipoprotein cholesterol were identified as significant factors for OP. Those variables were combined into 7 different models. The ROC analysis results revealed that among the seven models, the model containing four variables was the optimal model. The nomogram, based on four variables (age, weight, height, and OP history of self-report), demonstrated good calibration and predictive performance (areas under curve: 0.841 in the train set, 0.833 in the test set). The nomogram showed high clinical net benefit and stability in subgroup analysis.
Conclusion: Age, weight, height, and OP history of self-report are significantly associated with densitometric OP in COPD patients. The constructed nomogram, based on these factors, provides an effective and stable tool for early identification of high-risk OP patients in clinical practice.
Keywords: chronic obstructive pulmonary disease, osteoporosis, nomogram, Boruta, comorbidity
Introduction
Chronic obstructive pulmonary disease (COPD) progressively impairs lung function, compromising oxygen uptake and carbon dioxide elimination.1 Its primary symptoms encompass persistent cough, sputum production, shortness of breath, and labored breathing.2 Both the incidence and healthcare burden of COPD have risen steadily in recent years. According to the World Health Organization (WHO) report, there were an estimated 213.39 million cases of COPD, with an age-standardized prevalence of 2,512.86 cases per 100,000 population.3,4 Importantly, COPD is a systemic disease with numerous significant extrapulmonary manifestations such as osteoporosis (OP),5 decreased muscle,6 and brain.7,8
Among extrapulmonary manifestations, OP has drawn considerable attention due to its high prevalence.9,10 OP, diagnostically defined by a bone mineral density (BMD) T-score of ≤ −2.5, as measured by dual-energy X-ray absorptiometry (DXA) or a sustained low-trauma fracture,11 is a systemic skeletal disorder characterized by an increased risk of fractures.
The high prevalence of OP in patients with COPD is attributed to two main factors. First, they share common risk factors, such as smoking,12 advanced age,13 and disease-specific mechanisms including glucocorticoid-induced pathophysiological changes.14 Additionally, the heterogeneous underlying mechanisms of both conditions. For example, the chronic low-grade inflammation in COPD patients leads to elevated levels of cytokines such as TNF-α, IL-1β, and IL-6. These factors activate osteoclasts (such as the RANKL/RANK pathway) and inhibit osteoblast activity, leading to increased bone resorption.15 Glucocorticosteroid, used to treat COPD, inhibit osteoblast proliferation, promote apoptosis, and prolong osteoclast lifespan, leading to decreased bone mass.16 Furthermore, COPD patients experience reduced sunlight exposure due to restricted activity, which reduces vitamin D levels and calcium absorption.17
The development of OP in COPD patients significantly elevates the risk of fractures and disability, thereby increasing the healthcare burden. Consequently, the early identification of OP susceptibility and timely intervention in this population are critically important. Despite the clear correlation and importance of intervention, early identification remains difficult in routine clinical settings. This is mainly because: (1) OP lacks specific symptoms in the early phase and is easily overlooked;18 (2) although DXA is the gold standard for diagnosis, its application is limited by accessibility, cost, and patient compliance, resulting in a generally low OP screening rate among COPD patients.19,20 Recent research has begun to explore predictive models based on CT radiomics,21 providing new insights for the identification of high-risk patients. However, such models rely on specific imaging examinations that are not available to all patients, and their accessibility and cost-effectiveness limit their potential for early screening in a broad population. Therefore, clinical practice still urgently needs a tool that can perform simple and rapid risk assessment using only routinely available outpatient data. To bridge this translational gap that is closer to routine clinical practice, developing a multivariate logistic regression-based predictive model is crucial. The value of this model lies in its ability to achieve non-invasive, low-cost risk stratification during patients’ daily visits, without relying on additional specialized examinations. This enables targeted and preventative management strategies and optimizes the allocation of medical resources. In light of these issues, this study aims to construct an OP risk prediction model for COPD patients based on routine clinical indicators.
Methods
Study Population
The study population was from the National Health and Nutrition Examination Survey (NHANES) database. It is a national health and nutrition survey project in the United States that aims to monitor health trends and lifestyle changes among Americans through comprehensive health and nutrition assessments. It covers areas such as demographic information, nutritional intake, laboratory testing, physical examination, and lifestyle and socio-economic surveys. In this study, we selected year cycles that provide bone mineral density data, including 2005–2010, 2013–1014, and 2017–2020.
We obtained 1964 patients diagnosed with COPD from participants in the above year cycles (n = 56,769), and then excluded those who lacked BMD (n = 589), and those younger than 20 years old (n = 24). Finally, 1351 patients with COPD were included in the study.
The Diagnosis of COPD and OP
For participants from 2005–2006, 2013–2014, and 2017–2020 year cycles, COPD was diagnosed using “MCQ160o: Ever told you had COPD?”. The positive response to this question was diagnosed as COPD. For participants from the 2007–2010 year cycle, COPD was diagnosed based on the Forced Expiratory Volume in the 1st second (FEV1)/Forced Vital Capacity (FVC) < 0.7.
BMD was estimated using a DXA scan. According to the WHO, OP was diagnosed based on a BMD T-score ≤ −2.5 at the femoral neck or lumbar spine.22
Variable
In this study, the variable contained (1) demographic characteristics: age (years), gender (male, female), race (Mexican American, Other Hispanic, Non-Hispanic White, Non-Hispanic Black, Other Races), education level (under or equal high school, above high school), marital status (married, other), poverty income ratio (PIR); weight (kg), height (cm), body mass index (BMI, kg/m2), waist circumference (WC, cm); (2) laboratory indicators: albumin (ALB, g/dL), alkaline phosphatase (ALP, U/L), white blood cell (WBC, 1000 cells/μL), blood urea nitrogen (BUN, mg/dL), calcium (mg/dL), total cholesterol (TC, mg/dL), creatinine (CR, mg/dL), gamma glutamyl transferase (GGT, U/L), fasting plasma glucose (FPG, g/dL), phosphorus (mmol/L), total bilirubin (TB, mg/dL), triglyceride (TG, mg/dL), uric acid (UA, mg/dL), sodium (mmol/L), potassium (mmol/L), chloride (mmol/L), lymphocyte count (LC, 1000 cells/μL), monocyte count (MC, 1000 cells/μL), neutrophils count (NC, 1000 cells/μL), red blood cell count, (RBC, million cells/μL), hemoglobin (HGB, g/dL), red cell distribution width (RDW, %), platelet count (PLT, 1000 cells/μL), high-density lipoprotein cholesterol (HDL-C, mmol/L), cadmium (nmol/L), lead (nmol/L), mercury (nmol/L); (3) lifestyle: drinking (yes, no), smoking (yes, no), physical activity (PA, MET-min/week), sleep duration (h); (4) diet indicators: milk (never/rarely, sometimes, often), health diet index (HEI-2015), Vitamin D (VD, nmol/L), (5) comorbidity: arthritis (yes, no), diabetes (yes, no), hypertension (yes, no), cancer (yes, no); (6) hormone use and medical history: glucocorticosteroid (yes, no), OP of parents (yes, no), fracture history (yes, no), OP history of self-report (yes, no).
Demographic data were obtained from the “Sample Person Demographics” file and the “Body Measures” file in NHANES. Person Demographics data was collected via interview. The body measures data were collected, in the Mobile Examination Center (MEC), by trained health technicians. It is worth stating that height and weight exert distinct influences on bone health. Height reflects the skeletal basic reserve and growth history, whereas weight represents the mechanical load imposed on the skeleton. In contrast, BMI primarily serves as a proxy for metabolic and endocrine activity. Consequently, we incorporated all three indicators into our analysis. The detection methods for each laboratory indicator are presented in Supplementary file 1.
Smoking status was classified as yes/no based on the question, “Have you smoked at least 100 cigarettes in your lifetime?”. Alcohol consumption status was classified as yes/no based on the question “How often drink alcohol over past 12 months” (Yes: answer a value ≥3 for males (or ≥3 for females)). Milk, VD, and the diet-related data required for HEI-2015 calculation came from 24-hour dietary questionnaire data. HEI-2015 is a comprehensive diet quality scoring tool that contains 13 components, which are divided into sufficient components (such as fruits, vegetables, whole grains, protein foods, etc.) and regulatory components (such as refined grains, sodium, added sugars, saturated fats, etc). The total score ranges from 0 to 100. The higher the score, the higher the diet quality, and the better the consistency with the US Dietary Guidelines.23,24 The diagnosis of diabetes was confirmed based on three criteria: (1) self-reported physician-diagnosed diabetes in response to the question “Has a doctor ever told you that you have diabetes”; (2) current use of antidiabetic medications or insulin; or (3) biochemical evidence defined as either a 2-hour oral glucose tolerance test (OGTT) value ≥11.1 mmol/L or fasting plasma glucose ≥7.0 mmol/L.25 Hypertension diagnosis was established through any of the following criteria: (1) self-reported physician diagnosis in response to the structured question “Has a doctor ever told you that you have hypertension”; (2) current use of prescribed antihypertensive medication; or (3) objective measurement of blood pressure ≥140/90 mmHg on clinical assessment. Hormone use and medical history data were collected from prescription medications and self-reported personal interview data of medical conditions, respectively.
Statistical Analysis
Data were analyzed using R software (version 4.3.0). Variables with >20% missing values were excluded, and multiple imputation was used to fill in missing values for variables with ≤ 20% missing data. We performed collinearity analysis and removed variables with a variance inflation factor (VIF) greater than 5. The COPD patients were randomly allocated to train and test sets at a 7:3 ratio. The model was developed using the train set, and its performance was subsequently evaluated in the test set. Continuous variables were compared using the Kruskal–Wallis test and are reported as medians with interquartile ranges, whereas categorical variables were compared using the chi-square test and expressed as frequencies and percentages.
Feature selection was conducted using the least absolute shrinkage and selection operator (Lasso) regression and the Boruta algorithm. The two methods are used to prevent bias that may arise from relying on only one algorithm. Lasso regression utilizes the L1 regularization term (ie, the penalty function) to progressively shrink the coefficients, thereby simplifying the model to avoid multicollinearity and overfitting. When the coefficients approach zero, variable selection is achieved, effectively eliminating irrelevant predictors. The Boruta algorithm is a feature selection method based on random forests, designed to identify all features significantly associated with the dependent variable, rather than solely optimizing the loss function of a specific model. Its core principle involves comparing the importance of original features with that of randomly generated “shadow features,” using statistical tests and an iterative strategy to ensure the stability and comprehensiveness of the selection process. The intersection of the feature sets selected by the two methods is identified via Venn diagrams and forms the candidate features for building the model. Receiver-operating characteristic (ROC) curves were used to further verify the rationality of the screening indicators by evaluating the effectiveness of models (different combinations of indicators) to predict OP. Differences between models were assessed using the integrated discrimination improvement index (IDI) analysis and DeLong tests. The IDI quantifies the improvement of a new model over a baseline model. By comparing the predicted probabilities from both models, it evaluates the degree to which the new model enhances discriminative performance. The optimal model is selected according to the IDI and the Delong test results, and the variables contained in the optimal model are regarded as the final selected indicators. Logistic regression was used to analyze relationships and the independence of the relationships between the selected variables and OP to test the rationality of the final selected indicators. In addition, the robustness of the optimal model was evaluated in different subgroups. Furthermore, to confirm whether medication affects the efficiency of the model, we excluded 41 participants receiving anti-OP medication (including alendronate, risedronate, ibandronate, zoledronic, raloxifene, teriparatide, calcitonin, denosumab, prolia, fosamax, actonel, boniva, evista, and forteo) and then performed a sensitivity analysis. A nomogram was developed to predict OP based on the final selected indicators. The predictive performance and clinical net benefit of the model were evaluated using ROC and decision curve analysis (DCA), respectively. Calibration curves and the Hosmer–Lemeshow test were used to evaluate the nomogram’s accuracy and consistency.
Results
Basic Characteristics of the Study Population
In our dataset, VD was excluded directly as its missingness ratio surpassed 20% (38.19%; Supplementary Table 1). The remaining variables—education level, marital status, smoking, drinking, HEI-2015, PA, sleep duration, ALB, PIR, BMI, weight, height, WC, diabetes, BP, cancer, glucocorticosteroid, milk, OP history of self-report, OP of parents, fracture history, ALB, ALP, BUN, cadmium, TC, CR, GGT, FPG, phosphorus, TB, TG, UA, sodium, potassium, chloride, WBC, LC, MC, NC, and RBC—which had missingness ratios below 20%, were imputed. To identify collinear variables, we conducted a collinearity analysis on all remaining variables. This analysis revealed collinearity in BMI (VIF = 10.111) and WBC (VIF = 16.002) (Supplementary Table 2). After removing these two variables, we repeated the collinearity analysis on the remaining set. No further collinearity was detected, as all VIFs were below 5 (Supplementary Table 3). Consequently, the final variables included in the analysis were age, PIR, weight, height, WC, ALB, ALP, BUN, cadmium, TC, CR, GGT, FPG, phosphorus, TB, TG, UA, sodium, potassium, chloride, LC, MC, NC, RBC, HGB, RDW, PLT, HDL-C, cadmium, lead, mercury, race, milk, education level, marital status, drinking, HEI-2015, PA, sleep duration, arthritis, gender, diabetes, hypertension, cancer, glucocorticosteroid, OP history of self-report, OP of parents, fracture history, and smoking. We then randomly divided the patients into a train set and a test set with a ratio of 7:3. The variables of the two datasets were compared. The results indicated that only sodium, RDW, and cadmium exhibited significant differences between the train set and the test set (P < 0.05), whereas all other variables did not exhibit significant differences (P > 0.05, Table 1).
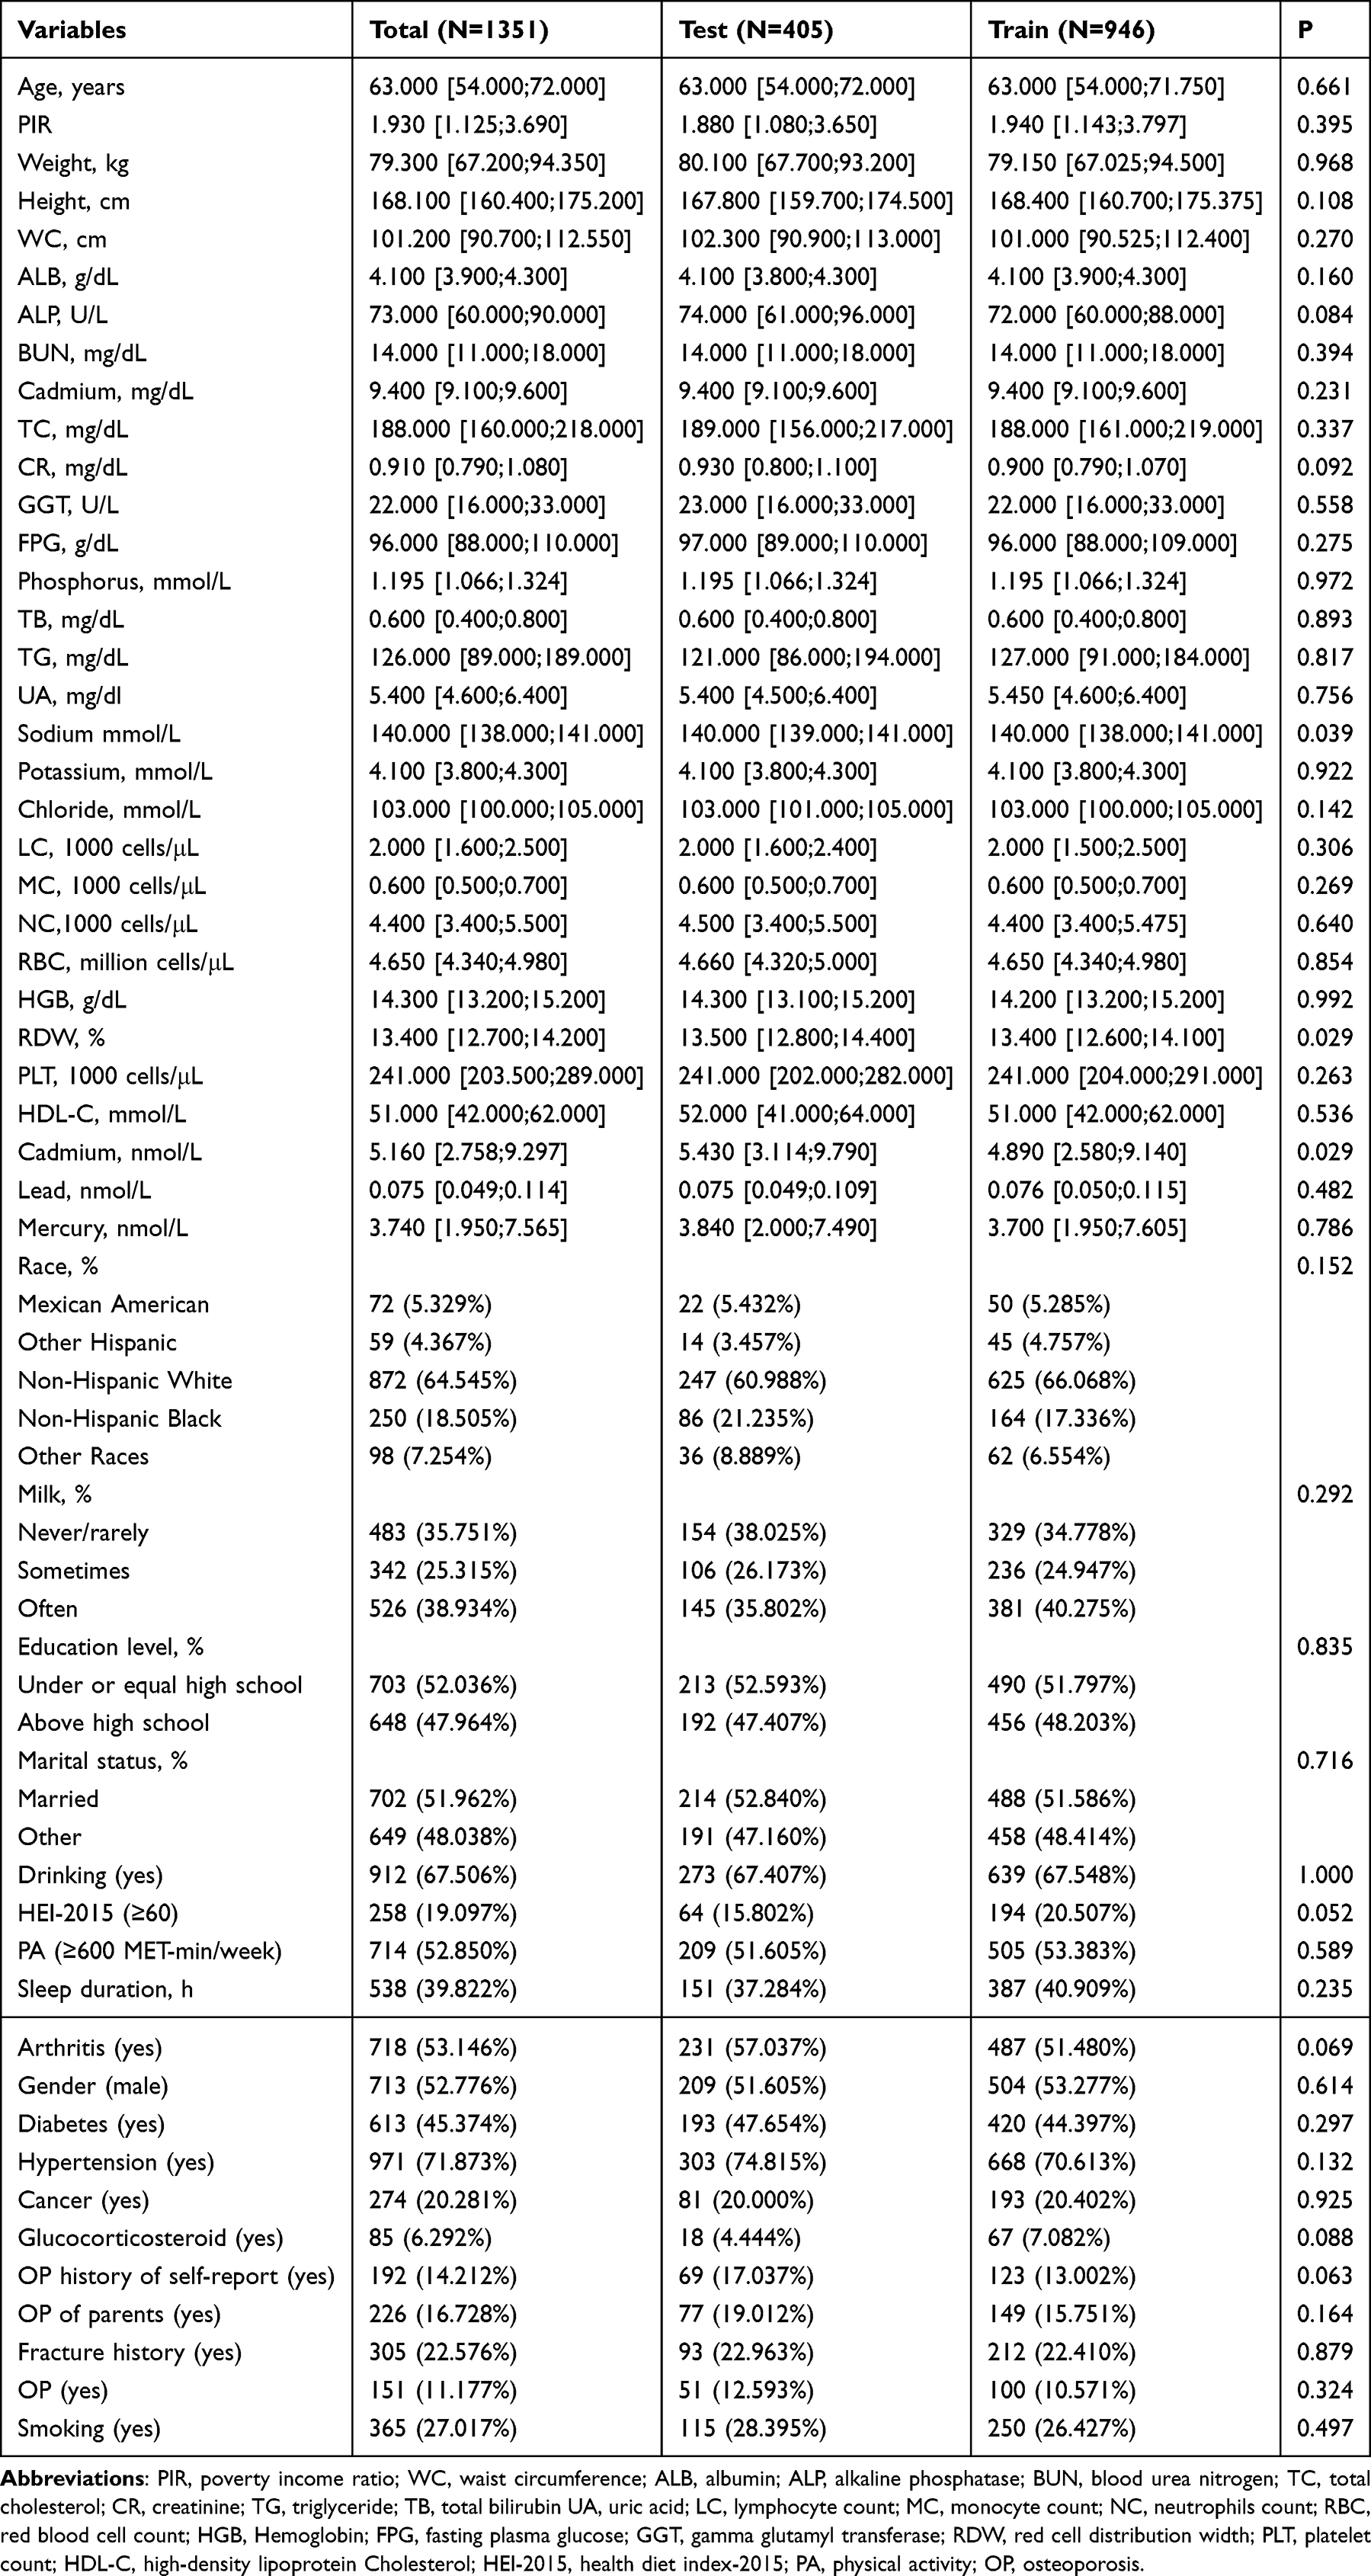 |
Table 1 Characteristics Comparison Between the Test Set and the Train Set |
We also stratified all COPD patients into OP and non-OP groups and compared clinical variables between OP and non-OP groups in the train set. The OP group exhibited significantly higher values for age, ALP, TC, phosphorus, HGB, RDW, HDL-C, cadmium than the non-OP group. In contrast, weight, height, WC, CR, TB, TG, UA, chloride, LC, and RBC were significantly lower in the OP group. The OP group contained significantly lower proportions of males, cancer patients, individuals reporting OP, those with parental OP, subjects with a fracture history, and Non-Hispanic White participants compared to the non-OP group (all P < 0.05, Table 2).
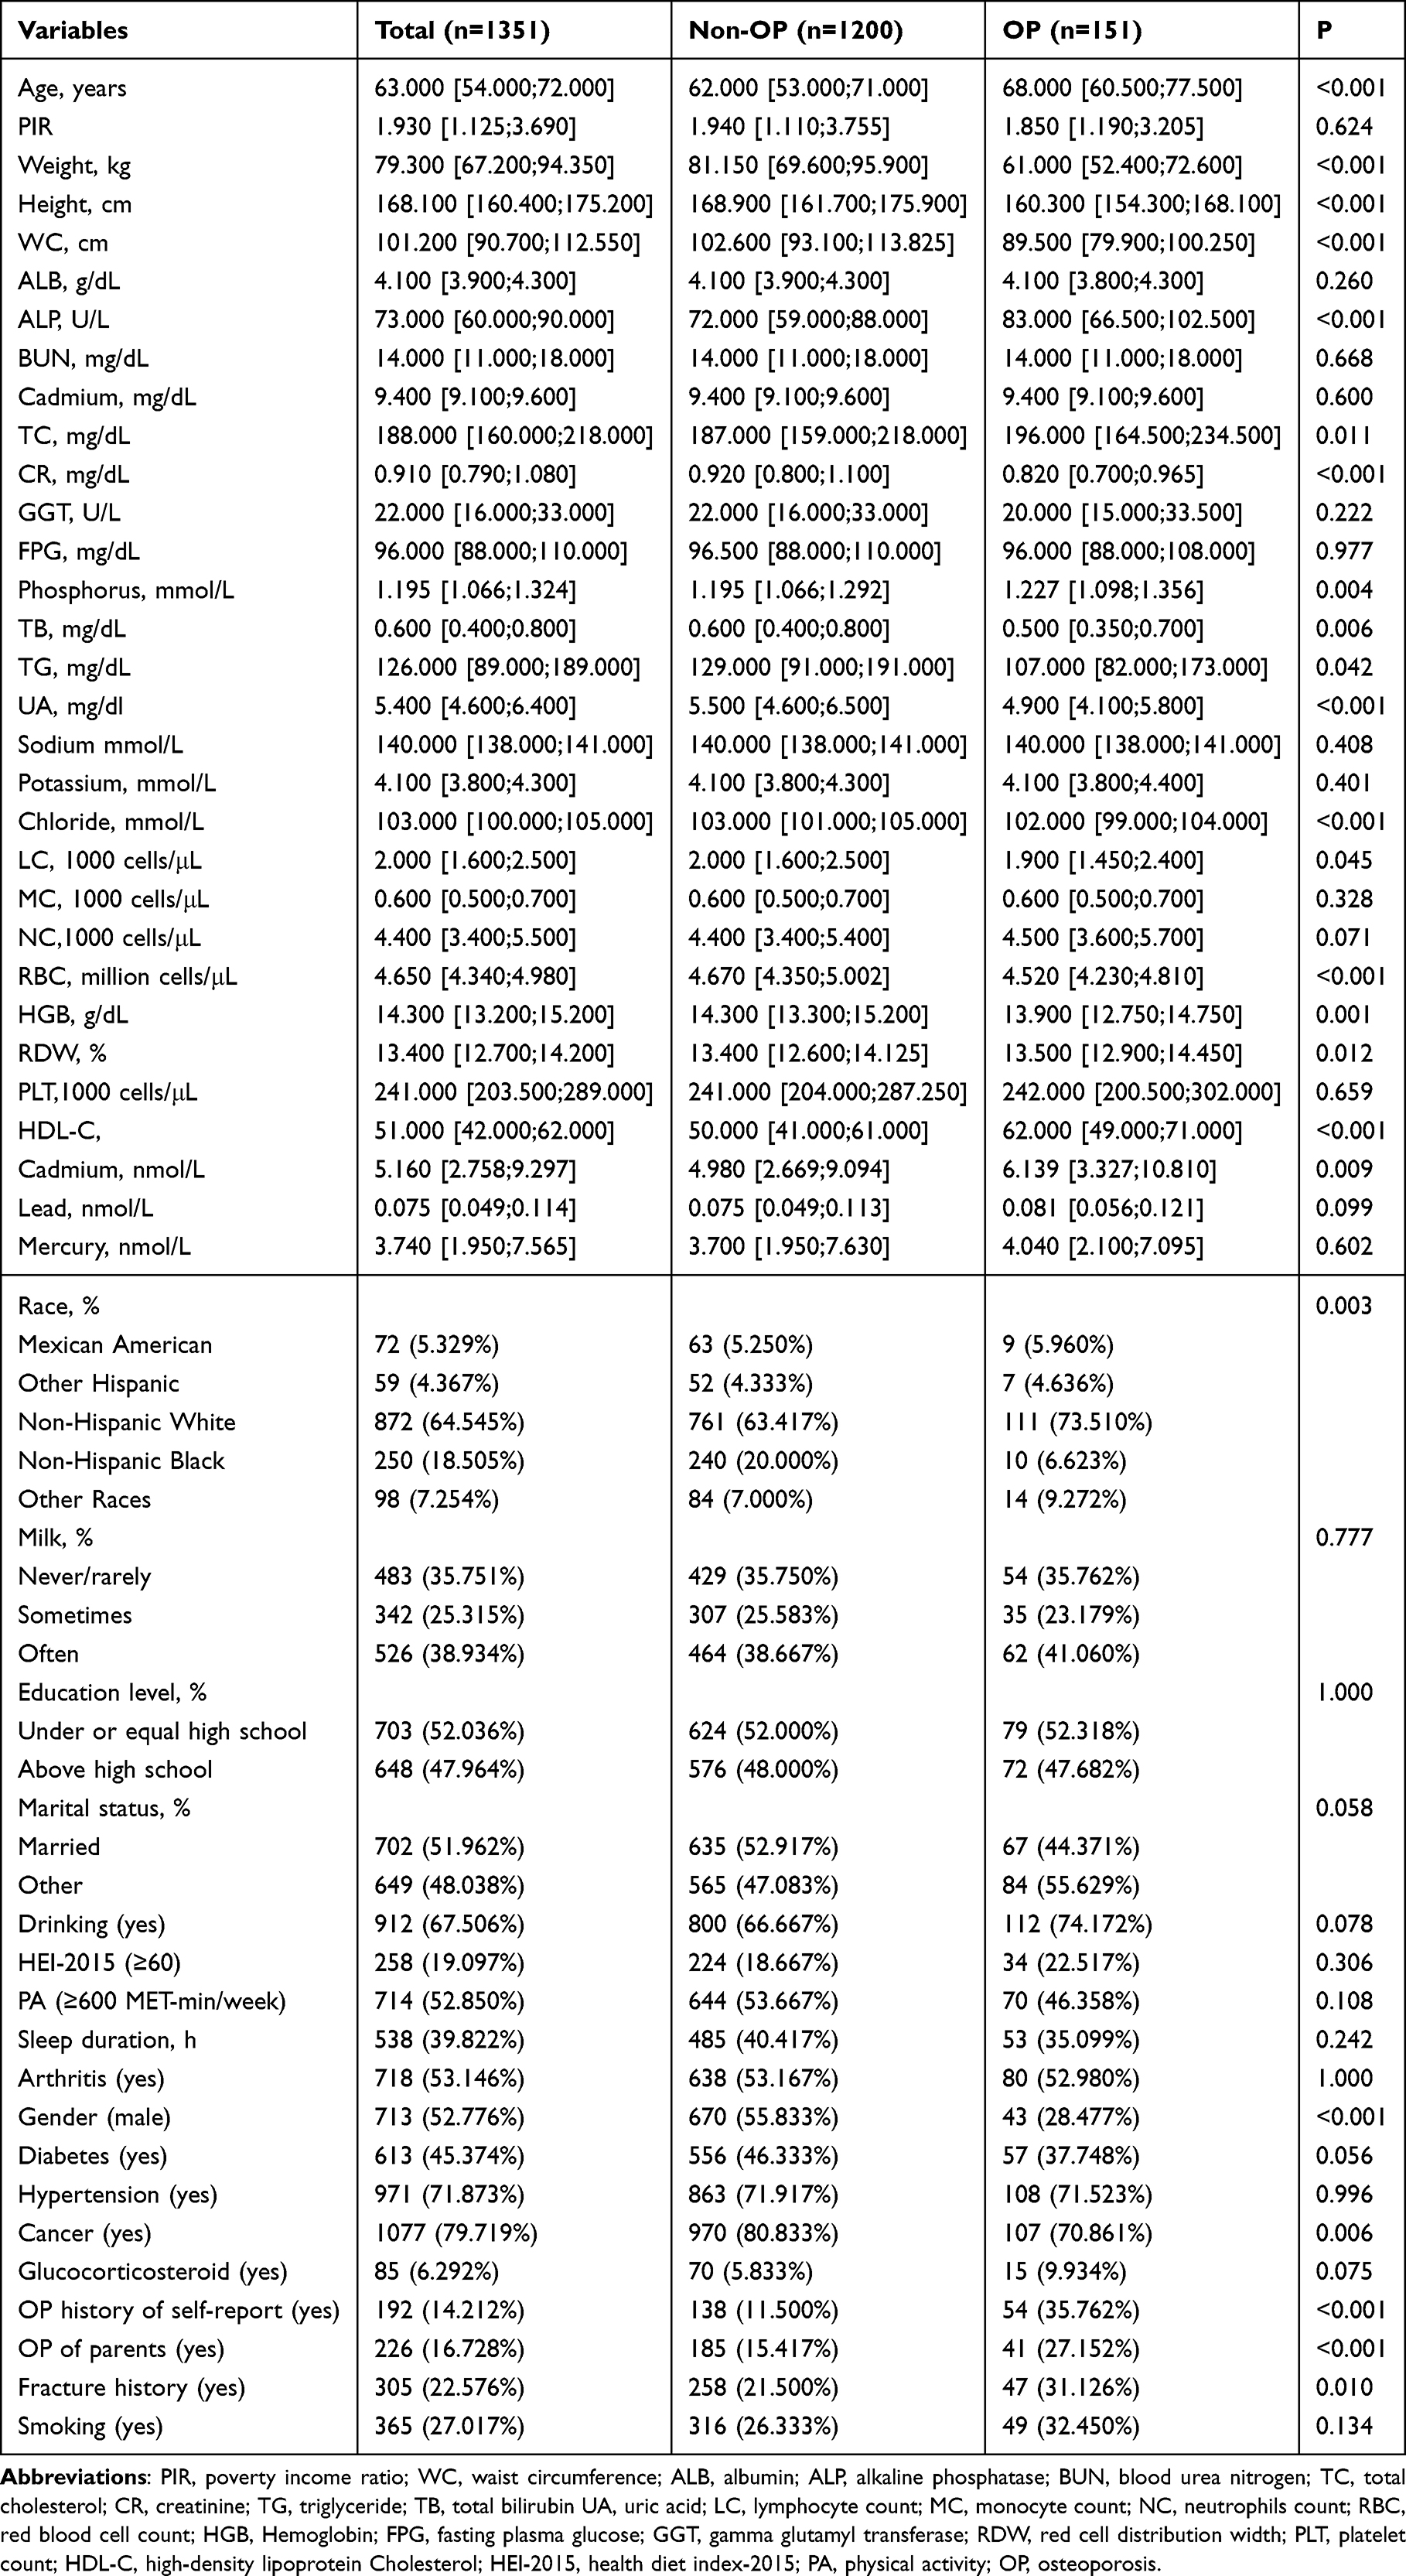 |
Table 2 Characteristics Comparison Between the OP Group and the Non-OP Group in the Train Set |
Screening of Covariates Related to OP
To identify key covariates, we applied the Lasso and Boruta methods. The Lasso regression employed a tuning parameter (λ) to eliminate redundant variables. Through 10-fold cross-validation, an optimal λ value of 0.010 was identified, which selected 18 OP-related variables (Figure 1A and B). These variables constituted age, race, height, weight, diabetes, glucocorticosteroid, milk, the OP history of self-report, fracture history, ALP, TC, phosphorus, TB, sodium, potassium, NC, HGB, and HDL-C. The Boruta algorithm identified 12 OP-related variables, including gender, age, weight, height, WC, OP history of self-report, BUN, CR, TG, RBC, HGB, and HDL-C (Figure 1C). We then used the Venn algorithm to compare the variable sets from both 2 methods and identify overlapping features. This analysis revealed six overlapping genes, including HGB, OP history of self-report, HDL-C, weight, height, and age (Figure 1D).
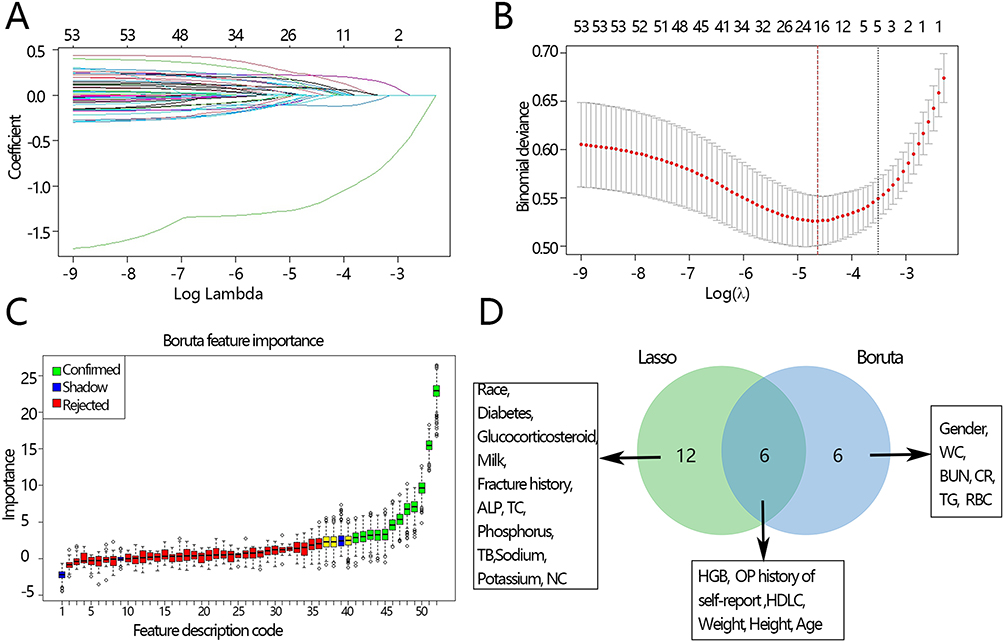 |
Figure 1 Screening of covariates for OP in the train set. (A) Covariates included in the optimal Lasso. (B) Cross-validation plot for the term of penalty. (C) Boruta Feature Selection Process for OP. (D) Venn plot of two covariates sets. Abbreviations: PIR, poverty income ratio; WC, waist circumference; ALB, albumin; ALP, alkaline phosphatase; BUN, blood urea nitrogen; TC, total cholesterol; CR, creatinine; TG, triglyceride; TB, total bilirubin UA, uric acid; LC, lymphocyte count; MC, monocyte count; NC, neutrophils count; RBC, red blood cell count; HGB, Hemoglobin; FPG, fasting plasma glucose; GGT, gamma glutamyl transferase; RDW, red cell distribution width; PLT, platelet count; HDL-C, high-density lipoprotein Cholesterol; HEI-2015, health diet index-2015; PA, physical activity; OP, osteoporosis; Lasso, least absolute shrinkage and selection operator. Notes: Since the abscissa in the C diagram represents a variable, we use digital coding instead because the gap is small. Feature description code is as follows: 1–5: Shadow min, Hg, MC, Race, Milk. 6–10: Drinking, Sodium, PA, Shadow mean, Education level. 11–15: Sleep duration, Calcium, Marital status, OP of parents, LC. 16–20: Chloride, PLT, HEI, RDW, Arthritis. 21–25: Lead, Phosphorus, Glucocorticosteroid, Cancer, Smoking. 26–30: Fracture history, GGT, TC, TB, Hypertension. 31–35: NC, Potassium, ALP, UA, Diabetes. 36–40: ALB, FBG, Cadmium, Shadow max, PIR. 41–45: Gender, CR, BUN, RBC, HGB. 46–50: OP history of self-report, Age, TG, HDLC, Height. 51–52: WC, weight. |
Based on the six key covariates associated with OP identified above, we first categorized six key covariates into three groups: demographic characteristics (age, weight, and height), medical history (OP history of self-report), and biochemical markers (HGB and HDL-C). We then employed ROC analysis to assess the predictive performance of these three kinds of factors and their four combinations (demographic + medical history + biochemical; demographic + medical history; medical history + biochemical; and demographic + biochemical). The AUC [95% CI] for the demographic, medical history, and biochemical indicators were 0.832 [0.790, 0.874], 0.623 [0.575, 0.671], and 0.710[0.656, 0.764], respectively. The corresponding AUCs for the four combinations were 0.843 [0.804, 0.882], 0.841 [0.801, 0.881], 0.735 [0.681, 0.788], and 0.835 [0.795, 0.876] (Table 3) (ROC plots are presented in Supplementary Figure 1). We further compared the AUC of the combined model incorporating all three indicator types with those of the six other models using the Delong test. This analysis revealed that the demographic + medical history + biochemical model had a significantly higher AUC than the medical history + biochemical model (P < 0.05), the medical history model alone (P < 0.05), and the biochemical model alone (P < 0.05). No significant differences were observed between the demographic + medical history + biochemical model and the clinical characteristic model, the clinical characteristic + medical history model, or the clinical characteristic + biochemical model (all P > 0.05, Table 4). IDI analysis was used to evaluate model variability, and its results aligned with those from the Delong test (Table 4). In summary, among the seven models, the demographic + medical history + biochemical model and the demographic + medical history model exhibited the highest AUC values, with no significant difference between them. However, as the latter demonstrated higher specificity (0.668 vs 0.615, Table 3) and accuracy (0.688 vs 0.647, Table 3) along with greater simplicity, we considered it the optimal model including age, weight, height, and OP history of self-report. OP history of self-report was obtained before the current OP diagnosis to clarify whether the participants had a history of OP. A history of OP in clinical practice represents a significant risk factor for subsequent OP. Given the chronic nature of OP, the inclusion of this history is therefore justified.
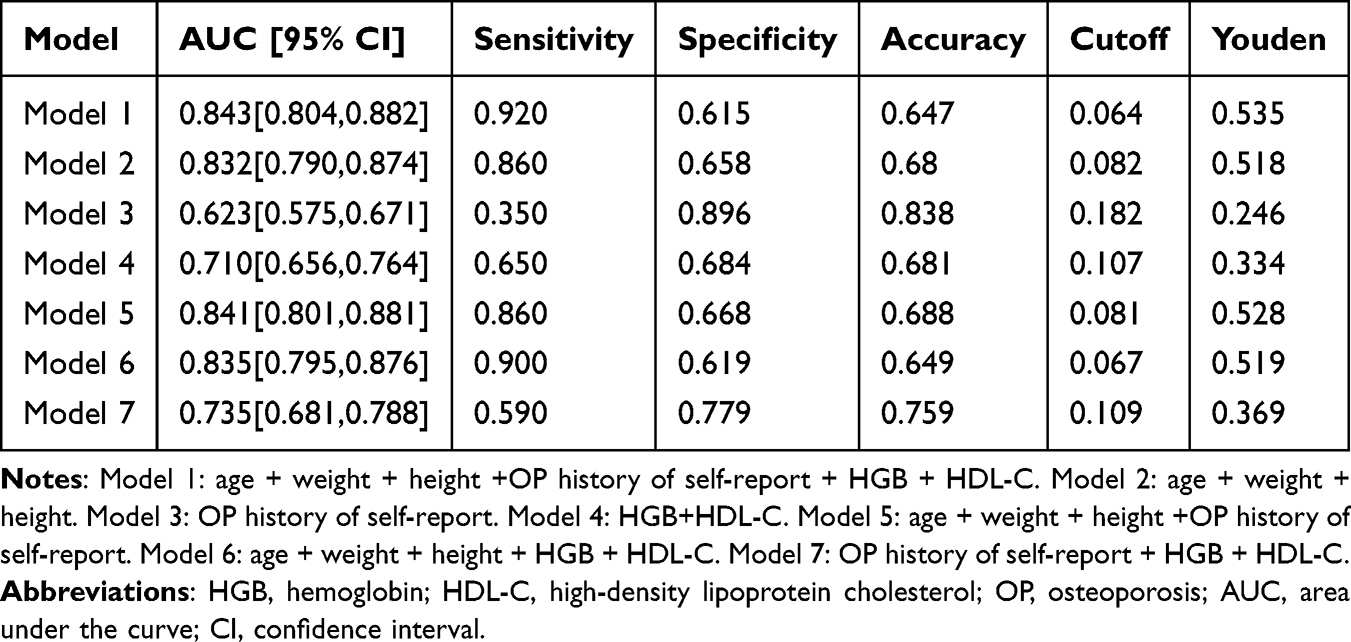 |
Table 3 Different Model Characteristic Indicators in the Train Set |
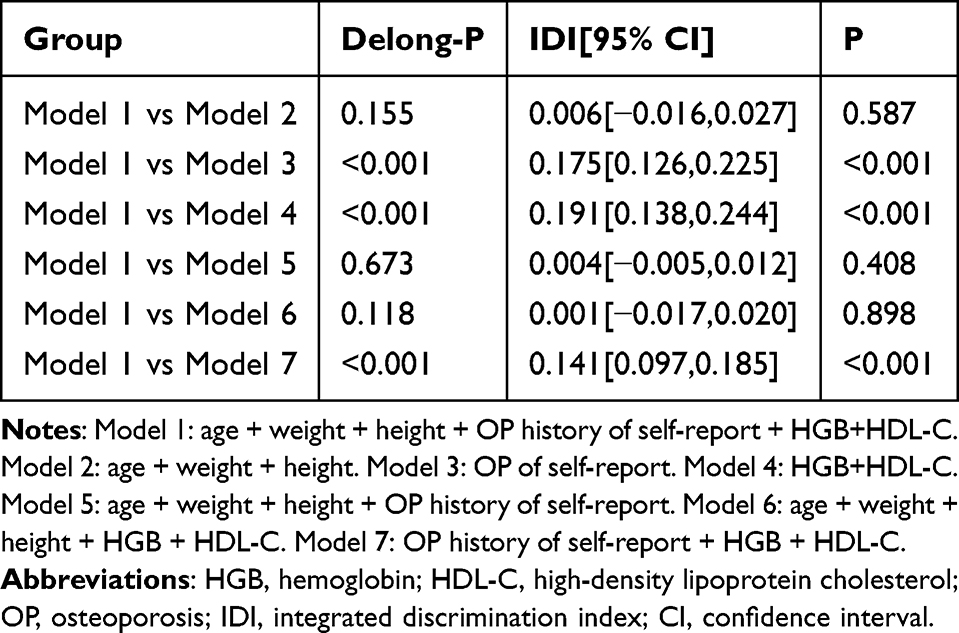 |
Table 4 Comparison of Different Models in the Train Set |
In addition, we further used logistic regression to evaluate the rationality of the indicator selection based on the six variables obtained by the Venn plot. The results of univariate logistic regression analysis showed that these variables were significantly correlated with OP (OR[95% CI]: OP history of self-report: 4.281 [2.942, 6.253], HDL-C: 1.032 [1.022, 1.041], HGB: 0.832 [0.754, 0.932], weight: 0.921 [0.914, 0.949], height: 0.920 [0.909, 0.948], age: 1.053 [1.030, 1.076], all P < 0.001). The results of multivariate logistic regression analysis showed that OP history of self-report, weight, height, age were significantly correlated with OP (all P<0.05). However, HDL-C and HGB were not significantly correlated with OP (Table 5). These results indicate that the selected variables are significantly associated with OP and are reasonable.
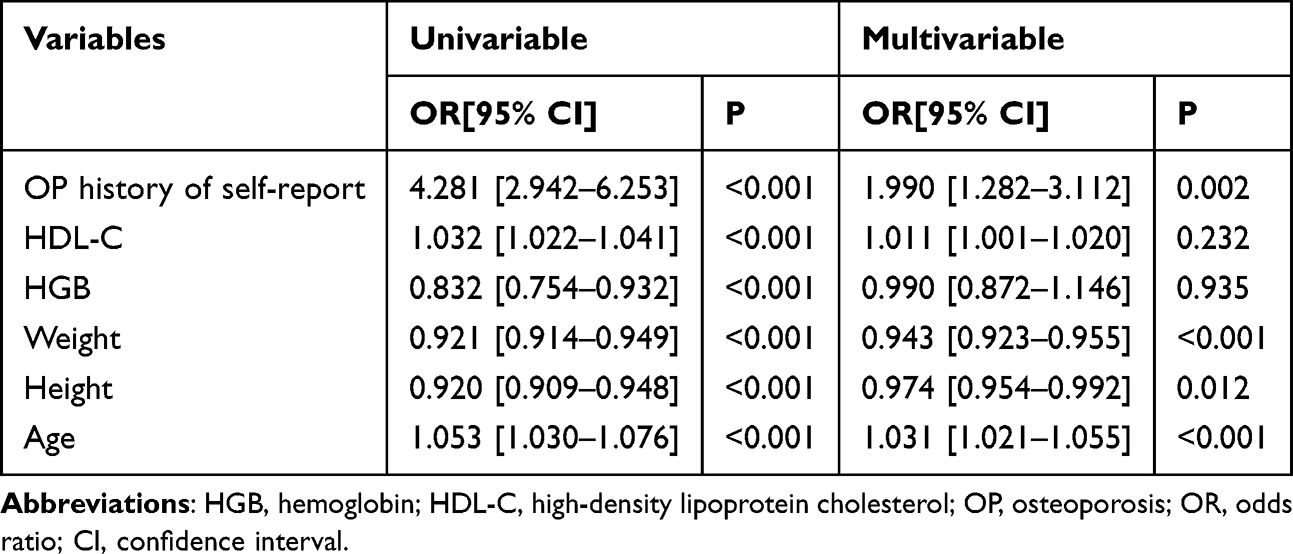 |
Table 5 Logistic Regression Analysis Between Key Variables and OP in the Train Set |
Construction of a Nomogram for Predicting OP
To facilitate the clinical translation of our findings, we developed a nomogram in the train set incorporating the variables from the optimal model: age, weight, height, and OP history of self-report. The nomogram indicated that weight contributed most substantially to OP prediction (Figure 2A). Calibration curves revealed close alignment between the apparent and ideal lines (Figure 2B), followed by verification in the test set (Figure 2C). ROC analysis yielded AUC values of 0.841 and 0.833 for the train and test sets, respectively (Figure 2D and E). The Hosmer–Lemeshow test produced P values of 0.548 for the train set and 0.211 for the test set. Both evaluation methods supported the nomogram’s calibration. DCA analysis further indicated a favorable net clinical benefit for the nomogram across both datasets (Figure 3A and B). To exclude the potential impact of anti-OP medication use on model robustness, sensitivity analysis was performed. The results showed that the nomogram still had a close alignment between the apparent and ideal lines (Figure 4A), good prediction efficiency (AUC: 0.831, Figure 4B), and favorable net clinical benefit (Figure 4C) in patients without use of anti-OP medication. Those results indicated the nomogram based on these four indicators was effective in identifying OP among COPD patients, with its robustness unaffected by anti-osteoporotic drug use.
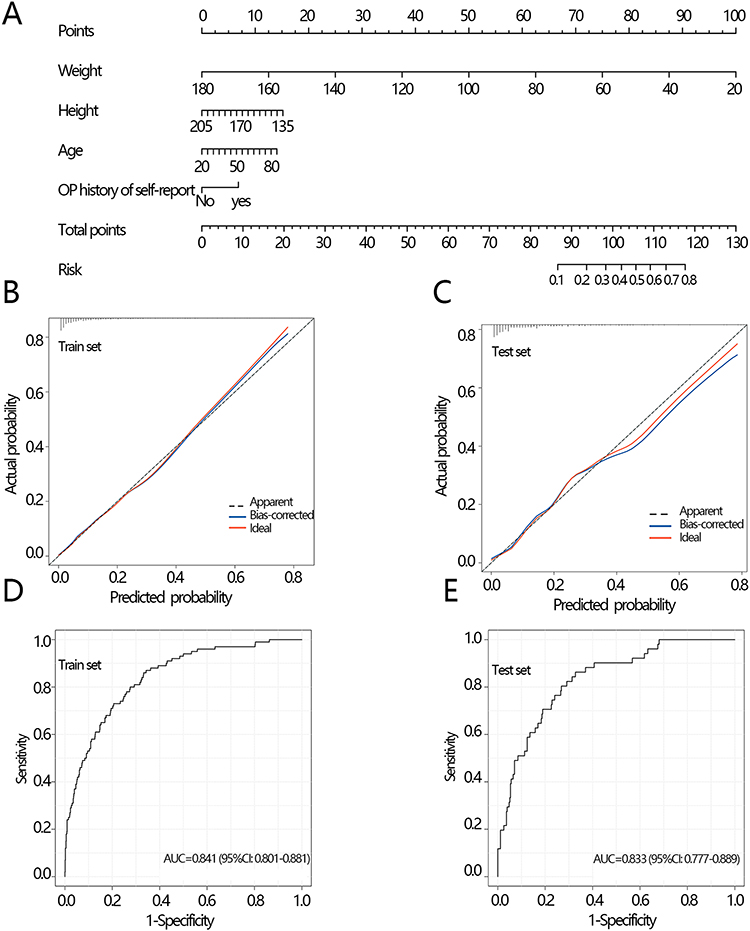 |
Figure 2 Nomogram and its predictive performance evaluation. (A) Nomogram established using age, weight, height, and OP history of self-report in the train set. (B) Correction curve of the train set. (C) Correction curve of the test set. (D) ROC of the train set. (E) ROC of the test set. Abbreviations: OP, osteoporosis; ROC, receiver operating characteristic curve; AUC, area under the curve; CI, confidence interval. |
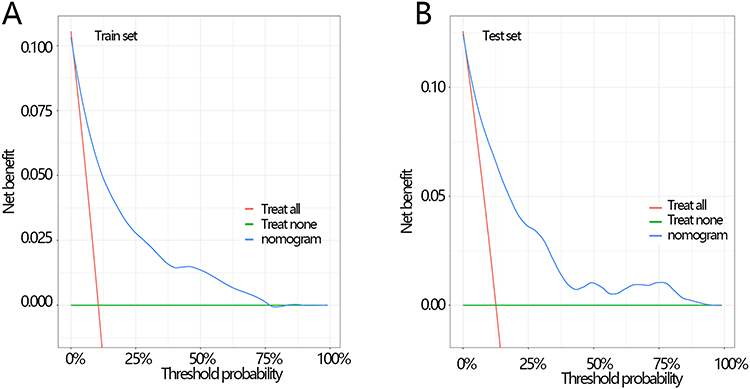 |
Figure 3 The clinical net benefit of the model was evaluated by DCA analysis (A) in the train set, and (B) the test set. Abbreviation: DCA, decision curve analysis. |
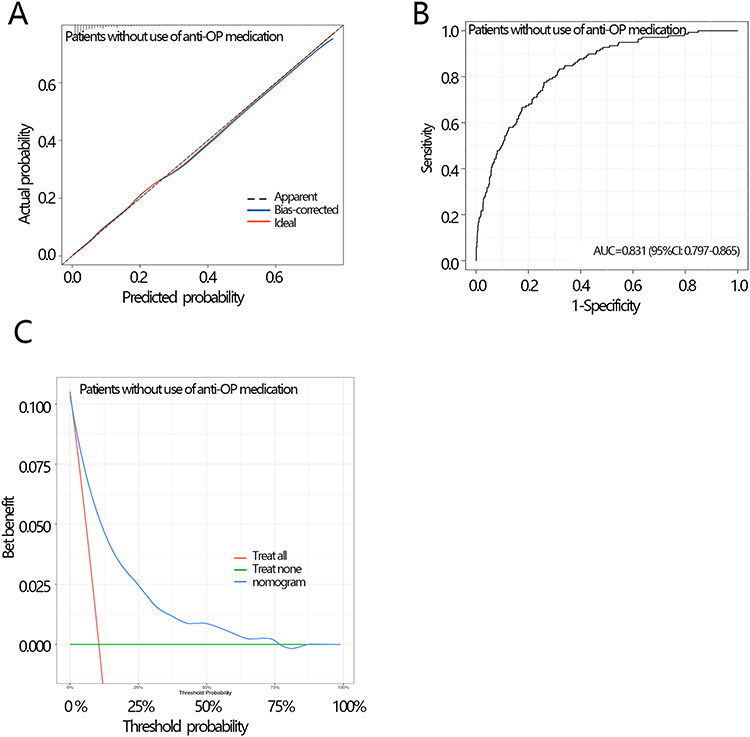 |
Figure 4 Sensitivity analysis of model performance after excluding medication users. (A) Calibration Curve, (B) ROC Curve, and (C) DCA. Abbreviation: OP, osteoporosis; ROC, receiver operating characteristic curve; AUC, area under the curve; CI, confidence interval; DCA: decision curve analysis. |
To further investigate the nomogram’s stability for predicting OP, we conducted subgroup analyses in the test set. COPD in this study is diagnosed using 2 criteria across different year cycles, and older adults and women are more vulnerable to OP. Therefore, we assessed the nomogram’s predictive performance across subgroups based on these three key variables that could potentially affect the results. The AUC values in all subgroups were approximately 0.8, indicating robust predictive accuracy. Moreover, Delong’s test revealed no significant differences between self-reported and spirometry-diagnosed COPD subgroups, between participants under and over 65 years of age, or between males and females. These findings suggest that the predictive performance of the nomogram was not influenced by COPD diagnostic method, age, or gender, demonstrating its relative stability. Additionally, the Hosmer–Lemeshow test indicated that, except in the female subgroup, the predicted probabilities aligned well with observed outcomes (P > 0.05, Table 6).
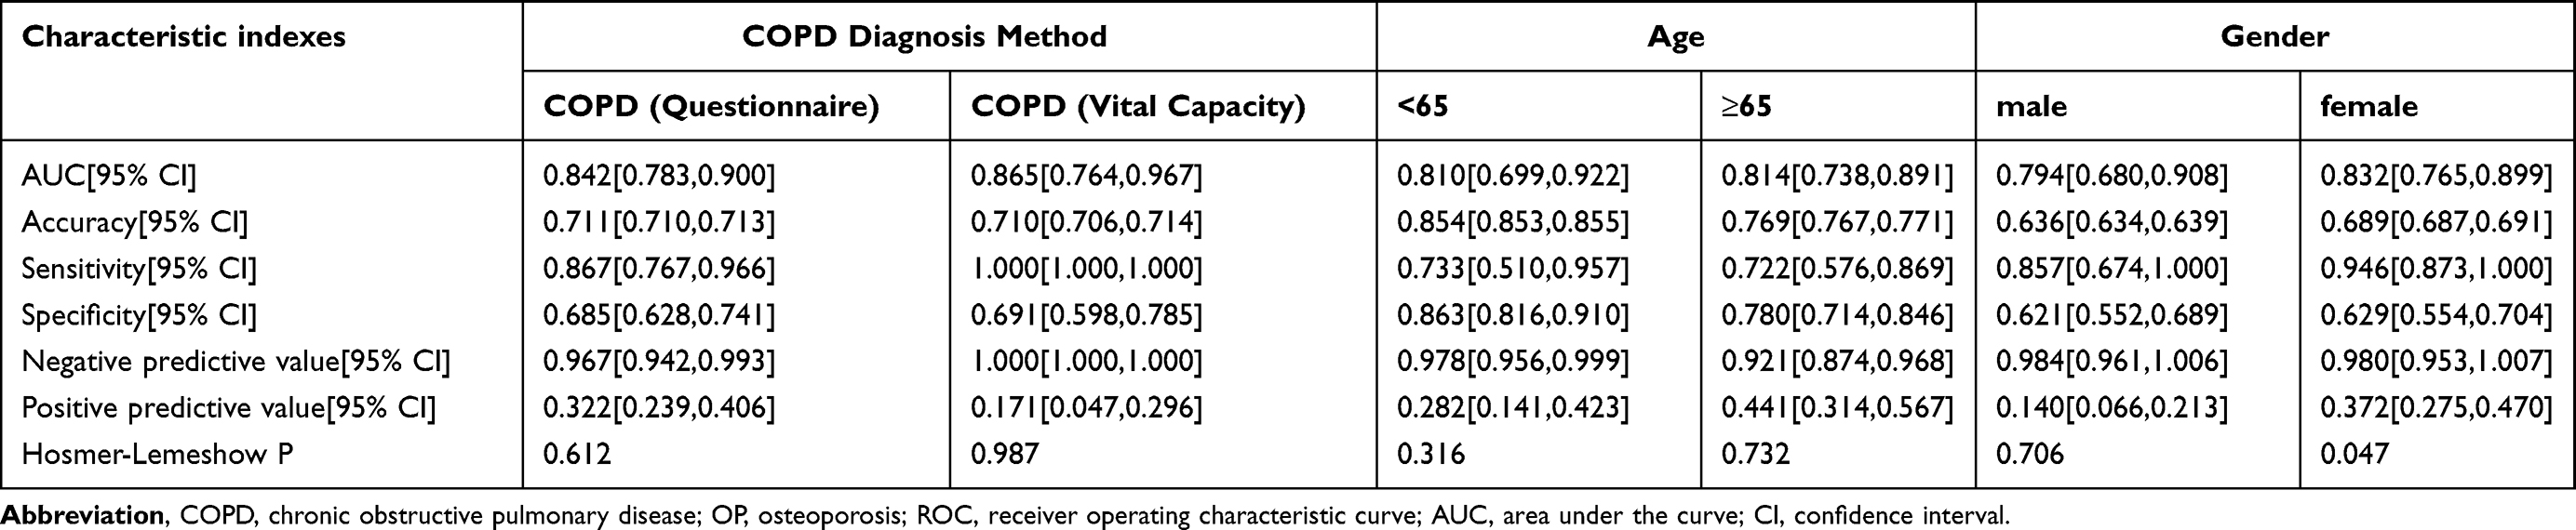 |
Table 6 The Prediction Efficiency of the Model in Subgroups of the Test Set |
Discussion
This study established age, weight, height, and the OP history of self-report as predictors of OP in COPD patients and incorporated them into the nomogram. The model exhibited strong predictive performance, clinical utility, and robustness. Weight emerged as the most influential predictor in the nomogram.
Age is not only a risk factor for COPD, but also a risk factor for OP in COPD. The age-standardized prevalence of COPD rises progressively with advancing age.3 COPD occurs more frequently among individuals aged 40 and above than in younger populations.26,27 OP is also predominantly observed in older adults,28 with prevalence rates as high as 21.7% in those aged 50–85 years and older.29 The risk of OP significantly increases with age, primarily due to an imbalance in bone remodeling. First, postmenopausal women experience a sharp decline in estrogen levels, while elderly men exhibit a gradual decrease in testosterone. Estrogen inhibits osteoclast activity and promotes osteoblast survival; its reduction leads to accelerated bone resorption and insufficient bone formation.30 Furthermore, age-related declines in vitamin D synthesis capacity and intestinal calcium absorption efficiency, coupled with a compensatory increase in parathyroid hormone, collectively exacerbate a negative calcium balance.31 With aging, mesenchymal stem cells in the bone marrow exhibit an increased tendency to differentiate into adipocytes and a decreased tendency to differentiate into osteoblasts, thereby weakening bone formation capacity.32 Concurrently, senescent osteoblasts and osteocytes secrete increased levels of pro-osteoclastogenic factors and decreased levels of osteoprotegerin, further stimulating bone resorption.33 Thus, the association between age and OP in COPD patients appears well-supported.
In patients with COPD, both weight and height are significantly associated with OP. Weight itself is a known determinant of bone density, as individuals with higher body weight exhibit greater bone mass due to increased mechanical loading, which stimulates bone formation.34 Adipose tissue also stores estrogen, which regulates bone metabolism by promoting bone formation and inhibiting resorption.35,36 Moreover, leptin secreted from fat tissue stimulates osteoblast activity, further protecting against bone loss.37 In contrast, low body weight exerts opposing effects on skeletal integrity. Height may reflect overall skeletal dimensions and peak bone mass acquired during adolescence; shorter individuals tend to have lower bone mass and are therefore more vulnerable to age-related bone loss. It is also important to consider that height loss in adults, particularly in older populations, can be a consequence of undiagnosed vertebral fractures.38 This creates a complex, bidirectional relationship where short stature may be both a predisposing factor for, and an outcome of, osteoporotic fractures. Our study confirmed that both height and weight were significantly lower in COPD patients with OP compared to those COPD patients without OP. Additionally, chronic airway obstruction and hypoxia in COPD can reduce food intake, leading to gastrointestinal dysfunction and impaired calcium absorption in the small intestine, which further disrupts bone metabolism.39 These mechanisms may collectively elevate OP risk in COPD patients with low weight and stature.
We also found that the OP history of self-report was significantly associated with its development in COPD patients. Moreover, the proportion of patients with the OP history of self-report was significantly higher in the OP group than in the group without OP. It could be because inflammation represents a common factor in the pathogenesis of both COPD and OP.40 Studies indicate that bone resorption during acute exacerbations exceeds that in the stable state among COPD patients, a phenomenon attributed to respiratory dysfunction, elevated oxidative stress, and systemic inflammation.41 Persistent inflammation in COPD patients may readily stimulate the recurrence of OP.
Although each indicator significantly associates with OP risk, clinicians in busy practice settings find it difficult to empirically integrate all factors and accurately quantify individual patient risk. This gap underscores the need for a tool that synthesizes these readily available parameters to deliver intuitive and personalized risk predictions. In response, we constructed a visual nomogram based on these four key indicators. This work addresses a specific clinical challenge: providing a minimalist, intuitive, and rapid OP screening tool for patients with COPD in respiratory outpatient clinics, a population with distinct risk profiles. While the Fracture Risk Assessment Tool (FRAX) provides an excellent general framework, it is not specifically designed for patients with COPD. The bone health of these patients is complexly influenced by disease-specific factors, such as glucocorticoid exposure and vitamin D deficiency.42,43 In busy clinical environments focused on managing respiratory symptoms, physicians require a specialized tool that integrates seamlessly and rapidly signals OP risk to prompt further assessment or intervention. Consequently, the core value of this study lies in the population-specific validation, integration, and clinical translation of established risk factors (some factors included in FRAX). In addition, the model can be combined with conventional imaging opportunistic examination in the future to increase the incidence of asymptomatic vertebral fractures in COPD patients, so as to intervene early. For example, this model could complement the novel CT-based fracture risk assessment model developed by Yang et al for COPD patients,21 synergistically improving the accurate identification of high-risk COPD populations prone to fractures.
It is worth noting that in clinical practice, a history of OP is a significant risk factor for future OP. Given the chronic nature of OP, its inclusion is reasonable. Furthermore, this study, leveraging the design of the NHANES database, effectively avoids circular reasoning. NHANES data collection follows a strict sequential order: all questionnaire information (including OP history of self-report) is completed before objective physical examinations and laboratory tests (such as bone density measurements) at mobile examination centers. Therefore, “previous OP” included in the model is an exposure factor collected at baseline, logically before “current OP status” defined based on subsequent bone density measurement results. This temporal separation ensures the independence of predictors and outcome variables, consistent with the fundamental principle of risk prediction models: using baseline known information to predict future outcomes or currently undetected conditions. This approach, consistent with the inclusion of prior fracture history in internationally recognized prediction tools such as the fracture risk assessment tool, is intended to enhance the model’s discriminative power and clinical utility, rather than to infer etiology. Therefore, it is methodologically rigorous and reasonable.
Nonetheless, our study has several limitations. The input variables were derived from a retrospective study, which restricted the range of available data, and no prospective studies have yet established causal relationships among them. Some variables were obtained through questionnaires and may therefore be subject to memory bias. Moreover, since this study utilized a dataset from the United States, it may be subject to regional biases and might not generalize directly to other populations. The patients’ FRAX score is not available due to the lack of data; the fracture risk of this population could not be verified. Consequently, future studies should further validate the model’s predictive performance across diverse geographic regions.
Conclusion
This study showed that age, weight, height, and the OP history of self-report were significantly associated with densitometric OP measurements in COPD patients. The nomogram for predicting OP was constructed based on these four variables, which had good predictive efficacy and stability, and it could be used as a useful tool for early identification of high-risk OP patients in the clinical setting of COPD.
Data Sharing Statement
The datasets generated during and/or analyzed during the current study are available from the corresponding author on reasonable request.
Ethics Approval
The Ethics Committee of Changxing County People’s Hospital deemed that this research is based on open-source data, so the need for ethics approval was waived.
Funding
There is no funding to report.
Disclosure
The authors report no conflict of interest.
References
1. Celli B, Fabbri L, Criner G, et al. Definition and nomenclature of chronic obstructive pulmonary disease: time for its revision. Am J Respir Crit Care Med. 2022;206(11):1317–16. doi:10.1164/rccm.202204-0671PP
2. Stolz D, Mkorombindo T, Schumann DM, et al. Towards the elimination of chronic obstructive pulmonary disease: a lancet commission. Lancet. 2022;400(10356):921–972. doi:10.1016/S0140-6736(22)01273-9
3. Wang Z, Lin J, Liang L, et al. Global, regional, and national burden of chronic obstructive pulmonary disease and its attributable risk factors from 1990 to 2021: an analysis for the global burden of disease study 2021. Respir Res. 2025;26(1):2. doi:10.1186/s12931-024-03051-2
4. Quaderi SA, Hurst JR. The unmet global burden of COPD. Glob Health Epidemiol Genom. 2018;3:e4. doi:10.1017/gheg.2018.1
5. Inoue D, Watanabe R, Okazaki R. COPD and osteoporosis: links, risks, and treatment challenges. Int J Chron Obstruct Pulmon Dis. 2016;11:637–648. doi:10.2147/COPD.S79638
6. Maltais F, Decramer M, Casaburi R, et al. An official American Thoracic Society/European Respiratory Society statement: update on limb muscle dysfunction in chronic obstructive pulmonary disease. Am J Respir Crit Care Med. 2014;189(9):e15–62. doi:10.1164/rccm.201402-0373ST
7. Torres-Sanchez I, Rodriguez-Alzueta E, Cabrera-Martos I, Lopez-Torres I, Moreno-Ramirez MP, Valenza MC. Cognitive impairment in COPD: a systematic review. J Bras Pneumol. 2015;41(2):182–190. doi:10.1590/S1806-37132015000004424
8. Jakobsson J, Burtin C, Hedlund M, et al. Effects and mechanisms of supramaximal high-intensity interval training on extrapulmonary manifestations in people with and without chronic obstructive pulmonary disease (COPD-HIIT): study protocol for a multi-centre, randomized controlled trial. Trials. 2024;25(1):664. doi:10.1186/s13063-024-08481-3
9. Jaramillo JD, Wilson C, Stinson DS, et al. Reduced bone density and vertebral fractures in smokers. men and COPD patients at increased risk. Ann Am Thorac Soc. 2015;12(5):648–656. doi:10.1513/AnnalsATS.201412-591OC
10. Bitar AN, Syed Sulaiman SA, Ali IAH, Khan I, Khan AH. Osteoporosis among patients with chronic obstructive pulmonary disease: systematic review and meta-analysis of prevalence, severity, and therapeutic outcomes. J Pharm Bioallied Sci. 2019;11(4):310–320. doi:10.4103/jpbs.JPBS_126_19
11. Nih Consensus Development Panel on Osteoporosis Prevention D, Therapy. Osteoporosis prevention, diagnosis, and therapy. JAMA. 2001;285(6):785–795. doi:10.1001/jama.285.6.785
12. Li Y, Gao H, Zhao L, Wang J. Osteoporosis in COPD patients: risk factors and pulmonary rehabilitation. Clin Respir J. 2022;16(7):487–496. doi:10.1111/crj.13514
13. Xiaomei W, Hang X, Lingling L, Xuejun L. Bone metabolism status and associated risk factors in elderly patients with chronic obstructive pulmonary disease (COPD). Cell Biochem Biophys. 2014;70(1):129–134. doi:10.1007/s12013-014-9868-9
14. Caramori G, Ruggeri P, Arpinelli F, Salvi L, Girbino G. Long-term use of inhaled glucocorticoids in patients with stable chronic obstructive pulmonary disease and risk of bone fractures: a narrative review of the literature. Int J Chron Obstruct Pulmon Dis. 2019;14:1085–1097. doi:10.2147/COPD.S190215
15. Bai P, Sun Y, Jin J, et al. Disturbance of the OPG/RANK/RANKL pathway and systemic inflammation in COPD patients with emphysema and osteoporosis. Respir Res. 2011;12(1):157. doi:10.1186/1465-9921-12-157
16. Canalis E, Mazziotti G, Giustina A, Bilezikian JP. Glucocorticoid-induced osteoporosis: pathophysiology and therapy. Osteoporos Int. 2007;18(10):1319–1328. doi:10.1007/s00198-007-0394-0
17. Romme EA, Rutten EP, Smeenk FW, Spruit MA, Menheere PP, Wouters EF. Vitamin D status is associated with bone mineral density and functional exercise capacity in patients with chronic obstructive pulmonary disease. Ann Med. 2013;45(1):91–96. doi:10.3109/07853890.2012.671536
18. Lee SJ, Binkley N, Lubner MG, Bruce RJ, Ziemlewicz TJ, Pickhardt PJ. Opportunistic screening for osteoporosis using the sagittal reconstruction from routine abdominal CT for combined assessment of vertebral fractures and density. Osteoporos Int. 2016;27(3):1131–1136. doi:10.1007/s00198-015-3318-4
19. LeBoff MS, Greenspan SL, Insogna KL, et al. The clinician’s guide to prevention and treatment of osteoporosis. Osteoporos Int. 2022;33(10):2049–2102. doi:10.1007/s00198-021-05900-y
20. Miller PD. Underdiagnosis and undertreatment of osteoporosis: the battle to be won. J Clin Endocrinol Metab. 2016;101(3):852–859. doi:10.1210/jc.2015-3156
21. Yang H, Li Y, Yang H, et al. A Novel CT-Based Fracture Risk Prediction Model for COPD Patients. Acad Radiol. 2025;32(2):1043–1053. doi:10.1016/j.acra.2024.08.039
22. Report of a WHO Study Group. Assessment of fracture risk and its application to screening for postmenopausal osteoporosis. World Health Organ Tech Rep Ser. 1994;843:1–129.
23. Krebs-Smith SM, Pannucci TE, Subar AF, et al. Update of the healthy eating index: HEI-2015 (vol 118, pg 1591, 2018). J Acad Nutr Diet. 2019;119(10):1759. doi:10.1016/j.jand.2019.07.025
24. Cowan-Pyle AE, Bailey RL, Gao J, et al. Dietary quality and diet-related factors among emerging adults (18–23 y) in the United States are a cause for concern: national health and nutrition examination survey 2015–2018. J Nutr. 2024;154(8):2524–2533. doi:10.1016/j.tjnut.2024.06.015
25. Xiao XQ, Fu FS, Xiang C, Yan HC. Sensitivity to thyroid hormones is associated with sleep duration in the euthyroid population with depression degree lower than moderate. Sci Rep. 2024;14(1):6583. doi:10.1038/s41598-024-57373-8
26. Adeloye D, Chua S, Lee C, et al. Global and regional estimates of COPD prevalence: systematic review and meta-analysis. J Glob Health. 2015;5(2):020415. doi:10.7189/jogh.05.020415
27. Varmaghani M, Dehghani M, Heidari E, Sharifi F, Moghaddam SS, Farzadfar F. Global prevalence of chronic obstructive pulmonary disease: systematic review and meta-analysis. East Mediterr Health J. 2019;25(1):47–57. doi:10.26719/emhj.18.014
28. Harvey NC, McCloskey E, Kanis JA, Compston J, Cooper C. Bisphosphonates in osteoporosis: NICE and easy? Lancet. 2017;390(10109):2243–2244. doi:10.1016/S0140-6736(17)32850-7
29. Salari N, Darvishi N, Bartina Y, et al. Global prevalence of osteoporosis among the world older adults: a comprehensive systematic review and meta-analysis. J Orthop Surg Res. 2021;16(1):669. doi:10.1186/s13018-021-02821-8
30. Manolagas SC. From estrogen-centric to aging and oxidative stress: a revised perspective of the pathogenesis of osteoporosis. Endocr Rev. 2010;31(3):266–300. doi:10.1210/er.2009-0024
31. Lane NE. Epidemiology, etiology, and diagnosis of osteoporosis. Am J Obstet Gynecol. 2006;194(2 Suppl):S3–11. doi:10.1016/j.ajog.2005.08.047
32. Demontiero O, Vidal C, Duque G. Aging and bone loss: new insights for the clinician. Ther Adv Musculoskelet Dis. 2012;4(2):61–76. doi:10.1177/1759720X11430858
33. Rachner TD, Khosla S, Hofbauer LC. Osteoporosis: now and the future. Lancet. 2011;377(9773):1276–1287. doi:10.1016/S0140-6736(10)62349-5
34. Zhao LJ, Jiang H, Papasian CJ, et al. Correlation of obesity and osteoporosis: effect of fat mass on the determination of osteoporosis. J Bone Miner Res. 2008;23(1):17–29. doi:10.1359/jbmr.070813
35. Cauley JA. Estrogen and bone health in men and women. Steroids. 2015;99(Pt A):11–15. doi:10.1016/j.steroids.2014.12.010
36. Rinonapoli G, Pace V, Ruggiero C, et al. Obesity and bone: a complex relationship. Int J Mol Sci. 2021;22(24):13662. doi:10.3390/ijms222413662
37. Hwang J, Yoo JA, Yoon H, et al. The role of leptin in the association between obesity and psoriasis. Biomol Ther. 2021;29(1):11–21. doi:10.4062/biomolther.2020.054
38. Siminoski K, Warshawski RS, Jen H, Lee K. The accuracy of historical height loss for the detection of vertebral fractures in postmenopausal women. Osteoporos Int. 2006;17(2):290–296. doi:10.1007/s00198-005-2017-y
39. Dai Wuqiang CG, Zhaohao F. Analysis of bone mineral density in patients with COPD combined with osteoporosis of different body mass index and its clinical significance. Modern Diagnosis and Treatment. 2018;11(29). doi:10.3969/j.issn.1001-8174.2018.11.064
40. Gao R, Zeng JK, Yang K, Wang P, Zhou S. Novel association between chronic obstructive pulmonary disease and osteoporosis: a prospective cross-sectional study. World J Orthop. 2025;16(2):102101. doi:10.5312/wjo.v16.i2.102101
41. Stanojkovic I, Kotur-Stevuljevic J, Spasic S, et al. Relationship between bone resorption, oxidative stress and inflammation in severe COPD exacerbation. Clin Biochem. 2013;46(16–17):1678–1682. doi:10.1016/j.clinbiochem.2013.08.003
42. Chen YW, Ramsook AH, Coxson HO, Bon J, Reid WD. Prevalence and risk factors for osteoporosis in individuals with COPD: a systematic review and meta-analysis. Chest. 2019;156(6):1092–1110. doi:10.1016/j.chest.2019.06.036
43. Graat-Verboom L, Wouters EF, Smeenk FW, van den Borne BE, Lunde R, Spruit MA. Current status of research on osteoporosis in COPD: a systematic review. Eur Respir J. 2009;34(1):209–218. doi:10.1183/09031936.50130408
 © 2026 The Author(s). This work is published and licensed by Dove Medical Press Limited. The
full terms of this license are available at https://www.dovepress.com/terms
and incorporate the Creative Commons Attribution
- Non Commercial (unported, 4.0) License.
By accessing the work you hereby accept the Terms. Non-commercial uses of the work are permitted
without any further permission from Dove Medical Press Limited, provided the work is properly
attributed. For permission for commercial use of this work, please see paragraphs 4.2 and 5 of our Terms.
© 2026 The Author(s). This work is published and licensed by Dove Medical Press Limited. The
full terms of this license are available at https://www.dovepress.com/terms
and incorporate the Creative Commons Attribution
- Non Commercial (unported, 4.0) License.
By accessing the work you hereby accept the Terms. Non-commercial uses of the work are permitted
without any further permission from Dove Medical Press Limited, provided the work is properly
attributed. For permission for commercial use of this work, please see paragraphs 4.2 and 5 of our Terms.
Recommended articles
A Nomogram for Predicting the Risk of Pulmonary Hypertension for Patients with Chronic Obstructive Pulmonary Disease
Wang N, Guo Z, Gong X, Kang S, Cui Z, Yuan Y
International Journal of General Medicine 2022, 15:5751-5762
Published Date: 22 June 2022
Comorbid Heart Disease in Patients with COPD is Associated with Increased Hospitalization and Mortality – A 15-Year Follow-Up
Giezeman M, Sundh J, Athlin Å, Lisspers K, Ställberg B, Janson C, Montgomery S, Kisiel MA, Nager A, Sandelowsky H, Hasselgren M
International Journal of Chronic Obstructive Pulmonary Disease 2023, 18:11-21
Published Date: 9 January 2023
Analysis of Communal Molecular Mechanism Between Chronic Obstructive Pulmonary Disease and Osteoporosis
Nie H, Wang F, Zeng X, Bao H, Liu X
International Journal of Chronic Obstructive Pulmonary Disease 2023, 18:259-271
Published Date: 11 March 2023
Extrapulmonary Comorbidities Associated with Chronic Obstructive Pulmonary Disease: A Review
Xiang Y, Luo X
International Journal of Chronic Obstructive Pulmonary Disease 2024, 19:567-578
Published Date: 29 February 2024
Comprehensive Nomograms Using Routine Biomarkers Beyond Eosinophil Levels: Enhancing Predictability of Corticosteroid Treatment Outcomes in AECOPD
Feng L, Li J, Qian Z, Li C, Gao D, Wang Y, Xie W, Cai Y, Tong Z, Liang L
Journal of Inflammation Research 2024, 17:1511-1526
Published Date: 8 March 2024