Back to Journals » International Journal of General Medicine » Volume 19
Development and Validation of a Machine Learning Model to Predict the Risk of Medical Decision-Making Delay in Acute Myocardial Infarction Patients From Multicenter Tertiary Hospitals in China
Authors Liu Y ![]() , Yu F, He M, Wang L, Wu H, Liu W, Gui P, He M, Zhang H, Chen Y
, Yu F, He M, Wang L, Wu H, Liu W, Gui P, He M, Zhang H, Chen Y
Received 17 October 2025
Accepted for publication 8 January 2026
Published 28 January 2026 Volume 2026:19 562526
DOI https://doi.org/10.2147/IJGM.S562526
Checked for plagiarism Yes
Review by Single anonymous peer review
Peer reviewer comments 2
Editor who approved publication: Dr Redoy Ranjan
Yan Liu,1 Fei Yu,1 Mingxing He,2 Lijun Wang,1 Haiyuan Wu,1 Wei Liu,3 Ping Gui,1 Meizhen He,1 Hua Zhang,4 Yuanting Chen1
1Nursing Department, Shenzhen Hospital (Futian) of Guangzhou University of Chinese Medicine, Shenzhen, Guangdong, People’s Republic of China; 2Internal Medicine Intensive Care Unit, Shenzhen Hospital of Peking University, Shenzhen, Guangdong, People’s Republic of China; 3Emergency Department, Shenzhen Second People’s Hospital, Shenzhen, Guangdong, People’s Republic of China; 4International School of Nursing, Hainan Medical University, Haikou, Hainan, People’s Republic of China
Correspondence: Yuanting Chen, Shenzhen Hospital (Futian) of Guangzhou University of Chinese Medicine, No. 6001 Beihuan Avenue, Futian District, Shenzhen, People’s Republic of China, Email [email protected] Hua Zhang, Hainan Health Vocational College, No. 32 Xiuhua Road, Xiuying District, Haikou, Hainan, People’s Republic of China, Email [email protected]
Purpose: Timely reperfusion is critical for improving outcomes in patients with acute myocardial infarction (AMI), as every delay raises the incidence of complications and mortality. Therefore, we aimed to develop a machine-learning model that quantifies the risk of pre-hospital decision-making delay and visualizes how individual determinants modulate this risk.
Patients and Methods: This retrospective study included 594 AMI patients admitted to hospitals in Hainan from January to August 2023. Data were collected via medical systems and surveys. We used the Elastic Net and Boruta algorithms for feature selection and hyperparameter optimization with grid search and 10-fold cross-validation. Six machine learning models were developed: logistic regression, random forest, support vector machine, XGBoost, decision tree, and naive Bayes. The primary metric was the Area Under the Curve (AUC), and SHapley Additive exPlanations (SHAP) were used to assess feature importance.
Results: The medical decision-making delay rate was 61.78%, with a median decision time of 3.98 hours. All models showed good predictive performance, with the random forest model excelling, achieving an AUC of 0.91, accuracy of 0.92, recall of 0.98, F1 score of 0.93, and specificity of 0.81. SHAP analysis revealed that pain severity, disease type, and history of myocardial infarction were the most significant predictors of delay. Pain severity had a nonlinear relationship with delay risk, while disease type and prior infarction history showed complex interactions.
Conclusion: Machine learning models, especially random forest, accurately predict the risk of delayed medical decision-making in AMI patients and reliably delineate the key drivers of such delay, thereby informing targeted clinical interventions.
Keywords: machine learning, predictive model, acute myocardial infarction, AMI, medical decision-making delay
Introduction
Acute myocardial infarction (AMI) is the most common cardiovascular emergency, and the rapid restoration of coronary blood flow is crucial for effective treatment. Studies have shown that if reperfusion therapy is delayed by more than one hour after hospital arrival, the risk of death increases significantly, with a 1.6-fold increase for every additional 15 minutes of delay.1 The development of regional collaborative treatment systems has optimized the emergency process for chest pain patients, including the management of green channels, thereby minimizing in-hospital treatment time. Consequently, reducing pre-hospital treatment time has become the primary focus for decreasing the total time from AMI onset to coronary reperfusion. Pre-hospital delays are predominantly due to patients’ delayed decision-making to seek medical help, which accounts for approximately 75% of the total delay.1,2 Even with efforts to expedite post-arrival treatment, the deterioration of the patient’s condition due to prolonged ischemia and myocardial cell necrosis is difficult to prevent, leading to higher rates of major cardiovascular adverse events, recurrent myocardial infarction, and mortality.3–5
Because patient-mediated delay is now the largest remaining modifiable component of total ischemic time, identifying high-risk populations for delayed medical decision-making can facilitate clinical interventions aimed at reducing decision-making time.6–9 Traditional methods, such as linear regression analysis, have been employed to identify predictors of medical decision-making delays in AMI patients.6,10 While these methods are straightforward and can quickly analyze linear relationships, they are limited in handling non-linear relationships and interaction effects, and they lack the capability to assess dynamic data effectively. These limitations have prompted investigators to explore more flexible analytical frameworks. In recent years, the rapid advancement of artificial intelligence, particularly in the era of big data, has positioned machine learning as a promising avenue for clinical predictive model research. Machine learning offers robust data extraction and mining capabilities, and several studies have demonstrated its speed and accuracy in constructing risk prediction models,11–15 highlighting its potential in digital healthcare applications. For instance, Layton AT and colleagues demonstrated that machine-learning algorithms can integrate genomic, behavioural, socioeconomic and environmental data to sharpen risk stratification and guide preventive interventions for hypertension.16 Similarly, Guerreiro J et al leveraged electronic health records to forecast mental-health crises 28 days in advance with high discriminative performance; their model retained robustness across disparate health-care systems—an external validity that conventional regression-based tools rarely achieve.12
Despite the growing enthusiasm for machine learning in cardiovascular research, Although machine learning modeling methods are a current research hotspot in cardiovascular diseases,17,18 there is a notable gap in studies that use these algorithms to predict the risk of delayed medical decision-making for AMI patients. To address this gap, This study aims to develop an accurate and effective risk prediction model for medical decision-making delays in AMI patients using machine learning algorithms, thereby identifying high-risk populations early and providing a basis for timely intervention.
Patients and Methods
Study Design and Study Population
This is a retrospective cross-sectional analytical study. This study recruited newly diagnosed AMI patients from the cardiology departments of the First Affiliated Hospital of Hainan Medical University, the Second Affiliated Hospital of Hainan Medical University, and Hainan Provincial People’s Hospital, all located in Hainan, China, from January 2023 to October 2023. Sample-size estimation based on Riley’s events-per-variable approach indicated that at least 556 participants were required to achieve the desired statistical power;19 the study ultimately enrolled 594 patients, fulfilling this requirement. The recruitment process involved identifying eligible patients through medical records and conducting face-to-face interviews to assess their suitability for the study.
Inclusion Criteria
- Patients who met the diagnostic criteria for AMI as published by the American Heart Association in the most recent guidelines.20
- Patients with the ability to express and understand Mandarin, allowing for effective communication and comprehension of study-related information.
- Patients who were fully aware of the study’s content and voluntarily consented to participate in the research.
Exclusion Criteria
- Patients with mental illness or significant communication barriers that would impede their understanding or participation in the study.
- Patients who are unable to accurately determine their symptom onset time (SOT) even after multiple recall attempts.
- Patients with other serious physical diseases that could potentially confound the study’s outcomes or affect their ability to participate.
Notably, SOT is defined as the exact time a patient first experiences AMI-related specific or non-specific symptoms, not when symptoms worsen, are detected by family, or the patient arrives at the hospital. Even with temporary relief followed by recurrence or worsening, SOT remains the time of initial symptom onset. We confirm SOT by inquiring about the patient’s subjective initial symptom time, supplemented by verification with information from family members, witnesses, or emergency medical personnel.
Data Collection and Definition of Outcomes
To identify predictors of decision-making delay in seeking medical care among patients with AMI, we first reviewed the relevant literature.21–24 After extensive discussion, the research team developed a standardized extraction form and retrospectively collected the following variables from electronic health records: age, sex, marital status, household income, educational level, medical-insurance coverage, health-awareness score, living alone, place of residence, history of diabetes, previous myocardial infarction, hypertension, dyslipidaemia, other cardiac diseases, culprit vessel, Killip class, AMI type, symptom-onset location, time of onset, activity at onset, intermittent symptoms, presence of a companion during onset, pain intensity, typicality of symptoms, attribution of symptoms to cardiac origin, immediate reaction to symptoms, perceived symptom severity, medications taken after onset, waiting for symptom disappearance, bystanders’ reactions, Perceived Social Support Scale (PSSS) score,25 Chinese Acute Coronary Syndrome Response Index (C-ACSRI) score,26 and Generalized Anxiety Disorder-7 (GAD-7) score.27
Two researchers independently recorded data for accuracy. A third independent researcher collected cardiac-related medical-seeking process data and conducted standardized face-to-face interviews for scale assessments. Researchers conducting characteristic assessments were blinded to participants’ decision-making delay outcomes to minimize data collection bias. Decision-making delay was defined as >1 hour from symptom onset to medical-seeking decision, a threshold selected based on prior research linking such delays to poorer outcomes. The study followed reporting guidelines for machine learning prediction models in biomedical research.28
Ethics Approval
We conducted research involving human participants in accordance with the 2013 version of the Declaration of Helsinki. The study was reviewed and approved by the Medical Ethics Committee of Hainan Medical University (HYLL-2023-048), which determined that a verbal informed-consent process was acceptable for this protocol. Before conducting the face-to-face interviews, we explained the purpose and significance of the study to all participants, obtained their verbal informed consent, and assured them that all data would be used solely for scientific research, with strict confidentiality and privacy protection. The Perceived Social Support Scale and Generalized Anxiety Disorder-7 employed in this study are publicly accessible instruments. Written permission to use the Chinese Acute Coronary Syndrome Response Index was obtained via e-mail from the scale’s developers.
Data Preprocessing
Data were initially managed with Excel 2021 and preprocessed using SPSS 26.0. Samples with >30% missing data were excluded; for those with ≤30% missing data, imputation was performed by data type (mode for qualitative variables, mean for quantitative variables). We encoded discrete variables using label encoding, which assigns a unique integer to each category, facilitating their use in machine learning algorithms. To ensure comparability and improve the performance of certain algorithms, we applied normalization methods to scale the data proportionally to the [0,1] range. This process involved transforming the data so that all variables have similar scales and ranges, preventing any single variable from dominating the model due to its scale.
Training and Test Set Partitioning
Using R 4.2.1 (caret package, createDataPartition function), data were randomly split into training (70%) and test (30%) sets. The training set was used for model development, while the test set served for unbiased evaluation of predictive performance and generalization.
Predictor Selection and Classification Algorithms
For supervised learning-based binary classification of decision-making delay risk in AMI patients, feature selection was performed using Elastic Net and Boruta algorithms—selected for their complementary strengths to enhance the robustness of predictor identification. Elastic Net (a linear regularization method) balances the sparse feature generation advantage of LASSO with the stability of ridge regression, effectively mitigating multicollinearity among variables; optimal penalty parameters were determined via 10-fold cross-validation. Boruta, a random forest-based wrapper method, assesses feature importance by comparing the performance of original features against permuted versions, excelling at capturing non-linear feature relevance. Combining these two methods leveraged Elastic Net’s strengths in linear feature refinement and collinearity control with Boruta’s superiority in identifying non-linear feature relationships, ensuring the final feature set (the intersection of results from both algorithms) included only consistently important predictors. Six validated machine learning algorithms were used for model construction (Random Forest, Support Vector Machine [SVM], XGBoost, Decision Tree, Logistic Regression, and Naive Bayes), chosen for their proven efficacy in similar binary classification tasks for cardiovascular outcomes.
Model Optimization and Performance Evaluation
In the training set, we constructed models using the initial parameters of the six algorithms. To determine the optimal parameter set, we employed hyperparameter optimization through grid search combined with 10-fold cross-validation. Grid search systematically explored a predefined grid of parameter values to identify the combination that yielded the best performance based on a specified metric. This approach, coupled with 10-fold cross-validation, helped prevent overfitting by ensuring that the model’s performance was robust across different subsets of the data, thereby enhancing its generalization to unseen data.
In the test set, we evaluated the predictive performance of the models by plotting confusion matrices and calculating several metrics, including accuracy, precision, recall, F1 score, specificity, and negative predictive value, at the optimal cutoff value. Additionally, we plotted ROC curves to assess the models’ discriminative power, with the primary evaluation criterion being the Area Under the Curve (AUC) value, which we used to select the optimal risk prediction model. To compare the clinical utility of the different models, we plotted Decision Curve Analysis (DCA) curves. We further evaluated the model’s fit by plotting calibration curves and conducting the Hosmer-Lemeshow test, which assesses the agreement between observed and predicted probabilities. Finally, we employed SHapley Additive exPlanations (SHAP) to elucidate the impact of each feature in the model on the prediction outcome.
Statistical Analysis
We used Excel 2021 for data storage and management. General data processing was conducted using SPSS 26.0. For data set partitioning, model development, and evaluation, we employed R (version 4.2.1) with several packages, including caret for model training and evaluation, Metrics for performance metrics calculation, glmnet for regularized regression, Boruta for feature selection, pROC for Receiver Operating Characteristic (ROC) analysis, tidyverse and dplyr for data manipulation, rms for regression modeling, and ggpubr for data visualization.
We defined a decision time of ≥1 hour as delayed. For quantitative data, we assessed normality using the Shapiro–Wilk test and visualized the data with histograms. Data that met or approximated a normal distribution were summarized as mean ± standard deviation (Mean ± SD), and group comparisons were made using independent sample t-tests. For skewed data, we used the median with the first and third quartiles (Median [P25, P75]) for description, and group comparisons were conducted using the Wilcoxon rank-sum test. Qualitative data were expressed as rates [n(%)], and group comparisons were performed using chi-square tests or Fisher’s exact probability calculation, depending on the sample size and distribution.
Results
We screened a total of 714 AMI patients. We excluded 67 patients who could not determine the onset time, 18 patients who had difficulty communicating due to dialects, 31 patients who did not cooperate with the survey, and 4 patients deemed unsuitable after a complex condition assessment. Ultimately, 594 participants were included in the study. Participants’ ages ranged from 25 to 95 years, with an average age of 63.37 ± 12.37 years; 461 (77.61%) were male; 349 (58.75%) were ST-segment Elevation Myocardial Infarction (STEMI) patients, and 245 (41.25%) were Non-ST Segment Elevation Myocardial Infarction (NSTEMI) patients. The median decision time for all participants was 3.98 hours, with 367 (61.78%) experiencing a delay in medical decision-making. The median decision time for STEMI patients (1.02 hours) was significantly shorter than that for NSTEMI patients (13.73 hours) (t = 84,580.5, P < 0.001), as shown in Table 1. The incidence of delay in medical decision-making between the testing set (62.26%) and the training set (60.67%) was not statistically significant (χ² = 0.133, P = 0.716), indicating that the model training results were not affected by imbalanced grouping categories. We collected a total of 35 features in this study. Due to missing data for the culprit vessel feature (54.6% > 30%), this feature was excluded during data preprocessing, leaving a total of 34 features included in the study. When comparing the baseline characteristics of the training and testing sets, the results showed that all 33 features, except for the medication taken after onset, were not statistically significantly different between the two sets, as shown in Table 2.
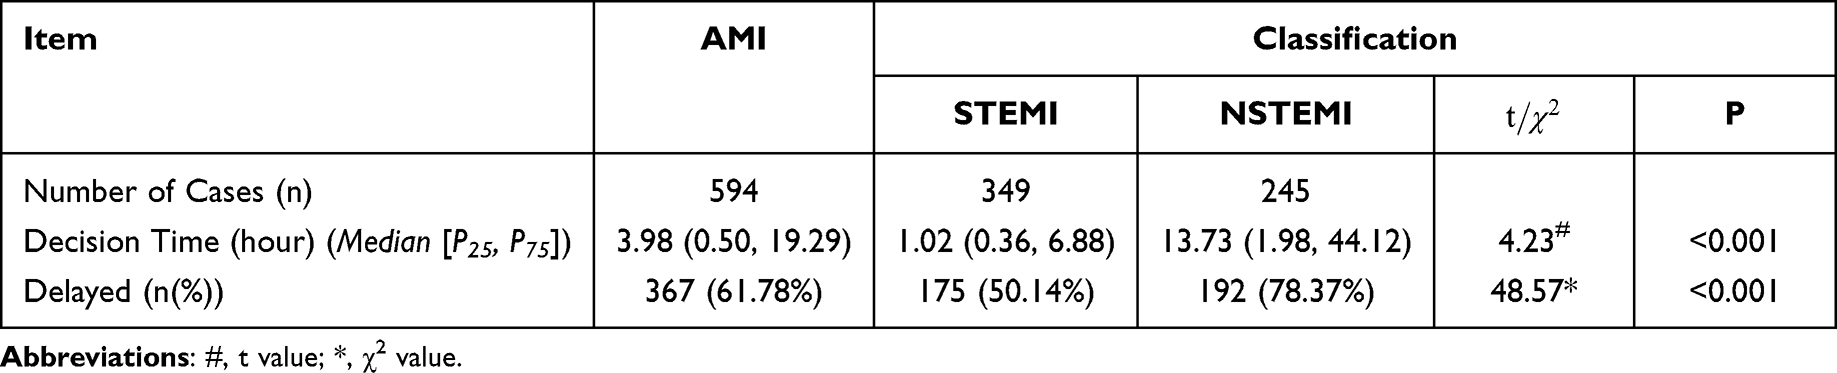 |
Table 1 Current Status of Medical Decision-Making Delays in AMI Patients (n=594) |
 |
Table 2 Comparison of Baseline Characteristics of AMI Patients in the Training and Test Sets (n(%)/( |

Using the Elastic Net algorithm, we identified 19 significant features, as depicted in Figure 1. With the Boruta algorithm, we identified 15 significant features, 17 insignificant features, and 2 features with intermediate importance, as illustrated in Figure 2. By intersecting the results of these two methods, we derived 12 key features, as shown in Figure 3. These key features include age, gender, education level, place of residence, household income, medical insurance status, history of diabetes, history of myocardial infarction, pain severity, type of disease, time of symptom onset, and Killip classification. The coding for categorical variables is detailed in Table 3.
 |
Table 3 Coding Table for Categorical Variables in the Model |
 |
Figure 1 Results of Feature Selection Using the EN Algorithm. |
 |
Figure 2 Results of Feature Selection Using the Boruta Algorithm. |
 |
Figure 3 Intersection of Feature Selection Results from the EN and Boruta Algorithms. |
In the training set, we trained six models: Random Forest, SVM, XGBoost, Decision Tree, Logistic Regression, and Naive Bayes. We evaluated their predictive performance using the test set data. We visualized the confusion matrices for each model’s predictions, as shown in Figure 4. We observed that the Random Forest, XGBoost, Decision Tree, and Naive Bayes models exhibited high True Positive (TP) and True Negative (TN) rates, indicating good performance. Specifically, the Random Forest model had a TP of 90% and a TN of 97%; XGBoost had a TP of 84% and a TN of 85%; Decision Tree had a TP of 81% and a TN of 78%; and Naive Bayes had a TP of 83% and a TN of 76%.
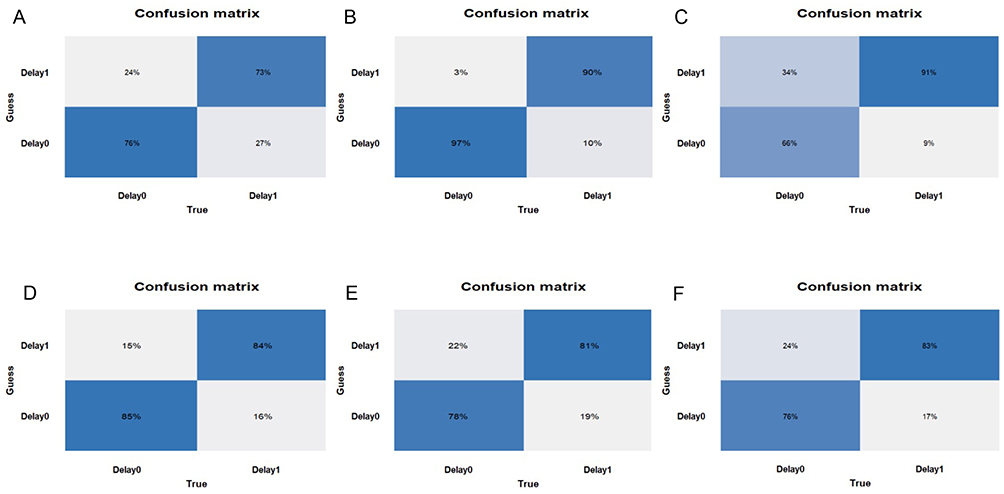 |
Figure 4 Confusion Matrices of the Models on the Test Set.(A) Logistic Regression Mo (B) Random Forest Mo (C) Support Vector Machine Mo (D) XGBoost Mo (E) Decision Tree Mo (F) Naive Bayes Model. |
We plotted the ROC curves for each model on the test set, as depicted in Figure 5. The Random Forest model demonstrated the highest AUC value of 0.91[0.89–0.93], followed by Logistic Regression and XGBoost, both with AUC values of 0.82[0.79–0.85]. We synthesized the predictive evaluation metrics for the six machine learning algorithms, as presented in Table 4. As shown in the table, the accuracy, precision, recall, F1 score, AUC, and specificity of all models were above 0.70, indicating good predictive performance. Notably, the Random Forest and XGBoost models ranked in the top two positions for accuracy, recall, F1 score, negative predictive value, and AUC.
 |
Table 4 Prediction Evaluation of the Models on the Test Set |
 |
Figure 5 ROC Curves of the Models on the Test Set. |
We plotted the DCA curves for each model, as shown in Figure 6. The clinical net benefit of all six risk prediction models was higher than intervening in all patients. The Random Forest model offered the greatest clinical net benefit, with a probability range of approximately 0.04 to 0.90, followed by Logistic Regression and XGBoost. These results suggest that the Random Forest and XGBoost models are particularly effective in predicting the risk of decision-making delay in AMI patients, providing valuable insights for clinical decision-making.
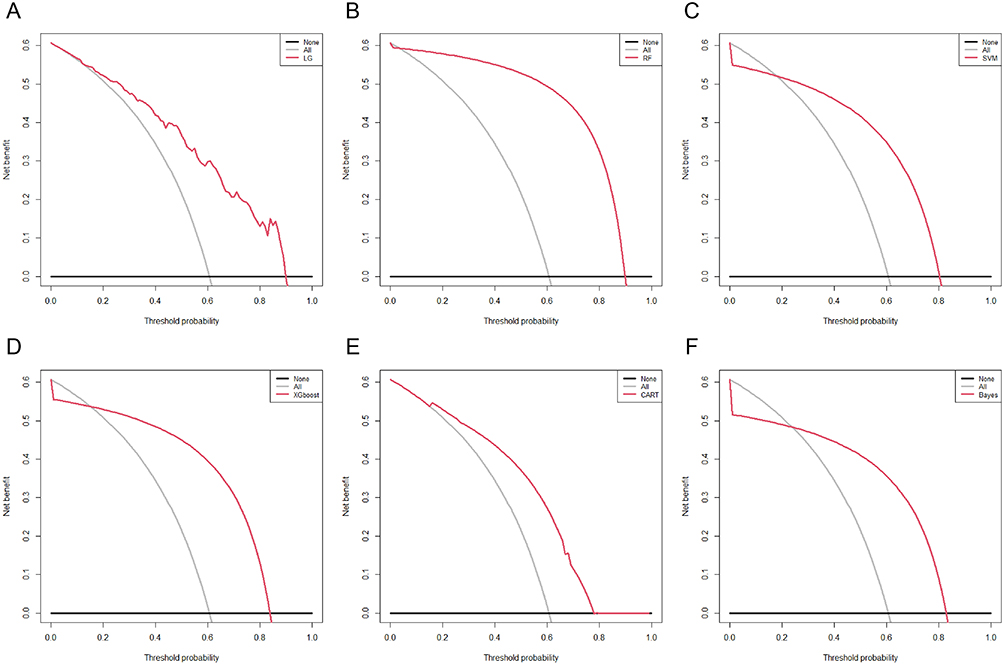 |
Figure 6 DCA Curves of the Models on the Test Set.(A) Logistic Regression Mo (B) Random Forest Mo (C) SVM Mo (D) XGBoost Mo (E) Decision Tree Mo (F) Naive Bayes Model. |
Based on the AUC as the primary model evaluation metric, along with the predictive performance metrics of accuracy, precision, recall, F1 score, and DCA, we ultimately selected the Random Forest model as the optimal prediction model. We observed that the Random Forest model demonstrated superior performance in terms of its ability to discriminate between classes, as well as its overall predictive accuracy and precision. Additionally, the model exhibited a good balance between recall and precision, as indicated by its high F1 score. The DCA further supported the clinical utility of the Random Forest model.
We plotted the calibration curve for the Random Forest model, as shown in Figure 7. The model’s predicted values fluctuated around the ideal value, indicating good agreement between the predicted probabilities and the observed outcomes. This observation, combined with the result of the Hosmer-Lemeshow test (P = 0.245, P > 0.05), suggests that the Random Forest model fits the data well. The Hosmer-Lemeshow test assesses the goodness of fit of a logistic regression model by comparing the observed and predicted probabilities. A P-value greater than 0.05, as obtained in this study, indicates that there is no significant difference between the observed and predicted probabilities, suggesting an adequate fit of the model.
 |
Figure 7 Calibration Curve of the Random Forest Model on the Test Set. |
We integrated the Random Forest model with the SHAP framework to elucidate the contribution of each feature within the model and its impact on the risk of decision-making delay in AMI patients seeking medical care. The SHAP framework is a powerful tool for explaining the output of machine learning models by attributing a value to each feature, representing its contribution to the prediction. We present the global SHAP explanations in Figure 8. As shown in Figure 8A, an increase in pain severity is associated with a decreased risk of decision-making delay in AMI patients. Conversely, the risk of decision-making delay is higher in patients with NSTEMI, first-time myocardial infarction, older age, lower education level, female gender, residence in rural or suburban areas, lower Killip classification, onset of symptoms between 22:00–05:59, history of diabetes, lack of medical insurance, and lower economic status.
 |
Figure 8 Analysis Results of the Random Forest Model Combined with the SHAP Explainability Framework.(A) Global SHAP Explanation; (B) Feature Importance Ranking; (C), (D) Typical Example. |
The importance of input features, ranked by the magnitude of their SHAP values, is depicted in Figure 8B. The primary contributing features, ordered from highest to lowest SHAP values, are as follows: pain severity (0.103), type of disease (0.079), history of myocardial infarction (0.063), age (0.058), education level (0.045), gender (0.035), place of residence (0.034), Killip classification (0.028), time of symptom onset (0.028), history of diabetes (0.024), medical insurance status (0.018), and household income level (0.012). Among these, pain severity, type of disease, and history of myocardial infarction are the three features with the greatest impact on the prediction of decision-making delay risk in AMI patients.
Additionally, we provided a typical example to demonstrate the model’s interpretability, as shown in Figures 8C and D. The SHAP feature dependence plot is presented in Figure 9, illustrating the top ten main contributing features in the model. As depicted in the figure, the SHAP values for Pain and Age exhibit complex nonlinear relationships with the risk of decision-making delay in seeking medical care for AMI patients. Specifically, with an increase in the pain index, the risk of decision-making delay initially rises and then persistently declines. Similarly, with advancing age, the risk of decision-making delay first increases, then decreases, and subsequently continues to rise. These findings suggest that the relationship between certain features and the risk of decision-making delay is not straightforward and may involve multiple interacting factors, highlighting the importance of considering these complex dynamics in clinical decision-making and intervention strategies.
 |
Figure 9 Global and Feature Dependence Diagrams of the Random Forest Model Combined with the SHAP Explainability Framework.The left side of the figure shows the global SHAP explanation; the right side shows the impact of various features in the model on the risk of decision-making delay for AMI patients: (A) Pain; (B) Disease Type; (C) History of Myocardial Infarction; (D) Age; (E) Education Level; (F) Gender; (G) Place of Residence; (H) Killip Classification; (I) Symptom Onset Timing; (J) History of Diabetes. |
Discussion
Decision-making delay in seeking medical care is a critical issue for patients with AMI, as timely treatment is essential for improving outcomes. Over the past two decades, the establishment and development of regional collaborative rescue systems have significantly reduced the time between the first medical contact and reperfusion of the infarct-related artery for AMI patients. However, the time from symptom onset to the first medical contact has not shown similar improvements.29 Approximately 78% of patients with coronary heart disease die outside the hospital due to lack of timely treatment.30 The American Heart Association recommends that AMI patients seek treatment within 1 hour of symptom onset.31 This study found that the median time for AMI patients to make medical decisions was 3.98 hours. Compared with recent international studies, this decision time is significantly longer than what has been reported in developing countries. A study in Dhaka, Bangladesh, showed that the median decision time from symptom onset to deciding to seek medical care was 3.0 hours, while the total pre-hospital delay was 11.5 hours.10 A study in Chongqing, China, further confirmed the significant impact of health literacy on decision delay, finding that AMI patients with inadequate health literacy had a median decision delay of 3 hours, whereas those with adequate health literacy had a significantly shorter decision time.32 It is worth noting that definitions of decision delay vary across studies. This study defines decision time as the interval from symptom recognition to the decision to seek medical care, which is consistent with the definition used in the Bangladesh study. However, the Chinese study adopted a stricter cutoff of 60 minutes for decision delay and found that 62.2% of AMI patients experienced decision delay. Such differences in definitions may partly explain the observed variations in decision times. Despite variations in reported delay times across studies, the consistent theme is the widespread phenomenon of decision-making delay among AMI patients. This delay has significant implications for patient outcomes, as it can lead to increased morbidity and mortality due to prolonged ischemia. The findings underscore the need for targeted interventions to reduce pre-hospital delay and improve patient awareness and response to AMI symptoms.
This achievement directly addresses our primary objective of developing an interpretable, machine-learning-based tool to identify high-risk individuals for decision delay in AMI. Our study successfully developed a risk prediction model for decision-making delays in AMI patients using six machine learning algorithms, with the Random Forest algorithm demonstrating superior predictive performance. This finding underscores the effectiveness of machine learning models in capturing complex interactions and nonlinear associations compared to traditional regression models, potentially reducing prediction performance drift over time.33,34 Our finding that pain severity, disease type, and previous myocardial infarction history are the strongest predictors of decision delay is consistent with existing literature. Granot Met al demonstrated an inverse independent association between chest pain intensity and prehospital delay in STEMI patients.35 Fålun Net al noted that severe chest pain triggered immediate help-seeking, while milder symptoms were underestimated.36 Regarding disease type, Bauer Det al and Hu DQet al reported shorter delays in STEMI than NSTEMI due to more salient symptoms).7,37 Additionally, Hu DQet al identified prior myocardial infarction as an independent predictor of early presentation, as patients with prior myocardial infarction possess greater disease awareness.7 Collectively, these studies validate our results, highlighting that pain severity signals urgency, disease type shapes symptom salience, and previous myocardial infarction history enhances care-seeking promptness—collectively explaining decision delay variability in acute coronary syndrome patients.
Having established that our Random-Forest model ranks pain severity, disease type and prior MI as the top three drivers of decision delay, we next asked whether these gradients remain robust under external shocks and what modifiable levers could narrow the gap. Unexpectedly, real-world evidence indicates that the STEMI-NSTEMI gradient is preserved even when systemic access to care is uniformly constrained. During the COVID-19 surge in Korea, NSTEMI presentations fell 18% more than STEMI presentations, while their symptom-to-door time lengthened from 310min to 512min; consequently, in-hospital cardiac arrest and mortality in NSTEMI rose 3.9- and 7.7-fold, respectively, whereas STEMI outcomes remained unchanged.38 These data corroborate our model’s prediction that disease type acts as an independent throttle on decision speed. Mechanistically, the lower chest-pain salience of NSTEMI widens the “perceived-urgency gap”. In a European cohort of suspected STEMI, every 1-point increase on a 0–10 pain scale shortened EMS activation time by 7%, and a prior MI history shortened it by 18%.39 Similarly, patients experiencing a second MI waited only 90 min before calling for help—half the delay of first-ever MI (180min)—because symptom familiarity dispelled uncertainty.40 Conversely, the fluctuating and milder discomfort typical of NSTEMI prolongs “watchful waiting” by an average of 2.1h compared with STEMI.41 Importantly, these drivers are modifiable. Hong Kong data show that “perceived barriers to care” explain nearly 50% of the variance in delay, whereas higher symptom typicality and congruence with prior experience halve it.6 Embedding our model into pre-hospital triage apps or brief health-literacy interventions could therefore convert its discriminative advantage into faster EMS activation and shorter door-to-balloon times.
In the clinical context, machine learning models often face the challenge of poor interpretability, commonly referred to as the “black box” problem. To address this issue, researchers have developed SHAP, which effectively explains the contribution of each feature within a model and visualizes the decision-making capabilities of the selected model.42,43 SHAP has been widely applied in the interpretation of machine learning models across various fields, including medicine,44–46 reliability engineering,47,48 and production management,49 providing a scientific basis for intervention practices. In this study, we are the first to utilize SHAP values and their visualization in a model predicting the risk of delayed medical decision-making in patients with AMI. The SHAP global explanation graph intuitively demonstrates the impact of model features on the risk of delayed medical decision-making and the importance and ranking of features within the model. The SHAP feature dependence plot effectively illustrates the correlation between the values of each feature variable and the assessment of the risk of delayed medical decision-making. Specifically, pain and age exhibit a complex nonlinear relationship with the risk of delayed medical decision-making in AMI patients. Clinically, this non-linear phenomenon manifests as a paradoxical increase in delay risk at low-to-moderate pain levels, where patients often misattribute symptoms to non-cardiac causes (such as indigestion or musculoskeletal pain) and adopt a “wait-and-see” attitude. In contrast, severe pain more reliably triggers urgent help-seeking behavior because it overrides attribution uncertainty. This behavioral pattern reflects a threshold effect in risk perception, whereby symptoms must exceed a subjective severity ceiling before patients perceive a cardiac emergency. The low-to-moderate pain subgroup represents a high-risk blind spot that routine triage may underestimate. Therefore, targeted patient education should emphasize that low-to-moderate, persistent chest pain requires immediate evaluation rather than observation. Age further modulates this relationship—older adults with higher pain thresholds or multiple comorbidities may underestimate low-to-moderate pain, while younger patients may delay treatment due to competing life pressures. This complexity may also be attributed to differences in pain perception thresholds and accompanying symptoms across individuals,50 as well as variations in life pressures, attention to health, and number of comorbid chronic diseases among different age groups. By presenting each sample’s SHAP risk value, we can guide personalized and proactive management strategies, thereby enabling precision guidance and prevention.45,50,51 To facilitate real-world integration, we propose a phased implementation roadmap: (1) embed the Random Forest model into EMS dispatch software as a risk-alert module; (2) pilot it in 2–3 regional PCI-capable centers with feedback loops for paramedics and emergency physicians; (3) scale to community health apps with patient-facing symptom checkers.
However, several limitations of the present study should be acknowledged when interpreting our findings. First, although we conducted on-site interviews within 48 hours of patient admission, recall bias constitutes an unavoidable potential source of bias, as patients’ memories of events may not be entirely accurate. Second, the study did not collect data on patients who died or were hemodynamically unstable before reaching the hospital, which could impact the analysis and interpretation of the results. Additionally, the retrospective study design inevitably introduced inherent biases, including selection bias and information bias; for instance, some critical clinical variables might have been incompletely recorded in the medical charts, which could have confounded the associations between predictors and delayed medical decision-making in patients with AMI. Moreover, the study population was recruited from a limited geographic area, where demographic characteristics, healthcare-seeking behaviors, and clinical management strategies for AMI were relatively homogeneous. These regional peculiarities may not be representative of populations from other ethnic backgrounds, socioeconomic strata, or healthcare systems with different diagnostic and treatment protocols. Therefore, the external validity of our findings requires further verification in multi-center, cross-regional, and ethnically diverse cohorts. Likewise, future prospective studies with standardized data collection procedures are also warranted to validate the robustness of the proposed risk prediction model and mitigate the limitations of the retrospective design.
Conclusion
This study highlights the critical issue of delayed medical decision-making among patients with AMI. Our findings demonstrate that the Random Forest model, a machine learning-based approach, offers the most accurate and reliable predictions for the risk of delayed medical decision-making in these patients. This model’s effectiveness can be attributed to its ability to capture complex interactions and nonlinear relationships between variables, which are often not adequately addressed by traditional prediction techniques. In the era of artificial intelligence and big data, machine learning emerges as a powerful and reliable alternative to conventional methods for predicting clinical outcomes. The application of machine learning in this context has the potential to significantly improve the early identification of high-risk patients, facilitating timely interventions and enhancing overall patient care. Future research should continue to explore the integration of advanced machine learning algorithms with clinical data to further refine predictive models and optimize decision-making processes in cardiovascular medicine.
Abbreviations
AMI, Acute Myocardial Infarction; AUC, Area Under the Curve; DCA, Decision Curve Analysis; NSTEMI, Non-ST Segment Elevation Myocardial Infarction; ROC, Receiver Operating Characteristic; SHAP, SHapley Additive exPlanations; SOT, symptom onset time; STEMI, ST-segment Elevation Myocardial Infarction; SVM, Support Vector Machine; TN, True Negative; TP, True Positive.
Acknowledgments
We would like to thank all the members of the facilities of the hospitals for their contribution and the study participants who contributed their information.
Funding
This work was supported by the Internal Research Special Project of Shenzhen Hospital (Futian) of Guangzhou University of Chinese Medicine (GZYSY2024025), Innovation and Development Research Project of Guangdong Provincial Nursing Association (GDHLYJYM202426), Project of Hainan Provincial Natural Science Foundation (822MS071), Key Research and Development Project of Hainan Province (ZDYF2022SHFZ306), Research Project on Educational and Teaching Reform in Higher Education Institutions of Hainan Province (HnjgS2022-8), Key Project of the Educational Research Project Approval of Hainan Medical University (HYZD202111), Chronic Disease Management Research Project of the National Center for Health Care Capacity Building and Continuing Education of the National Health Commission of the People’s Republic of China (GWJJMB202510021108).
Disclosure
The authors report no conflicts of interest in this work.
References
1. De Gruyter E, Saunders C, Stavreski B, Jennings G. Impact of reducing pre-hospital delay in response to heart attack symptoms in Australia. Heart Lung Circ. 2019;28(8):1154–18. doi:10.1016/j.hlc.2018.07.018
2. Rasmussen C, Munck A, Kragstrup J, Haghfelt T. Patient delay from onset of chest pain suggesting acute coronary syndrome to hospital admission. Scan Cardiovasc J. 2003;37(4):183–186. doi:10.1080/14017430310014920
3. Wu C, Zhang QY, Li L, et al. Long-term prognosis of different reperfusion strategies for st-segment elevation myocardial infarction in chinese county-level hospitals: insight from china acute myocardial infarction registry. Biomed Environ Sci. 2023;36(9):826–836. doi:10.3967/bes2023.110
4. Hromadka M, Motovska Z, Hlinomaz O, et al. The relationship between symptom onset-to-needle time and ischemic outcomes in patients with acute myocardial infarction treated with primary PCI. J Cardiol. 2022;79(5):626–633. doi:10.1016/j.jjcc.2021.11.015
5. Yang Y, Zhang Y, Ren L. Prognosis analysis of delayed call time for chest pain in patients with acute st-segment elevation myocardial infarction undergoing direct percutaneous coronary intervention. Clin Appl Thromb Hemost. 2023;29:10760296231186811. doi:10.1177/10760296231186811
6. Li PW, Yu DS. Predictors of pre-hospital delay in Hong Kong Chinese patients with acute myocardial infarction. Eur J Cardiovasc Nurs. 2018;17(1):75–84. doi:10.1177/1474515117718914
7. Hu DQ, Hao YC, Liu J, et al. Pre-hospital delay in patients with acute myocardial infarction in China: findings from the Improving Care for Cardiovascular Disease in China-Acute Coronary Syndrome (CCC-ACS) project. J Geriatric Cardiol. 2022;19(4):276–283. doi:10.11909/j.issn.1671-5411.2022.04.005
8. PWC L, Dsf Y. Testing a model to reveal the predictive mechanism of care-seeking decisions among patients with acute myocardial infarction. J Cardiovasc Nurs. 2017;32(4):393–400. doi:10.1097/JCN.0000000000000355
9. Jin JF, Yang HF, Guo ZT, XB LV, Jiang XJ, Ding C. Relationships of illness perception, symptoms response and social support with acute myocardial infarction patients’ prehospital delay in rural China: protocol for a cross-sectional study. BMJ Open. 2023;13(7):e073010. doi:10.1136/bmjopen-2023-073010
10. Chowdhury IZ, Amin MN, Chowdhury MZ, Rahman SM, Ahmed M, Cader FA. Pre hospital delay and its associated factors in acute myocardial infarction in a developing country. PLoS One. 2021;16(11):e0259979. doi:10.1371/journal.pone.0259979
11. Fletcher RR, Nakeshimana A, Fairness OOA. Bias, and appropriate use of artificial intelligence and machine learning in global health. Front Artif Intell. 2020;3:561802. doi:10.3389/frai.2020.561802
12. Guerreiro J, Garriga R, Lozano Bagén T, Sharma B, Karnik NS, Matić A. Transatlantic transferability and replicability of machine-learning algorithms to predict mental health crises. Npj Digit Med. 2024;7(1):227. doi:10.1038/s41746-024-01203-8
13. Milićević B, Milošević M, Simić V, et al. Machine learning and physical based modeling for cardiac hypertrophy. Heliyon. 2023;9(6):e16724. doi:10.1016/j.heliyon.2023.e16724
14. Liu RQ, Wu SN, Yu HY, et al. Prediction model for hepatocellular carcinoma recurrence after hepatectomy: machine learning-based development and interpretation study. Heliyon. 2023;9(11):e22458. doi:10.1016/j.heliyon.2023.e22458
15. Stubberud A, Ingvaldsen SH, Brenner E, et al. Forecasting migraine with machine learning based on mobile phone diary and wearable data. Cephalalgia. 2023;43(5):033310242311692. doi:10.1177/03331024231169244
16. AI LAT. Machine Learning, and ChatGPT in Hypertension. Hypertension. 2024;81(4):709–716. doi:10.1161/HYPERTENSIONAHA.124.19468
17. Srinivasan S, Gunasekaran S, Mathivanan SK, Bam MB, Jayagopal P, Dalu GT. An active learning machine technique based prediction of cardiovascular heart disease from UCI-repository database. Sci Rep. 2023;13(1):13588. doi:10.1038/s41598-023-40717-1
18. Raparelli V, Romiti GF, Di Teodoro G, et al. A machine-learning based bio-psycho-social model for the prediction of non-obstructive and obstructive coronary artery disease. Clin Res Cardiol. 2023;112(9):1263–1277. doi:10.1007/s00392-023-02193-5
19. Riley RD, Ensor J, Snell KIE, et al. Calculating the sample size required for developing a clinical prediction model. BMJ. 2020:
20. Thygesen K, Alpert JS, Jaffe AS, et al. Fourth universal definition of myocardial infarction. J Am Coll Cardio. 2018;72(18):2231–2264. doi:10.1016/j.jacc.2018.08.1038
21. Li P. A meta-analysis of the influencing factors of pre-hospital delay in patients with acute myocardial infarction. dissertation. Huzhou Normal University; 2019.
22. Zhou JYN, Hu Y, Li LR, Zhang QY, Wang XJ. A systematic review of the influencing factors of medical decision-making delay in patients with acute myocardial infarction. Evidence-Based Nurs. 2020;6(9):878–883.
23. Arrebola-Moreno M, Petrova D, Garcia-Retamero R, et al. Psychological and cognitive factors related to prehospital delay in acute coronary syndrome: a systematic review. Int. J. Nurs. Stud. 2020;108:103613. doi:10.1016/j.ijnurstu.2020.103613
24. Wechkunanukul K, Grantham H, Clark RA. Global review of delay time in seeking medical care for chest pain: an integrative literature review. Aust Crit Care. 2017;30(1):13–20. doi:10.1016/j.aucc.2016.04.002
25. Jiang QJ. perceived social support scale (PSSS). in handbook of mental health assessment scales. China Mental Health J Press.
26. Cao X, Cao Y, Salamonson Y, et al. Translation and validation of the Chinese version of the Acute Coronary Syndrome Response Index (C-ACSRI). Int. J. Nurs. Stud. 2012;49(10):1277–1290. doi:10.1016/j.ijnurstu.2012.04.008
27. Patient Health Questionnaire (PHQ) Screeners. https://www.phqscreeners.com/index.html. Available from:
28. Luo W, Phung D, Tran T, et al. Guidelines for developing and reporting machine learning predictive models in biomedical research: a multidisciplinary view. J Med Internet Res. 2016;18(12):e323. doi:10.2196/jmir.5870
29. Granger CB, Bates ER, Jollis JG, et al. Improving Care of STEMI in the United States 2008 to 2012. JAHA. 2019;8(1):e008096. doi:10.1161/JAHA.118.008096
30. Tsao CW, Aday AW, Almarzooq ZI, et al. Heart disease and stroke statistics—2022 update: a report from the American Heart Association. Circulation. 2022;145(8):e153–e639. doi:10.1161/CIR.0000000000001052
31. Moser DK, Kimble LP, Alberts MJ, et al. Reducing delay in seeking treatment by patients with acute coronary syndrome and stroke. J Cardiovasc Nurs. 2007;22(4):326–343. doi:10.1097/01.JCN.0000278963.28619.4a
32. Fan ZY, Yang Y, Yin RY, Tang L, Zhang F. Effect of health literacy on decision delay in patients with acute myocardial infarction. Front Cardiovasc Med. 2021;8:754321. doi:10.3389/fcvm.2021.754321
33. Davis SE, Lasko TA, Chen G, Siew ED, Matheny ME. Calibration drift in regression and machine learning models for acute kidney injury. J Am Med Inf Assoc. 2017;24(6):1052–1061. doi:10.1093/jamia/ocx030
34. Davis SE, Greevy RA, Fonnesbeck C, Lasko TA, Walsh CG, Matheny ME. A nonparametric updating method to correct clinical prediction model drift. J Am Med Inf Assoc. 2019;26(12):1448–1457. doi:10.1093/jamia/ocz127
35. Granot M, Dagul P, Darawsha W, Aronson D. Pain modulation efficiency delays seeking medical help in patients with acute myocardial infarction. Pain. 2015;156(1):192–198. doi:10.1016/j.pain.0000000000000020
36. Fålun N, Langørgen J, Fridlund B, Pettersen T, Rotevatn S, Norekvål TM. Patients’ reflections on prehospital symptom recognition and timely treatment of myocardial infarction. Eur J Cardiovasc Nurs. 2021;20(6):526–533. doi:10.1093/eurjcn/zvaa035
37. Bauer D, Neuberg M, Nováčková M, Kočka V, Toušek P. Pre-hospital delay, clinical characteristics, angiographic findings, and in-hospital mortality in young and middle-aged adults with acute coronary syndrome: a single-centre registry analysis. Eur Heart J Suppl. 2023;25(Supplement_E):E33–E39. doi:10.1093/eurheartjsupp/suad102
38. Choi H, Lee JH, Park HK, et al. Impact of the COVID-19 pandemic on patient delay and clinical outcomes for patients with acute myocardial infarction. J Korean Med Sci. 2022;37(21):e167. doi:10.3346/jkms.2022.37.e167
39. Alrawashdeh A, Nehme Z, Williams B, et al. Factors influencing patient decision delay in activation of emergency medical services for suspected ST-elevation myocardial infarction. Eur J Cardiovasc Nurs. 2021;20(3):243–251. doi:10.1177/1474515120953737
40. Strömbäck U, Engström Å, Lundqvist R, Lundblad D, Vikman I. The second myocardial infarction: is there any difference in symptoms and prehospital delay compared to the first myocardial infarction? Eur J Cardiovasc Nurs. 2018;17(7):652–659. doi:10.1177/1474515118777391
41. Peng YG, Feng JJ, Guo LF, et al. Factors associated with prehospital delay in patients with ST-segment elevation acute myocardial infarction in China. Am J Emerg Med. 2014;32(4):349–355. doi:10.1016/j.ajem.2013.12.053
42. Li X, Zhao Y, Zhang D, et al. Development of an interpretable machine learning model associated with heavy metals’ exposure to identify coronary heart disease among US adults via SHAP: findings of the US NHANES from 2003 to 2018. Chemosphere. 2023;311(Pt 1):137039. doi:10.1016/j.chemosphere.2022.137039
43. Ponce‐Bobadilla AV, Schmitt V, Maier CS, Mensing S, Stodtmann S. Practical guide to SHAP analysis: explaining supervised machine learning model predictions in drug development. Clin Transl Sci. 2024;17(11):e70056. doi:10.1111/cts.70056
44. Alabi RO, Elmusrati M, Leivo I, Almangush A, Mäkitie AA. Machine learning explainability in nasopharyngeal cancer survival using LIME and SHAP. Sci Rep. 2023;13(1):8984. doi:10.1038/s41598-023-35795-0
45. Lin W, Shi S, Lan H, et al. Identification of influence factors in overweight population through an interpretable risk model based on machine learning: a large retrospective cohort. Endocrine. 2023;83(3):604–614. doi:10.1007/s12020-023-03536-y
46. Abdulsalam G, Meshoul S, Shaiba H. Explainable heart disease prediction using ensemble-quantum machine learning approach. Intell Autom Soft Comput. 2023;36(1):761–779. doi:10.32604/iasc.2023.032262
47. Palar PS, Zuhal LR, Shimoyama K. Global sensitivity analysis in aerodynamic design using Shapley effects and polynomial chaos regression. IEEE Access. 2023;11:114825–114839. doi:10.1109/ACCESS.2023.3324918
48. Tahmassebi A, Motamedi M, Alavi AH, Gandomi AH. An explainable prediction framework for engineering problems: case studies in reinforced concrete members modeling. EC. 2022;39(2):609–626. doi:10.1108/EC-02-2021-0096
49. Goli A, Mohammadi H. Developing a sustainable operational management system using hybrid Shapley value and Multimoora method: case study petrochemical supply chain. Environ Dev Sustain. 2022;24(9):10540–10569. doi:10.1007/s10668-021-01844-9
50. Bernard D, Doumard E, Ader I, et al. Explainable machine learning framework to predict personalized physiological aging. Aging Cell. 2023;22(8):e13872. doi:10.1111/acel.13872
51. Miranda E, Adiarto S, Bhatti FM, Zakiyyah AY, Aryuni M, Bernando C. Understanding arteriosclerotic heart disease patients using electronic health records: a machine learning and Shapley additive explanations approach. Healthc Inform Res. 2023;29(3):228–238. doi:10.4258/hir.2023.29.3.228
 © 2026 The Author(s). This work is published and licensed by Dove Medical Press Limited. The
full terms of this license are available at https://www.dovepress.com/terms
and incorporate the Creative Commons Attribution
- Non Commercial (unported, 4.0) License.
By accessing the work you hereby accept the Terms. Non-commercial uses of the work are permitted
without any further permission from Dove Medical Press Limited, provided the work is properly
attributed. For permission for commercial use of this work, please see paragraphs 4.2 and 5 of our Terms.
© 2026 The Author(s). This work is published and licensed by Dove Medical Press Limited. The
full terms of this license are available at https://www.dovepress.com/terms
and incorporate the Creative Commons Attribution
- Non Commercial (unported, 4.0) License.
By accessing the work you hereby accept the Terms. Non-commercial uses of the work are permitted
without any further permission from Dove Medical Press Limited, provided the work is properly
attributed. For permission for commercial use of this work, please see paragraphs 4.2 and 5 of our Terms.
Recommended articles
Prediction of Acute Kidney Injury in Intracerebral Hemorrhage Patients Using Machine Learning
She S, Shen Y, Luo K, Zhang X, Luo C
Neuropsychiatric Disease and Treatment 2023, 19:2765-2773
Published Date: 11 December 2023
A Machine-Learning Model Based on Clinical Features for the Prediction of Severe Dysphagia After Ischemic Stroke
Ye F, Cheng LL, Li WM, Guo Y, Fan XF
International Journal of General Medicine 2024, 17:5623-5631
Published Date: 28 November 2024
Development and Validation of a Neonatal Hypothermia Prediction Model for In-Hospital Transport Using Machine Learning Algorithms: A Single-Center Retrospective Study
Zhang W, Gu X, Gu C, Yao L, Zhang Y, Wang K
Journal of Multidisciplinary Healthcare 2025, 18:3205-3217
Published Date: 4 June 2025
Using Machine Learning and the HAMD-24 Scale to Predict Suicide Ideation in Depressed Patients
Chen Y, Jiang ZY, Dong GZ, Zhang WY, Wang K, Yang HY
Psychology Research and Behavior Management 2025, 18:2153-2165
Published Date: 12 October 2025
Predictions of Small Intracranial Aneurysms’ Rupture Risk with Ensemble Machine Learning Model (Super Learner): A Retrospective Study in Two Tertiary Hospitals in China
Hu X, Ye S, Qi D, Li S, Tang X, Fang Y
International Journal of General Medicine 2025, 18:6637-6649
Published Date: 3 November 2025