
Back to Journals » Journal of Hepatocellular Carcinoma » Volume 12
Construction of 3D Enhanced CT Radiomics-Based Model to Predict Circadian Gene Expression and Prognosis in Hepatocellular Carcinoma
Authors Zhao J  , Zhou H , Wang C , Zhang W, Pang Y , Zheng H, Zhang L, Zhou J, Hu Z
Received 19 June 2025
Accepted for publication 6 December 2025
Published 25 December 2025 Volume 2025:12 Pages 2989—3009
DOI https://doi.org/10.2147/JHC.S545482
Checked for plagiarism Yes
Review by Single anonymous peer review
Peer reviewer comments 2
Editor who approved publication: Dr David Gerber
Jiaxin Zhao,1,* Huiying Zhou,1,* Cheng Wang,1 Wenluo Zhang,1 Yujiang Pang,1 Huilin Zheng,2 Lei Zhang,2 Jie Zhou,3 Zhenhua Hu1,3,4
1Department of Hepatobiliary and Pancreatic Surgery, Department of Surgery, the Fourth Affiliated Hospital of School of Medicine, and International School of Medicine, Zhejiang University, Yiwu, Zhejiang, People’s Republic of China; 2Zhejiang Provincial Collaborative Innovation Center of Agricultural Biological Resource Biochemical Manufacturing, School of Biological and Chemical Engineering, Zhejiang University of Science and Technology, Hangzhou, Zhejiang, People’s Republic of China; 3Department of Hepatobiliary and Pancreatic Surgery, Department of Surgery, First Affiliated Hospital, School of Medicine, Zhejiang University, Hangzhou, Zhejiang, People’s Republic of China; 4Zhejiang Key Laboratory of Biomedical Intelligent Computing Technology, Hangzhou, Zhejiang, People’s Republic of China
*These authors contributed equally to this work
Correspondence: Zhenhua Hu, Department of Hepatobiliary and Pancreatic Surgery, Department of Surgery, the Fourth Affiliated Hospital of School of Medicine, and International School of Medicine, Zhejiang University, Yiwu, Zhejiang, People’s Republic of China, Tel/Fax +86-570-89935878, Email [email protected] Jie Zhou, Department of Hepatobiliary and Pancreatic Surgery, Department of Surgery, First Affiliated Hospital, School of Medicine, Zhejiang University, Hangzhou, Zhejiang, People’s Republic of China, Tel +86-13429661721, Email [email protected]
Purpose: Circadian disruption contributes to hepatocellular carcinoma (HCC) progression. This study aimed to develop a CT-based radiomics model to non-invasively predict circadian rhythm (CR) gene expression profiles for improved prognostic assessment.
Methods: Mendelian randomization (MR) analysis revealed a significant causal association between CR disorders and the risk of HCC. In Cohort 1 (TCGA database, n = 424), 32 CR-related genes were identified from an initial set of 71 genes. Univariate Cox regression analysis identified 18 prognosis-related genes, and a risk model containing 8 genes was constructed using LASSO and multivariate Cox regression. This model was then validated in Cohort 2 (ICGC database, n = 232). The gene CRTC2 was further validated in vitro. Radiomics features were constructed based on enhanced CT images from Cohort 3 (TCIA database, n = 45) to predict CR risk genes, and the prognostic value of the model was validated in Cohort 4 (The Fourth Affiliated Hospital of Zhejiang University School of Medicine, n = 38).
Results: The CR risk gene model stratified patients into high- and low-risk groups with significantly different survival outcomes in both TCGA and ICGC cohorts (TCGA: P < 0.001; ICGC: P = 0.029). The risk score was independently associated with overall survival (HR = 3.582, 95% CI: 2.101– 6.107, P < 0.001). Experimental results confirmed that knockdown of CRTC2 significantly inhibited HCC cell proliferation, migration, invasion, and induced apoptosis. The radiomics model achieved an AUC of 0.931 in the training set and 0.760 in the validation set for predicting CR gene expression. Importantly, in the clinical validation cohort, patients with low radiomics scores had significantly longer survival (P = 0.039).
Conclusion: Circadian rhythm-related gene expression, implicated in HCC development, can be non-invasively predicted via CT-based radiomics. The proposed model offers promise for prognostic stratification and personalized treatment planning in HCC.
Keywords: circadian rhythm, hepatocellular carcinoma, mendelian randomization, radiomics, LASSO, survival
Introduction
Liver cancer ranks among the top three causes of cancer-related deaths in 46 countries and among the top five in 90 countries. As the global population continues to grow, both incidence and mortality from liver cancer are expected to increase significantly over the next two decades.1 HCC is the predominant form of liver cancer and is associated with a multitude of risk factors. These include viral infections, metabolic syndrome, obesity, exposure to aflatoxin, and genetic predisposition.2 Early clinical symptoms of HCC are atypical and are usually screened for by liver ultrasound in combination with alpha-fetoprotein (AFP). Enhanced Computed tomography (CT) of the abdomen is more sensitive in identifying HCC than ultrasound.3,4 Despite notable advancements in the diagnosis and treatment of HCC, the five-year survival rate for a significant number of patients with this form of liver cancer is still deemed insufficient. Due to the high variability in the prognosis of individual patients with HCC, there is an urgent need for more accurate prognostic assessment of patients based on disease risk to facilitate individualized tumor therapy.
CRs are inherent biological oscillations that synchronize the physiological functions of organisms with the Earth’s 24-hour light-dark cycle. These rhythms influence a wide range of processes, including sleeping patterns, eating behaviors, and the secretion of important biochemical markers and hormones such as cortisol and melatonin.5 Malignant tumors are characterized by uncontrolled and disordered cell proliferation, which is a key hallmark of tumorigenesis. Circadian genes play an important role in regulating neuroendocrine signaling, immune modulation, and cell cycle regulation, particularly in the context of cell proliferation and apoptosis.6 CR sleep-wake disorders are a subcategory of CR disorders, which are caused by the misalignment of the sleep-wake cycle with the body’s 24h biorhythms. It has been found that CR sleep-wake disorder due to shift work may increase the risk of malignant tumors.7
To robustly investigate the potential causal link between circadian rhythm disruption and HCC risk, this study employs MR analysis. MR utilizes genetic variants as instrumental variables for an exposure to strengthen causal inference and minimize confounding and reverse causation biases inherent in observational studies.8 For this analysis, we selected two well-defined, heritable, and commonly reported proxies for circadian sleep-wake disturbances: insomnia and daytime napping. Insomnia represents a state of hyperarousal and misaligned sleep propensity, while excessive daytime napping often reflects compromised nighttime sleep quality or an underlying circadian rhythm disorder.9–11 Their widespread assessment in large genome-wide association studies (GWAS) provides the necessary genetic instruments for a powerful MR analysis, allowing us to test the hypothesis that genetically predisposed circadian disruption influences HCC susceptibility.
According to a recent study, irregular sleep patterns can have a negative impact on the development of liver cancer. Insufficient sleep can weaken the body’s metabolism and immune functions, which in turn creates a favorable environment for tumor growth. Conversely, excessive sleep has been linked to increased risk factors for liver cancer, such as metabolic disorders and chronic inflammation.12 Therefore, the development of a scoring model to evaluate the potential presence of CR risk genes in tumors could be valuable as biomarkers for predicting survival in patients with HCC.
By analyzing the expression profiles of CR risk genes in biopsy specimens, it is possible to directly assess gene expression in tumor tissues. However, this approach has notable limitations, including its invasive nature and high cost. As a promising non-invasive alternative, radiomics leverages quantitative features derived from medical imaging.13,14 Among various imaging modalities, contrast-enhanced CT remains the cornerstone for diagnosing, staging, and monitoring HCC in clinical practice globally. In this study, we focus specifically on 3D radiomic features from enhanced CT, which offers a superior balance of wide availability, standardization, and cost-effectiveness compared to MRI or PET-CT. While MRI provides excellent soft-tissue characterization, it is less universally available, more expensive, and involves longer acquisition times, limiting its utility for serial assessments.15,16 PET-CT, though valuable in metastatic workup, is associated with higher radiation exposure and cost, and is not primarily used for HCC characterization.17 Therefore, CT-based radiomics provides a widely accessible and practical platform for developing non-invasive biomarkers. Radiomic features have shown promise in assessing and predicting the prognosis of HCC patients. Notably, radiomics can decode subtle phenotypic patterns, such as intra-tumoral heterogeneity and necrosis, which are invisible to the human eye. The presence of necrosis, a critical radiological feature, is often quantified by radiomics and serves as a strong indicator of aggressive tumor biology.18–20 As precision therapeutic approaches become increasingly prevalent in HCC treatment, there is an urgent need to further explore the role of CT radiomics in prognostic prediction and treatment response evaluation.21,22 Several studies have demonstrated strong correlations between specific radiological features and corresponding gene expression profiles, suggesting exciting possibilities for developing complementary non-invasive methods for detecting circadian genes.23,24
Building upon the causal insights from MR and the established biological plausibility, the next logical step is to translate this knowledge into clinically applicable tools. A direct approach involves identifying a gene expression signature of circadian rhythm disruption within HCC tumors that is linked to patient prognosis. Furthermore, given the limitations of invasive biopsies, developing a non-invasive method to evaluate this circadian risk would be of significant clinical value. While previous radiomics studies have developed prognostic models for HCC, they have largely been agnostic to specific underlying biological pathways. Our study aims to fill this critical gap by moving beyond a “black box” prediction. We propose a biology-informed radiomics approach, where the model is explicitly designed to predict a circadian rhythm-related gene expression signature. This strategy not only provides a non-invasive tool for assessing circadian disruption in HCC but also offers a plausible biological interpretation for the radiomic patterns identified, thereby enhancing the clinical translatability and mechanistic insight of our findings.
The present study aimed to achieve three primary objectives. Firstly, to identify a model of CR-associated risk genes that correlates with patient prognosis. Secondly, to acquire enhanced CT radiological features associated with CR risk genes. Lastly, to develop a novel radiomics model for predicting the expression of CR risk genes.
Materials and Methods
Data Access and Data Normalization
GWAS data for insomnia and daytime napping were obtained from the MRC-IEU database, while data for liver and bile duct cancer were obtained from the UK Biobank database (https://opengwas.io/). The collected data is presented in Table 1. To identify SNPs that are strongly associated with sleep traits, we applied statistical significance thresholds (p < 5×10⁻⁸) and considered linkage disequilibrium (LD) with an r2<0.001 and an LD distance>1 ×10⁴ kb. The F statistic was used to assess the strength of the relationship between a SNP and a sleep trait. SNPs with an F>10 are typically considered to be strongly associated with sleep traits.8
 |
Table 1 Details of the GWASs Analyzed in the Present MR Analyses |
We analyzed gene expression in normal and tumor samples using HCC RNA-Seq data from the TCGA database (https://portal.gdc.cancer.gov). Additionally, we obtained gene expression and clinical data from the ICGC database (https://dcc.icgc.org), consisting of 231 samples. To address potential batch effects and ensure data comparability, we performed batch normalization using the “sva” package in R software (version 4.1.2). This step minimized technical variations, allowing us to focus on the biological variations of interest and enhance the reliability of our analyses.
In addition to obtaining enhanced CT and transcriptome data from 45 patients in the TCIA database (https://www.cancerimagingarchive.net), we divided them into a training group of 35 patients and a validation group of 10 patients in an 8:2 ratio. Moreover, we utilized enhanced CT data from 38 HCC patients who underwent radical resection at the Fourth Hospital Affiliated to Zhejiang University School of Medicine in Yiwu, China, from January 2020 to January 2023. Inclusion criteria were: (1) Age ≥18 years; (2) Patients undergoing surgery; (3) Standard enhanced CT results within 2 weeks before treatment; (4) HCC diagnosis based on histology and immunohistochemistry; (5) Available prognostic information. Exclusion criteria included: (1) Other malignancies besides liver cancer; (2) Prior liver cancer resection; (3) Secondary liver cancer. This data was used to evaluate the performance of our radiomics model in predicting the prognosis of HCC patients.
Mendelian Randomization Study Design
In this study, we investigated the relationship between insomnia, nap during the day, and the risk of liver and bile duct cancer. We used SNPs that were significantly associated with insomnia and nap during the day as instrumental variables (IVs), and liver and bile duct cancer as the outcome variable. To ensure the validity of our causal analysis, we first excluded outliers from the dataset. Then, we conducted two-sample Mendelian randomization (MR) analysis, which involved testing for heterogeneity and multiple validity. We also performed tests to assess the reliability of our results.
The use of IVs in MR studies relies on three core assumptions: (1) IVs should be highly correlated with the exposure factors (insomnia and nap during the day), (2) IVs should only affect the outcome through the exposure factors and not directly, and (3) IVs should not be related to confounders of the association between the exposure and outcome.
Estimating causal effects: We primarily employed the inverse variance weighting (IVW) method,25 complemented by MR-Egger regression, weighted multinomial (WM), and weighted median (WME) methods.26 These methods involve clustering SNPs into subsets based on the similarity of causal effects and estimating the causal effect of the subset with the largest number of SNPs. To assess heterogeneity, we performed Cochran Q and Rücker Q tests using IVW and MR-Egger methods.27
Multiplicity testing: We performed multiplicity testing using the intercept term of MR-Egger regression.
Sensitivity analysis: We used the leave-one-out cross validation.28 This involved calculating the results after sequentially removing individual SNPs to evaluate their influence on the overall results. If removing a specific SNP leads to substantial changes in the results, it indicates that the SNP has a significant impact.
Weak IVs analysis: We assessed the potential bias by calculating the F-values of individual SNPs.
All of the above methods were implemented through the Two SampleMR package of the R4.2.1 software with a test level of α = 0.05.
Identification of Genes Related to CR
We obtained CR genes from the GSEA database (https://www.gsea-msigdb.org/gsea/index.jsp) and performed differential expression analysis using the “DESeq2” package on 50 normal samples and 374 tumor samples. We identified 32 statistically significant differentially expressed genes (P < 0.05, |logFC| ≥ 0.585) and generated volcano plots and heat maps using “ComplexHeatmap” and “ggplot2” packages. Additionally, we explored potential PPIs among the CR genes using the STRING database, with a minimum required interaction score of 0.4 to ensure reliability. We analyzed alterations of selected genes in liver cancer data using cBioPortal.
Identification of Prognosis-Related Genes
We performed a univariate Cox regression analysis utilizing the “survival” package to evaluate the significance of the relationship between CR gene expression levels and overall survival (OS) in HCC patients. A screening threshold of p < 0.05 was utilized. Subsequently, we employed lasso Cox regression to account for gene covariance and reduce the number of modeled genes, enabling the identification of a subset of CR genes strongly associated with OS in LIHC patients. Lastly, we conducted a multivariate Cox regression analysis based on the results obtained from the univariate Cox regression.
Construction and Validation of a Prognostic Model Based on CR-Related Genes
We calculated the risk score using centralized and standardized mRNA expression data from the train set for LIHC. Patients were categorized into two groups based on their median risk score. Correlation heat maps and risk heat maps were generated using the “Psych” and “pheatmap” packages in R to explore variable relationships. Kaplan-Meier (K-M) curves were used to assess the impact of the risk models on liver cancer patients’ prognosis. Receiver operating characteristic (ROC) curves evaluated the predictive value of the risk models. Principal component analysis (PCA) was conducted to validate the risk model. Univariate Cox and multivariate Cox analyses determined the independent prognostic value of the risk model.
Gene Set Enrichment Analysis
We conducted a study on the comprehensive functional annotation of differentially expressed genes involved in CR. Through the use of Gene Ontology (GO) analysis, we were able to categorize these genes based on their functional attributes in three main domains: Biological Processes (BP), Molecular Functions (MF), and Cellular Components (CC).
CT Image Segmentation and Radiomics Feature Extraction
To extract image features, we obtained CT images during the arterial phase. The ITK-SNAP software (v4.0) from www.itksnap.org was used to delineate the regions of interest (ROIs). We then manually segmented the entire tumor on each axial slice. For standardization, the voxel spacing of the CT images was resampled to 1 × 1×1 mm3. To reduce noise and normalize intensities, voxel intensity values were discretized using a fixed bin width of 25 Hounsfield units (HU). Additionally, wavelet filtering was applied to all CT series.
Subsequently, we extracted 120 radiomics features from each ROI using the Pyradiomics Python package (version 3.0). These radiomic features encompassed eight types:
1.First Order Statistics
2.Shape-based (3D)
3.Shape-based (2D)
4.Gray Level Co-occurrence Matrix
5.Gray Level Run Length Matrix
6.Gray Level Size Zone Matrix
7.Neighbouring Gray Tone Difference Matrix
8.Gray Level Dependence Matrix
By extracting these features, our aim is to capture the various characteristics and textural properties of the tumor for further analysis and study.
Feature Selection and Radiomics Model Calculation
Prior to further analysis, we performed a standardization process on all the extracted image features using z-scores to eliminate differences in value scales. For feature selection, we conducted Spearman’s rank correlation analysis and identified features with correlation coefficient values higher than 0.9 as redundant, which were subsequently filtered out. To determine the features with the highest predictive value for the radiomics model, we employed LASSO regression. The penalty parameter tuning was carried out through 10-fold cross-validation. In the training cohort, we constructed the radiomics signature by linearly combining the selected features, weighted by their corresponding coefficients.
Cell Culture
We used the human HCC cell lines MAHLAVU. This cell line was obtained from Pricella (ID: PC-H2022082420, Procell, USA). The cells were cultured in DMEM medium (Gibco, USA) supplemented with 10% fetal bovine serum (Procell, USA) and 1% penicillin-streptomycin solution (containing 10,000 units/mL of penicillin and 10 mg/mL of streptomycin provided by VivaCell). Cell cultures were maintained at 37°C with 5% CO2 in a humidified atmosphere.
Cell Transfection
2.0×10⁵ cells per well were seeded in 6-well plates and incubated for 24 hours until reaching 70% confluency. The complete medium was then replaced with serum-free DMEM, and transfection was conducted using the lipo3000 transfection kit method. For the transfection control, si-NC was used, while si-CRTC2 was employed for the experimental groups. The specific interference sequences of siRNA used were as follows:
si-CRTC2-1: 5’-GCCCUUCAUACAAGUGUGATT-3’.
si-CRTC2-2: 5’-UCACACUUGUAUGAAGGGCTT-3’.
We also used si-NC for transfection control.
Western Blot
To illustrate the knockdown effect of CRTC2 at the protein level and to validate the effect of knockdown on Epithelial-Mesenchymal Transition (EMT) markers, we established the NC group and Si group. The cells were lysed using a mixture of RIPA buffer (Beyotime, China) and PMSF (EpiZyme, China) at a ratio of 100:1. After incubating the lysates on ice for 5 minutes, the cells were scraped off using a cell scraper. The protein samples were diluted with loading buffer (Beyotime, China) and denatured by heating at 95°C for 15 minutes, followed by rapid cooling on ice. The proteins were then separated by SDS-PAGE electrophoresis and transferred onto a PVDF membrane. After sealing the membrane for 3 hours, it was incubated overnight at 4°C with primary antibodies (Proteintech, China). Finally, the membrane was incubated with a secondary antibody (Proteintech, China) for 2 hours to detect and identify the protein bands. This approach provided insights into the potential regulatory roles of CRTC2 in cellular protein expression.
CCK8 Assay and Colony Formation Assay
To investigate the impact of gene regulation on cell proliferation, CCK-8 experiments were performed on MAHLAVU cells. The experiments consisted of two groups: NC and Si. MAHLAVU cells were seeded in 96-well plates at a density of 3000 cells per well, with three replicates per group. At 0 h, 24 h, 48 h, and 72 h, Beyotime’s CCK-8 reagent (10 μL) was added to each well and incubated for two hours at 37 °C. Cell viability was assessed by measuring the absorbance at A450 nm. Additionally, MAHLAVU cells were seeded in six-well plates at 500 cells per well in droplets. Three milliliters of medium were added to each well, and the plate was regularly monitored. By day 12, cell colonies were observed. The colonies were fixed with methanol for 30 minutes and stained with crystal violet (Beyotime, China).
Wound Healing Scratch Test and Transwell Assay
To evaluate the migration capability of hepatocellular carcinoma cells, cells were seeded onto a 12-well plate. After 24 hours, a scratch was made in the cell monolayer using a 10μL pipette tip, and PBS was used to remove debris. Images of the gaps were captured under a microscope at 0 and 48 hours, and cell migration was analyzed using Image J software. Additionally, approximately 50,000 cells from each group were seeded onto Transwell chambers (Corning, USA) and incubated for 48 hours with 500μL of medium containing 10% serum added to the lower chamber. After incubation, the cells were fixed with methanol for 30 minutes and stained with crystal violet for 20 minutes.
Flow Cytometry Assay
In this experiment, a cell cycle staining kit from MULTI SCIENCES was used. To prepare the samples, 1×10⁶ cells were mixed with 1 mL of DNA Staining solution and 10 μL of permeabilization solution. The mixture was vortexed for 5–10 seconds and then incubated at room temperature in the dark for 30 minutes. Cell apoptosis was determined using Annexin V-FITC/PI dual staining, followed by flow cytometry analysis. Additionally, cell cycle analysis was performed using flow cytometry (BD FACSCanto™II System, USA).
Statistical Analysis
Statistical analysis was performed using R software (version 4.2.1) and GraphPad Prism Version 8 software. The t-test and Mann–Whitney U-test were used to detect differences between groups. Survival analysis was performed using Kaplan-Meier curves, Log rank tests, and Cox proportional hazards regression models. Spearman’s test was used to assess correlations. A P-value < 0.05 was considered statistically significant. Flow Jo V10 was used for cell cycle outcome analysis. Statistical significance was denoted by *p < 0.05, **p < 0.01, and ***p < 0.001.
Results
Insomnia and Daytime Napping Linked to HCC Development
The flowchart for this article is shown in Figure 1. CR sleep-wake disorders are a subcategory of CR disorders, so we used insomnia and daytime naps to represent CR disorders to illustrate their association with hepatocarcinogenesis. As presented in Table 2, the analysis using MR demonstrated a significant causal association between insomnia and hepatocarcinogenesis (IVW: OR = 1.00311, 95% CI 1.00077–1.00545, P < 0.01. MR-Egger: OR = 1.01021, 95% CI 1.00298–1.01749, P < 0.01). Additionally, the IVW results also indicated a causal relationship between daytime napping and hepatocarcinogenesis (IVW: OR = 1.00189, 95% CI 1.00014–1.00364, P < 0.05). Figure 2A and B illustrates a potential causal relationship between circadian rhythm (CR) disruption and the development of hepatocarcinogenesis. We conducted leave-one-out analyses and Cochrane Q-tests to assess the robustness of this association. The leave-one-out analyses indicated that no single SNP deletion significantly influenced the observed causal relationship between CR disruption and hepatocarcinogenesis (Figure 2C and D). Furthermore, the p-values from the Cochrane Q-tests were all greater than 0.05, suggesting no evidence of heterogeneity among the studies (Insomnia-IVW: Q-value 39.29, P = 0.37; MR-Egger: Q-value 35.18, P = 0.51; Daytime napping-IVW: Q-value 72.10, P = 0.87; MR-Egger: Q-value 72.08, P = 0.86) (Figure 2E–H). These findings suggest that both insomnia and daytime napping may contribute to the development of liver cancer.
 |
Table 2 MR Findings on Sleep Characteristics and Liver Cancer |
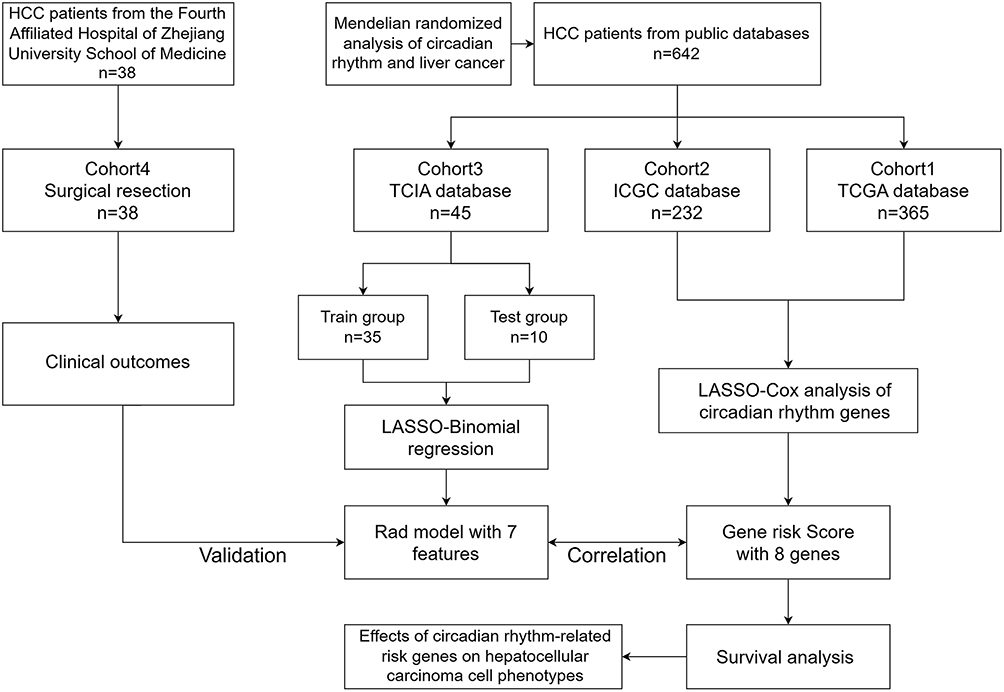 |
Figure 1 The flowchart above illustrates the design of this study. |
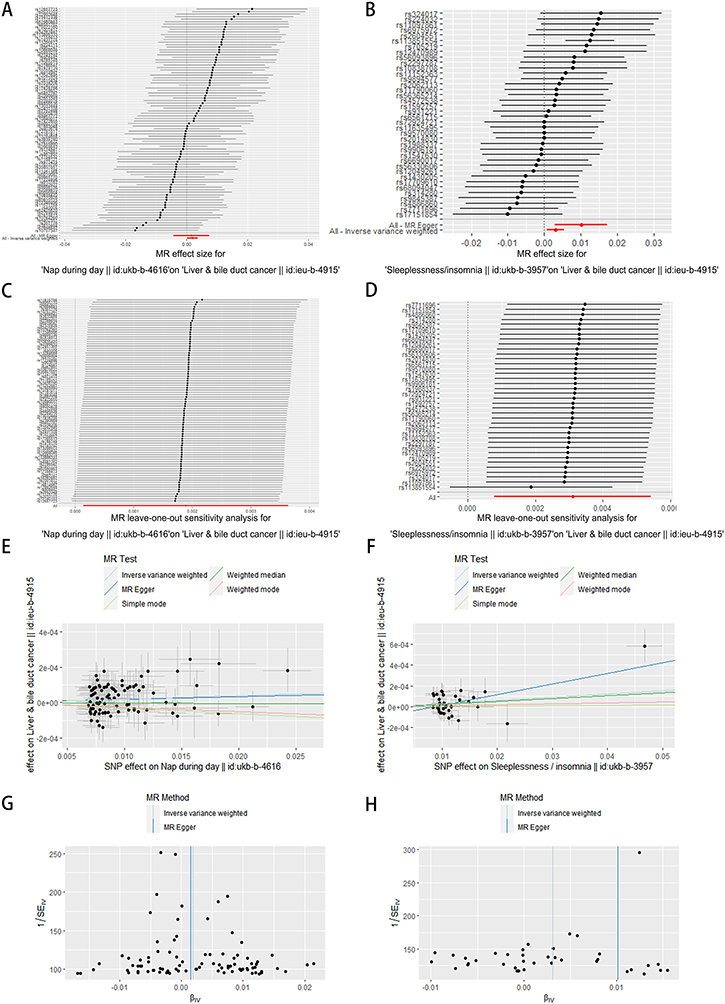 |
Figure 2 Exploring the potential association between CR disruption and hepatocarcinogenesis. (A and B) Forest plot showing combined results of all SNPs using IVW and MR Egger methods. Red dots represent effect estimates, and horizontal lines indicate 95% confidence intervals. (C and D) Leave-one-out analysis conducted using IVW method. Black points represent causal effect estimates by excluding single variants, while the red point denotes the inverse-variance weighted estimate with all SNPs. (E and F) Scatter plot illustrating estimated effects of each mendelian randomization method. Line slopes indicate effect magnitude. (G and H) Funnel plot displaying estimates with all SNPs. Vertical lines represent effect estimates, demonstrating absence of horizontal pleiotropy. |
Identification and Analysis of Circadian Rhythm-Related Genes in HCC
A total of 424 data samples were collected from the TCGA database, comprising 374 HCC samples and 50 normal samples. From the GSEA dataset, 71 CR-related genes were obtained, and using the DESeq2 package, 32 differentially expressed genes (|Log2FC| > 0.585 and p < 0.05) were identified (Figure 3A and B). The results of the GO and KEGG analyses for these 32 differentially expressed genes are presented in Figure S1. Through univariate Cox analysis, 18 genes associated with HCC prognosis were identified (Figure 3C). Furthermore, Figure 3D illustrates the protein-protein interaction network of these 18 genes. Analysis conducted on the cBioPortal website revealed that a majority of these 18 genes were expressed in amplified form in HCC patients (Figure 3E).
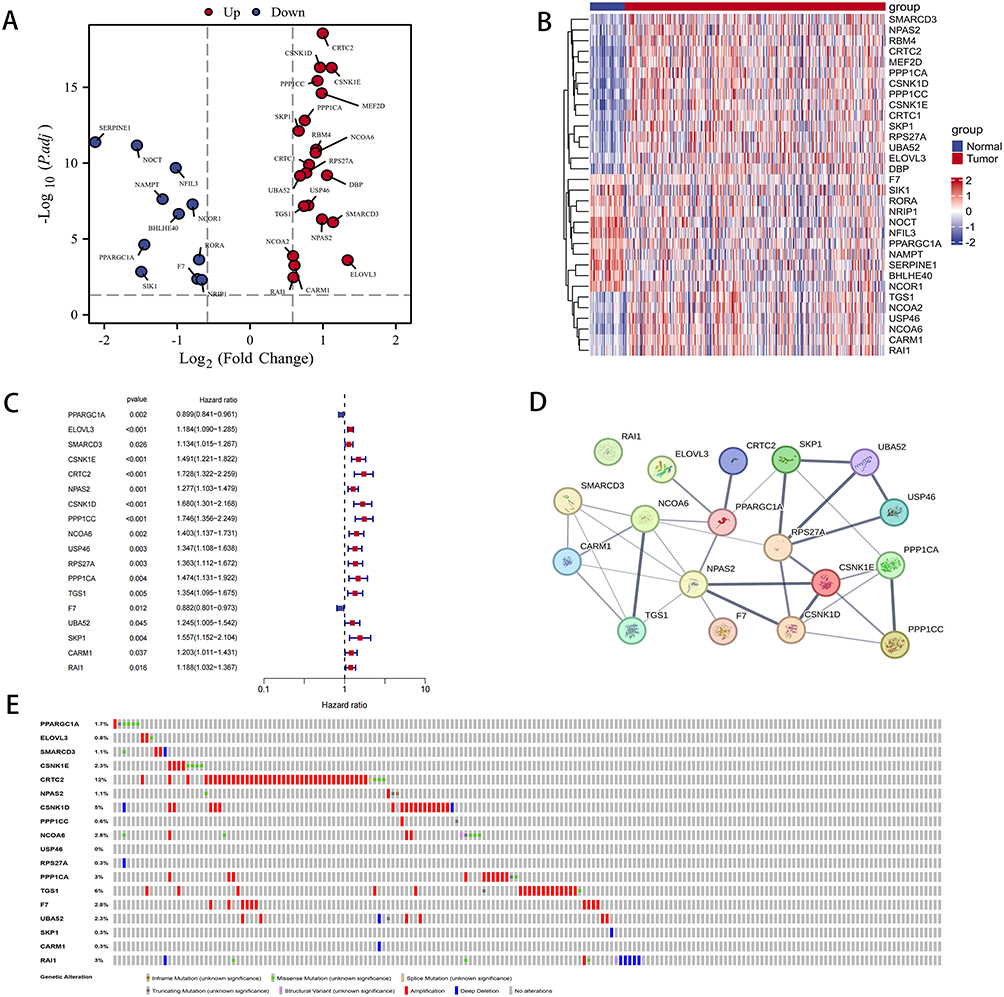 |
Figure 3 Differentially expressed CR genes between LIHC tissues and normal tissues. (A) Volcano plot depicting differentially expressed CR genes between LIHC tissues and normal tissues. (B) Heatmap illustrating differentially expressed CR genes. (C) Univariate Cox regression analysis conducted for differentially expressed CR genes. (D) PPI network displaying interactions among CR genes (interaction score=0.4). (E) Mutation analysis conducted for five CR genes. |
Development and Validation of a CR-Related Gene Signature for Predicting HCC Prognosis
To investigate the prognostic value of circadian risk genes in HCC patients, we conducted an analysis combining transcriptomic data and clinical data from the TCGA database. Lasso and multivariate Cox regression analyses were performed to identify the optimal combination of genes for risk modeling. From this analysis, eight candidate genes were selected and included in the final risk profile (Figure 4A and B). The risk score was calculated using the following formula:
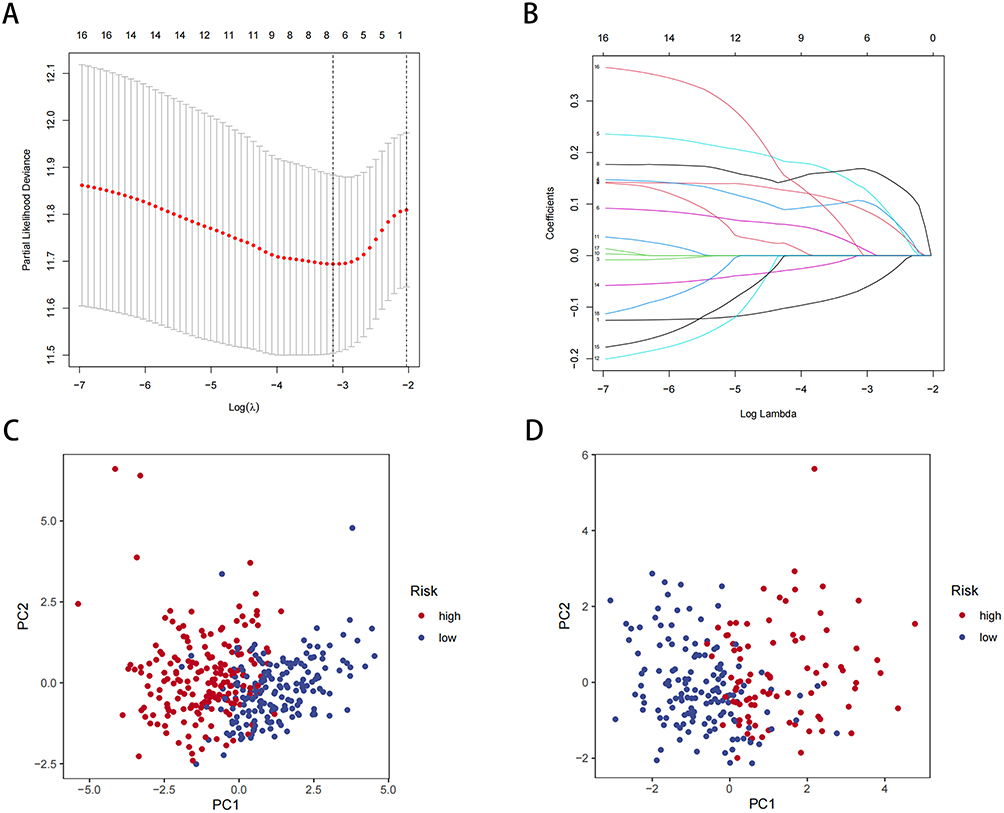 |
Figure 4 Construction of a risk prognostic model based on CR genes. (A) LASSO regression of the 8 OS-related genes. (B) Cross-validation for tuning the parameter selection in the LASSO regression. (C) PCA analysis of risk models in the TCGA database. (D) PCA analysis of risk models in the ICGC database. |
RiskScore = (−0.0694*PPARGC1A expression) + (−0.0002*F7 expression) + (0.0940*ELOVL3 expression) + (0.1071*CSNK1E expression) + (0.1369*CRTC2 expression) + (0.0188*NPAS2 expression) + (0.1685*PPP1CC expression) + (0.0161*SKP1 expression)
Figure S2A–H show that the expression of all eight genes has predictive value for patient prognosis. Based on the risk score, patients were divided into high-risk and low-risk groups using the median cut-off. PCA was conducted to assess the discriminative power of the risk model for HCC patients in the TCGA and ICGC databases (Figure 4C and D). The results demonstrated that the risk gene-based model effectively differentiated HCC patients.
Clinical Significance and Prognostic Value of the CR Risk Model
We then conducted clinical correlation analyses to further assess the clinical significance of the risk models. Table 3 presents the clinical data for patients in the high- and low-risk groups. Survival curves demonstrated that gene risk scores significantly impacted the prognosis of HCC patients in both the TCGA database and the ICGC database (Figure 5A and B). Furthermore, Figure 5C and D indicated that survival was worse in the high CR risk gene expression group in the TCGA database, while Figure 5E and F highlighted the poor prognosis for patients in the high-risk group in the ICGC database. Additionally, a strong positive correlation was observed between the risk score and tumor stage, suggesting that higher risk scores were associated with more advanced tumor stages (Figure 5G). It is important to note that the lack of significant difference in stage IV may be attributed to the small sample size, which could introduce statistical errors. Consistently, the ICGC database also revealed a positive correlation between risk score and tumor stage (Figure 5H).
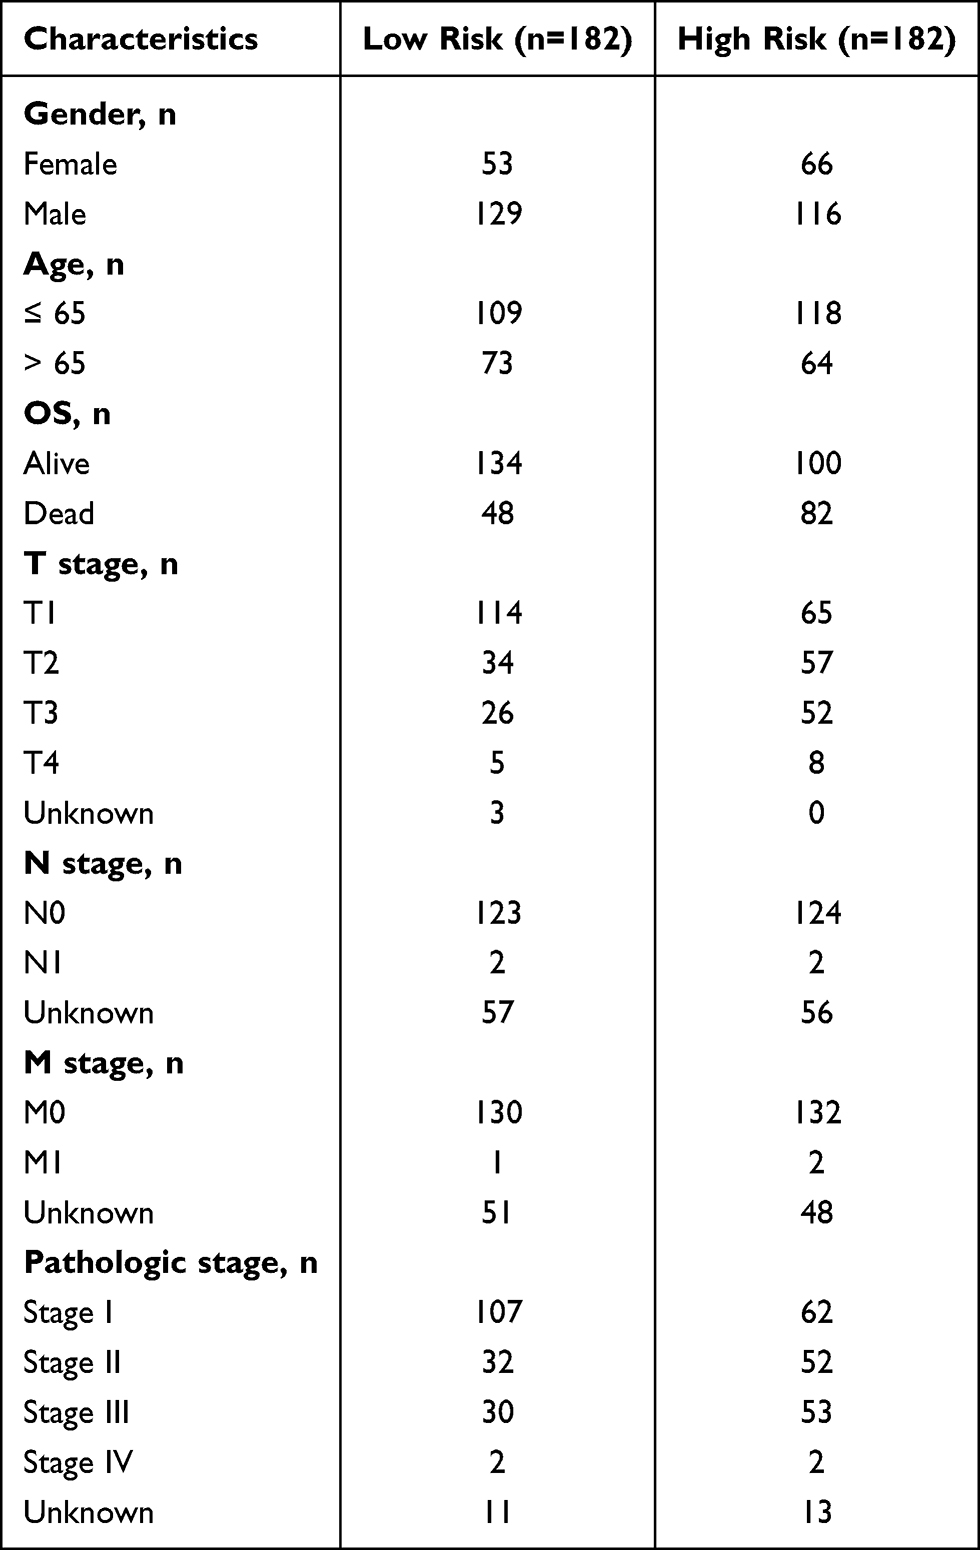 |
Table 3 Clinical Data on LIHC Patients in Different Risk Groups in the TCGA Database |
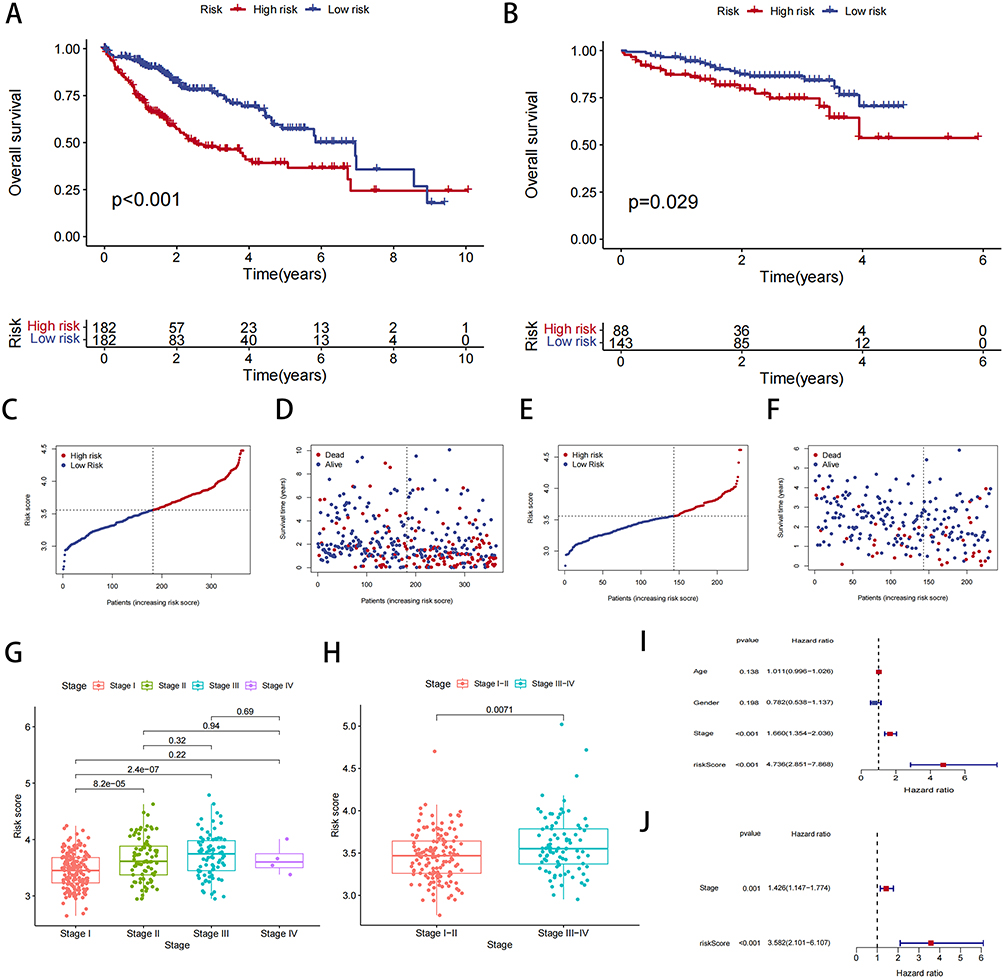 |
Figure 5 Analysis of risk model and clinical information. (A) Survival curve of patients with TCGA-LIHC in different groups. (B) Survival curve of patients with ICGC-LIHC in different groups. (C) Distribution of risk scores and the risk profile in TCGA. (D) Distribution of risk scores and the survival status in TCGA. (E) Distribution of risk scores and the risk profile in ICGC. (F) Distribution of risk scores and the survival status in ICGC. (G and H) Correlation analysis of risk scores and stage. (I and J) Univariate cox analysis and multivariate cox analysis of risk scores in liver cancer data. |
Subsequently, univariate and multivariate Cox regression analyses were performed. In the univariate analysis, the hazard ratio (HR) and 95% CI for risk scores were 1.660 and 1.354–2.036, respectively, indicating that higher risk scores were significantly associated with an increased risk of poor prognosis (P < 0.001) (Figure 5I). In the multivariate analysis, the HR was 3.582 with a 95% CI of 2.101–6.107, confirming the independent prognostic value of the risk score (p < 0.001) (Figure 5J). This indicates that the risk score independently predicts poor prognosis, even after adjusting for other clinical variables.
Knockdown of CRTC2 Inhibits Proliferation, Migration and Invasion of HCC Cells
In our study, we investigated the relationship between circadian risk genes and HCC cells, with a focus on CRTC2. CRTC2 is known to be a critical regulator in CR regulation, specifically through its modulation of the core clock gene BMAL1.29 Previous studies have shown that central circadian clock genes, such as Cry1 and Cry2, rhythmically modulate cAMP response element-binding protein (CREB) activity, which in turn regulates the expression of CRTC2.30 This process plays a key role in liver metabolism, including gluconeogenesis. Given its role in circadian regulation, we hypothesized that CRTC2 may impact HCC progression. Firstly, we used a knockdown technique to silence CRTC2 in the HCC cell line MAHLAVU. Then, we proceeded to examine the impact of CRTC2 on HCC cell proliferation. We conducted a colony formation assay to assess cell proliferation and observed that the clonogenic potential of HCC cells was significantly reduced after CRTC2 knockdown (Figure 6A). Furthermore, the results of the CCK-8 assay indicated that the proliferative capacity of HCC cells was significantly decreased at 48 and 72 hours post CRTC2 knockdown compared to the negative control (NC) group (Figure 6B). Additionally, the scratch assay demonstrated a significant decrease in the migration ability of HCC cells after CRTC2 knockdown (Figure 6C). Similarly, the transwell assay revealed that the invasive ability of HCC cells was significantly decreased following CRTC2 knockdown compared to the NC group (Figure 6D). We also employed flow cytometry to investigate the effects of CRTC2 knockdown on cell cycle and apoptosis. Our results showed a significant increase in the apoptosis rate of hepatocellular carcinoma cells after CRTC2 knockdown (Figure 6E). Furthermore, our cell cycle experiments indicated that CRTC2 knockdown significantly prolonged the G2 phase of hepatocellular carcinoma cells, suggesting that the growth cycle of these cells was arrested at the G2 phase (Figure 6F). This could potentially explain the observed deceleration in cell proliferation. These findings suggest that CRTC2 can influence various phenotypes of hepatocellular carcinoma, not only by modulating apoptosis but also by inhibiting the cell cycle. Additionally, we verified the effect of CRTC2 knockdown on the EMT phenotype through Western blot, the results showed that N-cadherin, Vimentin expression decreased after knockdown of CRTC2 (Figure 6G). These results provide strong evidence for the involvement of CRTC2 as a circadian gene in regulating the proliferation, clonality, invasion, and migration of HCC cells.
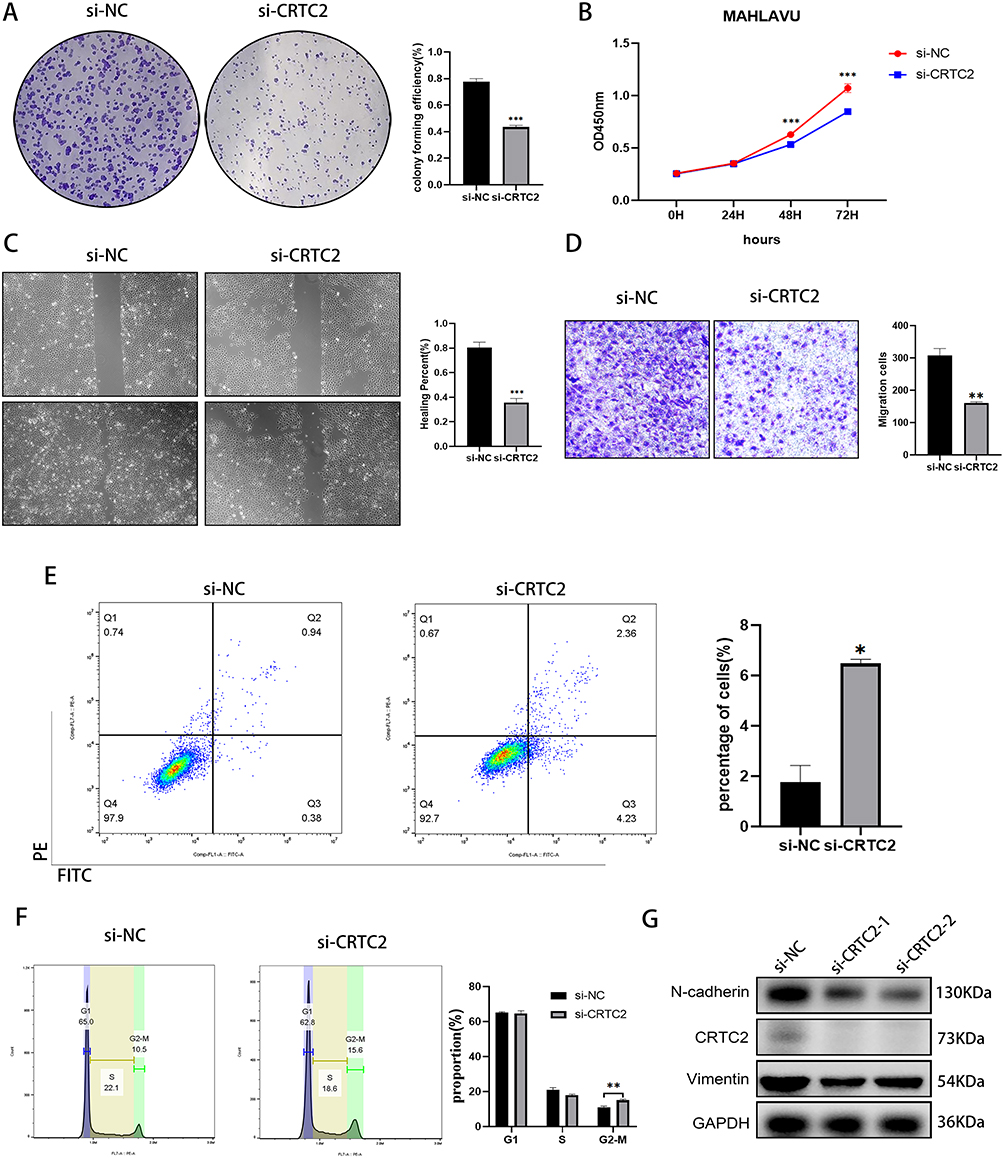 |
Figure 6 CRTC2 knockdown on tumor cell migration, invasion, and proliferation. (A) Colony formation assay illustrates the proliferative capacity of MAHLAVU cells after CRTC2 knockdown. (B) CCK8 assay shows reduced proliferation ability in MAHLAVU cells after CRTC2 knockdown. (C) Wound healing scratch test shows reduced mobility in MAHLAVU cells after CRTC2 knockdown. (D) Transwell assays show decreased invasive ability in MAHLAVU cells after CRTC2 knockdown. (E) Apoptosis changes in MAHLAVU cells after si-CRTC2 treatment. (F) Cell cycle changes in MAHLAVU cells after si-CRTC2 treatment. (G) Western blot results demonstrate the impact of CRTC2 knockdown on the EMT phenotype. *P < 0.05, **P < 0.01, ***P < 0.001. |
Modeling of Radiomic Biomarkers Associated with CR Risk Genes
Radiomics has emerged as a powerful non-invasive tool for decoding tumor heterogeneity and capturing distinct phenotypic characteristics reflective of underlying molecular alterations.31 Given that abnormalities in gene expression influence tumor heterogeneity, which manifests as distinct features on medical imaging,32 we hypothesized that the dysregulation of CR risk genes in HCC would be associated with a specific radiological phenotype detectable via CT radiomics. To test this, we conducted radiomics analyses to identify radiomic profiles associated with CR risk genes. We obtained data from 45 samples with complete enhanced CT information from the TCIA database. Figure 7A–C depicts our outlining method for these 45 samples. Subsequently, we extracted 120 features using the Pyradiomics Python package for ROI outlining. We selected 97 features based on an Intra-class correlation (ICC) threshold of > 0.9. Next, we normalized the data and divided the 45 samples into training and validation groups in an 8:2 ratio. We employed LSAAO-Binominal to screen the features (Figure 7D and E), resulting in the identification of 7 radiomics features associated with the expression of CR risk genes (Table 4) and Figure 7F demonstrates significant differences in radiomics risk scores between the high and low expression groups of CR genes (P < 0.001). In the training group, the radiomics scores predicted an AUC value of 0.931 for CR risk genes (Figure 7G), while in the validation group, it was 0.760 (Figure 7H). To further illustrate the trade-offs between sensitivity and specificity, we have now included confusion matrices along with the AUC values. Figure S3 presents the confusion matrix corresponding to the selected operating threshold of 0.302. At this threshold, the model demonstrates a sensitivity of 70.8% (17/24) and specificity of 81.0% (17/21), providing a clear example of the model’s performance trade-offs.
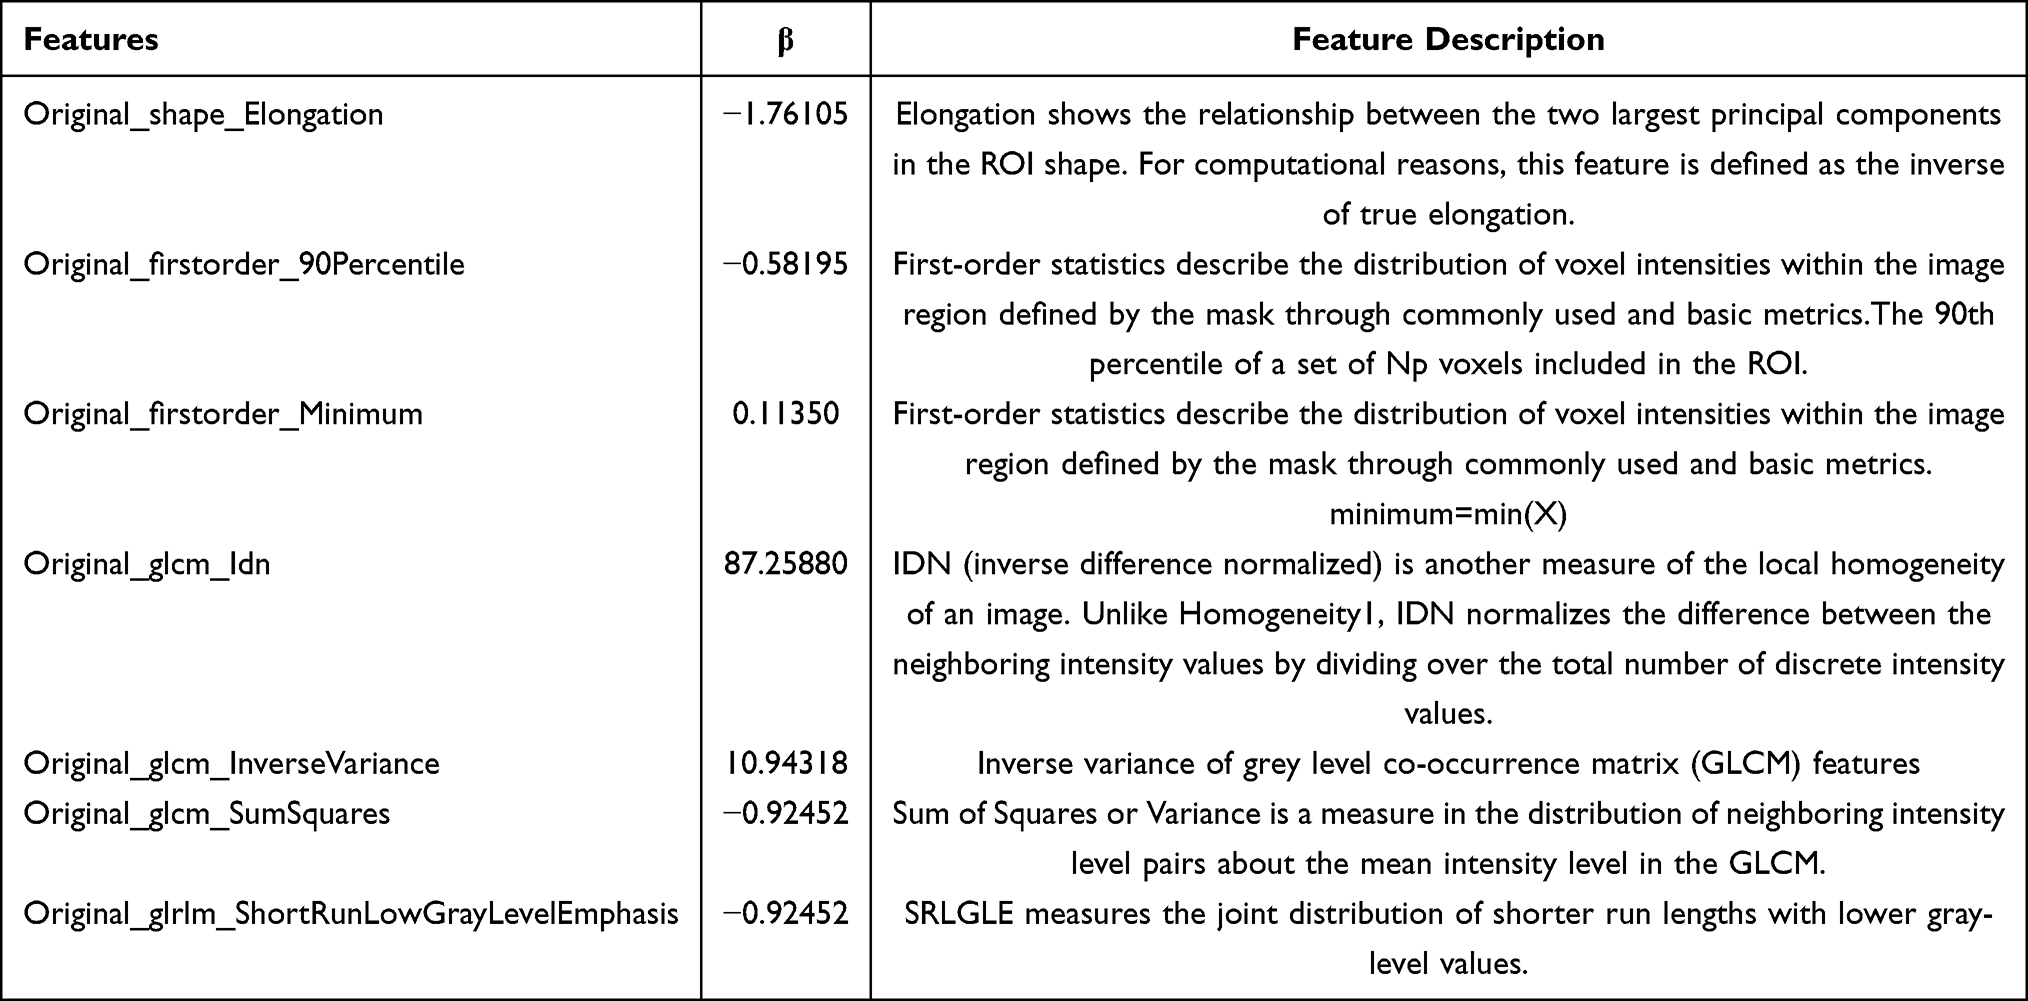 |
Table 4 Seven Radiomics Features Associated with the Expression of Circadian Rhythm Risk Genes |
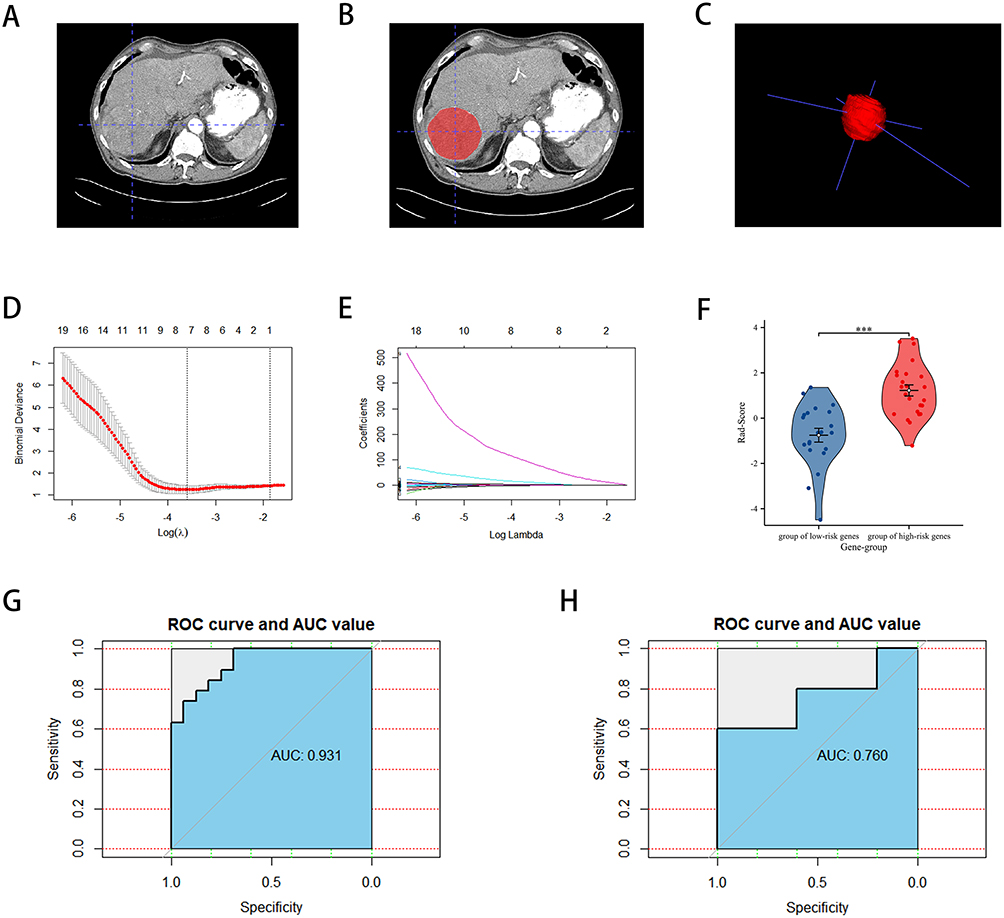 |
Figure 7 The selection of HCC CT imaging and model construction based on the TCIA-LIHC database. (A–C) Outlining Methods. (D) LASSO regression of the 7 features. (E) Cross-validation for tuning the parameter selection in the LASSO regression. (F) Radiomics scores in the high and low CR gene score groups. (G) ROC curves for radiomics models in the training group. (H) ROC curves for radiomics modelling in the validation group. ***P < 0.001. |
Clinical Prognostic Value of Radiomics Biomarkers in HCC
The cutoff value for our developed radiomics model was determined to be 0.302. Subsequently, we collected clinical information from 38 patients diagnosed with HCC. Table 5 presents the clinical data for patients in the high Rad-Score and low Rad-Score groups. To visualize the patient samples, Figure 8A illustrates the outlining of these 38 patients. Notably, the results depicted in Figure 8B demonstrate that our constructed radiomics model continues to exhibit a favorable prognostic predictive value.
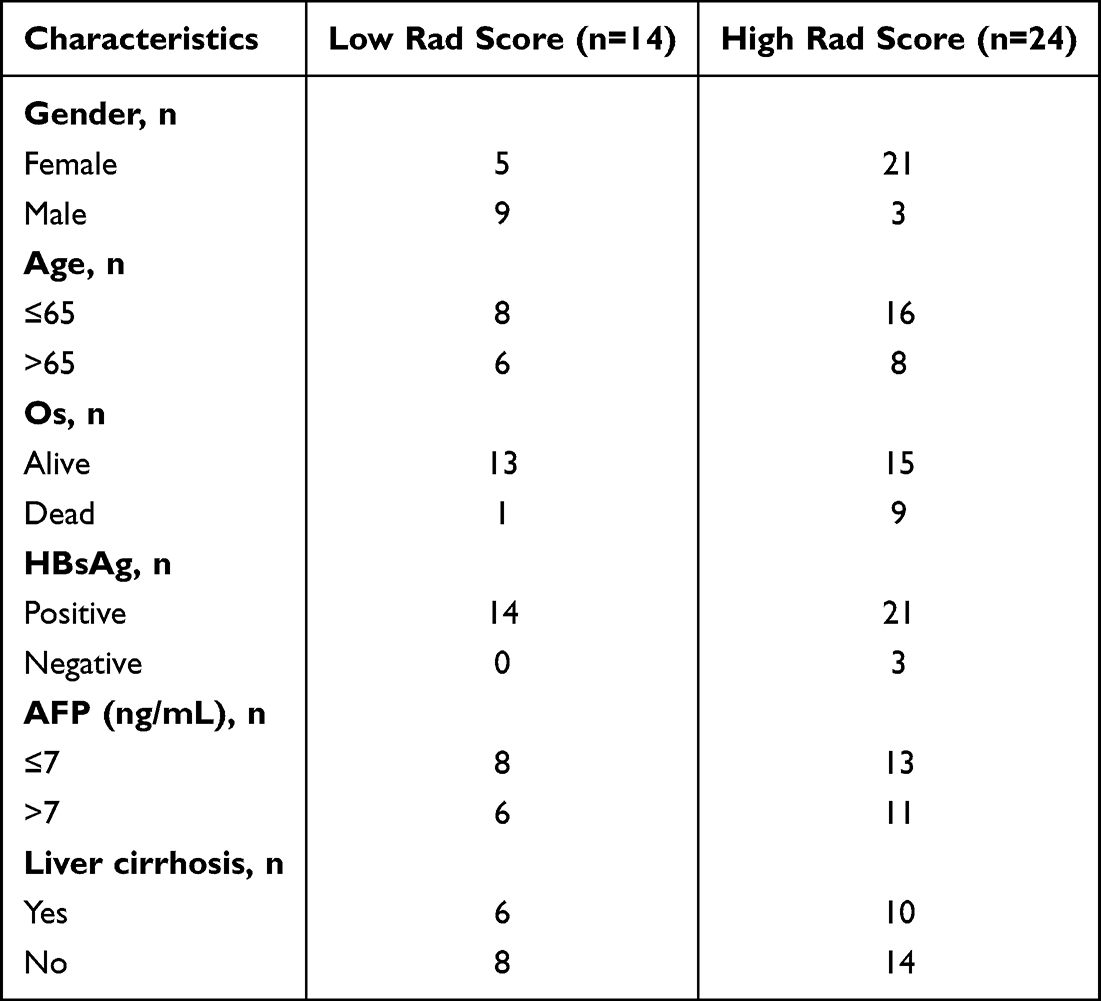 |
Table 5 Clinical Data for Patients in the High Rad-Score and Low Rad-Score Groups in Cohort4 |
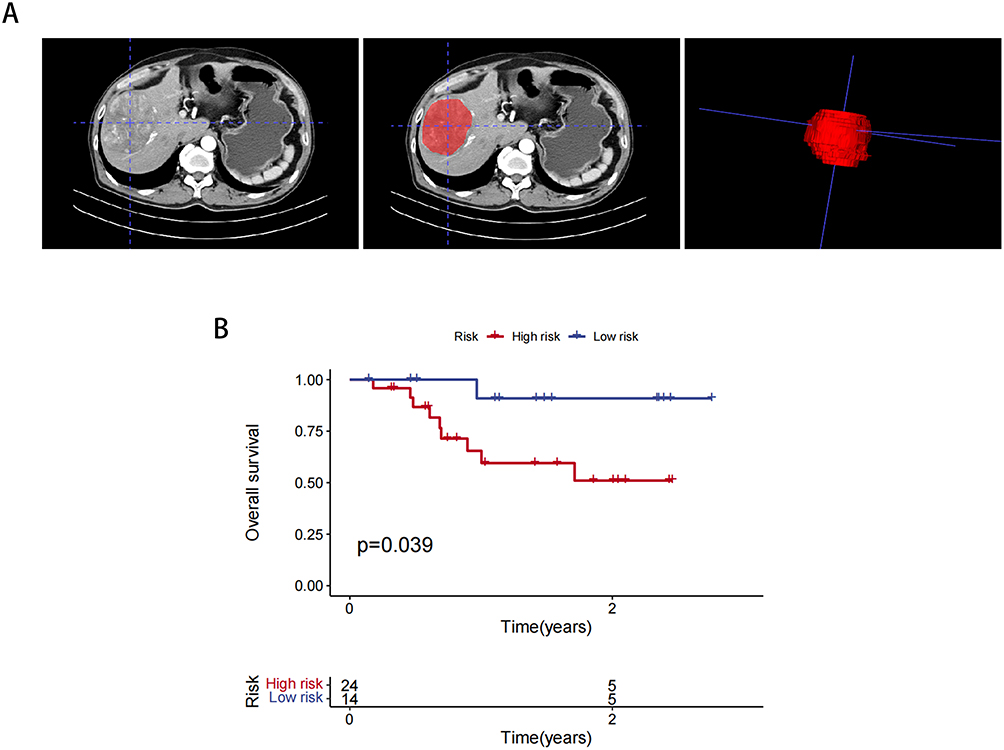 |
Figure 8 Prognostic validation of 38 clinical patient data. (A) Outlining Methods. (B) Radiomics modelling of K-M curves in 38 clinical patients. |
Discussion
HCC is a major global health concern and remains the predominant form of liver cancer.33 Despite the development of advanced therapeutic approaches, progress towards improving the efficacy of treatment for HCC has been limited. Recent studies have identified abnormal gene expression as a significant contributor to HCC progression, highlighting the critical role of investigating relevant genes in HCC.34 While viral hepatitis, chronic exposure to carcinogens, and diabetes mellitus are commonly recognized as risk factors for HCC, emerging evidence suggests that CR disorders, obesity, and non-alcoholic fatty liver disease (NAFLD) also contribute to the development of HCC.35,36 There is evidence suggesting that hepatitis B virus (HBV) infection may disrupt CRs in HCC, as CR indices have been found to be significantly lower in HBV-infected HCC tissues compared to normal liver tissues.37 It has been proposed that maintaining stable CRs could potentially delay the development of HCC following prolonged exposure to carcinogens.38 Additionally, a relationship between diabetes mellitus and altered CRs in the liver has been established, with the expression of circadian genes at specific time points being influenced by insulin levels in rats.39 It has been suggested that hepatic metabolism is inextricably linked to CRs, and the study of hepatic metabolic CRs is of great significance.40 Consequently, dysregulation of circadian genes plays a role in promoting HCC development, particularly by affecting hepatic metabolism.
In this study, we initially employed Mendelian randomization to establish a causal relationship between circadian disruption of sleep patterns and hepatocarcinogenesis. Subsequently, we utilized univariate Cox analysis and lasso regression analysis based on eight CR-related genes (PPARGC1A, F7, ELOVL3, CSNK1E, NPAS2, PPP1CC, SKP1, CRTC2) to develop risk prediction models. The resulting prognostic model demonstrated significant predictive value for the prognosis of HCC. PPARGC1A plays a crucial role in regulating mitochondrial biogenesis, oxidative metabolism, and energy expenditure. PPARGC1A has been found to modulate the expression of other genes involved in the CR system, including REV-ERBα and Bmal1.41 F7 is a gene that encodes coagulation factor VII, which plays a critical role in the blood clotting process. CRs have been shown to influence various physiological processes, including blood clotting and cardiovascular function. Disruptions in CRs, such as those caused by shift work or jet lag, have been associated with an increased risk of cardiovascular disease, including thrombotic events.42 ELOVL3 is a gene encoding an enzyme involved in the elongation of ultra-long-chain fatty acids.ELOVL3-mediated fatty acid elongation products have been associated with the regulation of circadian clock gene expression and function.43 CSNK1E, also known as casein kinase 1 epsilon, is a gene that encodes a protein kinase. It is a crucial component of the central clock mechanism that regulates CRs by phosphorylating and modulating the activity of clock proteins such as Period (PER) and Cryptochrome (CRY). CSNK1E phosphorylates PER and CRY proteins, leading to their degradation and resetting of the circadian clock. This phosphorylation process plays a critical role in the negative feedback loop that drives the oscillation of circadian clock genes.44 Genetic variants or mutations in CSNK1E have been associated with altered regulation of CRs. For instance, some mutations have been linked to sleep disorder.45 NPAS2 is a critical transcription factor involved in the regulation of CRs. Its interaction with BMAL1 and its role in activating clock gene transcription are integral to maintaining proper timing and synchronization of CRs. Genetic variations in NPAS2 can lead to disruptions in CR regulation, contributing to sleep disorders.46,47 PPP1CC is a gene responsible for encoding a protein phosphatase. Research suggests that alterations in PPP1CC expression occur in the mouse cerebellum when there is disruption to the CR.48 The SKP1-containing ubiquitin ligase complex can inhibit the degradation of Per1, which plays a crucial role in regulating CRs.49 Studies have demonstrated that the central circadian clock genes, Cry1 and Cry2, can rhythmically modulate the activity of cAMP response element-binding protein (CREB), which in turn regulates the expression of CREB-regulated transcription coactivator-2 (CRTC2). This leads to the modulation of gluconeogenesis in the liver.30 Furthermore, CRTC2 has been identified as a critical regulator of liver CRs and gluconeogenesis through its modulation of the core clock gene BMAL1.29 Given the significant role of CRTC2 in regulating hepatic circadian metabolism, we conducted experimental validation to investigate its potential impact on HCC proliferation, migration, and invasion. Our results demonstrate that CRTC2, as a CR-regulated gene, plays a critical role in HCC progression, which ultimately impacts patient prognosis. Through cell cycle and apoptosis analysis, we further elucidated the mechanism by which CRTC2 affects cell proliferation. Specifically, CRTC2 appears to promote HCC cell proliferation by inducing G2 cell cycle block and inhibiting apoptosis as a regulatory gene, and also inhibits the invasiveness of hepatocellular carcinoma cells. Overall, our findings provide novel insights into the pivotal role of CRTC2 as a primary CR regulator in HCC progression. These results could have significant implications for the development of individualized and targeted therapies for HCC in the future.
Radiomics has emerged as a potent tool in the field of oncology research, aiding researchers in understanding the unique characteristics of tumors and identifying potential targets for therapy.31 Studies have demonstrated that histology scores derived from imaging models can effectively capture the heterogeneity of tumor cells and the tumor microenvironment. This information proves valuable in predicting the prognosis of advanced breast cancer following neoadjuvant chemotherapy and radiotherapy.50 A recent study utilized a radiomics signature derived from PET-CT to predict recurrence of lung cancer. Interestingly, this radiomics signature was also successful in predicting a gene expression signature associated with patient recurrence with high accuracy.51 In the context of hepatocellular carcinoma radiomics studies, there have been a study to construct a CT radiomics model to predict the Macrotrabecular-Massive (MTM) Subtype of HCC and the potential pattern of immune infiltration.52 There is also an article using radiomics modelling of CT to successfully predict microvascular infiltration and prognosis in patients with HCC.53 However, there are still significant developments in radiomics for predicting risk gene expression and prognosis in HCC. There are publications on the prediction of FOXM1 expression and prognosis in hepatocellular carcinoma by computed tomography,54 as well as articles on the prediction of Neutrophil extracellular traps in HCC and the efficacy of immunotherapy using CT radiomics.55 Abnormalities in the expression of tumor genes influence tumor heterogeneity, which manifests itself as differences on CT imaging maps.32 This study established a radiomics model derived from arterial-phase enhanced CT images to predict the expression of CR-related risk genes in HCC. Validated on an external cohort, this model effectively predicted patient prognosis, underscoring the significant impact of CR gene dysregulation on HCC outcomes. The predictive power of our model implies that circadian rhythm aberrations manifest as specific radiological phenotypes. We hypothesize that the radiomic signature acts as a non-invasive proxy for the underlying tissue chaos driven by a disrupted circadian clock, proposing that features quantifying textural heterogeneity and morphology directly reflect this biological disorganization. This mechanistic link explains the model’s ability to forecast clinical outcomes.
However, our study has several limitations that warrant consideration. First, the sample size was constrained by the retrospective nature of data acquisition from public databases (TCGA and TCIA). Second, while external validation was performed, the validation cohort was limited in size, highlighting the need for larger, multi-center studies to enhance the generalizability of our findings. Third, although we experimentally demonstrated that the circadian risk gene CRTC2 significantly influences HCC cell invasiveness and aggressiveness, the precise molecular mechanisms underlying this relationship remain to be fully elucidated. To address these issues, future research should focus on expanding patient cohorts through prospective, multi-center collaborations with detailed clinical and biochemical data. Additionally, integrating multi-modal imaging approaches, particularly MRI radiomics, when resources allow, would facilitate direct comparisons between imaging modalities and potentially improve predictive performance. Most importantly, mechanistic studies on how circadian genes influence HCC progression are crucial for a complete understanding of the molecular basis of our findings. These integrated approaches will not only validate the clinical utility of our CT-based model but also enhance our knowledge of circadian biology in liver cancer pathogenesis.
In conclusion, this study presents a proof-of-concept that establishes a crucial bridge between radiomic phenotypes and circadian rhythm dysfunction in HCC. We demonstrate that standard CT images can be decoded to non-invasively reveal the tumor’s underlying circadian biology, which is a key determinant of clinical outcomes. While promising, this paradigm requires further validation in multi-center prospective studies before clinical adoption. If validated, clinicians could potentially use this model for patient risk stratification by identifying those with high-risk circadian dysregulation, for prognostic counseling by offering a more biologically-grounded outcome prediction, and for therapeutic selection by prioritizing patients who might benefit from therapies targeting the circadian pathway.
Abbreviations
AFP, alpha-fetoprotein; AUC, area under the curve; BP, Biological Processes; CREB, cAMP response element-binding protein; CSNK1E, casein kinase 1 epsilon; CC, Cellular ComponentsCR, circadian rhythm; F7, coagulation factor VII; CT, computed tomographyCI, confidence interval; CRTC2, CREB regulated transcription coactivator 2; CRY, Cryptochrome; ELOVL3, ELOVL fatty acid elongase 3; EMT, Epithelial-Mesenchymal Transition; GO, Gene Ontology; HR, hazard ratio; HBV, hepatitis B virus; HCC, hepatocellular carcinoma; HU, Hounsfield units; IVs, instrumental variables; ICGC, International Cancer Genome Consortium; ICC, Intra-class correlation; IVW, inverse variance weighting; K-M, Kaplan-Meier; LD, linkage disequilibrium; MTM, Macrotrabecular-Massive; MR, Mendelian randomization; MF, Molecular Functions; NC, negative control; NPAS2, neuronal PAS domain protein 2; NAFLD, non-alcoholic fatty liver disease; OS, overall survival; PER, Period; PPARGC1A, PPARG coactivator 1 alpha; PCA, Principal component analysis; PPP1CC, protein phosphatase 1 catalytic subunit gamma; ROC, Receiver operating characteristic; ROIs, regions of interest; SKP1, S-phase kinase associated protein 1; TCGA, The Cancer Genome Atlas; TCIA, The Cancer Immunome Atlas; WME, weighted median; WM, weighted multinomial.
Data Sharing Statement
The datasets for this study can all be found in the TCGA, ICGC and TCIA databases. The data for this study are available in the Cancer Genome Atlas (https://portal.gdc.cancer.gov/repository?facetTab=files); ICGC data is available from the following website (https://dcc.icgc.org/). TCIA data is available from the following website (https://www.cancerimagingarchive.net).
Ethics Approval and Consent to Participate
This study was formally approved by the Institutional Review Board (IRB) of the Fourth Hospital Affiliated to Zhejiang University School of Medicine. The IRB granted a waiver for separate informed consent from patients, as all participants had previously signed the “Inpatient Notice” (Version 7.0), Section 3, Point 6, which covers authorization for the use of medical records in retrospective research. For data confidentiality, personal identifying information in the retrospectively analyzed electronic medical records was anonymized and replaced with numerical codes. All data handling strictly complies with ethical standards and the principles of the Declaration of Helsinki to protect patient privacy rights.
Acknowledgments
We acknowledge TCGA, ICGC, TCIA database and the Fourth Affiliated Hospital of Zhejiang University School of Medicine for providing their meaningful data.
Author Contributions
All authors made a significant contribution to the work reported, whether that is in the conception, study design, execution, acquisition of data, analysis and interpretation, or in all these areas; took part in drafting, revising or critically reviewing the article; gave final approval of the version to be published; have agreed on the journal to which the article has been submitted; and agree to be accountable for all aspects of the work.
Funding
This study was supported by National Key Research and Development Program of China (2022YFA1104600).
Disclosure
The authors declare no competing interests in this work.
References
1. Rumgay H, Arnold M, Ferlay J, et al. Global burden of primary liver cancer in 2020 and predictions to 2040. J Hepatol. 2022;77(6):1598–1606. doi:10.1016/j.jhep.2022.08.021
2. Jindal A, Thadi A, Shailubhai K. Hepatocellular carcinoma: etiology and current and future drugs. J Clin Exp Hepatol. 2019;9(2):221–232. doi:10.1016/j.jceh.2019.01.004
3. EASL-EORTC clinical practice guidelines: management of hepatocellular carcinoma. J Hepatol. 2012;56(4):908–943. doi:10.1016/j.jhep.2011.12.001
4. Goins SM, Jiang H, van der Pol CB, et al. individual participant data meta-analysis of LR-5 in LI-RADS Version 2018 versus Revised LI-RADS for hepatocellular carcinoma diagnosis. Radiology. 2023;309(3):e231656. doi:10.1148/radiol.231656
5. Skene DJ, Arendt J. Human circadian rhythms: physiological and therapeutic relevance of light and melatonin. Ann Clin Biochem. 2006;43(Pt 5):344–353. doi:10.1258/000456306778520142
6. Canaple L, Kakizawa T, Laudet V. The days and nights of cancer cells. Cancer Res. 2003;63(22):7545–7552.
7. Hansen J. Night shift work and risk of breast cancer. Curr Environ Health Rep. 2017;4(3):325–339. doi:10.1007/s40572-017-0155-y
8. Burgess S, Thompson SG. Avoiding bias from weak instruments in Mendelian randomization studies. Int J Epidemiol. 2011;40(3):755–764. doi:10.1093/ije/dyr036
9. Abbott SM, Zee PC. Irregular sleep-wake rhythm disorder. Sleep Med Clin. 2015;10(4):517–522. doi:10.1016/j.jsmc.2015.08.005
10. Pajėdienė E, Urbonavičiūtė V, Ramanauskaitė V, et al. Sex differences in insomnia and circadian rhythm disorders: a systematic review. Medicina. 2024;60(3):474. doi:10.3390/medicina60030474
11. Videnovic A, Cai A. Irregular sleep-wake rhythm disorder: from the pathophysiologic perspective to the treatment. Handb Clin Neurol. 2025;206:71–87.
12. Long L, Zhao L, Petrick JL, et al. Daytime napping, nighttime sleeping duration, and risk of hepatocellular carcinoma and liver disease-related mortality. JHEP Rep. 2023;5(10):100819. doi:10.1016/j.jhepr.2023.100819
13. Gillies RJ, Kinahan PE, Hricak H. Radiomics: images are more than pictures, they are data. Radiology. 2016;278(2):563–577. doi:10.1148/radiol.2015151169
14. Liu Z, Wang S, Dong D, et al. The applications of radiomics in precision diagnosis and treatment of oncology: opportunities and challenges. Theranostics. 2019;9(5):1303–1322. doi:10.7150/thno.30309
15. Chernyak V, Fowler KJ, Kamaya A, et al. Liver imaging reporting and data system (LI-RADS) version 2018: imaging of hepatocellular carcinoma in at-risk patients. Radiology. 2018;289(3):816–830. doi:10.1148/radiol.2018181494
16. van der Pol CB, McInnes MDF, Salameh J-P, et al. CT/MRI and CEUS LI-RADS major features association with hepatocellular carcinoma: individual patient data meta-analysis. Radiology. 2022;302(2):326–335. doi:10.1148/radiol.2021211244
17. Sharma B, Martin A, Zerizer I. Positron emission tomography-computed tomography in liver imaging. Semin Ultrasound CT MR. 2013;34(1):66–80. doi:10.1053/j.sult.2012.11.006
18. Bernatowicz K, Amat R, Prior O, et al. Radiomics signature for dynamic monitoring of tumor inflamed microenvironment and immunotherapy response prediction. J Immunother Cancer. 2025;13(1):e009140. doi:10.1136/jitc-2024-009140
19. Borhani AA, Catania R, Velichko YS, et al. Radiomics of hepatocellular carcinoma: promising roles in patient selection, prediction, and assessment of treatment response. Abdom Radiol. 2021;46(8):3674–3685. doi:10.1007/s00261-021-03085-w
20. Wang Y, Zhang L, Qi L, et al. Machine learning: applications and advanced progresses of radiomics in endocrine neoplasms. J Oncol. 2021;2021:8615450. doi:10.1155/2021/8615450
21. Ji GW, Zhu F-P, Xu Q, et al. Machine-learning analysis of contrast-enhanced CT radiomics predicts recurrence of hepatocellular carcinoma after resection: a multi-institutional study. EBioMedicine. 2019;50:156–165. doi:10.1016/j.ebiom.2019.10.057
22. Lv K, Cao X, Du P, et al. Radiomics for the detection of microvascular invasion in hepatocellular carcinoma. World J Gastroenterol. 2022;28(20):2176–2183. doi:10.3748/wjg.v28.i20.2176
23. Sutton EJ, Oh JH, Dashevsky BZ, et al. Breast cancer subtype intertumor heterogeneity: MRI-based features predict results of a genomic assay. J Magn Reson Imaging. 2015;42(5):1398–1406. doi:10.1002/jmri.24890
24. Fan M, Cui Y, You C, et al. Radiogenomic signatures of oncotype dx recurrence score enable prediction of survival in estrogen receptor-positive breast cancer: a multicohort study. Radiology. 2022;302(3):516–524. doi:10.1148/radiol.2021210738
25. Burgess S, Bowden J, Fall T, et al. sensitivity analyses for robust causal inference from mendelian randomization analyses with multiple genetic variants. Epidemiology. 2017;28(1):30–42. doi:10.1097/EDE.0000000000000559
26. Hartwig FP, Smith GD, Bowden J. Robust inference in summary data Mendelian randomization via the zero modal pleiotropy assumption. Int J Epidemiol. 2017;46(6):1985–1998. doi:10.1093/ije/dyx102
27. Greco MF, Minelli C, Sheehan NA, et al. Detecting pleiotropy in Mendelian randomisation studies with summary data and a continuous outcome. Stat Med. 2015;34(21):2926–2940. doi:10.1002/sim.6522
28. Gronau QF, Wagenmakers EJ. Limitations of bayesian leave-one-out cross-validation for model selection. Comput Brain Behav. 2019;2(1):1–11. doi:10.1007/s42113-018-0011-7
29. Sun X, Dang F, Zhang D, et al. Glucagon-CREB/CRTC2 signaling cascade regulates hepatic BMAL1 protein. J Biol Chem. 2015;290(4):2189–2197. doi:10.1074/jbc.M114.612358
30. Zhang EE, Liu Y, Dentin R, et al. Cryptochrome mediates circadian regulation of cAMP signaling and hepatic gluconeogenesis. Nat Med. 2010;16(10):1152–1156. doi:10.1038/nm.2214
31. Mayerhoefer ME, Materka A, Langs G, et al. Introduction to Radiomics. J Nucl Med. 2020;61(4):488–495. doi:10.2967/jnumed.118.222893
32. Sun XX, Yu Q. Intra-tumor heterogeneity of cancer cells and its implications for cancer treatment. Acta Pharmacol Sin. 2015;36(10):1219–1227. doi:10.1038/aps.2015.92
33. Li X, Ramadori P, Pfister D, et al. The immunological and metabolic landscape in primary and metastatic liver cancer. Nat Rev Cancer. 2021;21(9):541–557. doi:10.1038/s41568-021-00383-9
34. Coffman-D’Annibale KL, Greten TF. Top advances of the year: hepatobiliary cancers. Cancer. 2023;129(8):1149–1155. doi:10.1002/cncr.34652
35. Nikolic I, Leiva M, Sabio G. The role of stress kinases in metabolic disease. Nat Rev Endocrinol. 2020;16(12):697–716. doi:10.1038/s41574-020-00418-5
36. Cicuéndez B, Ruiz-Garrido I, Mora A, Sabio G, et al. Stress Kinases in the Development of Liver Steatosis and Hepatocellular Carcinoma. Vol. 50. Mol Metab; 2021:101190
37. Liu Z, Yu K, Zheng J, et al. Dysregulation, functional implications, and prognostic ability of the circadian clock across cancers. Cancer Med. 2019;8(4):1710–1720. doi:10.1002/cam4.2035
38. Filipski E, Subramanian P, Carrière J, et al. Circadian disruption accelerates liver carcinogenesis in mice. Mutat Res. 2009;680(1–2):95–105. doi:10.1016/j.mrgentox.2009.10.002
39. Hofmann K, Schönerstedt U, Mühlbauer E, et al. Clock gene expression in the liver of streptozotocin-induced and spontaneous type 1 diabetic rats. Horm Metab Res. 2013;45(9):629–639. doi:10.1055/s-0033-1343462
40. Reinke H, Asher G. Circadian clock control of liver metabolic functions. Gastroenterology. 2016;150(3):574–580. doi:10.1053/j.gastro.2015.11.043
41. Geoffroy PA, Etain B, Lajnef M, et al. Circadian genes and lithium response in bipolar disorders: associations with PPARGC1A (PGC −1 α) and RORA. Genes Brain Behav. 2016;15(7):660–668. doi:10.1111/gbb.12306
42. Pritchett D, Reddy AB. Circadian Clocks in the Hematologic System. J Biol Rhythms. 2015;30(5):374–388. doi:10.1177/0748730415592729
43. Chen H, Gao L, Yang D, et al. Coordination between the circadian clock and androgen signaling is required to sustain rhythmic expression of Elovl3 in mouse liver. J Biol Chem. 2019;294(17):7046–7056. doi:10.1074/jbc.RA118.005950
44. Etchegaray J-P, Machida KK, Noton E, et al. Casein kinase 1 delta regulates the pace of the mammalian circadian clock. Mol Cell Biol. 2009;29(14):3853–3866. doi:10.1128/MCB.00338-09
45. Zhou L, Bryant CD, Loudon A, et al. The circadian clock gene Csnk1e regulates rapid eye movement sleep amount, and nonrapid eye movement sleep architecture in mice. Sleep. 2014;37(4):785–93,793a–793c. doi:10.5665/sleep.3590
46. Landgraf D, Wang LL, Diemer T, et al. NPAS2 Compensates for Loss of CLOCK in peripheral circadian oscillators. PLoS Genet. 2016;12(2):e1005882. doi:10.1371/journal.pgen.1005882
47. Gamble MC, Chuan B, Gallego-Martin T, et al. A role for the circadian transcription factor NPAS2 in the progressive loss of non-rapid eye movement sleep and increased arousal during fentanyl withdrawal in male mice. Psychopharmacology. 2022;239(10):3185–3200. doi:10.1007/s00213-022-06200-x
48. Bertile F, Plumel M, Maes P, et al. Daytime restricted feeding affects day-night variations in mouse cerebellar proteome. Front Mol Neurosci. 2021;14:613161. doi:10.3389/fnmol.2021.613161
49. Shirogane T, Jin J, Ang XL, et al. SCFbeta-TRCP controls clock-dependent transcription via casein kinase 1-dependent degradation of the mammalian period-1 (Per1) protein. J Biol Chem. 2005;280(29):26863–26872. doi:10.1074/jbc.M502862200
50. Wang X, Xie T, Luo J, et al. Radiomics predicts the prognosis of patients with locally advanced breast cancer by reflecting the heterogeneity of tumor cells and the tumor microenvironment. Breast Cancer Res. 2022;24(1):20. doi:10.1186/s13058-022-01516-0
51. Kirienko M, Sollini M, Corbetta M, et al. Radiomics and gene expression profile to characterise the disease and predict outcome in patients with lung cancer. Eur J Nucl Med Mol Imaging. 2021;48(11):3643–3655. doi:10.1007/s00259-021-05371-7
52. Feng Z, Li H, Liu Q, et al. CT radiomics to predict macrotrabecular-massive subtype and immune status in hepatocellular carcinoma. Radiology. 2023;307(1):e221291. doi:10.1148/radiol.221291
53. Xia TY, Zhou Z-H, Meng X-P, et al. Predicting microvascular invasion in hepatocellular carcinoma using ct-based radiomics model. Radiology. 2023;307(4):e222729. doi:10.1148/radiol.222729
54. Chen X, Tang Y, Wu D, et al. From imaging to clinical outcome: dual-region CT radiomics predicting FOXM1 expression and prognosis in hepatocellular carcinoma. Front Oncol. 2023;13:1278467. doi:10.3389/fonc.2023.1278467
55. Xin H, Lai Q, Zhou Y, et al. Noninvasive evaluation of neutrophil extracellular traps signature predicts clinical outcomes and immunotherapy response in hepatocellular carcinoma. Front Immunol. 2023;14:1134521. doi:10.3389/fimmu.2023.1134521
 © 2025 The Author(s). This work is published and licensed by Dove Medical Press Limited. The
full terms of this license are available at https://www.dovepress.com/terms
and incorporate the Creative Commons Attribution
- Non Commercial (unported, 4.0) License.
By accessing the work you hereby accept the Terms. Non-commercial uses of the work are permitted
without any further permission from Dove Medical Press Limited, provided the work is properly
attributed. For permission for commercial use of this work, please see paragraphs 4.2 and 5 of our Terms.
© 2025 The Author(s). This work is published and licensed by Dove Medical Press Limited. The
full terms of this license are available at https://www.dovepress.com/terms
and incorporate the Creative Commons Attribution
- Non Commercial (unported, 4.0) License.
By accessing the work you hereby accept the Terms. Non-commercial uses of the work are permitted
without any further permission from Dove Medical Press Limited, provided the work is properly
attributed. For permission for commercial use of this work, please see paragraphs 4.2 and 5 of our Terms.
Recommended articles

CT-Based Radiomics for the Recurrence Prediction of Hepatocellular Carcinoma After Surgical Resection
Wang F, Chen Q, Zhang Y, Chen Y, Zhu Y, Zhou W, Liang X, Yang Y, Hu H
Journal of Hepatocellular Carcinoma 2022, 9:453-465
Published Date: 23 May 2022
Delayed Hepatocellular Carcinoma Recurrence After Liver Transplantation: Comprehensive Clinical Characterization of Case Series
Wong TH, Ho CM, Hsu HH, Wu YM, Ho MC, Lee PH, Hu RH
Journal of Hepatocellular Carcinoma 2022, 9:1081-1091
Published Date: 17 October 2022
Prognostic Significance of Hemoglobin, Albumin, Lymphocyte and Platelet (HALP) Score in Hepatocellular Carcinoma
Zhou J, Yang D
Journal of Hepatocellular Carcinoma 2023, 10:821-831
Published Date: 2 June 2023
A Novel Four-Gene Signature Based on Nonsense-Mediated RNA Decay for Predicting Prognosis in Hepatocellular Carcinoma: Bioinformatics Analysis and Functional Validation
Zhao J, Wang C, Zhao L, Zhou H, Wu R, Zhang T, Ding J, Zhou J, Zheng H, Zhang L, Kong T, Zhou J, Hu Z
Journal of Hepatocellular Carcinoma 2024, 11:747-766
Published Date: 23 April 2024
Bridging the Gap Between Imaging and Molecular Characterization: Current Understanding of Radiomics and Radiogenomics in Hepatocellular Carcinoma
Ren L, Chen DB, Yan X, She S, Yang Y, Zhang X, Liao W, Chen H
Journal of Hepatocellular Carcinoma 2024, 11:2359-2372
Published Date: 27 November 2024