Back to Journals » Journal of Hepatocellular Carcinoma » Volume 11
A Novel Four-Gene Signature Based on Nonsense-Mediated RNA Decay for Predicting Prognosis in Hepatocellular Carcinoma: Bioinformatics Analysis and Functional Validation
Authors Zhao J ![]() , Wang C
, Wang C ![]() , Zhao L, Zhou H
, Zhao L, Zhou H ![]() , Wu R, Zhang T
, Wu R, Zhang T ![]() , Ding J, Zhou J, Zheng H, Zhang L, Kong T
, Ding J, Zhou J, Zheng H, Zhang L, Kong T ![]() , Zhou J, Hu Z
, Zhou J, Hu Z
Received 5 December 2023
Accepted for publication 18 April 2024
Published 23 April 2024 Volume 2024:11 Pages 747—766
DOI https://doi.org/10.2147/JHC.S450711
Checked for plagiarism Yes
Review by Single anonymous peer review
Peer reviewer comments 3
Editor who approved publication: Prof. Dr. Jörg Trojan
Jiaxin Zhao,1 Cheng Wang,1 Liang Zhao,1 Huiying Zhou,1 Rui Wu,1 Tao Zhang,1 Jiawei Ding,1 Junjie Zhou,2 Huilin Zheng,3 Lei Zhang,3 Tianci Kong,3 Jie Zhou,4 Zhenhua Hu1,4
1Department of Hepatobiliary and Pancreatic Surgery, Department of Surgery, Fourth Affiliated Hospital, School of Medicine, Zhejiang University, Yiwu, Zhejiang Province, People’s Republic of China; 2Department of Radiology, Fourth Affiliated Hospital, School of Medicine, Zhejiang University, Yiwu, Zhejiang Province, People’s Republic of China; 3Zhejiang Provincial Collaborative Innovation Center of Agricultural Biological Resource Biochemical Manufacturing, School of Biological and Chemical Engineering, Zhejiang University of Science and Technology, Hangzhou, Zhejiang Province, People’s Republic of China; 4Department of Hepatobiliary and Pancreatic Surgery, Department of Surgery, First Affiliated Hospital, School of Medicine, Zhejiang University, Hangzhou, Zhejiang Province, People’s Republic of China
Correspondence: Zhenhua Hu, Department of Hepatobiliary and Pancreatic Surgery, Department of Surgery, Fourth Affiliated Hospital, School of Medicine, Zhejiang University, Yiwu, Zhejiang Province, People’s Republic of China, Tel/Fax +86-570-89935878, Email [email protected] Jie Zhou, Department of Hepatobiliary and Pancreatic Surgery, Department of Surgery, First Affiliated Hospital, School of Medicine, Zhejiang University, Hangzhou, Zhejiang Province, People’s Republic of China, Tel +86-13429661721, Email [email protected]
Purpose: Nonsense-mediated RNA decay (NMD), a surveillance pathway for selective degradation of aberrant mRNAs, is associated with cancer progression. Its potential as a predictor for aggressive hepatocellular carcinoma (HCC) is unclear. Here, we present an innovative NMD risk model for predicting HCC prognosis.
Methods: The Cancer Genome Atlas (TCGA) data of 374 liver HCC (LIHC) and 50 normal liver samples were extracted. A risk model based on NMD-related genes was developed through least absolute shrinkage and selection operator Cox (LASSO-Cox) regression of the LIHC-TCGA data. Prognostic validation was done using GSE54236, GSE116174, and GSE76427 data. Univariate and multivariate Cox regression analyses were conducted to assess the prognostic value of the model. We also constructed nomograms for survival prediction. Tumor immune infiltration was evaluated using the CIBERSORT algorithm, and the tumor cell phenotype was assessed. Finally, mouse experiments verified UPF3B knockdown effects on HCC tumor characteristics.
Results: We developed a risk model based on four NMD-related genes (PABPC1, RPL8, SMG5, and UPF3B) and validated it using GSE54236, GSE116174, and GSE76427 data. The model effectively distinguished high- and low-risk groups corresponding to unfavorable and favorable HCC outcomes. Its prognostic prediction accuracy was confirmed through time-dependent ROC analysis, and clinical-use nomograms with calibration curves were developed. Single-cell RNA sequencing results indicated significantly higher expression of SMG5 and UPF3B in tumor cells. Knockdown of SMG5 and UPF3B inhibited HCC cell proliferation, invasion, and migration, while affecting cell-cycle progression and apoptosis. In vivo, UPF3B knockdown delayed tumor growth and increased immune cell infiltration.
Conclusion: Our NMD-related gene-based risk model can help identify therapeutic targets and biomarkers for HCC. Additionally, it assists clinicians in predicting the prognosis of HCC patients.
Keywords: nonsense-mediated RNA decay, hepatocellular carcinoma, biomarker, LASSO, survival, tumor immunity
Introduction
Cancer is a major global public health problem, with primary liver cancer being the sixth most common cancer and the third leading cause of cancer death worldwide. Primary liver cancer also demonstrates the highest incidence in transitioning countries.1 Hepatocellular carcinoma (HCC) development is associated with chronic hepatitis B or C virus infection, as well as with nonviral factors, such as iron overload syndrome, alcohol consumption, tobacco use, oral contraceptive pills, and aflatoxin exposure.2–4 A combination of ultrasound, computed tomography, magnetic resonance imaging, and serum alpha-fetoprotein measurement is conventionally used for primary diagnosis and screening of HCC.5 Conventional HCC treatment comprises surgery, chemotherapy, radiotherapy, liver transplantation, targeted therapy, and immunotherapy. Moreover, traditional Chinese medicine prescriptions have been noted to inhibit HCC cell growth and invasion potently. Emerging therapeutic approaches such as gene therapy may have potential in the treatment of HCC; relevant experimental studies have reported significant reductions in HCC cell proliferation without affecting normal hepatocyte function.6,7 Nevertheless, the prognosis of advanced HCC remains poor, highlighting the ongoing challenges related to improving outcomes in patients with HCC. Thus, methods for early diagnosis and prognosis prediction of HCC warrant development.
Biomarkers for early diagnosis of HCC may influence the treatment options for liver cancer considerably.8 Thus, many studies have investigated early biomarkers for liver cancer and prognosis prediction, making this an emerging, prominent research area. HCC exhibits considerable heterogeneity in terms of molecular characteristics and clinical manifestations.9 Therefore, research on biomarkers for early diagnosis and prognosis of HCC, as well as those for potential therapeutic targets for HCC, is highly relevant to improving overall HCC prognosis. An ideal biomarker for HCC should assist clinicians in detecting the disease early, exhibit high sensitivity and specificity, and be noninvasive and easily accessible. Such a biomarker may enable early HCC diagnosis and facilitate effective HCC treatment strategy implementation.10 Consequently, validating new, reliable biomarkers for HCC may aid in identifying novel targets for diagnostic or prognostic prediction of the disease. Through improvement of their early HCC detection and prognosis prediction accuracy, these biomarkers may improve overall survival (OS) rates in patients with HCC.
In cells, genetic information is transmitted from DNA to proteins through tightly regulated transcription and translation processes. Maintaining fidelity of these processes is essential for genetic stability and proper function of the cells. As such, cells have evolved various surveillance pathways to ensure mRNA accuracy; one of these pathways is called nonsense-mediated RNA decay (NMD).11 NMD is a translation-dependent quality control mechanism that scrutinizes mRNAs for errors possibly resulting in the formation of features, such as premature termination codons (PTCs), that trigger NMD activation. NMD involves selective degradation of faulty mRNA transcripts, which leads to the prevention of aberrant protein production and maintenance of gene expression fidelity.12 Being an RNA monitoring pathway operating at the transcription–translation interface, NMD has been extensively investigated in various model systems in organisms, such as yeast, Caenorhabditis elegans, Drosophila, and mice, as well as human cells.13 Recent studies have highlighted the significant effects of NMD dysregulation on cancer development and progression. NMD selectively downregulates tumor-suppressor gene (TSG) expression and maintains oncogene integrity, resulting in an imbalance in gene expression, which eventually promotes tumorigenesis and cancer progression.14 NMD has a regulatory role in the progression of genetic disorders, such as vascular hemophilia and retinitis pigmentosa. In these conditions, the deterioration of the pathway involved in NMD can exacerbate the conditions’ phenotype by triggering the expression of NMD-sensitive transcripts encoding functional proteins.15,16 Notably, several investigations have elucidated the pivotal role of NMD in the pathogeneses of various malignancies, including breast cancer and familial adenomatous polyposis. Furthermore, mutations in major TSGs such as BRCA1, BRCA2, TP53, RB203, and WT1 can potentially induce NMD activation, contributing to malignant tumor development.17,18 Impairments in NMD functionality, primarily attributable to decreased expression of the crucial protein UPF1, contribute to dysregulation of SMAD7 expression and aberrant mRNA surveillance mechanisms in HCC.19 Through upregulation of the UPF1/2 and SMG1/6/7 expression, NMD plays a crucial role in regulating microsatellite instability (MSI), a colorectal cancer initiation and progression biomarker.20 Some drugs may inhibit the progression and improve the prognosis of cancer by targeting the NMD pathway; these drugs include homoharringtonine, NMDI-1, as well as small-molecule drugs, which are already in use for cancer treatment or under investigation in clinical trials.21–23 However, the NMD mechanisms underlying the development and prognosis of HCC remain unclear. Herein, we, for the first time, propose an NMD risk model, for elucidating the prognostic significance of NMD in HCC patients. Our results may improve the current understanding of the roles of NMD-mediated gene regulation in HCC, as well as cancer in general, and facilitate the exploration of potential therapeutic interventions.
Materials and Methods
Data Access and Normalization
We extracted and used the RNA sequencing (RNA-seq) data of 50 normal liver tissue and 374 liver HCC (LIHC) samples from The Cancer Genome Atlas (TCGA) database (https://portal.gdc.cancer.gov/) for gene expression analysis. We also used gene expression data in the clinical data files GSE54236, GSE116174, and GSE76427 from the Gene Expression Omnibus (GEO) database (https://www.ncbi.nlm.nih.gov/geo/). To ensure data comparability and remove potential batch effects, we performed batch normalization by using the R package “sva” (version 4.2.1). This step enabled adjustments for all systematic differences between the datasets and enhancement of the reliability of our subsequent analyses. By applying batch normalization, we could minimize unwanted variations due to technical factors and focus on biological variations of interest.
NMD-Related Gene Identification
We retrieved NMD-related gene data from the Gene Set Enrichment Analysis (GSEA) database. Moreover, we performed a comprehensive differential expression analysis of TCGA data on the NMD-related genes in 50 normal liver and 374 LIHC samples by using the R package “DESeq2.” Here, 15 DEGs, with statistical significance (P < 0.05) and a minimum optimal fold change (FC) [|log (FC)| ≥ 0.585], were identified. Next, we used the R packages “ComplexHeatmap” and “ggplot2” to generate heatmaps and volcano plots, respectively. To explore potential protein-protein interactions (PPIs) among the identified NMD-related genes, we used data from the STRING database (https://cn.string-db.org/). We set a minimum required interaction score of 0.4 (ie, medium confidence) to ensure the reliability of our PPI analysis. Finally, alterations in the selected genes in liver cancer data were analyzed using cBioPortal (https://www.cbioportal.org/).
HCC Prognosis–Related Gene Identification
We performed univariate Cox regression analysis by using the R package “survival.” The significance of the relationship between NMD-related gene expression and OS in patients with HCC was assessed, with P < 0.05 considered the screening threshold. Next, we applied least absolute shrinkage and selection operator (LASSO) Cox regression. LASSO Cox regression is typically used for survival analysis, particularly to identify variables with a significant impact on survival outcomes. Specifically, the Cox proportional hazards model is used for assessing the effects of variables on survival time or time to an event, and the LASSO is employed for selecting features and regularizing the model. Because LASSO Cox regression facilitates the identification of crucial prognostic variables and the construction of corresponding risk models, it has been extensively applied in clinical and biological research, particularly in cancer studies, for discovering potential prognostic biomarkers and building prediction models. We used this method to account for gene covariance and reduce the number of modeled genes, facilitating the identification of a subset of NMD-related genes most strongly associated with OS in the LIHC samples. Finally, we performed multivariate Cox regression analysis based on the results of univariate Cox regression.
Construction and Validation of Our Risk Model Based on NMD-Related Genes
We calculated the risk scores by using centralized and standardized mRNA expression data from the LIHC training set. The patients were stratified into high- and low-risk groups based on the median risk scores in this study. To gain insights into the relationships between variables and correlation and risk heatmaps were generated using the R packages “Psych” and “pheatmap.” To validate our risk model’s prognostic value for HCC, we plotted Kaplan–Meier (K-M) curves by using the survival analysis functions of the R package “survival.” These curves provided valuable information regarding the survival rates of the different LIHC risk groups. Receiver operating characteristic (ROC) curves were used to assess the predictive value of our risk models regarding HCC prognosis. Principal component analysis (PCA) and t-distributed stochastic neighbor embedding (tSNE) were used to evaluate our risk model’s validity. Furthermore, univariate and multivariate Cox regression analyses were performed to determine the independent prognostic value of our risk model. Nomogram plots were generated using the R package “rms”, specifically for TCGA dataset. Finally, we used calibration curves to assess the nomogram plots’ accuracy.
GSEA and Single-Cell RNA-Seq Analysis
We performed GSEA to identify the biological processes and signaling pathways differing between the high- and low-risk groups in our TCGA-LIHC cohort, with the C2 (c2.cp.kegg.v7.5.1.symbols.gmt) and C5 (c5.go.v2023.2.Hs.symbols.gmt) subcollections as our reference gene sets. To assess the statistical significance of our findings, we performed 1000 permutation analyses and established a threshold for significance at P < 0.05 (NOM-p < 0.05, FDR-q < 0.05, FWER-p < 0.05). We analyzed SMG5 and UPF3B expression in liver cancer cells using single-cell RNA-seq (scRNA-seq) data from the liver cancer database VGDS (http://vgds.bitlife.com.cn/), the first multidimensional data analysis platform integrating bulk RNA-seq, scRNA-seq, and literature data.
Analysis of Tumor Mutation Burden and Immune Characteristics
The tumor microenvironment plays a significant role in the behavior of neoplastic cells and their response to drug treatments. Tumor mutation burden (TMB) is a factor affecting the immunological response of cancer cells.24 Here, we used the CIBERSORT algorithm to compute the contents of immune cell subpopulations in TCGA-LIHC samples.
Single-sample GSEA was then used to compare the variations in the range of immune cell and function types. We evaluated the mutation frequency of patients with HCC in the two risk groups using the R package “maftools.” The top 20 genes with the highest mutation frequency were selected, and a waterfall diagram was plotted to describe the mutation. We also combined the mutation data with the survival data to obtain the relationship between our risk model, transformation, and survival.
Cell Culture
We procured the human HCC cell lines MAHLAVU and Huh-7 from the American Type Culture Collection (Manassas, VA, USA). The cells were cultured in Dulbecco’s modified Eagle medium (DMEM; Gibco, USA) supplemented with 10% fetal bovine serum (Procell, USA) and 1% penicillin–streptomycin solution (containing 10,000 U/mL of penicillin and 10 mg/mL streptomycin; VivaCell) at 37 °C under 5% CO2 in a humidified atmosphere.
Cell Transfection
We seeded the cultured cells in 6-well plates at 2×10⁵ cells per well and incubated at 37 °C under 5% CO2 in a humidified atmosphere for 24 h until 70% confluency was reached. Subsequently, complete DMEM was replaced with serum-free DMEM, and siRNA transfection was performed using Lipofectamine 3000, according to the manufacturer’s instructions. The siRNAs used for UPF3B and SMG5 knockdown were as follows:
- si-UPF3B-1: 5′-GGACAAAUUAAAGGAUGAATT-3′
- si-UPF3B-2: 5′-GGUCAAGAGAGAUCGAAUATT-3′
- si-SMG5-1: 5′-GCCGCUUCAUUGUCAUCAUTT-3′
- si-SMG5-2: 5′-GGCCUUUGAUGCUGAAACATT-3′
We also used si-NC for transfection control.
Western Blotting
To investigate the potential influence of UPF3B and SMG5 on cellular protein expression, we lysed cells treated with si-NC and siRNAs against the genes by incubating them with a 100:1 mixture of RIPA buffer (Beyotime, China) and phenylmethylsulfonyl fluoride (EpiZyme, China) for 5 min on ice. The cells were scraped off using a cell scraper, and the protein samples were then diluted with a loading buffer (Beyotime, China). The proteins were denatured by heating the extracted proteins at 95 °C for 15 min and cooling them rapidly on ice before use. Subsequently, the proteins were separated through sodium dodecyl sulfate polyacrylamide gel electrophoresis and transferred onto polyvinylidene fluoride membranes. The membrane was blocked for 3 h and then incubated with relevant primary antibodies (Abcam, UK) at 4 °C overnight. Finally, to detect and identify the protein bands, we incubated the membranes with a relevant secondary antibody (Proteintech, China) for 2 h.
Cell Counting Kit-8 and Colony Formation Assays
To investigate the effects of gene regulation on cell proliferation, we conducted Cell Counting Kit-8 (CCK-8) assay on Huh-7 cells treated with si-NC and siRNAs against the target genes. In brief, the cells were seeded in 96-well plates at a density of 3,000 cells per well, with three replicates per group. At 0, 24, 48, and 72 h, 10 µL of CCK-8 reagent (Beyotime, China) was added to each well, followed by incubation at 37 °C for 2 h. Next, cell viability was assessed on the basis of absorbance at 450 nm.
Huh-7 cells were also seeded in a six-well plate at 500 cells per well in droplets. Next, 3 mL of medium was added to each well, and the plate was monitored regularly. By day 12, the plate demonstrated cell colony formation. The colonies were fixed using methanol for 30 min and stained with crystal violet (Beyotime).
Wound Healing Scratch Test and Transwell Assay
To evaluate the migration capability of our HCC cells, the cells were seeded onto a 12-well plate and incubated for 24 h. Next, a scratch was made in the cell monolayer using a 10-μL pipette tip, and the debris generated during scratching was removed using phosphate-buffered saline. Subsequently, 1 mL of serum-free DMEM was added to each well, and images of the gaps created were captured under a microscope. Cell migration was observed at 0 and 48 h after scratch creation, and the analysis of cell migration was performed using Image J.
Moreover, approximately 50,000 cells from each group were seeded into the upper chamber of transwell plates (Corning, USA), and 500 μL of complete DMEM was added to the lower chamber of the plates, followed by incubation for 48 h. Next, the cells were fixed with methanol for 30 min and then stained with crystal violet for 20 min.
Nude Mouse Model of Tumor Implantation
Our animal experiment protocol was evaluated by the Ethical Review Committee for Laboratory Animal Welfare of Zhejiang University (approval number: ZJU20230416), following the guidelines of “Guidelines for Ethical Review of Animal Welfare (GBT 35892–2018)”.
Male C57BL/6 nude mice were purchased from Jicuiyaokang Company (Jiangsu, China) and treated using an experimental method reported previously.25 In brief, each mouse was injected with 2×10⁶ Hepa1-6 cells (n = 3 mice/group). After 5 days, 5 nmol of si-UPF3B (in 50 µL of 0.9% NaCl) was injected into the cancerous tissues of each mouse once every 3 days for 2 weeks. After approximately 2 weeks, all mice were killed, and their tumors were resected and weighed.
Flow Cytometry Assay
A cell-cycle staining kit (MULTI SCIENCES) was employed for our flow cytometry analysis. To prepare the samples, 1×10⁶ cells were mixed with 1 mL of a DNA staining solution and 10 μL of a permeabilization solution. The mixture was thoroughly mixed through vortexing for 5–10 s. This was followed by incubation at room temperature for 30 min in the dark. Cell apoptosis was assessed through Annexin V-FITC/PI dual staining, followed by flow cytometry analysis on the BD FACSCanto II System (BD, USA).
The method used here to prepare single-cell suspensions from mouse tumors is described elsewhere.26 In brief, mice were sacrificed 14 days after the treatments; the tumors were cut into pieces, digested, and suspended. Next, the suspensions were filtered using a 70-μm nylon mesh filter. Next, the Zombie Aqua Fixable Viability Kit was used for cell membrane staining and then incubated with flow cytometry antibodies against CD45 and CD3. Finally, the sample was filtered again through a 40-μm nylon filter to obtain single-cell suspensions. These suspensions were assessed through flow cytometry on the BD FACSCanto II System.
Statistical Analysis
All statistical analyses were performed using R (version 4.2.1) and GraphPad Prism (version 8). Between-group differences were assessed using the t-test and the Mann–Whitney U-test. Survival analyses were performed using K-M curves, Log rank tests, and Cox proportional hazards regression models. Correlations were assessed using the Spearman correlation test. Cell-cycle outcomes were analyzed using Flow Jo (version 10). Each experiment was repeated three times. In general, a P value of <0.05 was considered to indicate statistical significance; moreover, ***and *** were used to denote statistical significance at P values of <0.05, <0.01, and <0.001, respectively.
Results
NMD-Related Gene Screening
Figure 1 illustrates the flow of this study, aimed at identifying a novel NMD-based gene signature for predicting HCC prognosis. We collected 424 data samples from TCGA database (374 LIHC and 50 normal liver tissues). We also obtained 117 NMD-related genes from the GSEA dataset and identified 15 DEGs using the DESeq2 package, with |Log (FC)| ≥ 0.585 and P < 0.05 as thresholds (Figure 2A and B). Figure S1 presents the Gene Ontology (GO) terms and Kyoto Encyclopedia of Genes and Genomes (KEGG) pathways enriched in the 15 DEGs. The PPI network of these 15 genes is illustrated in Figure 2C.
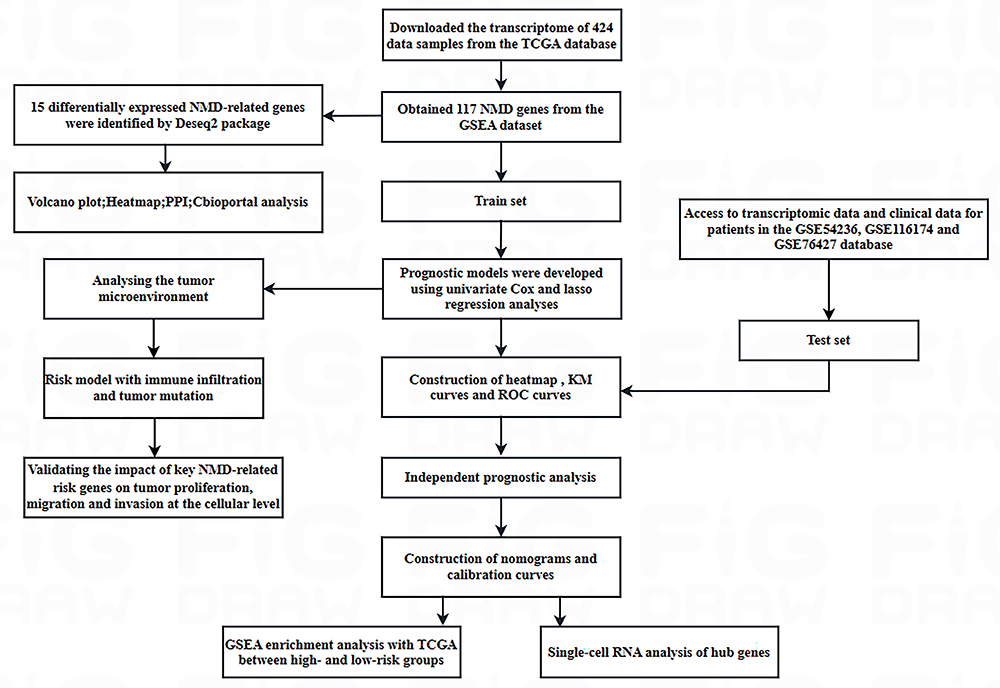 |
Figure 1 Flow of this study. |
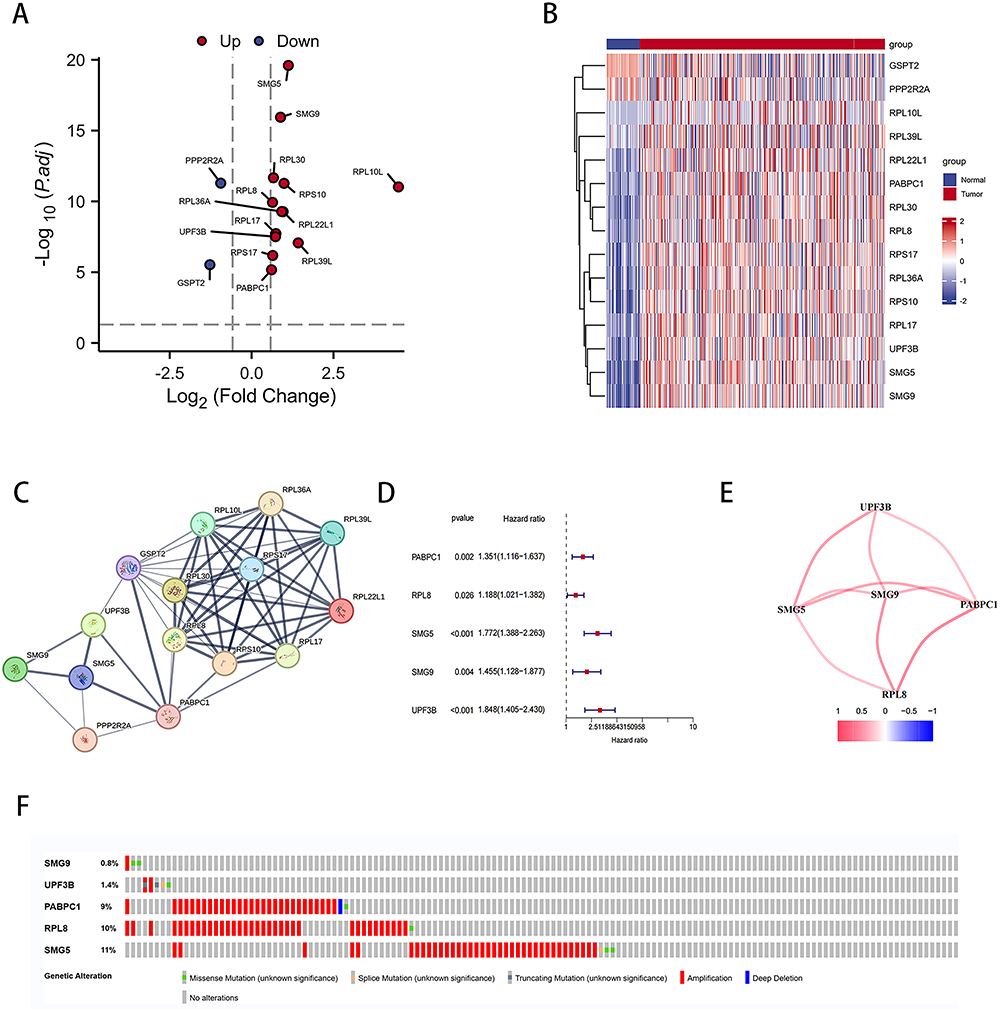 |
Figure 2 NMD-related genes expressed differentially between LIHC and normal liver tissues. (A) Volcano plot of NMD-related DEGs. (B) Heatmap of NMD-related DEGs. (C) PPI network of interactions among NMD-related genes (interaction score = 0.4). (D) Univariate Cox regression analysis of NMD-related DEGs. (E) Interaction of five DEGs. (F) Mutation analysis of five NMD-related DEGs. |
Through univariate Cox regression analysis, we identified five genes associated with HCC prognosis (Figure 2D). Figure 2E presents the interrelationship among these five genes. Furthermore, LIHC samples (Figure 2F) were noted to express these five genes predominantly in their amplified forms.
Construction of Our Risk Model Based on NMD-Related Genes
To investigate the prognostic value of NMD-related genes in patients with HCC, we conducted comprehensive transcriptomic and clinical data analyses of TCGA data through LASSO Cox regression. Consequently, we selected the four most optimal candidate genes and included them in the final risk model (Figure 3A and B and Table S1):
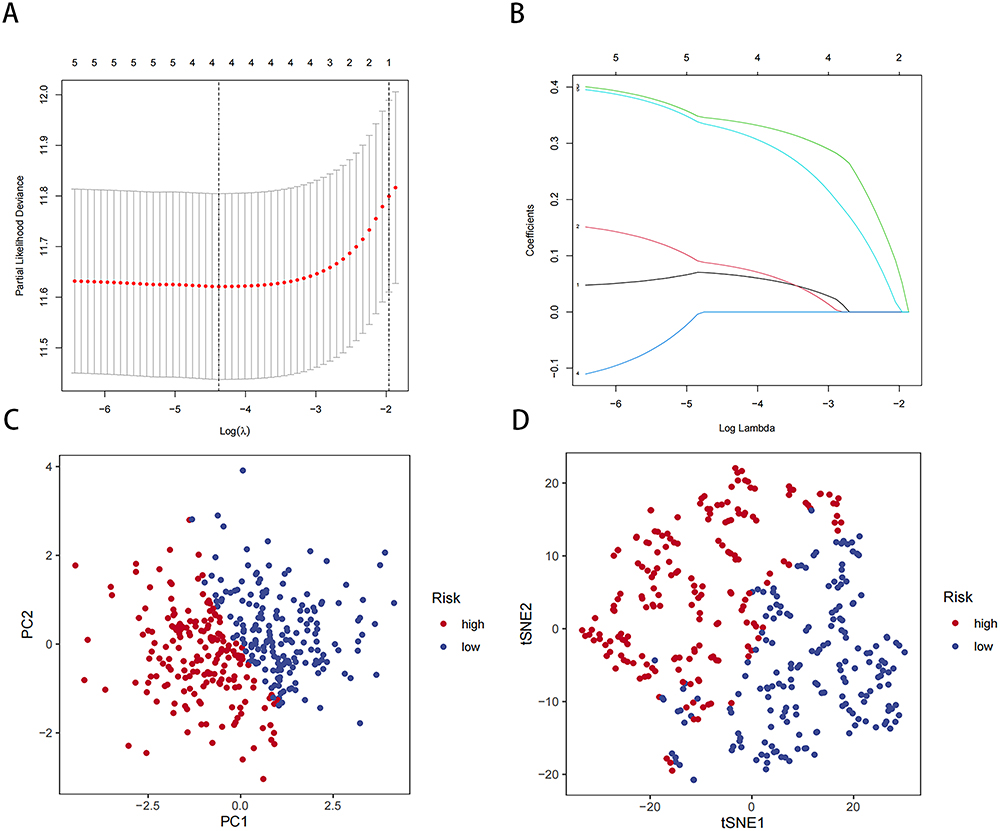 |
Figure 3 Construction of our risk model based on NMD-related genes in the TCGA-LIHC cohort. (A) LASSO regression of four OS-related genes. (B) Cross-validation for tuning parameter selection in LASSO regression. (C) PCA of our risk model. (D) tSNE analysis of our risk model. |
Risk Score = (0.0662 × PABPC1 expression) + (0.0811 × RPL8 expression) + (0.3401 × SMG5 expression) + (0.3232 × UPF3B expression)
The expression of all four genes demonstrated predictive value for HCC prognosis (Figure S2A–D). Next, we divided the LIHC samples into a high-risk group, comprising those with risk scores higher than the median, and a low-risk group, comprising those with risk scores lower than the median. To evaluate our risk model’s performance, we performed PCA and tSNE on TGCA-LIHC data (Figure 3C and D). The results demonstrated that our model effectively distinguished the LIHC samples based on their risk levels. Thus, our risk model may accurately stratify patients with HCC based on their genetic risk profiles.
Validation of the Prognostic Value of Our Risk Model
To evaluate the prognostic value of our HCC risk model, we performed K-M survival analysis on the high- and low-risk groups within TCGA-LIHC data. Notably, the results revealed a significant difference in OS between the two groups: it was significantly lower in the high-risk group than in the low-risk group (Figure 4A). The risk curves and scatter plots further demonstrated a positive correlation between risk scores and mortality rates in patients with HCC (Figure 4C and E). Additionally, the ROC curve analysis confirmed the accuracy and reliability of our risk model in predicting HCC prognosis (Figure 4G).
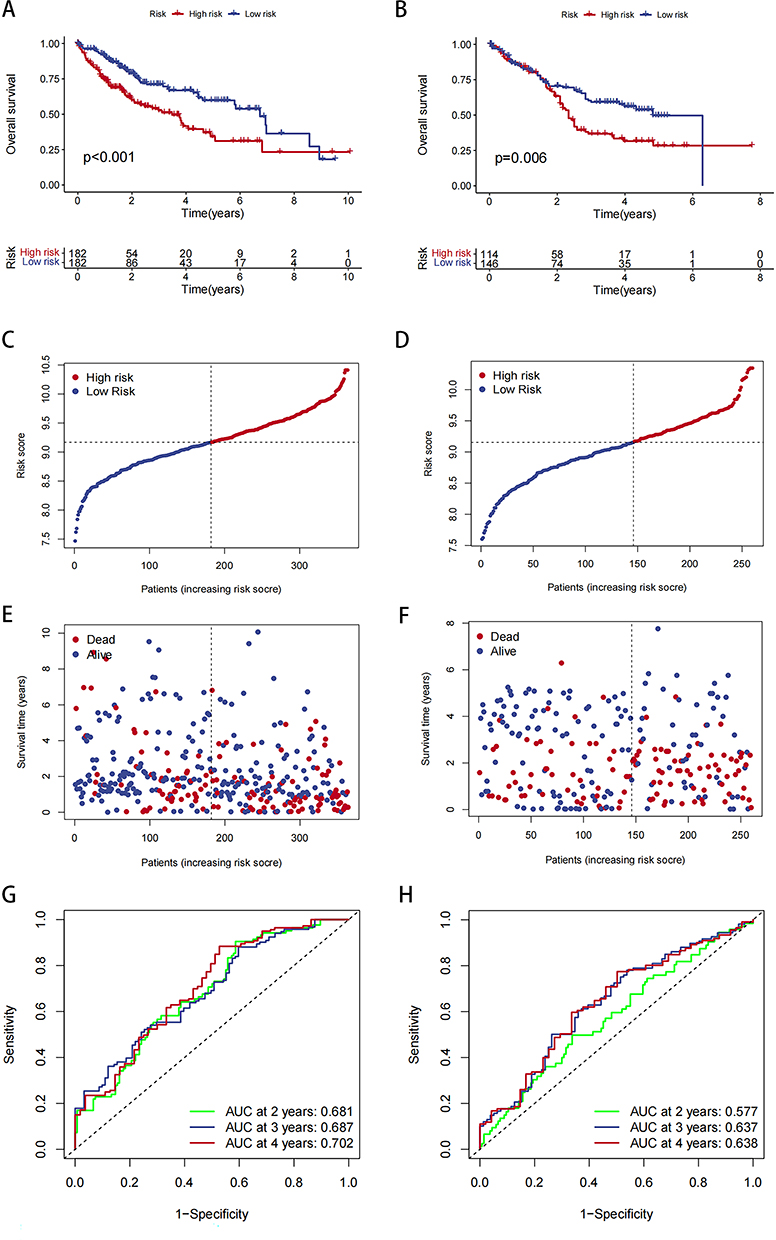 |
Figure 4 Analysis of risk model and survival. (A) Survival curve for TCGA-LIHC data in high- and low-risk groups. (B) Survival curve for GEO-LIHC data in high- and low-risk groups. (C and D) Distribution of risk scores and the risk profile. (E and F) Distribution of risk scores and the survival status. (G and H) ROC curve analysis. |
Next, we performed prognostic validation using data from the GEO datasets GSE54236, GSE116174, and GSE76427. We first assessed data distribution before and after normalization through PCA, and the results demonstrated that the data were comparable after normalization (Figures S3 and S4). For these dataset data, the K-M survival analysis, risk curves, and scatter plots also indicated a positive correlation between risk scores and mortality in patients with HCC (Figure 4B, D and F). Moreover, the ROC curves substantiated the considerable predictive ability of the risk scores (Figure 4H). Therefore, our risk model demonstrated a robust prognostic potential, suggesting its utility in predicting HCC prognosis accurately.
Independent Prognostic Analysis of Our Risk Model and Clinical Characteristics
We performed a clinical correlation analysis to assess our risk model’s clinical relevance further. Table S2 lists the clinical data of high- and low-risk group patients. Our findings revealed no significant differences in the risk score based on gender (P = 0.65) and age (P = 0.92), indicating that our risk model was not influenced by gender or age (Figure 5A and 5B). Therefore, we did not consider age and gender as confounders in our risk model based on NMD-related genes. In contrast, the risk score was strongly and positively correlated with the tumor stage; in other words, the higher the risk score, the more advanced may be the tumor stage (Figure 5C). Notably, no significant differences were noted for stage IV HCC, possibly because of the small sample size, which led to statistical errors.
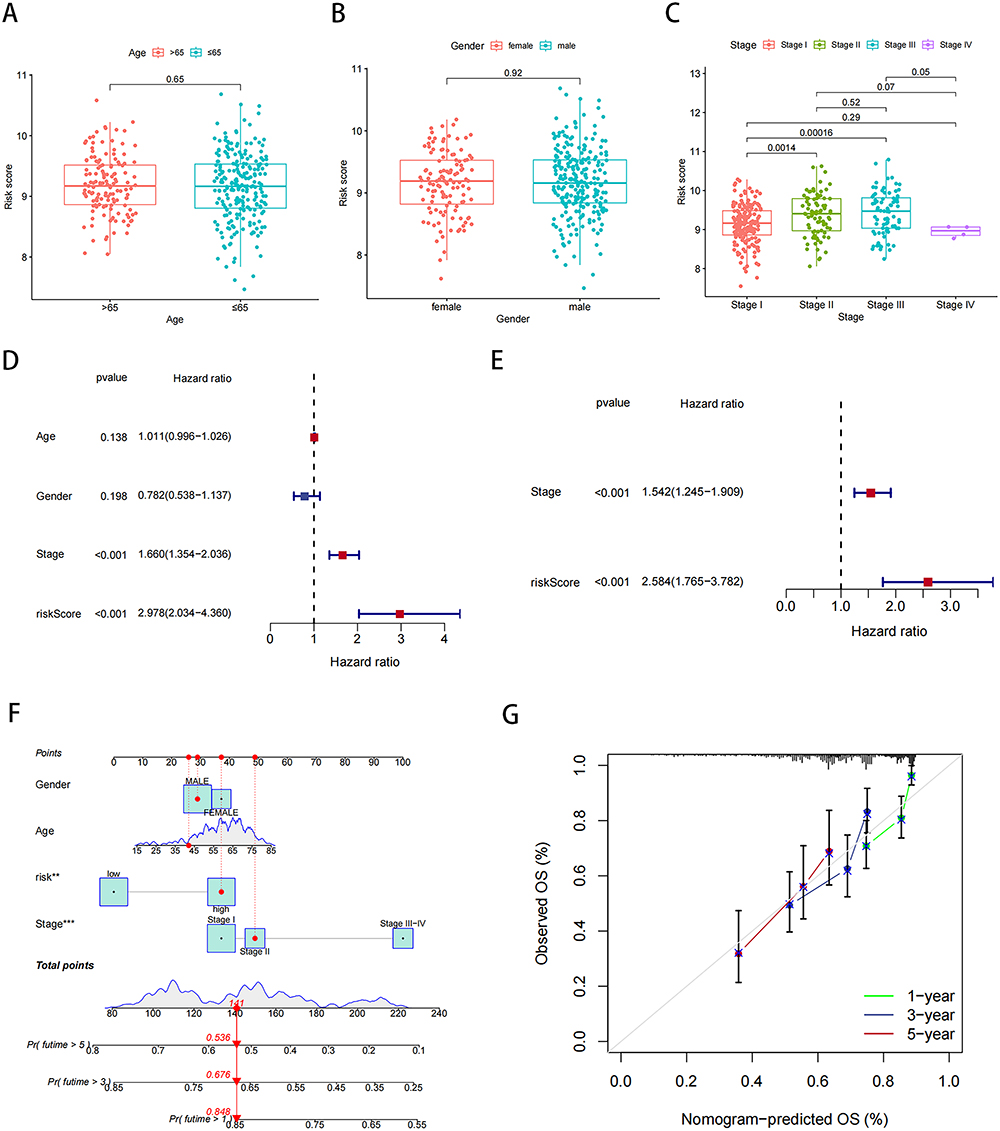 |
Figure 5 Our risk model and clinical correlation analysis. (A) Correlation analysis of risk scores and age. (B) Correlation analysis of risk scores and gender. (C) Correlation analysis of risk scores and stage. (D and E) Univariate and multivariate Cox analysis of risk scores in liver cancer data. (F) Nomogram combining risk score with pathologic features. (G) Calibration plots for predicting 1-, 3-, and 5-year OS of HCC patients. **P < 0.01, ***P < 0.001. |
Next, univariate and multivariate Cox regression analyses were performed to evaluate the prognostic value of our risk model. In the univariate Cox regression analysis, the hazard ratio [HR; 95% confidence interval (CI)] for the risk score was 2.978 (2.034–4.360); therefore, a higher risk score may be associated with a significantly higher risk of poor prognosis (P < 0.001; Figure 5D). In the multivariate analysis, the HR (95% CI) for the risk score was 2.584 (1.765–3.782), which further confirmed the independent prognostic value of the risk scores (P < 0.001; Figure 5E).
To facilitate the application of our risk model in clinical practice, we developed a nomogram combining risk scores and clinicopathologic parameters to predict the survival rates of patients with HCC at 1, 3, and 5 years (Figure 5F). The calibration curves demonstrated that the nomogram exhibited good agreement between predicted and actual survival rates, indicating the high predictive ability of the nomogram (Figure 5G). Then, we correlated NMD scores with sorafenib IC50 values and found a significant association. Patients with high NMD expression had lower sorafenib IC50 scores, suggesting increased sensitivity and potentially better treatment outcomes (Figure S5).
Taken together, the aforementioned results collectively highlighted our model’s clinical utility and predictive accuracy for HCC. These findings have major implications for personalized treatment strategies and outcome prediction in patients with HCC.
GSEA and scRNA-Seq Analysis for NMD-Related Genes in High-Risk HCC Patients
To investigate the functional enrichment of NMD-related genes in high-risk HCC patients, we conducted GSEA. As shown in Figure 6A, these were the top 10 enriched KEGG pathways in the high-risk HCC patients: basal transcription factors, cell cycle, neurotrophin signaling pathway, oocyte meiosis, progesterone-mediated oocyte maturation, pyrimidine metabolism, regulation of autophagy, RNA degradation, spliceosome, and ubiquitin-mediated proteolysis. Moreover, as shown in Figure 6B, these were the top 10 enriched GO terms pathways in the high-risk HCC patients: DNA-templated transcription initiation, mRNA catabolic process, negative regulation of amide metabolic process, positive regulation of mRNA metabolic process, regulation of mRNA catabolic process, regulation of mRNA metabolic process, RNA catabolic process, RNA destabilization, mRNA 3′ untranslated region (UTR) binding, and translation regulator activity. We also performed scRNA analysis on SMG5 and UPF3B expression; as shown in Figure 6C and D, HCC cells, particularly in those from patients with metastasis, demonstrated significant overexpression of SMG5 and UPF3B.
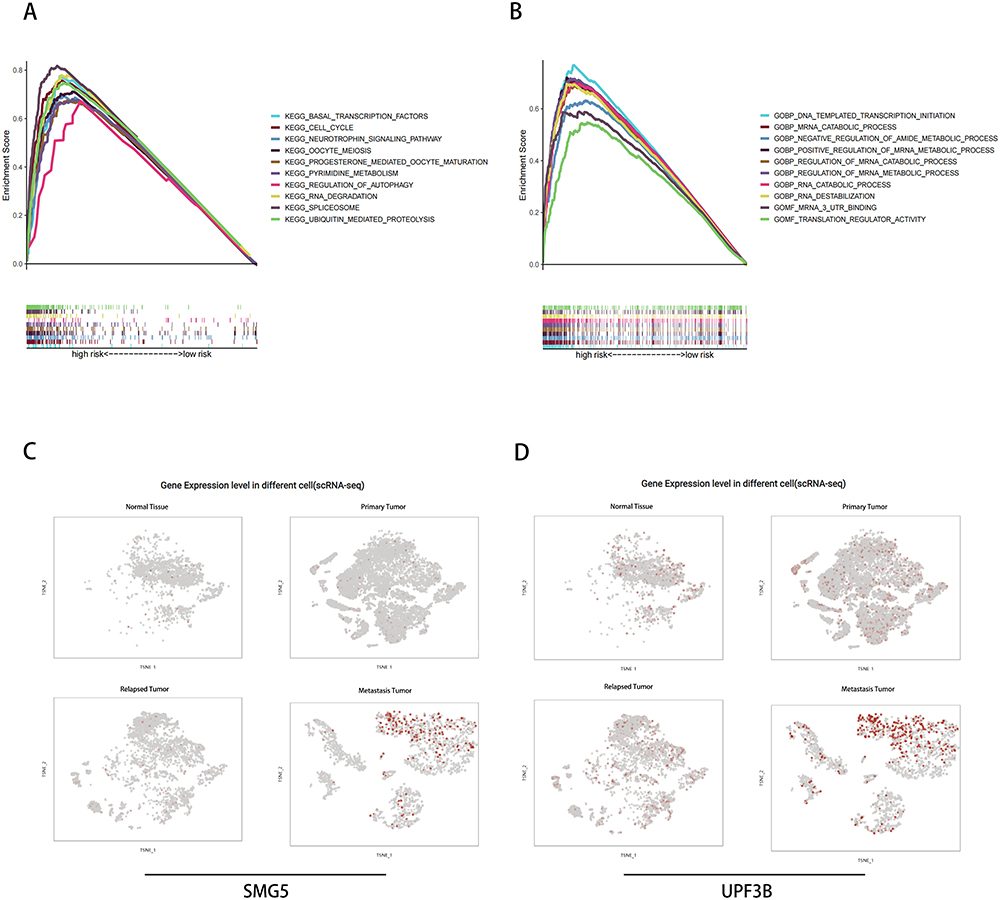 |
Figure 6 (A and B) GSEA and (C and D) scRNA-seq analysis of SMG5 and UPF3B. |
Immune Infiltration and TMB in High-Risk HCC Patients
The TME is critical for cancer progression, particularly for tumor immunity. We further investigated the association between immune infiltration and NMD. As shown in Figure 7A, the risk score was significantly and negatively correlated with mast cells, neutrophils, natural killer (NK) cells, and helper and regulatory T cells. Moreover, the risk score demonstrated a significant negative correlation with chemokine receptors, cytolytic activity, and type I and II interferon responses (Figure 7B). These findings collectively suggested that high-risk HCC patients exhibit an immune profile favoring tumor deterioration.
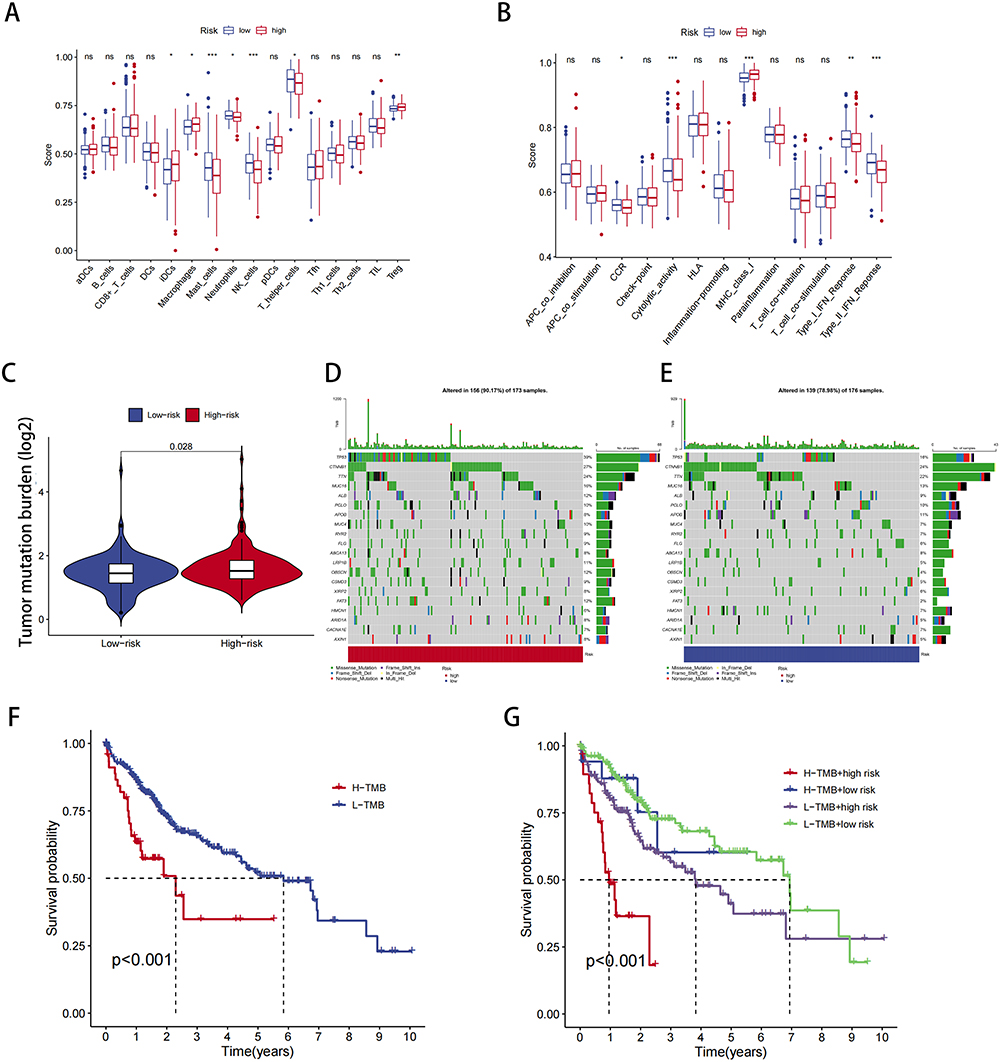 |
Figure 7 TME and immune cell infiltration analysis. (A) Proportion of immune cell infiltration in high- and low-risk groups. (B) Proportion of immune cell function in high- and low-risk groups. (C) Relationship between model scores and TMB scores. (D and E) Mutation frequency for top 20 genes in high- and low-risk groups. (F and G) Survival analysis of TMB combined with the risk score. *P < 0.05, **P < 0.01, ***P < 0.001; ns, not significant. |
We also investigated the relationship between TMB and the risk score. The results demonstrated that as the risk score increased, the TMB also increased (Figure 7C). Notably, the high-risk group displayed a significantly higher TP53 mutation rate (Figure 7D and E). Subsequently, we evaluated patient survival by combining TMB and the risk score. The results revealed that patients with a high mutation rate had a poor prognosis (Figure 7F); moreover, within the high-risk group, a high mutation rate was associated with the worst survival outcomes (Figure 7G).
Effects of SMG5 and UPF3B Knockdown on HCC Cell Proliferation, Migration, and Invasion
To explore the role of NMD in HCC cells, we targeted SMG5 and UPF3B, two of the four pivotal genes involved in NMD. First, we knocked down the expression of SMG5 and UPF3B in the HCC cell lines MAHLAVU and Huh7 and verified the knockdown efficiency through Western blotting (Figure 8A). Next, we investigated the influence of SMG5 and UPF3B on HCC cell proliferation by using CCK-8 assays. Our findings revealed that at 24, 48, and 72 h, SMG5 and UPF3B knockdown significantly reduced proliferation in HCC cells compared with the si-NC-treated cells group (Figure 8B). Furthermore, HCC cells with SMG5 and UPF3B knockdown demonstrated a substantial reduction in the clonogenic potential in the colony formation assay (Figure 8C), a considerable decline in the invasive ability in the transwell assay (Figure 8D and E), and a notable decrease in the migratory ability the wound healing scratch test (Figure 8F–I).
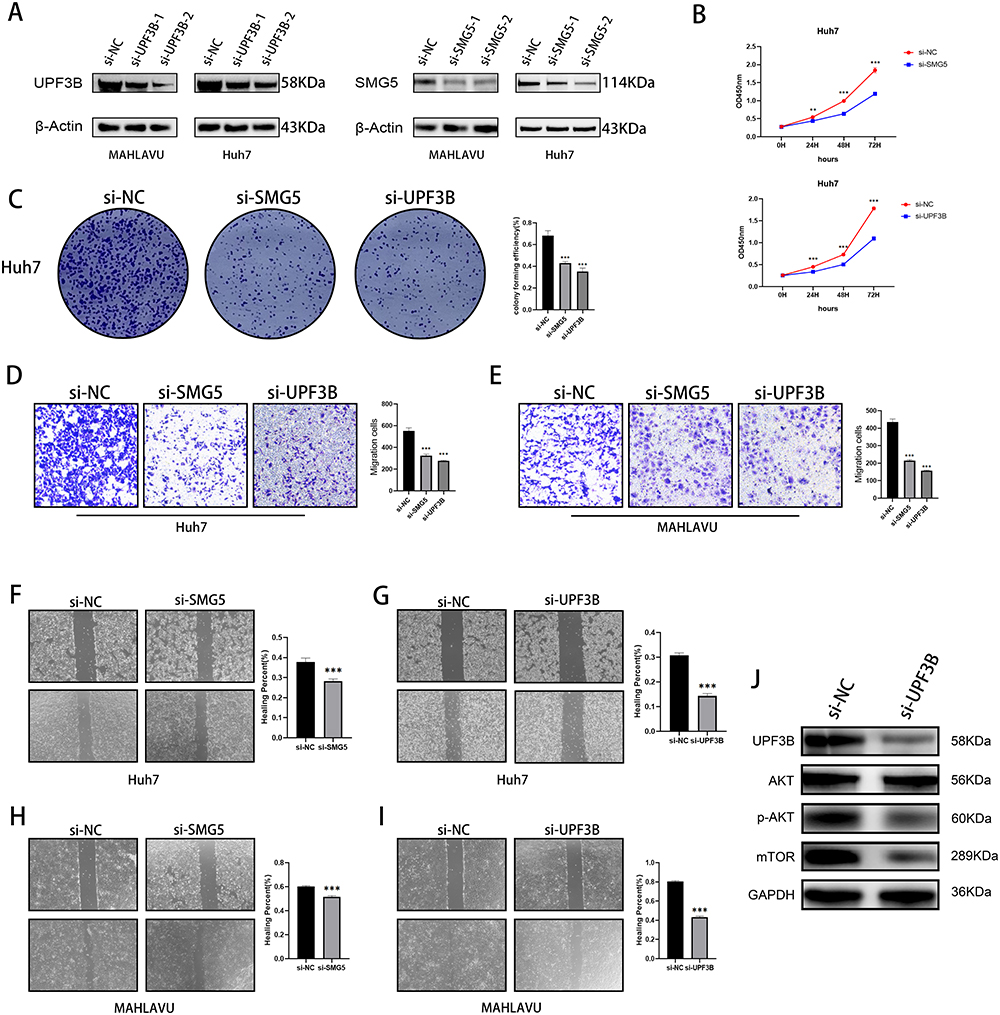 |
Figure 8 Effects of knockdown of key NMD-related genes on cancer cell migration, invasion, and proliferation. (A) Western blotting for SMG5 and UPF3B knockdown efficiency. (B) CCK-8 and (C) colony formation assay illustrating decreases in proliferation ability of Huh-7 cells after SMG5 and UPF3B knockdown. (D and E) Transwell assay showing decreases in invasive ability of MAHLAVU and Huh-7 cells after SMG5 and UPF3B knockdown. (F–I) Wound healing scratch test illustrating decreases in mobility of MAHLAVU and Huh-7 cells after SMG5 and UPF3B knockdown. (J) The changes in protein levels of the mTOR signaling pathway after knockdown of UPF3B. **P < 0.01, ***P < 0.001. |
Moreover, the GSEA results demonstrated that the mTOR pathway met the following criteria: NOM-p < 0.05, FDR-q < 0.05, and FWER-p < 0.05. Consequently, we validated the pathway by focusing on UPF3B, which demonstrated the most significant phenotype in our experiments. The results demonstrated that UPF3B knockdown significantly inhibited the mTOR pathway, suggesting that UPF3B has a tumor-promoting role via the mTOR pathway (Figure 8J).
Taken together, these results indicate the potential involvement of NMD-related genes such as SMG5 and UPF3B in the regulation of HCC cell proliferation, clonogenicity, invasion, and migration and confirm the role of key NMD-related genes in HCC progression.
Effects of SMG5 and UPF3B Knockdown on Apoptosis and Cell Cycle in HCC Cells
To further elucidate the function of essential NMD-related genes in HCC progression, we performed flow cytometry and assessed the effects of SMG5 and UPF3B knockdown on cell cycle and apoptosis in HCC cells. Our results revealed that SMG5 and UPF3B knockdown significantly prolonged the G2 phase of the cell cycle, indicating that the growth of the HCC cells was blocked at the G2 phase, further delaying cell proliferation (Figure 9A and B). Moreover, our cell apoptosis analysis demonstrated that SMG5 and UPF3B knockdown considerably increased the apoptosis rate in HCC cells (Figure 9C and D). Therefore, through cell-cycle inhibition and apoptosis pathway alteration, SMG5 and UPF3B potentially underlie the expression of various phenotypes in HCC cells. These results provide further insights into the mechanisms underlying NMD’s involvement in HCC pathogenesis and may aid in developing more targeted therapies for the devastating disease.
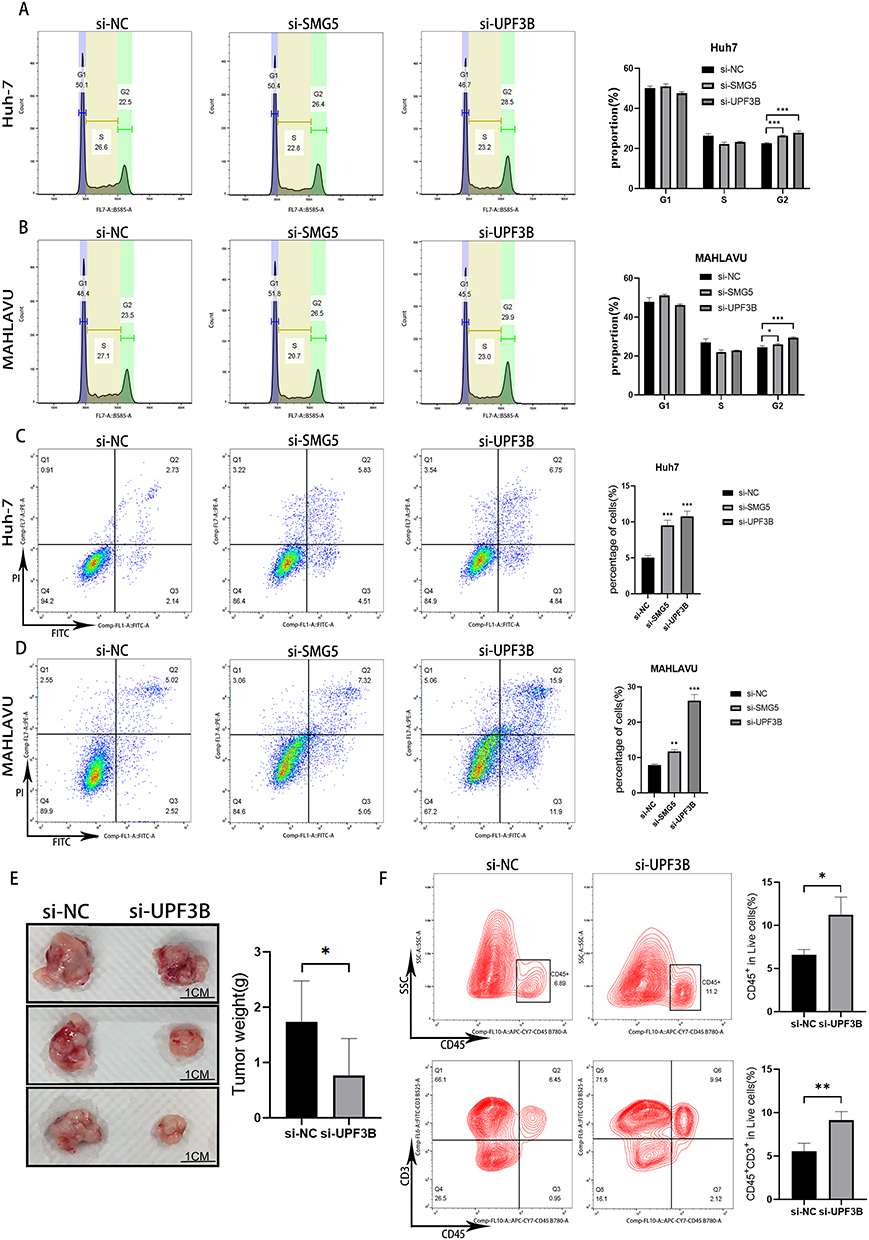 |
Figure 9 Tumor cell cycle and apoptosis after SMG5 and UPF3B knockdown. (A and B) Changes in the cell cycle of Huh7 and MAHLAVU cells after si-SMG5 and si-UPF3B treatment. (C and D) Changes in apoptosis in Huh7 and MAHLAVU cells after si-SMG5 and si-UPF3B treatment. (E) Tumor weights and representative photographs of resected tumors at sacrifice (n = 3 per group). (F) Percentage of viable tumor-infiltrating CD45+ immune cells and T cells (CD45+CD3+). *P < 0.05, **P < 0.01, ***P < 0.001. |
Effects of UPF3B Knockdown on Tumor Growth and Immune Infiltration
To evaluate the potential anticancer immune effects of UPF3B knockdown on the HCC cell line Hepa1-6, we subcutaneously implanted the cells in the right flank of C57BL/6 nude mice. After 5 days, the mice were randomly divided into two groups. After the tumor diameter reached 6–8 mm, the treatment group received an initial injection of 5 nM si-UPF3B (in 50 μL of 0.9% NaCl) every 3 days over 2 weeks. Next, the tumors were excised, weighed, and photographed; the results are presented in Figure 9E. Subsequently, single-cell suspensions were obtained from the tumors and subjected to flow cytometry for viable tumor-infiltrating CD45+ and CD45+CD3+ immune cells; the results revealed a significant elevation in the number of CD45+ immune cells and CD45+CD3+ immune cells in the tumors of the UPF3B knockdown group (Figure 9F).
Discussion
HCC, which represents a prevailing form of liver cancer, is associated with a substantial global health burden.27 Despite recent scientific advancements and resulting increases in patient survival rates, the efficacy of liver cancer treatments remains low. As such, the need to investigate molecular mechanisms underlying HCC progression is increasing.28 Aberrant gene expression is a major factor involved in HCC progression; this highlights the significance of exploring the associated molecular pathways.29 NMD is a conserved RNA degradation pathway, in which RNAs containing truncating mutations, such as nonsense, frameshift, and specific splice-site mutations, are targeted selectively and their translation is terminated prematurely.30 Recent studies have emphasized the vital role of NMD in cancer progression. For instance, mutations in UPF1, a crucial gene involved in NMD, are significantly associated with pancreatic squamous carcinoma prognosis.31 Moreover, NMD inhibition can reduce tumorigenicity in human fibrosarcoma cells.32 Therefore, in the present study, we established a novel HCC risk model based on the four major NMD-related genes PABPC1, RPL8, SMG5, and UPF3B, which can aid in predicting prognosis and guiding treatment in patients with HCC. In particular, we used LASSO-Cox regression analysis to construct our risk model, and it demonstrated a substantial predictive value for HCC prognosis. We then combined our risk model and clinical parameters to construct a nomogram, which also demonstrated high predictive value. Our model is the first-ever risk model constructed for a liver disease based on NMD-related genes.
PABPC1 promotes cell proliferation and metastasis by regulating COL12A1 expression in pancreatic adenocarcinoma.33 Furthermore, PABPC1 expression is downregulated in several malignant gliomas, and therefore, it may be a predictor of preneural subtypes of gliomas; notably, in patients with glioma, high PABPC1 expression is significantly associated with a favorable prognosis.34 In contrast, our risk model indicated that increased PABPC1 expression is associated with poor HCC prognosis. RPL8 is a potential candidate gene associated with poor prognosis and immune infiltration in HCC. RPL8, a ribosomal subunit protein, plays essential roles in protein synthesis and cell growth regulation.35
SMG5 and UPF3B are key genes related to NMD. In the NMD pathway, SMG5 plays a crucial role by participating in SMG1C complex formation and interacting with other NMD factors, which eventually leads to degradation of aberrant mRNAs. In particular, by regulating SMG6 endonuclease activity, SMG5 facilitates PTC-containing mRNA recognition and degradation, thus maintaining gene expression integrity. Therefore, in the NMD pathway, SMG5 is essential for its contribution to cell quality control and gene expression.36 SMG5 may be differentially expressed in several cancers, and it may be significantly correlated with low-grade glioma prognosis, immune microenvironment, and immune checkpoints.37 SMG5 promotes UPF1 dephosphorylation by recruiting protein phosphatase 2A, and the phosphorylation–dephosphorylation cycle is essential for NMD activity.38 Independent of its association with the exon junction complex, UPF3B facilitates NMD activation. Furthermore, targeted inhibition of UPF3B expression could be a potential therapeutic strategy for diseases caused by nonsense mutations, thereby restoring regular gene expression and protein function.39,40 UPF3B expression is significantly correlated with the pathological staging of several cancer types, including esophageal carcinoma, renal chromophobe, HCC, and skin cutaneous melanoma. Furthermore, in many cancer types, higher UPF3B transcript levels are associated with significantly poorer prognoses.41 However, no study has reported the crucial roles of SMG5 and UPF3B in hepatocarcinogenesis and progression by using a risk model based on NMD-related genes.
Next, we confirmed the significant proliferative, migratory, and invasive roles of SMG5 and UPF3B in HCC cells through in vitro experiments. The results also confirmed that these genes promote HCC, indicating that they are regulated by NMD and are integral to shaping the TME conducive to HCC cell growth; in other words, their expression is associated with poor HCC prognosis. Furthermore, we assessed the cell cycle analysis and apoptosis in HCC cells by exploring the pathways through which SMG5 and UPF3B promote HCC proliferation. The results demonstrated that SMG5 and UPF3B promote HCC cell proliferation through G2 cell-cycle arrest induction and apoptosis inhibition.
The mTOR pathway is overexpressed in nearly 50% of patients with HCC, and the dysregulated activation of this pathway affects a wide range of processes, including cell proliferation, metabolism, tumor cell differentiation, lipid metabolism, autophagy, and epithelial–mesenchymal transition.42 We noted that UPF3B knockdown significantly inhibited the mTOR pathway; in other words, our result, for the first time, indicated that UPF3B may influence HCC progression by modulating the mTOR pathway. In general, our novel insights into the roles of the key NMD-related genes SMG5 and UPF3B in HCC development and progression may facilitate the development of targeted therapies for HCC.
Our GSEA results revealed that the high-risk HCC group had significant enrichments in the pathways related to basal transcription factors, cell cycle, RNA degradation, and spliceosome, as well as in the processes related to regulation of mRNA catabolic process, RNA destabilization, mRNA 3′-UTR binding, and translation regulator activity. Moreover, our scRNA-seq analysis results indicated that NMD-related gene expression was significantly higher in patients with highly malignant tumors than in other patients. These results confirmed that mRNA degradation in the high-risk HCC group is regulated significantly differently from that in the low-risk HCC group.
In tumors, NMD inhibition can enhance tumor immunity. Tumor cells can evade the immune system mainly because they do not express the potent tumor rejection antigens. The antigenicity of disseminated tumors may be increased through NMD inhibition; this may lead to the induction of new concentrated antigenic expression on tumor cells and eventually to immune recognition and rejection.43 A study reduced NMD activity in the breast cancer cells of mice through knockdown of UPF2, a critical factor involved in NMD; the results demonstrated that reducing NMD activity led to production of novel mRNA isoforms and NMD-sensitive transcripts, which encode tumor neoantigens in breast cancer cells.44 Moreover, studies have explored whether NMD affects tumor inflammation by inhibiting the NMD pathway in tumor cells; they noted tumor inflammation induction, which improved the cells’ responses to immune checkpoint blockade.45 Cancer cells can use the NMD pathway to downregulate essential TSGs and adapt to an aggressive immune microenvironment by adjusting the NMD activity.46 However, NMD plays two roles in tumor development: (1) Cancer cells use NMD to reduce TSG expression by selecting for mutations leading to transcriptome disruption. (2) Cancer cells adapt to changes in the TME by adjusting NMD activity.
In the current study, the high-risk group demonstrated poorer levels of cancer immunity: the numbers of mast cells, neutrophils, NK cells, and helper and regulatory T cells were relatively low, and the responses to cytotoxicity and interferon were relatively poor. Patients with lower cytotoxicity responses demonstrated lower 5-year survival rates than those with higher cytotoxicity responses.47 Moreover, type I interferons can block cell-cycle progression, induce apoptosis, facilitate clearance, and prevent metastasis.48 Therefore, in our high-risk group, the dysregulated mRNA decay created an immune microenvironment more suitable for cancer progression, which led to poor HCC prognosis. Furthermore, the results of our in vivo experiments demonstrated that the immune infiltration levels in HCC tissues increased after UPF3B knockdown, further confirming the close association between NMD and the TME.
NMD frequently leads to TSG mutations that promote cancer development. In other words, TSGs represent the most pertinent gene class associated with NMD. Inactivating the function of TSGs such as TP53, RB1, or PTEN can lead to unrestrained tumor growth via various mechanisms (eg, overriding cell-cycle control). This is because TSGs act as “brakes” in tumorigenesis, and loss of their function can contribute to cancer development.49,50 In the current study, we observed a strong correlation between NMD and TP53 mutations in the high-risk HCC groups. TP53, a well-known TSG, plays a crucial role in regulating cell-cycle control and preventing cancer development. Our results indicated that an increase in the expression of NMD-related genes may lead to an increase in the TP53 mutation rate, potentially leading to cell-cycle control override and tumor growth promotion. To explore its prognostic significance further, we integrated our risk model based on NMD-related genes with tumor mutation load and survival analysis. Notably, the high-risk and high-mutation groups demonstrated the most unfavorable prognosis. Therefore, a combination of NMD-based high-risk status with increased TMB may be a valuable prognostic indicator in HCC. Our findings enhance the current understanding of the molecular mechanisms underlying cancer development and may have implications for the identification of potential prognostic markers and therapeutic targets for HCC.
Our results offered valuable insights into the roles of SMG5 and UPF3B in HCC cells in vitro and indicated that UPF3B, a critical NMD-related gene, can enhance tumor immune infiltration in vivo. However, this study has a limitation: we did not characterize the phenotypes of immune cells. Future studies should, therefore, focus on elucidating immune cell phenotypes specific to NMD in HCC; their results may enhance the current understanding of NMD’s role in the TME and systemic interactions in HCC.
In conclusion, we reported a novel risk model based on NMD-related genes for the prediction of HCC prognosis. Furthermore, through functional enrichment analysis and in vivo experiments, we have elucidated the promoting role of crucial NMD-related genes in HCC progression and their impact on HCC immunity. Our results enhance the current understanding of the promotional role of NMD in HCC, potentially enabling the development of strategies for improved prognosis prediction and personalized treatment of patients with cancer in the future.
Data Sharing Statement
The datasets used in this study can be found in the Cancer Genome Atlas (TCGA) and Gene Expression Omnibus (GEO) databases. The data for this study are available in the Cancer Genome Atlas (https://portal.gdc.cancer.gov/repository?facetTab=files); GSE54236, GSE116174 and GSE76427 datasets are available from the following website (https://www.ncbi.nlm.nih.gov/).
Ethics Approval and Consent to Participate
This study involved in the sample information and clinical data are from the TCGA database (https://portal.gdc.cancer.gov/) and the GEO database (https://www.ncbi.nlm.nih.gov/geo/); the liver cancer cells were purchased from Wuhan Pricella Biotechnology Co., Ltd. The above study meets the conditions for exemption from ethical review in the Measures for Ethical Review of Life Sciences and Medical Research Involving Human Beings in China, so we obtained an ethical review exemption from the Human Research Ethics Committee of the Fourth Affiliated Hospital of Zhejiang University School of Medicine. The animal study has been evaluated by the Laboratory Animal Welfare Ethics Review Committee of Zhejiang University.
Acknowledgments
We acknowledge TCGA, GEO and VGDS database for providing their meaningful data.
Author Contributions
All authors made a significant contribution to the work reported, whether that is in the conception, study design, execution, acquisition of data, analysis and interpretation, or in all these areas; took part in drafting, revising or critically reviewing the article; gave final approval of the version to be published; have agreed on the journal to which the article has been submitted; and agree to be accountable for all aspects of the work.
Funding
This study was supported by National key research and development program (2022YFA1104600), Key Research and Development Program of Zhejiang Province (No.2020C03057), Key Science and Technology Program of Zhejiang Province (No. WKJ-ZJ-1818).
Disclosure
The authors declare no competing interests in this work.
References
1. Sung H, Ferlay J, Siegel RL, et al. Global cancer statistics 2020: GLOBOCAN estimates of incidence and mortality worldwide for 36 cancers in 185 countries. CA Cancer J Clin. 2021;71(3):209–249. doi:10.3322/caac.21660
2. Center MM, Jemal A. International trends in liver cancer incidence rates. Cancer Epidemiol Biomarkers Prev. 2011;20(11):2362–2368. doi:10.1158/1055-9965.EPI-11-0643
3. Van Thiel DH, Ramadori G. Non-viral causes of hepatocellular carcinoma. J Gastrointest Cancer. 2011;42(4):191–194. doi:10.1007/s12029-010-9195-3
4. Vogel A, Meyer T, Sapisochin G, et al. Hepatocellular carcinoma. Lancet. 2022;400(10360):1345–1362. doi:10.1016/S0140-6736(22)01200-4
5. Forner A, Reig M, Bruix J. Hepatocellular carcinoma. Lancet. 2018;391(10127):1301–1314. doi:10.1016/S0140-6736(18)30010-2
6. Li JJ, Liang Q, Sun GC. Traditional Chinese medicine for prevention and treatment of hepatocellular carcinoma: a focus on epithelial-mesenchymal transition. J Integr Med. 2021;19(6):469–477. doi:10.1016/j.joim.2021.08.004
7. Ran G, Feng X-L, Xie Y-L, et al. The use of miR122 and its target sequence in adeno-associated virus-mediated trichosanthin gene therapy. J Integr Med. 2021;19(6):515–525. doi:10.1016/j.joim.2021.09.004
8. Xing M, Wang X, Kirken R, et al. Immunodiagnostic biomarkers for hepatocellular carcinoma (HCC): the first step in detection and treatment. Int J Mol Sci. 2021;22(11):6139. doi:10.3390/ijms22116139
9. Nault JC, Villanueva A. Intratumor molecular and phenotypic diversity in hepatocellular carcinoma. Clin Cancer Res. 2015;21(8):1786–1788. doi:10.1158/1078-0432.CCR-14-2602
10. Tsuchiya N, Sawada Y, Endo I, et al. Biomarkers for the early diagnosis of hepatocellular carcinoma. World J Gastroenterol. 2015;21(37):10573–10583. doi:10.3748/wjg.v21.i37.10573
11. Popp MW, Maquat LE. Nonsense-mediated mRNA decay and cancer. Curr Opin Genet Dev. 2018;48:44–50. doi:10.1016/j.gde.2017.10.007
12. Kurosaki T, Popp MW, Maquat LE. Quality and quantity control of gene expression by nonsense-mediated mRNA decay. Nat Rev Mol Cell Biol. 2019;20(7):406–420. doi:10.1038/s41580-019-0126-2
13. Nickless A, Bailis JM, You Z. Control of gene expression through the nonsense-mediated RNA decay pathway. Cell Biosci. 2017;7:26. doi:10.1186/s13578-017-0153-7
14. Lindeboom RGH, Vermeulen M, Lehner B, et al. The impact of nonsense-mediated mRNA decay on genetic disease, gene editing and cancer immunotherapy. Nat Genet. 2019;51(11):1645–1651. doi:10.1038/s41588-019-0517-5
15. Schneppenheim R, Budde U, Obser T, et al. Expression and characterization of von Willebrand factor dimerization defects in different types of von Willebrand disease. Blood. 2001;97(7):2059–2066. doi:10.1182/blood.V97.7.2059
16. Nogueira G, Fernandes R, García-Moreno JF, et al. Nonsense-mediated RNA decay and its bipolar function in cancer. Mol Cancer. 2021;20(1):72. doi:10.1186/s12943-021-01364-0
17. Bala S, Kraus C, Wijnen J, et al. Multiple products in the protein truncation test due to alternative splicing in the adenomatous polyposis coli (APC) gene. Hum Genet. 1996;98(5):528–533. doi:10.1007/s004390050254
18. Anczuków O, Ware MD, Buisson M, et al. Does the nonsense-mediated mRNA decay mechanism prevent the synthesis of truncated BRCA1, CHK2, and p53 proteins? Hum Mutat. 2008;29(1):65–73. doi:10.1002/humu.20590
19. Chang L, Li C, Guo T, et al. The human RNA surveillance factor UPF1 regulates tumorigenesis by targeting Smad7 in hepatocellular carcinoma. J Exp Clin Cancer Res. 2016;35(1):8. doi:10.1186/s13046-016-0286-2
20. Nagar P, Islam MR, Rahman MA. Nonsense-mediated mRNA decay as a mediator of tumorigenesis. Genes. 2023;14(2):357. doi:10.3390/genes14020357
21. Durand S, Cougot N, Mahuteau-Betzer F, et al. Inhibition of nonsense-mediated mRNA decay (NMD) by a new chemical molecule reveals the dynamic of NMD factors in P-bodies. J Cell Biol. 2007;178(7):1145–1160. doi:10.1083/jcb.200611086
22. Iwatani-Yoshihara M, Ito M, Ishibashi Y, et al. Discovery and characterization of a eukaryotic initiation factor 4A-3-selective inhibitor that suppresses nonsense-mediated mRNA decay. ACS Chem Biol. 2017;12(7):1760–1768. doi:10.1021/acschembio.7b00041
23. Zhao J, Li Z, Puri R, et al. Molecular profiling of individual FDA-approved clinical drugs identifies modulators of nonsense-mediated mRNA decay. Mol Ther Nucleic Acids. 2022;27:304–318. doi:10.1016/j.omtn.2021.12.003
24. Jardim DL, Goodman A, de Melo Gagliato D, et al. The challenges of tumor mutational burden as an immunotherapy biomarker. Cancer Cell. 2021;39(2):154–173. doi:10.1016/j.ccell.2020.10.001
25. Zhang H, Xia Y, Wang F, et al. Aldehyde dehydrogenase 2 mediates alcohol-induced colorectal cancer immune escape through stabilizing PD-L1 expression. Adv Sci. 2021;8(10):2003404. doi:10.1002/advs.202003404
26. Tian Z, Hong B, Chen J, et al. Combination of radiofrequency ablation with resiquimod to treat hepatocellular carcinoma via inflammation of tumor immune microenvironment and suppression of angiogenesis. Front Oncol. 2022;12:891724. doi:10.3389/fonc.2022.891724
27. Li X, Ramadori P, Pfister D, et al. The immunological and metabolic landscape in primary and metastatic liver cancer. Nat Rev Cancer. 2021;21(9):541–557. doi:10.1038/s41568-021-00383-9
28. Sun HC, Zhu XD. Downstaging conversion therapy in patients with initially unresectable advanced hepatocellular carcinoma: an overview. Front Oncol. 2021;11:772195. doi:10.3389/fonc.2021.772195
29. Nault JC, Villanueva A. Biomarkers for hepatobiliary cancers. Hepatology. 2021;73(1):115–127. doi:10.1002/hep.31175
30. Tan K, Stupack DG, Wilkinson MF. Nonsense-mediated RNA decay: an emerging modulator of malignancy. Nat Rev Cancer. 2022;22(8):437–451. doi:10.1038/s41568-022-00481-2
31. Liu C, Karam R, Zhou Y, et al. The UPF1 RNA surveillance gene is commonly mutated in pancreatic adenosquamous carcinoma. Nat Med. 2014;20(6):596–598. doi:10.1038/nm.3548
32. Nasif S, Colombo M, Uldry A-C, et al. Inhibition of nonsense-mediated mRNA decay reduces the tumorigenicity of human fibrosarcoma cells. NAR Cancer. 2023;5(3):zcad048. doi:10.1093/narcan/zcad048
33. Yao W, Yao Y, He W, et al. PABPC1 promotes cell proliferation and metastasis in pancreatic adenocarcinoma by regulating COL12A1 expression. Immun Inflamm Dis. 2023;11(7):e919. doi:10.1002/iid3.919
34. Wang Q, Wang Z, Bao Z, et al. PABPC1 relevant bioinformatic profiling and prognostic value in gliomas. Future Oncol. 2020;16(1):4279–4288. doi:10.2217/fon-2019-0268
35. Fan S, Zhang S, Kong D, et al. Integrative multi-omics analysis of identified ferroptosis-marker RPL8 as a candidate oncogene correlates with poor prognosis and immune infiltration in liver cancer. Comb Chem High Throughput Screen. 2023;26(7):1298–1310. doi:10.2174/1386207325666220823122942
36. Boehm V, Kueckelmann S, Gerbracht JV, et al. SMG5-SMG7 authorize nonsense-mediated mRNA decay by enabling SMG6 endonucleolytic activity. Nat Commun. 2021;12(1):3965. doi:10.1038/s41467-021-24046-3
37. Yang L. Pan-cancer analysis of the prognostic and immunological role of SMG5: a biomarker for cancers. Oncology. 2023;2023:1.
38. Anders KR, Grimson A, Anderson P. SMG-5, required for C. elegans nonsense-mediated mRNA decay, associates with SMG-2 and protein phosphatase 2A. EMBO j. 2003;22(3):641–650. doi:10.1093/emboj/cdg056
39. Huang L, Low A, Damle SS, et al. Antisense suppression of the nonsense mediated decay factor Upf3b as a potential treatment for diseases caused by nonsense mutations. Genome Biol. 2018;19(1):4. doi:10.1186/s13059-017-1386-9
40. Yi Z, Arvola RM, Myers S, et al. Mammalian UPF3A and UPF3B can activate nonsense-mediated mRNA decay independently of their exon junction complex binding. EMBO j. 2022;41(10):e109202. doi:10.15252/embj.2021109202
41. Xu J, Ma H, Shan B. Up-Frameshift Suppressor 3 as a prognostic biomarker and correlated with immune infiltrates: a pan-cancer analysis. PLoS One. 2022;17(10):e0273163. doi:10.1371/journal.pone.0273163
42. Matter MS, Decaens T, Andersen JB, et al. Targeting the mTOR pathway in hepatocellular carcinoma: current state and future trends. J Hepatol. 2014;60(4):855–865. doi:10.1016/j.jhep.2013.11.031
43. Pastor F, Kolonias D, Giangrande PH, et al. Induction of tumour immunity by targeted inhibition of nonsense-mediated mRNA decay. Nature. 2010;465(7295):227–230. doi:10.1038/nature08999
44. Zhang Y, Xie X, Yeganeh PN, et al. Immunotherapy for breast cancer using EpCAM aptamer tumor-targeted gene knockdown. Proc Natl Acad Sci U S A. 2021;118:9.
45. Meraviglia-Crivelli D, Villanueva H, Menon AP, et al. A pan-tumor-siRNA aptamer chimera to block nonsense-mediated mRNA decay inflames and suppresses tumor progression. Mol Ther Nucleic Acids. 2022;29:413–425. doi:10.1016/j.omtn.2022.07.017
46. Pawlicka K, Kalathiya U, Alfaro J. Nonsense-Mediated mRNA decay: pathologies and the potential for novel therapeutics. Cancers. 2020;12(3):765. doi:10.3390/cancers12030765
47. Wakiyama H, Masuda T, Motomura Y, et al. Cytolytic Activity (CYT) score is a prognostic biomarker reflecting host immune status in hepatocellular carcinoma (HCC). Anticancer Res. 2018;38(12):6631–6638. doi:10.21873/anticanres.13030
48. Lazear HM, Schoggins JW, Diamond MS. Shared and Distinct Functions of Type I and Type III Interferons. Immunity. 2019;50(4):907–923. doi:10.1016/j.immuni.2019.03.025
49. Lindeboom RG, Supek F, Lehner B. The rules and impact of nonsense-mediated mRNA decay in human cancers. Nat Genet. 2016;48(10):1112–1118. doi:10.1038/ng.3664
50. Supek F, Lehner B, Lindeboom RGH. To NMD or not to NMD: nonsense-Mediated mRNA decay in cancer and other genetic diseases. Trends Genet. 2021;37(7):657–668. doi:10.1016/j.tig.2020.11.002
 © 2024 The Author(s). This work is published and licensed by Dove Medical Press Limited. The
full terms of this license are available at https://www.dovepress.com/terms
and incorporate the Creative Commons Attribution
- Non Commercial (unported, 3.0) License.
By accessing the work you hereby accept the Terms. Non-commercial uses of the work are permitted
without any further permission from Dove Medical Press Limited, provided the work is properly
attributed. For permission for commercial use of this work, please see paragraphs 4.2 and 5 of our Terms.
© 2024 The Author(s). This work is published and licensed by Dove Medical Press Limited. The
full terms of this license are available at https://www.dovepress.com/terms
and incorporate the Creative Commons Attribution
- Non Commercial (unported, 3.0) License.
By accessing the work you hereby accept the Terms. Non-commercial uses of the work are permitted
without any further permission from Dove Medical Press Limited, provided the work is properly
attributed. For permission for commercial use of this work, please see paragraphs 4.2 and 5 of our Terms.
Recommended articles
Identification of KRBA1 as a Potential Prognostic Biomarker Associated with Immune Infiltration and m6A Modification in Hepatocellular Carcinoma
Liu Y, Fu B, Yu Z, Song G, Zeng H, Gong Y, Ding Y, Huang D
Journal of Hepatocellular Carcinoma 2022, 9:497-516
Published Date: 31 May 2022
Trial Designs for Integrating Novel Therapeutics into the Management of Intermediate-Stage Hepatocellular Carcinoma
Su YY, Liu YS, Hsiao CF, Hsu C, Chen LT
Journal of Hepatocellular Carcinoma 2022, 9:517-536
Published Date: 2 June 2022
Apolipoprotein E: A Potential Prognostic and Diagnostic Biomarker for Hepatocellular Carcinoma
Li Y, Lu R, Abuduhailili X, Feng Y
Journal of Hepatocellular Carcinoma 2025, 12:301-324
Published Date: 17 February 2025
Prognostic Significance of Elevated Platelet Count (>200 x 10^9 per L) in BCLC Stages B and C of Hepatocellular Carcinoma: A Retrospective Multicenter Analysis
Munker S, Rodriguez I, Bernhart K, Ben Khaled N, Findik M, Siegmund LK, Ye L, Reiter FP, Roessler D, Nasseh D, Balcar L, Pomej K, Scheiner B, Weiss C, Pinter M, Seidensticker M, Mayerle J, Philipp AB, De Toni EN
Journal of Hepatocellular Carcinoma 2025, 12:855-864
Published Date: 5 May 2025
Construction of 3D Enhanced CT Radiomics-Based Model to Predict Circadian Gene Expression and Prognosis in Hepatocellular Carcinoma
Zhao J, Zhou H, Wang C, Zhang W, Pang Y, Zheng H, Zhang L, Zhou J, Hu Z
Journal of Hepatocellular Carcinoma 2025, 12:2989-3009
Published Date: 25 December 2025