Back to Journals » Cancer Management and Research » Volume 13
BBOX1-AS1 Accelerates Nasopharyngeal Carcinoma Progression by Sponging miR-3940-3p and Enhancing KPNA2 Upregulation
Received 30 June 2021
Accepted for publication 7 November 2021
Published 8 December 2021 Volume 2021:13 Pages 9049—9062
DOI https://doi.org/10.2147/CMAR.S327211
Checked for plagiarism Yes
Review by Single anonymous peer review
Peer reviewer comments 3
Editor who approved publication: Professor Harikrishna Nakshatri
Haihua Jiang, Qinglong He, Tingyan Liu
Department of Otolaryngology Head and Neck Surgery, Yantai Affiliated Hospital of Binzhou Medical College, Yantai, Shandong, 264100, People’s Republic of China
Correspondence: Tingyan Liu
Department of Otolaryngology Head and Neck Surgery, Yantai Affiliated Hospital of Binzhou Medical College, No. 717, Jinbu Street, Muping District, Yantai, Shandong, 264100, People’s Republic of China
Tel +86 15963566075
Fax +86 0535-4770853
Email [email protected]
Background: Upregulation of lncRNA BBOX1 antisense RNA 1 (BBOX1-AS1) has been examined in various tumors. However, its role in nasopharyngeal carcinoma (NPC) remains poorly understood.
Methods: RT-qPCR was performed to measure the expression of BBOX1-AS1, KPNA2, and miR-3940-3p. In vitro assays were performed to determine the alteration of cell phenotypes in NPC cells upon transfection or co-transfection with sh-BBOX1-AS1, sh-KPNA2, or miR-3940-3p inhibitor. The BBOX1-AS1–miR-3940-3p and miR-3940-3p-KPNA2 interplay was verified via luciferase reporter and RNA pull-down assays.
Results: High BBOX1-AS1 levels were detected in the nasopharyngeal carcinoma tissues. BBOX1-AS1 silencing considerably suppressed the proliferative, migratory, and invasive abilities of NPC cells in vitro. Interestingly, BBOX1-AS1 could specifically bind to miR-3940-3 and abrogate the inhibition of KPNA2 induced by miR-3940-3. Additionally, analysis of tissue samples showed that miR-3940-3 was inversely correlated with BBOX1-AS1 and KPNA2.
Conclusion: Our findings revealed that the BBOX1-AS1/miR-3940-3/KPNA2 axis is pro-oncogenic in NPC progression, uncovering novel insights into targeted therapy for this disorder.
Keywords: migration, proliferation, invasion, nasopharyngeal carcinoma
Introduction
Nasopharyngeal carcinoma (NPC) is a malignant disorder originating from the nasopharyngeal epithelium, that affected 130,000 new cases and caused 70,000 deaths in 2018 worldwide.1 This disease shows strong regionality and is commonly diagnosed in Southern China and Southeast Asia.2 Due to the lack of noticeable symptoms in the early stages in the disease, approximately 70% of patients with NPC have distant metastases at the moment of diagnosis.3 Although great advances have been achieved in the last decades in the clinical management of NPC, the clinical outcome of patients with NPC, especially those at an advanced stage of the disease, is unfavorable in most of the cases.4 Therefore, a deep understanding of the mechanisms implicated in NPC progression is of great importance to develop novel and effective therapeutic approaches, as well as early diagnostic biomarkers.
Long non-coding RNAs (lncRNAs, ~200nt) are a subgroup of noncoding RNA (ncRNA) characterized by the lack of protein-coding ability. Emerging studies have highlighted their role in numerous tumor-associated cellular properties, such as cell growth and energy metabolism.5 They act as RNA scaffolds to assemble diverse protein complexes, thereby regulating gene expression.6 In addition, lncRNAs are critical regulators of the RNAi pathways and are implicated in miRNA biogenesis. LncRNAs harbor miRNA response elements that permit to relieve the miRNA-induced mRNA degradation or translational suppression. Dysregulation of the equilibrium established among lncRNAs, miRNAs, and mRNAs is associated with various pathologies, including cancers.6–8 In nasopharyngeal carcinoma, numerous lncRNAs, such as lncRNA PVT1,9 lncRNA FAM225A,10 lncRNA SNHG711, and lncRNA SNHG512 have been reported to influence the fate of tumor cells and to be involved in NPC malignancy through their role on miRNA quenching. BBOX1-AS1 was upregulated in cervical cancer,13 gastric cancer,14 colorectal cancer,15 and ovarian cancer,16 and exerts a pro-tumorigenic function by acting as a ceRNA of miRNAs. However, its target genes and its role in the development of NPC remain unknown.
In the present study, several bioinformatics analyses were performed to untangle the molecular network underlying NPC progression. Additionally, a series of cell functional assays were performed to determine the significance of the BBOX1-AS1/miR-3940-3p/ Karyopherin α2 (KPNA2) axis in NPC progression.
Materials and Methods
Tissues
Forty-five human NPC tissue samples and the corresponding matched adjacent uncancerous tissue (>2 cm from NPC tissues) samples were acquired from individuals undergoing surgical resection in our hospital. The study was approved by the ethics committee of the Yantai Affiliated Hospital of Binzhou Medical College (Approval No. 20190501003). All patients provided informed consent for the human tissue analysis. Tissues were cryopreserved at −80 °C immediately after resection for quantitative RT-PCR (RT-qPCR) analysis.
Cell Culture
The human NPC cell lines 6–10B and SUNE1 were obtained from Shanghai Biotech Bingsui Co. Ltd. (Shanghai, China). The human NPC cell line C666-1 and the normal nasopharyngeal cell line NP69 were purchased from BeNa Culture Collection (BNCC, China). The cell lines 6–10B, SUNE1 and C666-1cells were maintained at 37 °C in RPMI-1640 medium, 5–8F cells in DMEM medium, and NP69 in keratinocyte serum-free medium (Invitrogen, Carlsbad CA USA) in a 5% CO2 incubator.
Transfection
Transfection was performed using Lipofectamine 3000 (Invitrogen), according to the manufacturer’s instructions. 6–10B and C666-1 cells at approximately 70% confluence were seeded in 6-well plates and transfected with 20 nM miRNA inhibitor or mimic.
For shRNA lentivirus infection, shRNA lentiviral constructs against human BBOX1-AS1 (shBOX1-AS1) or KPNA2 (shKPNA2) were purchased from Suzhou Jima Gene Co. Ltd. (Suzhou, China) along with their corresponding negative controls, shRNA-NC. A total of 1×10⁴ 293T cells were infected with pLenti-shRNA constructs and packaging vectors for 48 h before determination of titers. The medium containing shRNA lentiviral particles was isolated and centrifuged. After removal of cell debris by filtration, the supernatant was collected, and incubated with 6–10B and C666-1 cells at approximately 70% confluence for another 48 h. Next, NPC cells were incubated in a medium containing 4 μg/mL puromycin for one week. The surviving clones were expanded for subsequent assays. The sequences of all vectors used in this study are listed in Supplementary Table 1.
Cell Counting Kit-8 Proliferation Assay
A CCK8 kit (Lunchangshuo, Biotech Co. Ltd, China) was used to measure NPC cell proliferation. First, 1×10⁶ 6–10B or C666-1 cells were plated in 96-well plates for 24 h. After continuous incubation for 0, 24, 48, and 72 h, NPC cells were exposed to 10 μL of CCK8 reagent for 1.5 h. Absorbance was read at OD 450 nm using a microplate reader (Bio-Rad, USA).
EdU Proliferation Assays
A total of 4×10³ 6–10B or C666-1 cells were plated in 96-well plates. When cells reached ~ 80% confluence, cells were co-cultured with 50 µM EdU for 5 h. Following 30 min of fixation, permeabilization was performed for 10 min at room temperature using 4% paraformaldehyde with 0.5% Triton-X100. The cells were then transiently stained with DAPI. The cell viability rate was determined as the proportion EdU-positive cells/DAPI-stained cells.
Transwell Migration and Invasion Assay
For transwell migration analyses, a total of 1×10⁵ 6–10B and C666-1 cells were trypsinized, suspended in medium, and then added to the upper compartment. After 3 h of incubation, the cell debris on the insert membrane was removed, and the migrated or invaded cells were fixed with 5% glutaraldehyde for 10 min before incubation with 1% crystal violet for 20 min. Finally, the cells were visualized and counted under a microscope at ×250. For transwell invasion analyses, precoated matrigel with a pore size of 8 μm was added to 24-well plates for incubation overnight. Then, the following steps of invasion assay are the same as the migration assay.
Wound Healing Assay
6–10B and C666-1 cells (6.0 × 10⁴ cells/well) were maintained in six-well plates until they reached 100% confluence. After 6 additional cultures in serum-free conditioned medium, new 1 mL pipette tips were used to create wounds in the center of each well. The wounds were recorded under a microscope at 0 and 24 h (magnification, ×100).
RNA Isolation and Real-Time PCR
RNAiso plus (Takara, Japan) was used for total RNA isolation according to manufacturer’s instructions. A HyperScript III miRNA 1st Strand cDNA Synthesis Kit (NovalBio, China), a CR0232 lncRNA First Strand cDNA Synthesis Kit (Cellregen,China), and Hifair® III 1st Strand cDNA Synthesis SuperMix for qPCR (Yeasen, China) were used for miRNA reverse transcription, lncRNA reverse transcription, and mRNA reverse transcription, respectively. Quantitative PCR was performed to analyze cDNA using an AB 7500 Real-Time PCR System with SYBR Green (Takara). GAPDH and U6 were used as the internal controls. The relative expression level of RNAs was determined using the 2−ΔΔCt method. The sequences of the primers used are presented in Table 1.
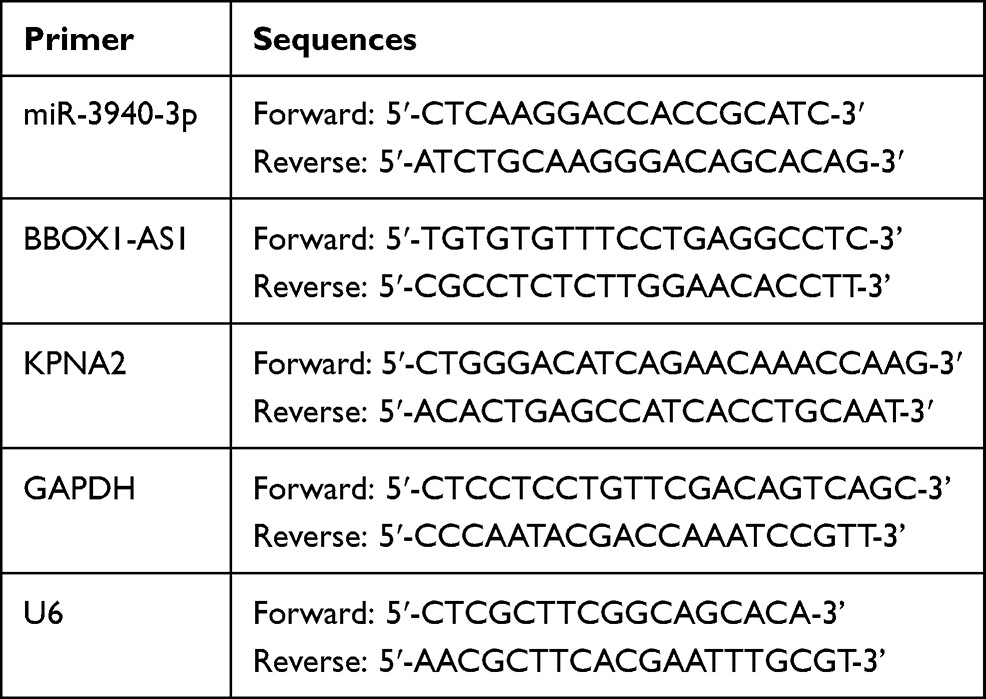 |
Table 1 The Sequences of the Primers in This Study |
Luciferase Reporter Assay
The miR-3940-3p responsive site of KPNA2-3ʹUTR or BBOX1-AS1 and the corresponding mutated KPNA2-3-UTR fragment or mutated BBOX1-AS1 fragment were subcloned into PsiCHECK2 luciferase reporter constructs (PsiCHECK2-BBOX1-AS1-wild-type, WT, PsiCHECK2-BBOX1-AS1-mutant, MUT, PsiCHECK2-KPNA2-3ʹUTR-wide-type, WT, PsiCHECK2-KPNA2-3ʹUTR-mutant, MUT). All the vectors were synthesized by Gema (Shanghai, China). For luciferase reporter experiment, two NPC cell lines were maintained in 96-well plates for 24 h. MiR-3940-3p mimic or mimic NC were transfected into NPC cells with PsiCHECK2-BBOX1-AS1-WT, PsiCHECK2-BBOX1-AS1-MUT, PsiCHECK2-KPNA2-3ʹUTR-WT, or PsiCHECK2-KPNA2-3ʹUTR-MUT. At 48 h post transfection, the relative luciferase activity (firefly luciferase/Renilla luciferase) was detected using a dual-luciferase kit (Promega, USA).
RNA Pull-Down
MiR-3940-3p labeled with biotin at the 3ʹ end (bio- miR-3940-3p) and its negative control miRNA (bio-NC) were commercially synthesized from Shanghai Gema. 6–10B and C666-1 cells were maintained in a 10 cm dish until they reached 80% confluence, when they were transfected with 50 nM of bio-miR-3940-3p or bio-NC. Cells were collected 48 h post-transfection, and the cell lysate was prepared in 550 μL of lysis buffer supplemented with protease inhibitor (PI) and RNase inhibitor. The supernatant was collected by centrifugation and incubated with the beads on a rotator at 4 °C overnight. The next day, the precipitates were collected after centrifugation and subjected to RNA isolation and quantitative PCR.
Western Blotting Analysis
The harvested cells were processed in radioimmunoprecipitation assay buffer. The obtained cell homogenate was centrifuged to separate the total protein from the cellular pellet. The concentration of the obtained protein sample was measured using a BCA assay kit (Abcam, USA). Then, aliquots containing equal amounts of protein were separated by 10% SDS-PAGE. After electrophoresis, proteins were transferred to polyvinylidene fluoride (PVDF) membranes for 90 min at 30 V. Membranes were blocked with blocking buffer, and incubated with anti-KPNA2 antibody (1:1000, cat#: 10819-1-AP, Proteintech, USA) and anti-GAPDH (1:1000, cat#:60004-1-Ig; Proteintech, USA) overnight at 4 °C with agitation after the membranes were blocked with blocking buffer. The membrane was incubated with horseradish peroxidase (HRP)-conjugated secondary antibody (1:1000, cat: H10007, ThermoFisher, USA) for 1 h at room temperature. The protein bands were detected using an ECL system (ChemiDoc Imaging system; Bio-Rad).
Statistical Analysis
Analyses were conducted using Graphprism 9.0. Continuous variables are presented as the mean ± SD. Statistical analyses were performed using ANOVA and paired t-tests. Pearson correlation analysis was performed to assess the correlation between miR-3940-3p and BBOX1-AS1 or KPNA2. Differences were considered statistically significant at P < 0.05.
Results
KPNA2 Was Found to Be a Potential Effector in NPC Under the Regulation of BBOX1-AS1
Using the starBase algorithm, we identified two downstream miRNA targets of BBOX1-AS1: miR-3940-3p and miR-361-3p. We found that miR-3940-3p has only been studied in gastric cancer, situation in which it is believed to act as a significant tumor suppressor,14 which indicates that it might be of significance to study its role in NPC. To further identify the downstream mRNA of miR-3940-3p, we intersected the target mRNAs list of miR-3940-3p obtained from the starBase database and the genes identified differentially expressed genes (DEGs) using GEO2R, in GSE12452 analysis (adjusted P < 0.05, logFC > 1), a dataset that contains NPC microarray data. Five genes were identified in the two datasets: KPNA2, BIRC5, HOMER3, ARHGAP8, and ADAMTS2 (Figure 1A). By analyzing their prognostic relationships with head and neck cancer using the kmplotter algorithm (http://kmplot.com/),17 we found that KPNA2 was significantly correlated with the overall survival of head and neck cancer patients (Figure 1B-F). Although knockdown of KPNA2 has been reported to suppress the progression of many other cancers, the role of KPNA2 has not been studied in NPC.18,19 Thus, we studied the function of KPNA2 in NPC.
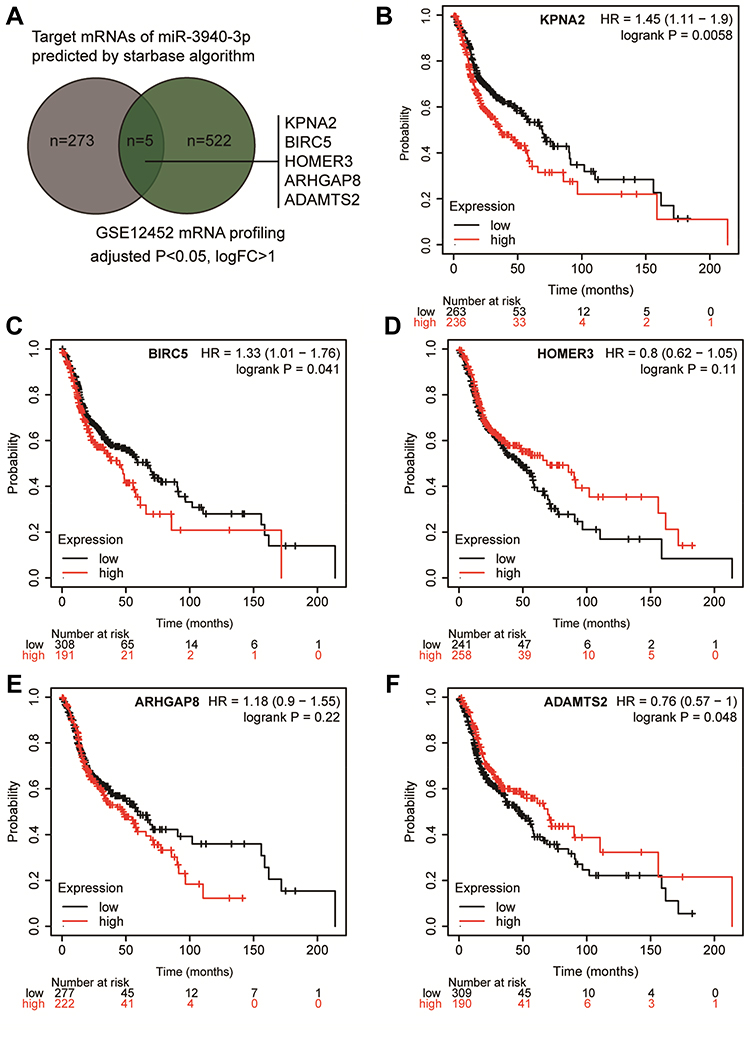 |
Figure 1 KPNA2 was selected to be a potential effector in NPC. (A) The common genes between the target genes list of miR-3940-3p and the DEGs in NPC by GSE12452 microarray analysis. Selection criteria: adjusted P<0.05, logFC>1. (B–F) The overall survival analysis results of the five genes in head and neck squamous carcinoma. The high expression group and low expression group were divided according to the mean of gene expression in head and neck squamous carcinoma samples. Data obtained from kmplotter database. |
Silencing BBOX1-AS1 Suppressed Proliferation, Migration and Invasion in NPC in vitro
To delineate the function of BBOX1-AS1 in NPC, we first compared BBOX1-AS1 expression in NPC and normal tissues. Higher expression of BBOX1-AS1 was observed in the NPC tissues (Figure 2A). We then examined its expression in four human nasopharyngeal carcinoma cells (5–8F, 6–10B, C666-1, and SUNE1) and normal nasopharyngeal epithelial cells (NP69). The NPC cells showed unregulated BBOX1-AS1 expression (Figure 2B), especially 6–10B and C666-1 cells, that showed 4-fold higher BBOX1-AS1 expression that NP69 cells. Hence, we chose both NPC cell lines to evaluate the impact of BBOX1-AS1 silencing on tumor behavior in vitro using a virus-induced gene silencing method. Knockdown of BBOX1-AS1 using sh-1 and sh-2 clones resulted in a 2–3 fold reduction in BBOX1-AS1 expression (Figure 2C), which confirmed the success of the silencing protocol. Silencing BBOX1-AS1 resulted in a lower proliferation in comparison with the cells transfected with shRNA NC (Figure 2D). The inhibited effect on cell proliferation caused by BBOX1-AS1 silence was also detected by EDU assays. A conspicuous decrease in cell proliferation in BBOX1-AS1 silence NPC cells was also observed in comparison that with shRNA NC cells (Figure 2E). The inhibitory effect on cell proliferation caused by BBOX1-AS1 silencing was validated using an EdU assay. Additionally, a scratch wound assays indicated that silencing BBOX1-AS1 impaired the migration of the two NPC cell lines (Figure 3A). Transwell migration and invasion assays further confirmed that BBOX1-AS1 knockdown considerably reduced the number of migratory or invasive cells (Figure 3B and C). These data indicated that silencing BBOX1-AS1 suppressed proliferation, migration, and invasion, and increased apoptosis in NPC cells.
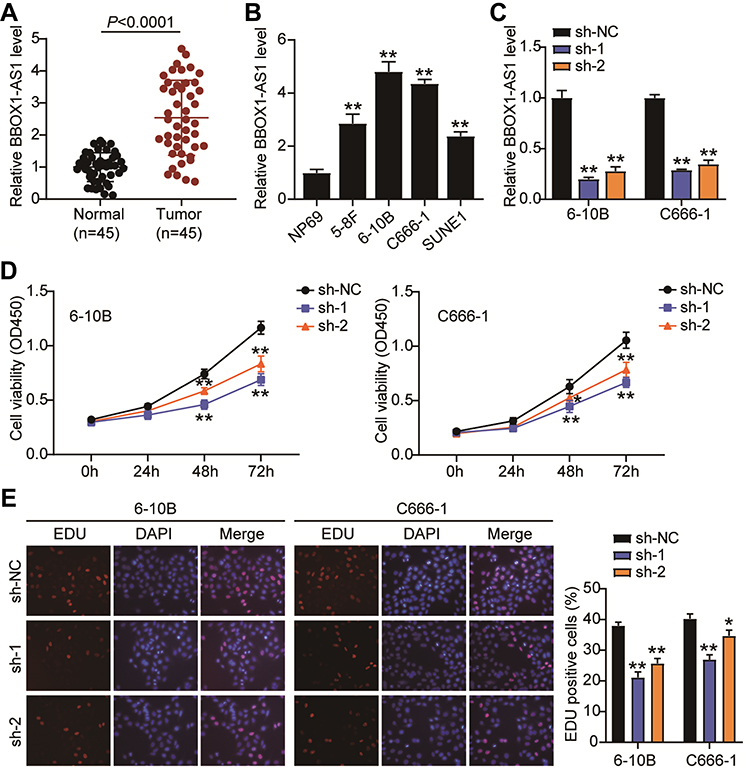 |
Figure 2 BBOX1-AS1 silence inhibits proliferation and triggers apoptosis in NPC cells in vitro. (A) The expression of BBOX1-AS1 in NPC tissues was analyzed by RT-PCR. (B) The expression of BBOX1-AS1 in various NPC cell lines was analyzed by RT-PCR. (C) 6–10B and C666-1 cells were transfected with shRNA1 and shRNA2 lentiviral target BBOX1-AS1. RT-qPCR was performed to examine the expression of BBOX1-AS1. (D) The proliferation ability of transfected cells was researched by CCK8 assay. (E) EdU assay presented the proliferation ability of transfected cells. * P<0.05,**P<0.001 vs sh-NC. |
 |
Figure 3 BBOX1-AS1 silence inhibits migration and invasion in NPC cells in vitro. (A) Effects of BBOX1-AS1 silence on NPC cell migration in a scratch wound assay. (B) Effects of BBOX1-AS1 silence on NPC cell migration in a transwell migration assay. (C) Effects of BBOX1-AS1 silence on NPC cell invasion in a transwell invasion assay. **P<0.001 vs sh-NC. |
BBOX1-AS1 Acted as miR-3940-3p Sponge
Bioinformatics analyses showed that BBOX1-AS1 can target miR-3940-3p in a sequence-specific manner and suppress its expression (Figure 4A). To further validate the bona fide interplay between BBOX1-AS1 and miR-3940-3p, two luciferase reporter vectors carrying the full-length BBOX1-AS1 or a mutated sequence (BBOX1-AS1-WT and BBOX1-AS1-MUT, respectively) were transfected into NPC cells with miR-3940-3p mimic or mimic NC. Co-transfection of BBOX1-AS1-WT with miR-3940-3p mimic caused an obvious reduction in luciferase activity, while co-transfection with BBOX1-AS1-MUT and the mimic did not cause any effect, suggesting that BBOX1-AS1 acts a miR-3940-3p sponge (Figure 4B). The role of BBOX1-AS1 was further validated using a RNA pull-down assay, which indicated an enrichment of BBOX1-AS1 target sequence in Bio-miR-3940-3p groups (Figure 4C). Additionally, BBOX1-AS1 was upregulated in NPC tissues according to RT-qPCR, while miR-3940-3p was downregulated (Figure 4D). Interestingly, a negative correlation was found between BBOX1-AS1 and miR-3940-3p expression levels (Figure 4E). In NPC cells, miR-3940-3p expression exhibited an opposite trend to that of BBOX1-AS1 (Figure 4F). In 6–10B and C666-1 cells, miR-3940-3p expression was reduced by 0.5-fold compared with that in NP69 cells. When transfected with BBOX1-AS1 sh-1, miR-3940-3p expression was increased 2-fold, while addition of the miR-3940-3p inhibitor completely reversed the effect of BBOX1-AS1 sh-1 (Figure 4G). Collectively, these results indicate that BBOX1-AS1 impaired the expression of miR-3940-3p via ceRNA activity.
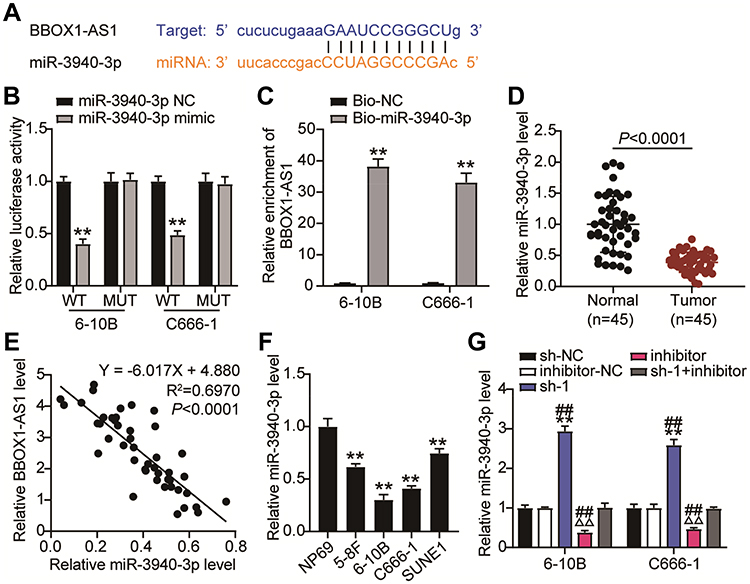 |
Figure 4 BBOX1-AS1 acted as a ceRNA by sponging miR-3940-3p. (A) The putative target sites between BBOX1-AS1and miR-3940-3p were shown. (B) Dual-luciferase analysis was preformed when NPC cells were co-transfected with BBOX1-AS1-wt and miR-3940-3p mimic or BBOX1-AS1-mut and miR-3940-3p mimic. The activity of luciferase was detected. (C) RNA pull-down was used to present the binding between BBOX1-AS1-mut and miR-3940-3p as fold enrichment. (D) RT-qPCR detecting miR-3940-3p expression in NPC tissues and normal tissues. (E) Pearson correlation between VEGF-B and ACR. (F) RT-qPCR detecting miR-3940-3p expression in NPC cells and NP69 cells. (G) miR-3940-3p expression level was detected by qRT-PCR when BBOX1-AS1was knocked down. **P<0.001, vs sh-NC; ΔΔP<0.001 vs inhibitor-NC; ##P<0.001 vs sh-1+inhibitor. |
BBOX1-AS1 Suppressed miR-3940-3p Expression to Modulate NPC Progression in vitro
Subsequent cell functional assays were performed to evaluate the ceRNA activity of BBOX1-AS1 to miR-3940-3p in NPC. Following exogenous miR-3940-3p knockdown in NPC cells, NPC cell proliferation was significantly elevated, and the reduced proliferation resulting from BBOX1-AS1 silencing was also abolished, as evidenced by the CCK8 and EdU assays (Figure 5A and B). Furthermore, the results of scratch migration experiments showed that exogenous miR-3940-3p knockdown resulted in less gap closure after scratching, and addition of sh-BBOX1-AS1 resulted in a reserve phenomenon, indicating that miR-3940-3p knockdown abolished the suppression of sh-BBOX1-AS1 on NC cell migration (Figure 6A). Transwell assays showed that sh-BBOX1-AS1 resulted in lower migration and invasion, and this suppression was abolished by the miR-3940-3p inhibitor (Figure 6B and C).
 |
Figure 5 MiR-3940-3pp inhibitor restrains the ceRNA activity of BBOX1-AS1 on cell proliferation in NPC cells. (A) CCK8 assay examined the repressive impact of sh-BBOX1-AS1 on the proliferation of 6–10B and C666-1 cells by interact with miR-3940-3p. (B) Edu proliferation assay examined the repressive impact of sh-BBOX1-AS1 on the proliferation of 6–10B and C666-1 cells by interact with miR-3940-3pp. * P<0.05,** P<0.001, vs sh-NC; ΔP<0.05, ΔΔP<0.001 vs inhibitor-NC; ## P<0.001 vs sh-1+inhibitor. |
 |
Figure 6 MiR-3940-3p inhibitor restrains the ceRNA activity of BBOX1-AS1 on cell migration and, invasion in NPC. NPC cells were co-transfected with miR-3940-3p mimic, mimic NC or sh-BBOX1-AS1 and shRNA NC. (A–C) Wound healing and transwell assays manifested the hampered capacity of migration in 6–10B and C666-1 cells in face of down-regulation of BBOX1-AS1 was abolished by addition of miR-3940-3p inhibitor. Relative wound width in c was calculated using the relative value of wound widths at 24 h to that at 0 h. ** P<0.001, vs sh-NC; ΔΔP<0.001 vs inhibitor-NC; ## P<0.001 vs sh-1+inhibitor. |
KPNA2 Was Identified as a Target of miR-3940-3p
The starBase predicted the binding sequences between KPNA2 3ʹUTR and miR-3940-3p (Figure 7A). Therefore, we further investigated the impact of miR-3940-3p on KPNA2 expression transfecting NPC cells with the luciferase reporter vectors psiCHECK2-KPNA2 WT or psiCHECK2-KPNA2 MUT, and with miR-3940-3p mimic or mimic NC. miR-3940-3p overexpression led to an apparently constrained luciferase activity, while none was detected in NPC cells transfected with miR-3940-3p NC (Figure 7B). Next, 6–10B and C666-1 cells were transfected with bio-miR-3940-3p and bio-NC, and an biotin-avidin pull-down assay was performed. Transfection of bio-miR-3940-3p resulted in substantial enrichment of KPNA2 in NPC cells (Figure 7C). KPNA2 expression was unregulated in 45 NPC tissue samples (Figure 7D), and its expression was negatively correlated with miR-3940-3p expression levels according to Pearsons’ correlation analysis (Figure 7E). Additionally, we evaluated KPNA2 mRNA levels in NPC cells, and found high expression levels of KPNA2 in NPC cells, especially in 6–108B and C666-1 cells (Figure 7F). These findings suggest that the low expression levels of miR-3940-3p might be responsible for the upregulation of KPNA2. Therefore, we transfected NPC cells with miR-3940-3p inhibitor or NC along with sh-KPNA2 or NC. Introduction of miR-3940-3p inhibitor clearly enhanced KPNA2 expression at the mRNA and protein level, evaluated by RT-qPCR and Western Blot, respectively, whereas KPNA2 silencing abrogated the promotion caused by enforced silencing of miR-3940-3p (Figure 7G and H).
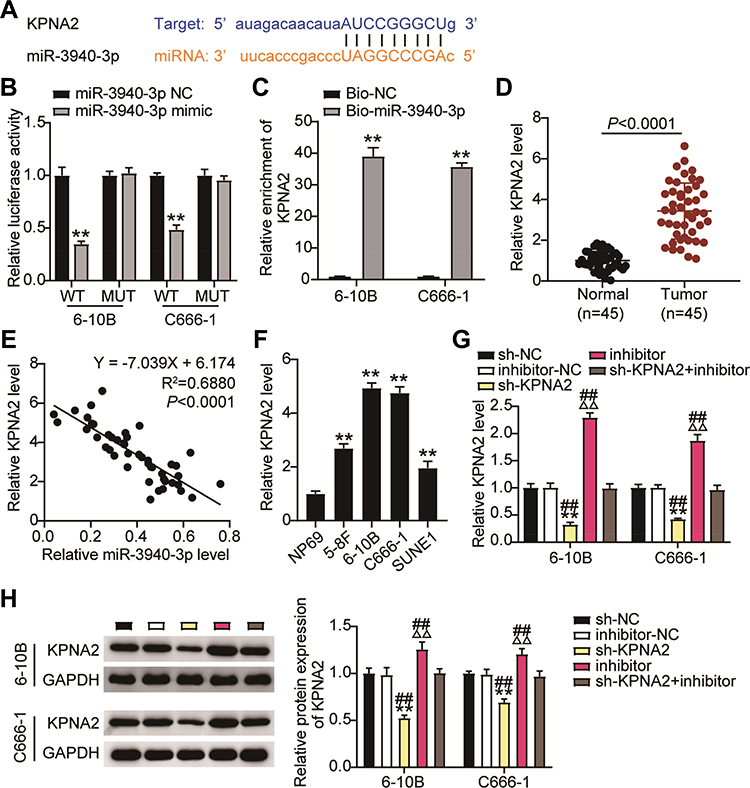 |
Figure 7 KPNA2 is a direct target of miR-3940-3p. (A) The potential interaction between miR-3940-3p and putative binding sites in the KPNA2. 3′-UTR. (B) Luciferase activities were measured in NPC cells co-transfected with luciferase reporter containing KPNA2 and the miR-3940-3p mimics or NC, or mutant. Data are presented as the relative ratio of renilla luciferase activity and firefly luciferase activity. (C) KPNA2 directly binding to miR-3940-3p. 6–10B and C666-1 cells were transfected with biotin-tagged miR-Ctrl (Bio-miR-Ctrl) or biotin-tagged miR-3940-3p (Bio-miR-3940-3p). Forty-eight hours after transfection, the cells were harvested for a biotin-based pull-down assay. KPNA2 expression levels were analyzed by qRT-PCR. (D) Relative KPNA2 mRNA expression was determined by 45 NPC tissues and corresponding normal tissues. (E) Pearson correlation between KPNA2 and miR-3940-3p (n = 45). (F) Relative KPNA2 mRNA expression was determined by qRT-PCR in NPC cells and NP69 cells. (G and H) RT-qPCR (G) and Western blotting. (H) Detecting relative KPNA2 mRNA expression in 6–10B and C666-1 cells after co-transfection with si-KPNA2 and miR-3940-3p inhibitor, their NC. **P<0.001 vs.sh-NC;ΔΔP<0.001 vs inhibitor-NC; ##P<0.001, vs sh-KPNA2+inhibitor. |
Suppression of KPNA2 Expression Inhibited Proliferation, Migration and Invasion Mediated by miR-3940-3p
Next, we tested the functional role of KPNA2 in miR-3940-3p-suppression of malignant characteristics of NPC cells. KPNA2 silencing weakened the proliferative capacity of NPC cells, whereas the loss of miR-3940-3p ablated the anti-proliferative effect observed when KPNA2 was silenced (Figure 8A and B). Furthermore, downregulation of KPNA2 curbed the wound healing and migration of 6–10B and C6666-1 cells, which was initiated by the miR-3940-3p inhibitor (Figure 9A). In addition, transwell migration and invasion assays demonstrated that the loss of KPNA2 diminished the number of migrating and invading 6–10B and C6666-1 cells, and that miR-3940-3p inhibitor counteracted this effect (Figure 9B and C). These findings indicate that KPNA2 regulates the anti-oncogenic effects of miR-3940-3p.
 |
Figure 8 KPNA2 silence reduces NPC cell proliferation by regulated miR-3940-3p inhibitor. CCK8 (A) and EdU incorporation (B) assays showed that KPNA2 inhibited 6–10B and C666-1 cell proliferation which was rescued by miR-3940-3p inhibitor. *P<0.05, **P<0.001 vs.sh-NC; ΔΔP<0.001 vs inhibitor-NC; #P<0. 05, ##P<0.001, vs sh-KPNA2+inhibitor. |
 |
Figure 9 KPNA2 silence reduces NPC cell migration and invasion by regulated miR-3940-3p inhibitor. (A) Wound-healing and migration assays showed that silencing of KPNA2 suppressed migration in 6–10B and C666-1 cells, which was abated by miR-3940-3p knockdown. (B and C) Transwell migration and invasion assay showed that KPNA2 silence inhibited 6–10B and C666-1 cell migration and invasion by regulating miR-3940-3p inhibitor. n = 5 independent experiments. **P<0.001 vs.sh-NC; ΔΔP<0.001 vs inhibitor-NC; ##P<0.001, vs sh-KPNA2+inhibitor. |
Discussion
Herein, we present evidence from bioinformatics analyses and in vitro assays demonstrating that BBOX1-AS1 drives NPC cellular phenotypes. Enhancement of BBOX1-AS1 induced robust expression of KPNA2 by specifically binding to miR-3940-3p, which boosted NPC cell proliferation, migration, and invasion in vitro. We demonstrated that KPNA2 silencing inhibited NPC cell proliferation, migration, and invasion, while inhibiting miR-3940-3p attenuated the inhibitory effect of KPNA2 on tumor cell behavior. Additionally, we observed an inverse correlation between miR-3940-3p and BBOX1-AS1 and KPNA2 expression levels, highlighting the role of the BBOX1-AS1/miR-3940-3p/KPNA2 axis in NPC in a clinical setting. Our results highlight the role of lncRNAs as sponge RNAs in regulating NPC cell behavior and suggest the potential of BBOX1-AS1 as a therapeutic target against NPC.
In the last decade, the importance of lncRNAs in regulating gene expression at various levels has been clearly evidenced, as well as the their implication in cancer progression, including NPC.20 For instance, silencing the lncRNA PVT1 diminishes carcinogenesis in vitro and in vivo.9 LncRNA FAM225A manifested oncogenicity and metastatic potential in NPC cells by increasing cell proliferation, migration and invasion.10 Elevated lncRNA FOXP4-AS1 expression has been reported to be strongly correlated with the clinicopathological characteristics of patients with NPC.21 BBOX1-AS1 has been reported to be a significant cancer driver in various human cancers, including stomach cancer,14 colorectal cancer,15 cervical cancer,13 and ovarian cancer.16 For instance, high expression of BBOX1-AS1 is detected in ovarian cancer patients and its silencing shows anti-apoptotic and pro-proliferative properties in cancer cells.16 Additionally, bioinformatics analysis suggested that high expression of BBOX1-AS1 increases the risk of colorectal cancer.22 Nonetheless, its role had not been studied in human NPC until now. In line with previous investigations, our data showed that BBOX1-AS1 expression was higher in NPC than that in adjacent normal tissues. Furthermore, loss of BBOX1-AS1 by shRNA transfection in 6–10B and C666-1 cells reduced cell proliferation, migration, and invasion.
Currently, BBOX1-AS1 is thought to act as a decoy to downstream miRNAs, leading to the upregulation of the genes targeted by such miRNAs. For example, BBOX1-AS1 shows ceRNA activity to specifically bind to miR-361-3p, thus relieving miR-361-3p-mediated repression of SH2B1 expression.13 In our subsequent mechanical analysis, we narrowed our focus to miR-3940-3p in NPC progression. Yang et al defined miR-3940-3p as an anti-oncogenic miRNA in gastric cancer.14 In the present study, luciferase reporter and RNA-IP analyses confirmed the interaction between miR-3940-3p and BBOX1-AS1. The low expression of miR-3940-3p in NPC tissues and its inverse correlation with BBOX1-AS1 expression levels also reinforced our hypothesis that BBOX1-AS1 binds to miR-3940-3p and thereby accelerates NPC progression. In NPC cells, shRNA-BBOX1-AS1 infection induced miR-3940-3p expression, which was reversed by the addition of the miR-3940-3p inhibitor. In parallel, the loss of miR-3940-3p obviously abrogated the sh-BBOX1-AS1-induced suppression of NPC cell proliferation, migration, and invasion. Collectively, BBOX1-AS1 downregulated miR-3940-3p expression by competitive binding and was involved in NPC progression.
KPNA2 is a karyopherin that participates in the nuclear transport of proteins. Upregulation of KPNA2 has been examined in multiple cancers, and has shown to be related to the short overall survival time of cancer patients.23 Furthermore, in vitro and in vivo assays have demonstrated that KPNA2 silencing suppresses metabolic remodeling in glioblastomas, indicating the oncogenicity of KPNA2.24 Additionally, KPNA2 overexpression confers colorectal cancer cell proliferation and migration.25 However, the role of KPNA2 in NPC remains unclear. Intriguingly, we found that patients with high-KPNA2 NPC had a worse prognosis. According to bioinformatics analysis, KPNA2 was verified as the downstream effector of the BBOX1-AS1/miR-3940-3p axis. To further confirm this, luciferase reporter assays were carried out and found that miR-3940-3p overexpression significantly weakened the KPNA2 3ʹUTR luciferase signal. We further confirmed their association using pull-down assays. The high expression of KPNA2 in NPC tissues and the negative correlation with miR-3940-3p provided further evidence for the interplay between KPNA2 and miR-3940-3p. In addition, the miR-3940-3p inhibitor introduced into 5–10B and C666-1 cells resulted in a 1-fold reduction in endogenous KPNA2. Furthermore, consistent with previous investigations, we also found that KPNA2 silencing could diminish the malignant characteristics of NPC cells, while the introduction of miR-3940-3p inhibitor alleviated this phenomenon. Our findings indicate that KPNA2 might drive NPC progression via the involvement of the BBOX1-AS1/miR-3940-3p axis.
Conclusions
In conclusion, we demonstrated that BBOX1-AS1 is overexpressed in NPC, and that it contributes to the malignancy of NPC cells by promoting cell proliferation, migration, and invasion. We also confirmed that BBOX1-AS1 can enhance the expression of KPNA2 by competitive binding to miR-3940-3p in NPC cells. Our current work sheds light on the function of the BBOX1-AS1/miR-3940-3p/KPNA2 axis in promoting the oncogenicity of NPC cells, suggesting that it might be an effective target for NPC treatment.
Highlights
- BBOX1-AS1 is overexpressed in nasopharyngeal carcinoma.
- BBOX1-AS1 overexpression contributes to the malignancy of nasopharyngeal carcinoma in vitro.
- BBOX-AS1 accelerates nasopharyngeal carcinoma progression by sponging miR-3940-3p to upregulate KPNA2.
Abbreviations
BBOX1-AS1, BBOX1 antisense RNA 1; NPC, nasopharyngeal carcinoma; IncRNAs, Long non-coding RNAs; ncRNA, noncoding RNAs; KPNA2, Karyopherin α2; PI, protease inhibitor; DEGs, differentially expressed genes.
Data Sharing Statement
The datasets used and/or analyzed during the current study are available from the corresponding author on reasonable request.
Ethics Approval and Informed Consent
The present study was approved by the Ethics Committee of Yantai Affiliated Hospital of Binzhou Medical College (Yantai, China). The processing of clinical tissue samples is in strict compliance with the ethical standards of the Declaration of Helsinki. All patients signed written informed consent. All patients signed written informed consent.
Consent for Publication
Consent for publication was obtained from the participants.
Funding
This research received no specific grant from any funding agency in the public, commercial, or not-for-profit sectors.
Disclosure
The authors declared no potential conflicts of interest with respect to the research, authorship, and/or publication of this article.
References
1. Chen YP, Chan ATC, Le QT, Blanchard P, Sun Y, Ma J. Nasopharyngeal carcinoma. Lancet (London, England). 2019;394(10192):64–80. doi:10.1016/s0140-6736(19)30956-0
2. Chua MLK, Wee JTS, Hui EP, Chan ATC. Nasopharyngeal carcinoma. Lancet (London, England). 2016;387(10022):1012–1024. doi:10.1016/s0140-6736(15)00055-0
3. Lee HM, Okuda KS, González FE, Patel V. Current perspectives on nasopharyngeal carcinoma. Adv Exp Med Biol. 2019;1164:11–34. doi:10.1007/978-3-030-22254-3_2
4. Lee AWM, Ng WT, Chan JYW, et al. Management of locally recurrent nasopharyngeal carcinoma. Cancer Treat Rev. 2019;79:101890. doi:10.1016/j.ctrv.2019.101890
5. Liu D, Xu B, Chen S, et al. Long non-coding RNAs and prostate cancer. J Nanosci Nanotechnol. 2013;13(5):3186–3194. doi:10.1166/jnn.2013.6870
6. Zhu J, Zhang X, Gao W, Hu H, Wang X, Hao D. lncRNA/circRNA‑miRNA‑mRNA ceRNA network in lumbar intervertebral disc degeneration. Mol Med Rep. 2019;20(4):3160–3174. doi:10.3892/mmr.2019.10569
7. Huang Y. The novel regulatory role of lncRNA-miRNA-mRNA axis in cardiovascular diseases. J Cell Mol Med. 2018;22(12):5768–5775. doi:10.1111/jcmm.13866
8. Fan CN, Ma L, Liu N. Systematic analysis of lncRNA-miRNA-mRNA competing endogenous RNA network identifies four-lncRNA signature as a prognostic biomarker for breast cancer. J Transl Med. 2018;16(1):264. doi:10.1186/s12967-018-1640-2
9. Wang Y, Chen W, Lian J, et al. The lncRNA PVT1 regulates nasopharyngeal carcinoma cell proliferation via activating the KAT2A acetyltransferase and stabilizing HIF-1α. Cell Death Differ. 2020;27(2):695–710. doi:10.1038/s41418-019-0381-y
10. Zheng ZQ, Li ZX, Zhou GQ, et al. Long noncoding RNA fam225a promotes nasopharyngeal carcinoma tumorigenesis and metastasis by acting as ceRNA to sponge miR-590-3p/miR-1275 and upregulate ITGB3. Cancer Res. 2019;79(18):4612–4626. doi:10.1158/0008-5472.Can-19-0799
11. Xu W, Sun X, Zang C, Jiang Y. lncRNA SNHG7 promotes tumorigenesis of nasopharyngeal carcinoma via epithelial-to-mesenchymal transition. Oncol Lett. 2020;20(4):88. doi:10.3892/ol.2020.11949
12. Liu D, Wang Y, Zhao Y, Gu X. LncRNA SNHG5 promotes nasopharyngeal carcinoma progression by regulating miR-1179/HMGB3 axis. BMC Cancer. 2020;20(1):178. doi:10.1186/s12885-020-6662-5
13. Xu J, Yang B, Wang L, et al. LncRNA BBOX1-AS1 upregulates HOXC6 expression through miR-361-3p and HuR to drive cervical cancer progression. Cell Prolif. 2020;53(7):e12823. doi:10.1111/cpr.12823
14. Yang Y, Yu Q, Li B, Guan R, Huang C, Yang X. BBOX1-AS1 accelerates gastric cancer proliferation by sponging miR-3940-3p to upregulate BIRC5 expression. Dig Dis Sci. 2021;66(4):1054–1062. doi:10.1007/s10620-020-06308-0
15. Liu J, Zhu J, Xiao Z, Wang X, Luo J. BBOX1-AS1 contributes to colorectal cancer progression by sponging hsa-miR-361-3p and targeting SH2B1. FEBS Open Bio. 2020. doi:10.1002/2211-5463.12802
16. Yao H, Chen R, Yang Y, Jiang J. LncRNA BBOX1-AS1 aggravates the development of ovarian cancer by sequestering miR-361-3p to augment PODXL expression. Reprod Sci (Thousand Oaks, Calif). 2021;28(3):736–744. doi:10.1007/s43032-020-00366-5
17. Nagy Á, Lánczky A, Menyhárt O, Győrffy B. Validation of miRNA prognostic power in hepatocellular carcinoma using expression data of independent datasets. Sci Rep. 2018;8(1):9227. doi:10.1038/s41598-018-27521-y
18. Ma A, Tang M, Zhang L, et al. USP1 inhibition destabilizes KPNA2 and suppresses breast cancer metastasis. Oncogene. 2019;38(13):2405–2419. doi:10.1038/s41388-018-0590-8
19. Xiang S, Wang Z, Ye Y, et al. E2F1 and E2F7 differentially regulate KPNA2 to promote the development of gallbladder cancer. Oncogene. 2019;38(8):1269–1281. doi:10.1038/s41388-018-0494-7
20. Peng WX, Koirala P, Mo YY. LncRNA-mediated regulation of cell signaling in cancer. Oncogene. 2017;36(41):5661–5667. doi:10.1038/onc.2017.184
21. Yao L, Wang T, Wang X. LncRNA FOXP4-AS1 serves as a biomarker for nasopharyngeal carcinoma diagnosis and prognosis. 3 Biotech. 2021;11(1):25. doi:10.1007/s13205-020-02593-8
22. Shi ZL, Zhou GQ, Guo J, et al. Identification of a prognostic colorectal cancer model including LncRNA FOXP4-AS1 and LncRNA BBOX1-AS1 based on bioinformatics analysis. Cancer Biother Radiopharm. 2021. doi:10.1089/cbr.2020.4242
23. Han Y, Wang X. The emerging roles of KPNA2 in cancer. Life Sci. 2020;241:117140. doi:10.1016/j.lfs.2019.117140
24. Li J, Liu Q, Liu Z, et al. KPNA2 promotes metabolic reprogramming in glioblastomas by regulation of c-myc. J Exp Clin Cancer Res. 2018;37(1):194. doi:10.1186/s13046-018-0861-9
25. Wang P, Zhao Y, Liu K, et al. Wip1 cooperates with KPNA2 to modulate the cell proliferation and migration of colorectal cancer via a p53-dependent manner. J Cell Biochem. 2019;120(9):15709–15718. doi:10.1002/jcb.28840
 © 2021 The Author(s). This work is published and licensed by Dove Medical Press Limited. The
full terms of this license are available at https://www.dovepress.com/terms
and incorporate the Creative Commons Attribution
- Non Commercial (unported, 3.0) License.
By accessing the work you hereby accept the Terms. Non-commercial uses of the work are permitted
without any further permission from Dove Medical Press Limited, provided the work is properly
attributed. For permission for commercial use of this work, please see paragraphs 4.2 and 5 of our Terms.
© 2021 The Author(s). This work is published and licensed by Dove Medical Press Limited. The
full terms of this license are available at https://www.dovepress.com/terms
and incorporate the Creative Commons Attribution
- Non Commercial (unported, 3.0) License.
By accessing the work you hereby accept the Terms. Non-commercial uses of the work are permitted
without any further permission from Dove Medical Press Limited, provided the work is properly
attributed. For permission for commercial use of this work, please see paragraphs 4.2 and 5 of our Terms.