
Back to Journals » Diabetes, Metabolic Syndrome and Obesity » Volume 18
Association of Fasting C-Peptide to High Density Lipoprotein Cholesterol Ratio with Non-Alcoholic Fatty Liver Disease in Chinese Type 2 Diabetes Mellitus Patients: A Cross-Sectional Study
Authors Liang Q  , Hu H , Chen X, Yang S, Zhang Y, Wu Y, Wang X, Chen H
Received 16 August 2025
Accepted for publication 24 November 2025
Published 11 December 2025 Volume 2025:18 Pages 4507—4522
DOI https://doi.org/10.2147/DMSO.S556539
Checked for plagiarism Yes
Review by Single anonymous peer review
Peer reviewer comments 3
Editor who approved publication: Professor Jae Woong Sull
Qian Liang,1– 4 Haofei Hu,5 Xuan Chen,2– 4 Shufen Yang,2– 4 Ying Zhang,2– 4 Yan Wu,2– 4 Xinyu Wang,6 Hong Chen1
1Department of Endocrinology, Zhujiang Hospital, Southern Medical University, Guangzhou, Guangdong, People’s Republic of China; 2Department of Endocrinology, Shenzhen People’s Hospital, Shenzhen, Guangdong, People’s Republic of China; 3Department of Endocrinology, The First Affiliated Hospital of Southern University of Science and Technology, Shenzhen, Guangdong, People’s Republic of China; 4Department of Endocrinology, The Second Affiliated Hospital of Jinan University, Shenzhen, Guangdong, People’s Republic of China; 5Department of Nephrology, Shenzhen Second People’s Hospital, Shenzhen, Guangdong, People’s Republic of China; 6Department of Endocrinology, Shenzhen Second People’s Hospital, Shenzhen, Guangdong, People’s Republic of China
Correspondence: Hong Chen, Email [email protected] Xinyu Wang, Email [email protected]
Objective: To investigate fasting C-peptide to high-density lipoprotein cholesterol ratio (FHR) as a predictor for non-alcoholic fatty liver disease (NAFLD) in Chinese adults with type 2 diabetes mellitus (T2DM).
Methods: This study enrolled 718 participants with T2DM from Shenzhen People’s Hospital, China. Participants were stratified by FCP/HDL-C ratio (FHR) quartiles. Multiple linear regression assessed the association between FHR and NAFLD. A generalized additive model (GAM) tested for nonlinearity. Subgroup analyses evaluated result robustness. The area under the curve (AUC) evaluated the performance of the FHR model for NAFLD occurrence.
Results: After adjusting for relevant variables, FHR was positively correlated with NAFLD (OR = 1.30, 95% CI (1.15, 1.48)). FHR demonstrated a nonlinear association with NAFLD, characterized by a threshold value of 1.23. The effect sizes and confidence intervals on the left and right sides of the inflection point were 3.07 (1.51, 6.24) and 1.20 (1.05, 1.37), respectively. Subgroup analysis showed a stronger correlation could be detected in patients with systolic blood pressure (SBP) < 140 mmHg, alanine transaminase (ALT) > 40U/L, fasting blood glucose (FBG) ⩽7 mmol/L, urinary albumin to creatinine ratio (UACR) ⩽30mg/g, triglyceride (TG) ⩽1.7 mmol/L and the patients with drinking history. The FHR ratio model exhibited better discriminative ability in NAFLD (AUC = 0.697) compared to individual FCP (AUC = 0.649) or HDL-C (AUC = 0.635) alone.
Conclusion: The association between FHR and NAFLD was nonlinear, with a positive relationship observed when FHR exceeded the threshold of 1.23.
Keywords: fasting C-peptide to high-density lipoprotein cholesterol ratio, non-alcoholic fatty liver disease, non-alcoholic steatohepatitis, insulin resistance, overweight, obesity, diabetes mellitus
A Letter to the Editor has been published for this article.
A Response to Letter by Dr Hu has been published for this article.
Corrigendum for this paper has been published.
Introduction
NAFLD is one of the most common chronic liver disorder characterized by excessive lipid accumulation in hepatocytes, excluding alcohol and other established liver injury factors. The disease spectrum includes non-alcoholic fatty liver (NAFL) and non-alcoholic steatohepatitis (NASH), with potential progression to advanced liver disease (fibrosis, cirrhosis) or hepatocellular carcinoma.1 It is important to note that the international nomenclature for NAFLD has recently evolved, with the term metabolic dysfunction-associated fatty liver disease (MAFLD) introduced in 2020,2 later updated to metabolic dysfunction-associated steatotic liver disease (MASLD) in 2023.3 As the data for our study were collected during 2018–2019 under the NAFLD framework, we retain this original term to ensure diagnostic accuracy and historical consistency with the original data. The global prevalence of NAFLD is estimated at 32.4%.4 In China, the pooled prevalence among adults over the past two decades stands at 29.6%,5 demonstrating a consistent annual increase, with males exhibiting a higher incidence than females.4,5 Notably, the global prevalence of NAFLD in individuals with T2DM reaches 65%,6 whereas the corresponding rate in Chinese T2DM patients is 51.8%.7 Geographically, China demonstrates the highest NAFLD incidence and the most rapid increase in prevalence globally.4,8 The poor prognosis of NAFLD is primarily associated with cardiovascular diseases and non-liver malignancies.9,10 Notably, T2DM exerts a more pronounced adverse effect on clinical outcomes in NAFLD patients compared to obesity.11,12 Furthermore, NAFLD patients demonstrate significantly higher incidence rates of diabetes mellitus, coronary artery disease, chronic kidney disease and cerebrovascular events relative to healthy individuals.13,14 NAFLD arises from hepatic lipid accumulation, driven by insulin resistance, dysregulated lipid metabolism, and mitochondrial dysfunction, which induce lipotoxicity, oxidative stress, and pro-inflammatory cytokine activation, ultimately promoting steatohepatitis and fibrosis progression.15 β-cells secrete C-peptide and insulin at equimolar levels, with C-peptide serving as a reliable marker for evaluating endogenous insulin secretion. However, circulating C-peptide and insulin levels typically diverge due to differential clearance mechanisms and half-lives.16 Elevated C-peptide levels signify both exacerbated insulin resistance and compensatory β-cell hypersecretion, as peripheral insulin resistance drives increased insulin and C-peptide production to sustain glucose homeostasis.17 Previous studies have reported inconsistent conclusions regarding the impact of C-peptide on NAFLD and hepatic fibrosis. Related studies have demonstrated that C-peptide is an independent risk factor for NAFLD, with elevated C-peptide levels increasing the risk of NAFLD development and hepatic fibrosis.18,19 However, other studies have shown that C-peptide positively correlates with inflammatory progression in hepatic steatosis but negatively associates with fibrosis progression.20
Dyslipidemia, characterized by elevated triglycerides (TG), increased low-density lipoprotein cholesterol (LDL-C), and reduced high-density lipoprotein cholesterol (HDL-C), is strongly linked to NAFLD.21,22 HDL-C, the cholesterol component of high-density lipoprotein particles, serves as a critical mediator in cholesterol metabolism by transporting excess cholesterol from peripheral tissues to the liver for processing. Through the reverse cholesterol transport pathway, HDL-C facilitates dietary cholesterol efflux and exhibits additional anti-inflammatory and antioxidant properties.23 Therefore, decreased HDL-C may contribute to the development of NAFLD.24 Numerous studies have indicated that HDL-C is inversely associated with NAFLD, and elevated levels of HDL-C may effectively reduce the risk of developing NAFLD.25,26 However, scientific debate persists regarding the causality, functionality and therapeutic targeting of HDL-C in NAFLD. The development of NAFLD is associated with insulin resistance and dyslipidemia. Previous studies have demonstrated significant associations of both C-peptide and HDL-C with NAFLD. Whether the FCP/HDL-C ratio (FHR) is a superior predictor of NAFLD development remains unclear due to the lack of studies investigating this relationship. This study investigated the association between FHR and NAFLD in T2DM patients.
Materials and Methods
Study Population and Design
This cross-sectional study consecutively enrolled 982 adults with T2DM from the Endocrinology Department of Shenzhen People’s Hospital, Shenzhen, China between April 2018 and July 2019. Non-selective recruitment minimized selection and observation biases. Anonymized participant data were securely stored in the hospital’s electronic medical record system to protect privacy. The study protocol was approved by the Medical Research Ethics Committee of Shenzhen People’s Hospital. Participants were included if they met all the following criteria: 1) Diagnosis of T2DM based on the 1999 World Health Organization (WHO) criteria; 2) Age≥18 years at the time of T2DM diagnosis; 3) Availability of complete FCP and HDL-C measurements; 4) Liver ultrasound data; 5) No history of hemodialysis or peritoneal dialysis. Exclusion criteria were applied to rule out participants with: 1) Viral hepatitis (hepatitis B/C); 2) Alcoholic fatty liver disease (alcohol intake >20 g/day for women or >30 g/day for men); 3) Severe comorbidities (uremia, malignancies, stroke, or cardiovascular disease); 4) Liver or kidney transplantation history; 5) Pregnancy or lactation. After rigorous screening, 718 participants fulfilled the eligibility criteria and were included in the final analysis.
General Clinical Features
Patient medical histories were reviewed to record: gender, age, diabetes duration, family history of diabetes, hypertension history, alcohol drinking history, weight, height, systolic blood pressure (SBP), and diastolic blood pressure (DBP). Following ≥ 20 minutes of rest, SBP and DBP were measured at the right brachial artery using a mercury sphygmomanometer. Height and weight were measured using standardized protocols, with body mass index (BMI) calculated as weight (kg)/height (m2).
Laboratory Measurements and Clinical Assessments
Venous blood samples collected after ≥ 8-hour overnight fasting underwent biochemical analysis at Shenzhen People’s Hospital’s central laboratory. Quantified parameters included: alanine aminotransferase (ALT), aspartate aminotransferase (AST), total protein (TP), albumin (ALB), γ-glutamyltransferase (GGTP), fasting blood glucose (FBG), glycated hemoglobin (HbA1c), fasting C-peptide (FCP), serum creatinine (SCr), serum uric acid (SUA), urinary albumin to creatinine ratio (UACR), total cholesterol (TC), triglycerides (TG), high-density lipoprotein cholesterol (HDL-C), low-density lipoprotein cholesterol (LDL-C). Enzymatic colorimetric assays (Roche Cobas 8000 analyzer) were employed to measure ALT, AST, TP, ALB, GGTP, FBG, SCr, SUA, TC, TG, HDL-C, LDL-C. HbA1c levels were measured using high-performance liquid chromatography (Bio-Rad D-10 system), while FCP concentrations were determined using chemiluminescent immunoassays (Siemens ADVIA Centaur XP). Estimated glomerular filtration rate (eGFR) was calculated using the simplified Modification of Diet in Renal Disease (MDRD) equation: eGFR (mL/min/1.73 m2) = 186×(SCr/88.4) − 1.154×age − 0.203×gender factor (male: 1.0; female: 0.742). First-morning urine specimens were collected on two consecutive days for urinary albumin-to-creatinine ratio (UACR) measurement using immunoturbidimetry (Mindray BS-800M analyzer), with the mean value utilized for statistical analysis.
Vascular and Neurological Evaluations
Ankle-brachial index (ABI) was measured with an automatic waveform analyzer (ParryMed F5001, Sweden), while vibration perception threshold (VPT) was evaluated with a standardized digital biothesiometer (Sensiometer A200, Beijing Dimeidel). VPT severity was categorized as follows: Normal: <10V; Mild impairment: 10–14.9V; Moderate impairment: 15–24.9V; Severe impairment: ≥25V. All ABI and VPT measurements were performed by a trained nurse in the Department of Endocrinology to minimize interobserver variability. The fundus assessment is performed by a professional ophthalmologist.
Liver Ultrasonography Evaluation
The diagnosis of NAFLD was confirmed through abdominal ultrasound imaging performed by certified radiologists. To maintain objectivity, the evaluating radiologists were deliberately kept unaware of participants’ laboratory data during image interpretation. Participants with a history of excessive alcohol consumption (>20 g/day for women or >30 g/day for men) were excluded from the NAFLD cohort. The diagnostic criteria required fulfillment of at least two out of four characteristic sonographic findings: evidence of hepatic steatosis, hepatorenal echo contrast with liver echogenicity exceeding renal echogenicity, impaired visualization of intrahepatic vascular structures, and posterior attenuation of the ultrasound beam.27
FCP/HDL-C Ratio (FHR)
The unit of FCP is ng/mL, and the unit of HDL-C is mmol/L. By dividing FCP by HDL-C, we calculated it as the key analytical variable.
Covariates
The initial selection of covariates was based on clinical experience and existing literature.28–30 Variables that altered the effect estimates by≥10% were further retained in the final model.31 Based on the above principles, the following variables were treated as covariates: (1) continuous variables: age, BMI, DBP, ALT, ALB, FBG, SUA, UACR, TG; (2) categorical variables: gender, alcohol drinking history.
Statistical Analysis
Missing values were addressed through distinct strategies based on variable type: Continuous variables were imputed using mean or median values, while categorical variables incorporated missing data as a separate category (designated as “NA”).32
Participants were stratified into quartiles according to their FCP/HDL-C ratio (FHR). Continuous variables were summarized as mean ± standard deviation (normally distributed) or median (interquartile range, non-normal distribution). Categorical variables were presented as frequencies (percentages). Intergroup differences were assessed using one-way ANOVA (normal distributions), Kruskal–Wallis tests (non-normal distributions), or chi-square tests (categorical variables), as appropriate. Multivariable logistic regression models were employed to evaluate associations between FHR and NAFLD risk, with results expressed as adjusted odds ratios (ORs) and 95% confidence intervals (CIs). Three adjustment levels were implemented: unadjusted, partially adjusted (demographic variables), and fully adjusted (demographic and clinical covariates). Sensitivity analyses assessed model robustness. Potential nonlinear relationships were examined using generalized additive models (GAM). When nonlinearity was detected (P <0.05 via log-likelihood ratio tests), piecewise linear regression identified threshold effects. The inflection point was determined through iterative maximum likelihood estimation. E-values were calculated to evaluate the potential influence of unmeasured confounders on the relationship between FHR and NAFLD.33 Stratified analyses evaluated effect modification by demographic and clinical variables (gender, age, BMI, etc)., with interaction terms tested via likelihood ratio tests. Receiver operating characteristic curves (ROC) compared the discriminative ability of FCP, HDL-C, and their ratio for NAFLD diagnosis. The STROBE criteria were followed while writing up all of the results.34 Analyses were conducted using R (version 4.3.1; R Foundation) and EmpowerStats (version 4.1). Two-tailed P-values <0.05 indicated statistical significance.
Results
Selected Participants
A total of 718 participants aged 18–90 years with T2DM were recruited from the Endocrinology Department, Shenzhen People’s Hospital, between April 2018 and July 2019, based on predefined eligibility criteria (Figure 1).
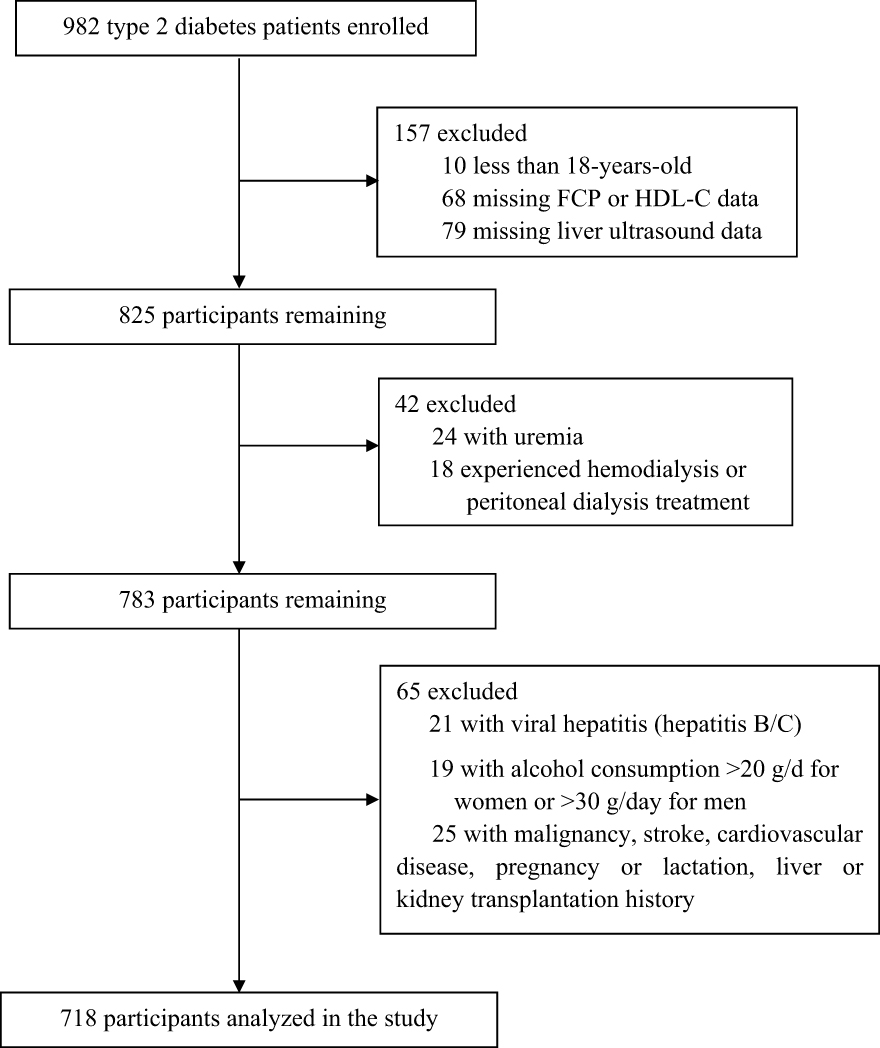 |
Figure 1 Flowchart of research participant selection. |
Baseline Characteristics
The study population consisted of 58.24 ± 11.72 years old participants, with a male-to-female ratio of 63.4% to 36.6%. The mean FHR value was 2.06, and NAFLD prevalence was 45%. Data omission was observed in the following parameters: ALT (n=13), AST (n=12), UACR (n=12), TP (n=14), ALB (n=14), GGTP (n=27), HbA1C (n=5), SUA (n=18), VPT (n=28), and ABI (n=35). Participants were stratified into four subgroups based on quartiles of the FCP/HDL-C ratio (FHR): ≤ 0.97, 0.98–1.69, 1.70–2.63, and≥2.64. The baseline characteristics of the 718 participants stratified by quartiles of FHR levels are displayed in Table 1. Those in the highest FHR quartile exhibited significantly higher levels of BMI, DBP, ALT, TP, ALB, FBG, SUA, TG, and ABI (right), as well as higher NAFLD prevalence, and were associated with lower eGFR and HbA1c levels. No Statistical significances were observed across FHR quartiles in gender, age, diabetes duration, SBP, AST, GGTP, UACR, TC, LDL-C, ABI(left), family history of diabetes, smoking history, alcohol drinking history and VPT.
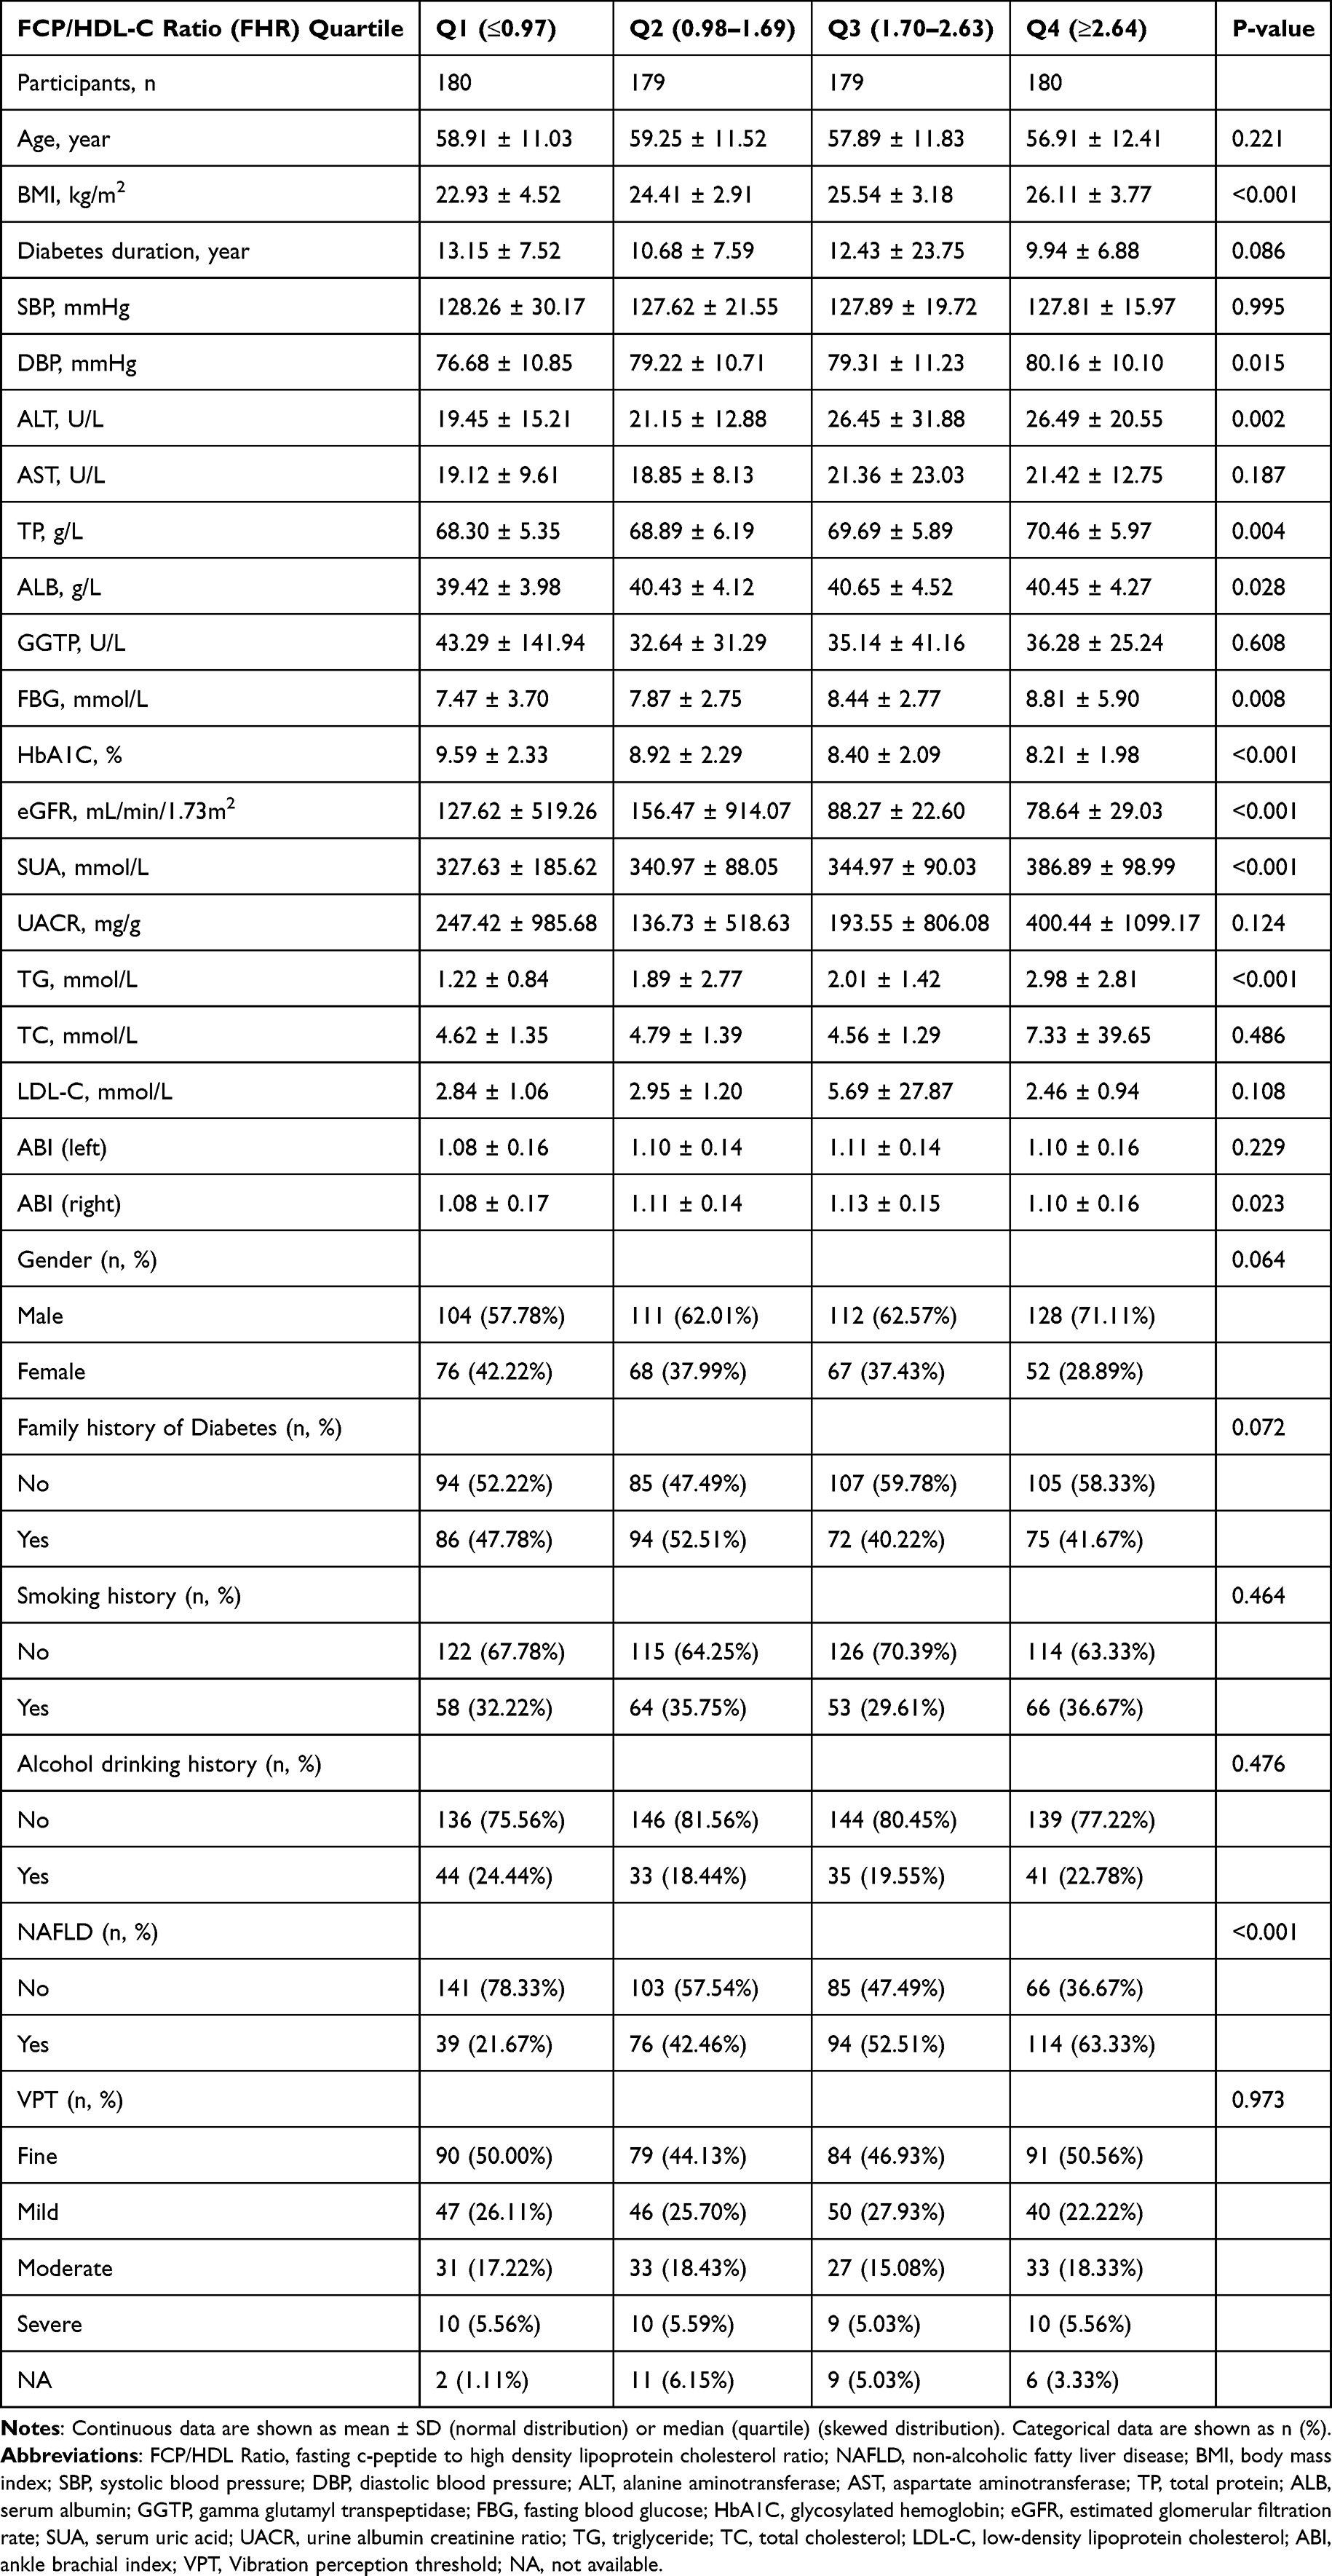 |
Table 1 The Baseline Characteristics of Participants According to FCP/HDL-C Ratio (FHR) Quartiles |
Univariate Analysis
Univariate analysis results are detailed in Table 2. We found BMI, DBP, ALT, ALB, FBG, SUA, TG and FHR levels were positively correlated with the incidence of NAFLD, while age and UACR were negatively correlated with NAFLD. Additionally, we have found that patients with a history of alcohol consumption are more prone to developing NAFLD.
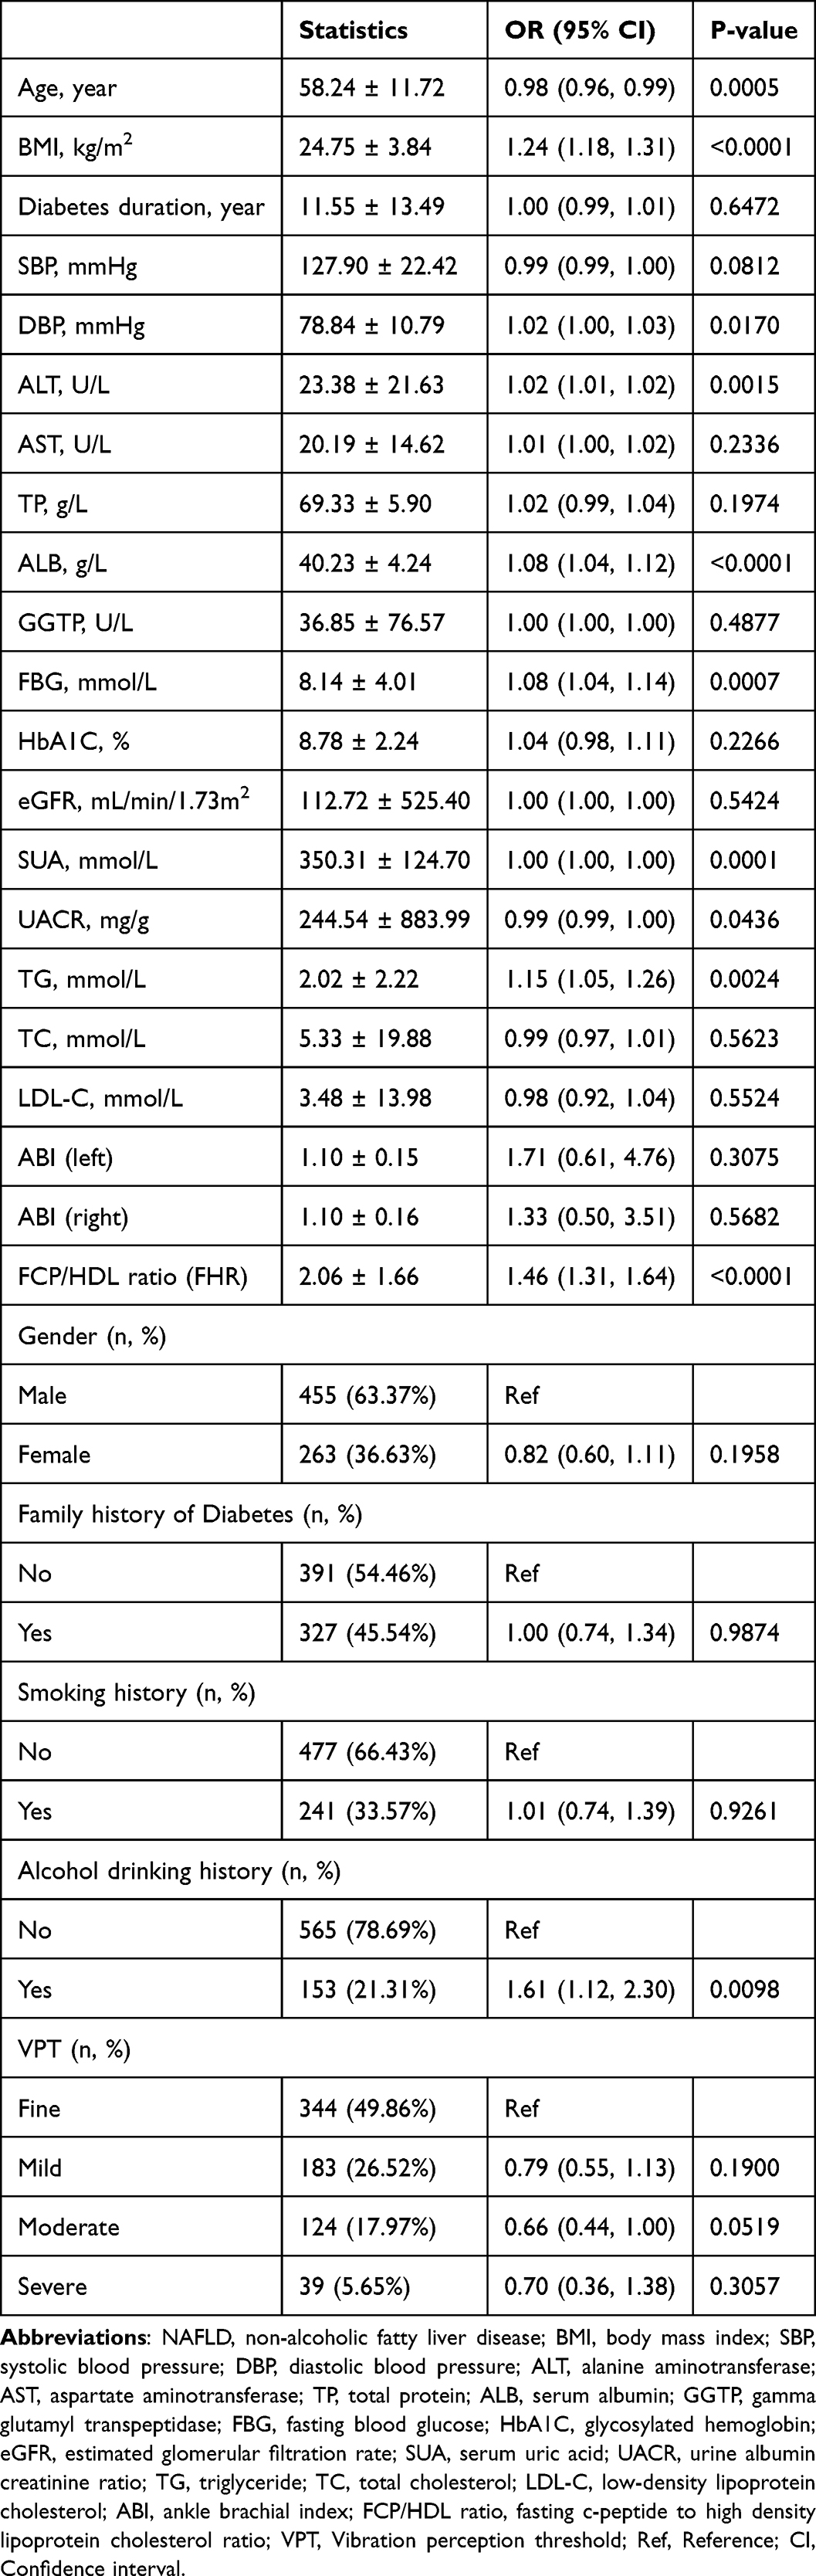 |
Table 2 The Results of Univariate Analysis of NAFLD |
The Relationship Between FHR and NAFLD
A multiple linear regression analysis was conducted to assess the association between FHR and NAFLD, including both unadjusted and adjusted models, as presented in Table 3. FHR exhibited a positive correlation with NAFLD (OR= 1.46, 95% confidence interval (CI): 1.31 to 1.64, P<0.0001). In model II, fully adjusted for all variables (gender, age, BMI, DBP, ALT, ALB, FBG, SUA, UACR, TG, alcohol drinking history), we still found the same correlation (OR= 1.30, 95% CI: (1.15 to 1.48, P<0.0001). In other words, a 1-unit increase in FHR was associated with a 0.3 (30%) increase in the incidence of NAFLD. For sensitivity analysis, FHR was analyzed as a categorical variable (quartiles). In Model II, compared with Q1 (reference group), the risk of NAFLD occurrence increased in Q2, Q3, and Q4 by 1.29 (129%), 1.40 (140%), and 2.81 (281%), respectively. A significant trend was observed across quartiles (P for trend ≤ 0.001). However, these results were inconsistent with those obtained when FHR was treated as a continuous variable, suggesting a possible nonlinear relationship between FHR and NAFLD.
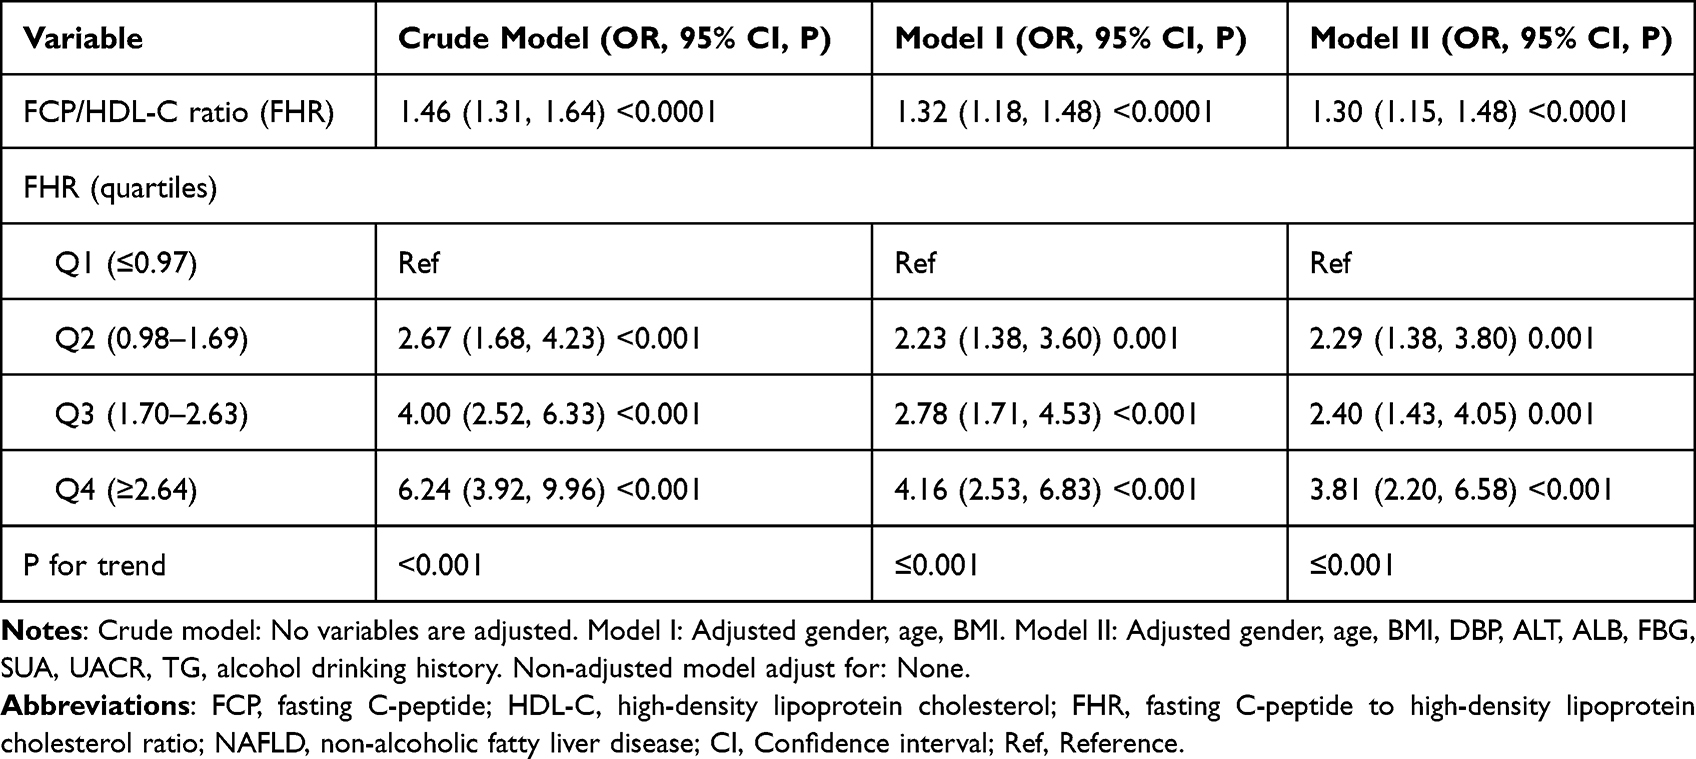 |
Table 3 Relationship Between FCP/HDL-C Ratio (FHR) and NAFLD in Different Models of Multivariate Analysis |
Non-Linear Relationship Between FHR and NAFLD
In this study, since FHR is a continuous variable, we used the generalized additive model (GAM) to assess whether a non-linear relationship exists between FHR and NAFLD. The GAM analysis revealed a non-linear relationship between FHR and NAFLD after adjusting for gender, age, BMI, DBP, ALT, ALB, FBG, SUA, UACR, TG, and alcohol drinking history (Figure 2). To analyze the relationship between FHR and NAFLD, we compared the linear regression model with a two-stage linear regression model. The log-likelihood ratio test yielded a P-value of 0.013 (P<0.05) (Table 4). A two-stage linear regression identified an FHR inflection point at 1.23. Below this threshold, NAFLD odds increased significantly (OR = 3.07, 95% CI: 1.51–6.24, P = 0.0019), while above it, the association attenuated (OR = 1.20, 95% CI: 1.05–1.37, P = 0.0081). Additionally, we calculated an E-value to evaluate the potential impact of unmeasured confounding. The E-value of 1.54 indicated that any unmeasured or unknown confounding factors would have little influence on the observed association between FHR and incident NAFLD, as it was greater than the relative risk of unmeasured confounders and FHR.
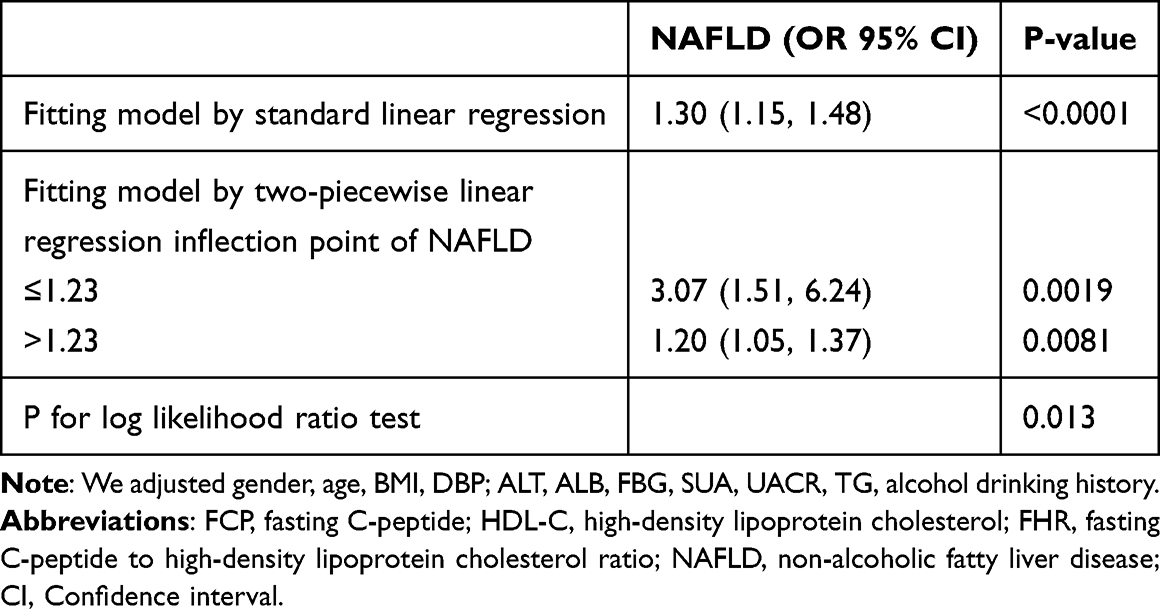 |
Table 4 Two-Piecewise Linear Regression Model to Evaluate Relationship Between FCP/HDL-C Ratio (FHR) and NAFLD |
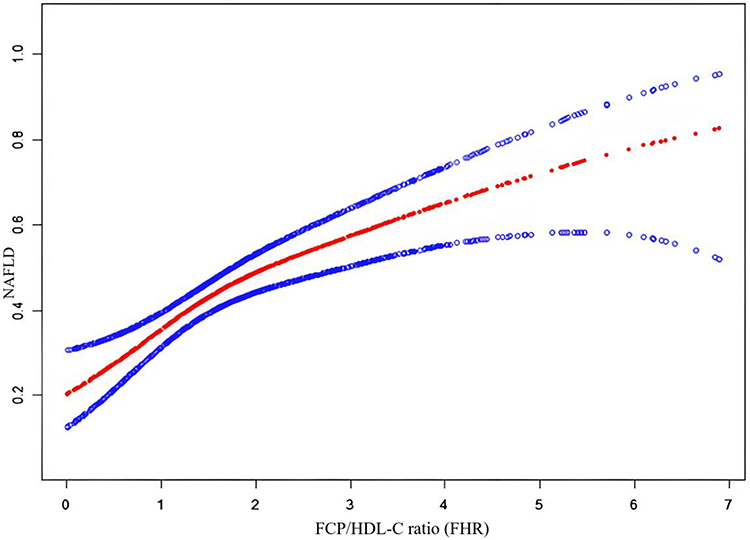 |
Figure 2 The non-linear relationship between FHR and NAFLD. |
Subgroup and Interaction Analysis
We conducted subgroup analyses to investigate potential factors that could influence the relationship between FHR and NAFLD. Stratified variables included gender, age, BMI, SBP, DBP, ALT, FBG, SUA, UACR, TG, and alcohol drinking history to assess the trend of effect sizes across these variables (Figure 3). We found interactions for SBP, ALT, FBG, UACR, TG, alcohol drinking history (all P values for interaction < 0.05). Stronger associations were present in patients with SBP <140 mmHg, ALT > 40U/L, FBG ⩽7 mmol/L, UACR ⩽30mg/g, TG ⩽1.7 mmol/L and the patients with alcohol drinking history between FHR and NAFLD. In comparison, weaker associations were apparent in patients with SBP ≥140 mmHg, ALT ⩽ 40U/L, FBG >7 mmol/L, UACR >30mg/g, TG >1.7 mmol/L and the patients without alcohol drinking history.
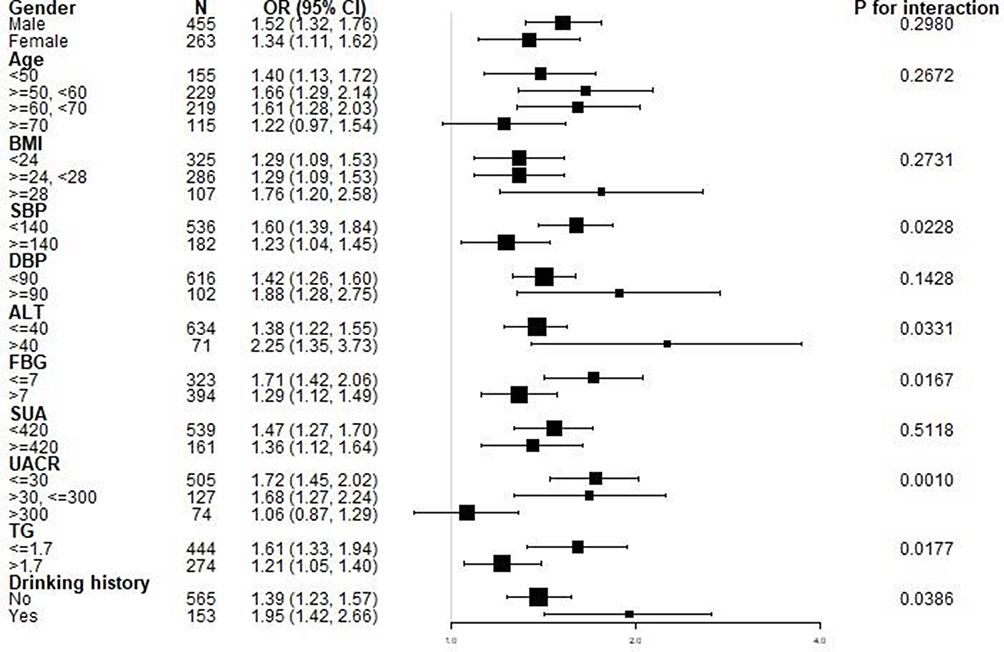 |
Figure 3 Forest plot for subgroup analysis and interaction analysis of FHR on NAFLD. Abbreviations: BMI, body mass index; SBP, systolic blood pressure; DBP, diastolic blood pressure; ALT, alanine transaminase; FBG, fasting blood glucose; SUA, serum uric acid; UACR, urinary albumin to creatinine ratio; TG, triglyceride; FHR, fasting C-peptide to high-density lipoprotein cholesterol ratio; NAFLD, non-alcoholic fatty liver disease; CI, Confidence interval. |
ROC Curve Analysis of the FHR and NAFLD Association
The associations of FCP, HDL-C, and FHR with NAFLD were examined via a Receiver Operating Characteristic (ROC) curve (Figure 4). Areas under the curves are listed for each variable were as follow: FCP: 0.649; HDL-C: 0.635; FHR: 0.697. The best cut-of value was 2.125, 1.175, and 1.608, respectively, based on the Youden index of the FCP, HDL-C, and FHR were 0.215, 0.226, and 0.355 (Table 5). FHR demonstrated a stronger association with NAFLD status, as indicated by its highest Youden index and AUC in Table 5 compared to other variables.
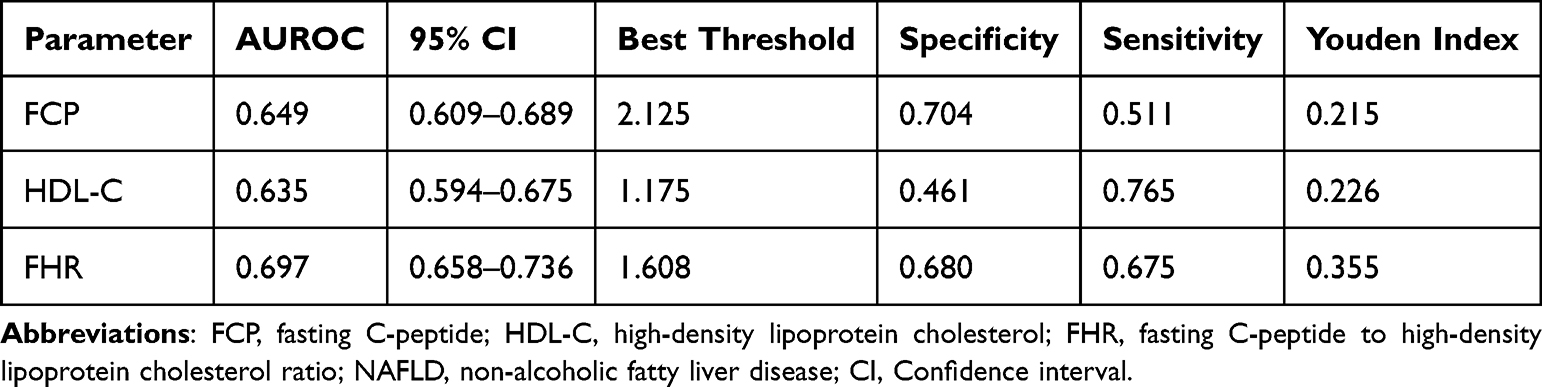 |
Table 5 Areas Under the Receiver Operating Characteristic Curves (AUROC) for Each Evaluated Parameter in Identifying NAFLD |
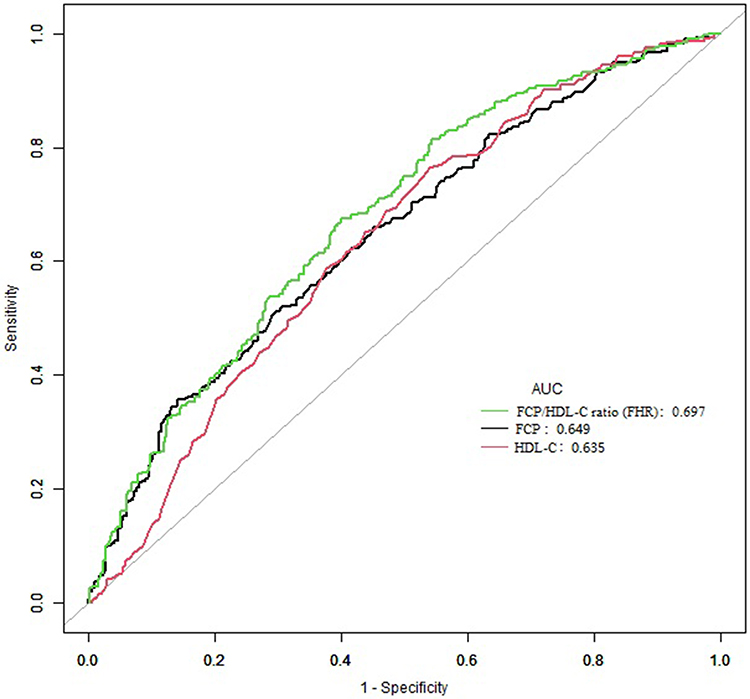 |
Figure 4 The FCP/HDL-C ratio (FHR) in NAFLD by ROC analyses. Abbreviations: FCP, fasting C-peptide; HDL-C, high-density lipoprotein cholesterol; FHR, fasting C-peptide to high-density lipoprotein cholesterol ratio; AUC, area under the curve; NAFLD, non-alcoholic fatty liver disease; ROC, receiver operating characteristic curves. |
Discussion
This cross-sectional study demonstrated a significant positive association between FHR and incident NAFLD in T2DM patients through adjusted linear regression analysis. Each 1-unit increase in FHR corresponded to a 30% elevated risk of NAFLD development. Sensitivity analysis using GAM revealed a non-linear relationship, with divergent effect magnitudes across the threshold [left (OR= 3.07, 95% CI: 1.51 to 6.24, P = 0.0019); right (OR= 1.20, 95% CI: 1.05 to 1.37, P=0.0081)], suggesting a saturation effect beyond an inflection point of FHR is 1.23. Below this threshold, each unit increase in FHR was linked to a 207% surge in NAFLD risk, whereas above 1.23, the risk increment attenuated to 20% per unit. Subgroup analyses further delineated heterogeneous associations across populations. Enhanced correlations were observed in individuals with SBP <140 mmHg, ALT > 40 U/L, FBG ≤7 mmol/L, UACR≤30 mg/g, TG≤1.7 mmol/L, and those with a drinking history. Conversely, weaker associations emerged in subgroups with SBP ≥140 mmHg, ALT ≤40 U/L, FBG >7 mmol/L, UACR >300 mg/g, TG >1.7 mmol/L, and non-drinkers.
Liver biopsy is the gold standard for diagnosing NAFLD, but due to its invasive nature, high cost, procedural risks, and other limitations, it remains challenging to widely implement in clinical practice. Abdominal ultrasound remains the most widely used clinical method for assessing hepatic steatosis. However, its diagnostic accuracy is limited by operator-dependent subjectivity and low sensitivity for mild cases.35 While computed tomography (CT) and magnetic resonance imaging (MRI) demonstrate no significant superiority over ultrasound for hepatic fat evaluation. Controlled attenuation parameter (CAP), a quantitative technique based on transient elastography, provides objective assessment of liver fat content in NAFLD but is substantially confounded by abdominal subcutaneous adipose thickness in obese individuals. Therefore, utilizing existing serum biomarkers for identifying and understanding NAFLD is of critical importance.
A recent cohort study involving 4120 Chinese patients with T2DM showed that C-peptide was positively correlated with NAFLD (OR: 1.78, 95% CI: 1.56–2.04, P < 0.001), however, it was also positively correlated with the inflammatory progression of hepatic steatosis but negatively correlated with the fibrotic progression.20 Another study using the National Health and Nutrition Examination Survey (NHANES) database, which included 3235 patients, also reached the conclusion that C-peptide levels were positively correlated with NAFLD.18 A multivariable Mendelian randomization analysis demonstrated that elevated HDL-C levels independently reduced the risk of NAFLD development.36 Alkassabany et al found that low HDL-C in schoolchildren is associated with NAFLD,37 and DeFilippis et al discovered that low serum HDL-C levels are correlated with NAFLD in the population with normal body weight.38 Casimiro et al revealed at the genetic level that reduced HDL-C exacerbates hepatocyte lipid metabolism disorders, thereby promoting the development of NAFLD.39 A recent study has shown that in the absence of diabetes, the insulin to high-density lipoprotein cholesterol (HDL-C) ratio can serve as a novel independent predictor for esophageal varices in patients with hepatitis C virus-related cirrhosis, and this indicator might be more sensitive than the traditional homeostatic model assessment of insulin resistance (HOMA-IR) score.40 C-peptide, a stable by-product of proinsulin cleavage, is unaffected by exogenous insulin administration, making it a valuable tool in clinical evaluations of islet β-cell function.41 Can the insulin to HDL-C ratio be considered analogous to FCP to HDL-C ratio? Through a comprehensive literature search, there is a lack of data regarding the relationship between the FCP/HDL-C ratio (FHR) and the probability of developing NAFLD currently. However, a rise in this ratio implies either a surge in FCP or a decline in HDL-C. As a result, our data back up the previously mentioned results suggesting that FHR levels have a significant correlation with NAFLD.
Additionally, sensitivity analyses demonstrated that the association remained consistent in populations with systolic blood pressure (SBP) <140 mmHg, alanine aminotransferase (ALT) > 40 U/L, fasting blood glucose (FBG) ≤7 mmol/L, urinary albumin-to-creatinine ratio (UACR) ≤30 mg/g, triglycerides (TG) ≤1.7 mmol/L, and alcohol consumption history. These findings confirm the robust association between the FCP/HDL-C ratio (FHR) and NAFLD risk, lending support to the rationale for investigating the link between mitigating NAFLD incidence through FHR reduction. We further evaluated thecapacity of FCP/HDL-C ratio (FHR), FCP, and HDL-C for NAFLD using ROC curve. The FHR exhibited superior discriminative performance compared to FCP or HDL-C alone. Elevated FHR levels were significantly associated with increased NAFLD prevalence. Longitudinal increases in FHR during follow-up further indicated heightened NAFLD susceptibility, underscoring the importance of lifestyle modifications to reduce disease incidence. This evidence highlights FHR as a clinically relevant indicator that is significantly associated with NAFLD. NAFLD represents a spectrum of metabolic dysregulation, encompassing insulin resistance, lipotoxicity, and fibrogenesis driven by complex interactions between systemic factors and hepatic microenvironmental responses.42 Emerging evidence highlights the dual role of C-peptide as both a mediator of pathogenesis and an indicator of hyperinsulinemia-associated hepatic injury, while HDL-C serves as a critical protective axis through anti-inflammatory and anti-fibrotic mechanisms.43–47 Here, we explore the clinical and mechanistic relevance of elevated FCP/HDL-C ratio in NAFLD progression, bridging biochemical markers to pathophysiological pathways.
C-peptide, a byproduct of insulin processing, has been mechanistically implicated in exacerbating NAFLD through multi-pronged pathways. Its direct activation of extracellular signal-regulated kinases (ERK) and downstream NF-κB and JNK signaling triggers inflammatory cascades, increasing monocyte chemoattractant protein-1 (MCP-1) expression and promoting monocyte recruitment to the liver.43,44 Concurrently, C-peptide stimulates ceramide synthesis, a lipotoxic messenger that dysregulates mitochondrial function and exacerbates hepatocyte apoptosis.45 Furthermore, elevated C-peptide reflects failure of pancreatic β-cells to respond to early-phase insulin demand, leading to compensatory hyperinsulinemia - a hallmark of insulin resistance that perpetuates hepatic steatosis via enhanced gluconeogenesis and lipid accumulation.46 Importantly, this dual mechanism positions C-peptide not only as a direct hepatotoxin but also as an indirect marker for the systemic insulin derangement underpinning fibrogenesis. In contrast, HDL-C has been proven to possess a variety of biological activities, including reverse cholesterol transport, antioxidant, anti-inflammatory, anti-apoptotic, antithrombotic, and anti-atherosclerotic effects.48,49 HDL-C exerts salutary effects through its antioxidant properties, mediating reverse cholesterol transport, and activating hepatic AMP-activated protein kinase (AMPK) α2 subunit.50,51 AMPK activation suppresses gluconeogenesis in the liver and concurrently enhances thermogenesis in brown adipose tissue, thereby counteracting systemic insulin resistance and hepatic lipid oversupply.52 Deficit in AMPK signaling or reduced HDL-C levels disrupt this axis, aggravating steatosis and inflammation. The elevation of fasting C-peptide/HDL-C ratio encapsulates the metabolic imbalance central to NAFLD pathogenesis. Elevated C-peptide amplifies pro-fibrotic and pro-inflammatory signals, while low HDL-C impairs anti-inflammatory and anti-lipotoxic countermeasures. This imbalance creates a “metabolic amplification loop” wherein increased C-peptide drives insulin resistance, further stimulating β-cell hypersecretion (C-peptide elevation), while diminished HDL-C worsens hepatic oxidative stress and fibrogenesis. The dual elevation of C-peptide and suppression of HDL-C’s protective role thus synergistically accelerate NAFLD progression.
It has significant clinical implications due to the curvilinear correlation between FHR and NAFLD. In T2DM patients, having an FHR below 1.23 was associated with a lower NAFLD prevalence, with a sharper negative correlation observed when FHR was under this threshold. This research helps clinicians improve understanding of factors associated with NAFLD. The FHR is a novel indicator associated with NAFLD, better than single indices. Elevated C - peptide alone may miss β-cell dysfunction without considering HDL - C deficiency. This ratio can enhance understanding of past studies on traditional markers. Therapeutically, targeting C - peptide bioactivity and enhancing HDL-C functionality is a dual approach. AMPK activators can improve insulin sensitivity and counter hepatocyte injury, and HDL mimetics or lipase inhibitors can restore HDL’s anti - inflammatory roles. But C-peptide’s dual functions need careful analysis. Despite support from cellular and observational studies, the key questions still remain. Longitudinal studies are required to check if the ratio predicts NASH progression and treatment response. The molecular links between C - peptide and AMPK, and the interaction between gut microbiota and HDL - related anti - inflammatory pathways need further study. Stratifying patients by this ratio can help to find high risk subgroups better. In summary, the FHR is a promising way to understand NAFLD.
The following are some of our research’s advantages: 1) This is the first study to explore the correlation between the FHR and NAFLD. 2) The study emphasizes the nonlinear relationship between FHR and NAFLD, better illustrating the relationship between dose and response. 3) To address potential confounders, rigorous statistical methods were employed to control for covariates, and E-values were calculated to assess the impact of any unmeasured confounding, thereby strengthening the reliability of our results. 4) Dual analytical approaches (continuous and categorical) were implemented for FHR assessment, mitigating random fluctuations in data interpretation while strengthening methodological rigor. 5) Stratified exploration with interaction testing optimized data utilization through multidimensional examination, ensuring more reliable inferences across population subsets. Of course, our study also has several limitations. First, the cross-sectional design cannot clarify the causal relationship between FHR and NAFLD. Second, being a single-center investigation, findings may lack generalizability to China’s broader population. Third, single measurements of FCP and HDL-C reduce data stability and specificity. Fourth, despite adjustments for variables, residual confounding from unmeasured factors such as medications, lifestyle, and comorbidities may persist. However, an E-value was calculated to assess the robustness of the findings to unmeasured confounders, and such confounding was considered unlikely to explain the results. Fifthly, while we demonstrate a significant association between the FCP/HDL-C ratio and NAFLD, we did not compare its performance to other established indices. This important validation represents a key objective for future research. Finally, ultrasound diagnosis of NAFLD has inherent sensitivity limitations compared to gold-standard methods. It should be noted, however, that it has been widely used in epidemiological studies.11,53 Future research could enhance NAFLD identification using superior techniques, such as liver biopsy. Furthermore, validating these findings necessitates a larger, more diverse sample. To enhance the reliability of the findings, future research could consider conducting long-term follow-ups or case-control studies.
Conclusion
Based on the cumulative evidence, this study identified a nonlinear association between FHR levels and the risk of NAFLD among Chinese individuals with T2DM. These findings suggest the potential associative value of FHR as a novel indicator for integration into NAFLD risk assessment. While FHR measurement may provide a potential tool for identifying individuals with a higher statistical likelihood of NAFLD, its clinical utility remains to be established. Further prospective validation through larger, multi-center cohort studies is required to confirm these findings and assess their generalizability across diverse populations.
Data Sharing Statement
All data generated or analyzed in this study are stored in the Department of Endocrinology, Shenzhen People’s Hospital, Shenzhen, Guangdong Province, China, and can be obtained from the corresponding author upon reasonable request.
Ethical Statement and Consent to Participate
The study was conducted in accordance with the ethical principles of the Declaration of Helsinki (2008 revision). Ethics Committee approval (LL-KY-2025062-02) was obtained from Shenzhen People’s Hospital. Prior to study participation, informed consent was obtained from all participants.
Acknowledgments
We sincerely thank all members for scientific editing and proofreading of this manuscript.
Author Contributions
Qian Liang: conceptualization, methodology, formal analysis, writing -original draft. Haofei Hu: formal analysis, software, investigation, writing - review & editing. Xuan Chen: methodology, investigation, validation, writing - review & editing. Shufen Yang: data curation, visualization, writing - review & editing. Ying Zhang: investigation, validation, writing - review & editing. Yan Wu: resources, writing - review & editing. Xinyu Wang: supervision, project administration, funding acquisition, writing - review & editing. Hong Chen: supervision, project administration, funding acquisition, writing - review & editing. All authors took part in drafting, revising or critically reviewing the article; gave final approval of the version to be published; have agreed on the journal to which the article has been submitted; and agree to be accountable for all aspects of the work.
Funding
Our study was supported by the Shenzhen Science and Technology Plan Project (grant number JCYJ 20220818102001003), and Heyuan Science and Technology Plan Project (241106151472863).
Disclosure
The authors declare no conflict of interest.
References
1. Lazarus JV, Mark HE, Anstee QM, et al. Advancing the global public health agenda for nafld: a consensus statement. Nat Rev Gastroenterol Hepatol. 2022;19(1):60–78. doi:10.1038/s41575-021-00523-4
2. Eslam M, Newsome PN, Sarin SK, et al. A new definition for metabolic dysfunction-associated fatty liver disease: an international expert consensus statement. J Hepatol. 2020;73(1):202–209. doi:10.1016/j.jhep.2020.03.039
3. Rinella ME, Lazarus JV, Ratziu V, et al. A multisociety delphi consensus statement on new fatty liver disease nomenclature. J Hepatol. 2023;79(6):1542–1556. doi:10.1016/j.jhep.2023.06.003
4. Lou TW, Yang RX, Fan JG. The global burden of fatty liver disease: the major impact of China. Hepatobiliary Surg Nutr. 2024;13(1):119–123. doi:10.21037/hbsn-23-556
5. Zhou F, Zhou J, Wang W, et al. Unexpected rapid increase in the burden of nafld in China from 2008 to 2018: a systematic review and meta-analysis. Hepatology. 2019;70(4):1119–1133. doi:10.1002/hep.30702
6. Cho EE, Ang CZ, Quek J, et al. Global prevalence of non-alcoholic fatty liver disease in type 2 diabetes mellitus: an updated systematic review and meta-analysis. Gut. 2023;72(11):2138–2148. doi:10.1136/gutjnl-2023-330110
7. Zhou J, Zhou F, Wang W, et al. Epidemiological features of nafld from 1999 to 2018 in China. Hepatology. 2020;71(5):1851–1864. doi:10.1002/hep.31150
8. Le MH, Le DM, Baez TC, et al. Global incidence of non-alcoholic fatty liver disease: a systematic review and meta-analysis of 63 studies and 1,201,807 persons. J Hepatol. 2023;79(2):287–295. doi:10.1016/j.jhep.2023.03.040
9. Duell PB, Welty FK, Miller M, et al. Nonalcoholic fatty liver disease and cardiovascular risk: a scientific statement from the American heart association. Arterioscler Thromb Vasc Biol. 2022;42(6):e168–e185. doi:10.1161/ATV.0000000000000153
10. Sun DQ, Targher G, Byrne CD, et al. An international delphi consensus statement on metabolic dysfunction-associated fatty liver disease and risk of chronic kidney disease. Hepatobiliary Surg Nutr. 2023;12(3):386–403. doi:10.21037/hbsn-22-421
11. Younossi ZM, Paik JM, Al SR, Golabi P, Younossi I, Henry L. Are there outcome differences between nafld and metabolic-associated fatty liver disease? Hepatology. 2022;76(5):1423–1437. doi:10.1002/hep.32499
12. Kanwal F, Kramer JR, Li L, et al. Effect of metabolic traits on the risk of cirrhosis and hepatocellular cancer in nonalcoholic fatty liver disease. Hepatology. 2020;71(3):808–819. doi:10.1002/hep.31014
13. Kim KS, Hong S, Han K, Park CY. Association of non-alcoholic fatty liver disease with cardiovascular disease and all cause death in patients with type 2 diabetes mellitus: nationwide population based study. BMJ. 2024;384:e76388. doi:10.1136/bmj-2023-076388
14. Mantovani A, Petracca G, Beatrice G, Tilg H, Byrne CD, Targher G. Non-alcoholic fatty liver disease and risk of incident diabetes mellitus: an updated meta-analysis of 501 022 adult individuals. Gut. 2021;70(5):962–969. doi:10.1136/gutjnl-2020-322572
15. Rinella ME, Neuschwander-Tetri BA, Siddiqui MS, et al. Aasld practice guidance on the clinical assessment and management of nonalcoholic fatty liver disease. Hepatology. 2023;77(5):1797–1835. doi:10.1097/HEP.0000000000000323
16. Leighton E, Sainsbury CA, Jones GC. A practical review of c-peptide testing in diabetes. Diabetes Ther. 2017;8(3):475–487. doi:10.1007/s13300-017-0265-4
17. Zhao C, Liu H, Deng Y, et al. Maternal fasting serum c-peptide concentrations in the first and second trimesters and subsequent risk of gestational diabetes mellitus: a nested case-control study among Chinese women. Diabet Res Clin Pract. 2024:208111111. doi:10.1016/j.diabres.2024.111111
18. Atsawarungruangkit A, Chenbhanich J, Dickstein G. C-peptide as a key risk factor for non-alcoholic fatty liver disease in the United States population. World J Gastroenterol. 2018;24(32):3663–3670. doi:10.3748/wjg.v24.i32.3663
19. Mansour A, Mohajeri-Tehrani MR, Samadi M, et al. Risk factors for non-alcoholic fatty liver disease-associated hepatic fibrosis in type 2 diabetes patients. Acta Diabetol. 2019;56(11):1199–1207. doi:10.1007/s00592-019-01374-x
20. Wang N, Wang Y, Zhang W, et al. C-peptide is associated with nafld inflammatory and fibrotic progression in type 2 diabetes. Diabetes Metab Res Rev. 2020;36(2):e3210. doi:10.1002/dmrr.3210
21. Sheka AC, Adeyi O, Thompson J, Hameed B, Crawford PA, Ikramuddin S. Nonalcoholic steatohepatitis: a review. JAMA. 2020;323(12):1175–1183. doi:10.1001/jama.2020.2298
22. Katsiki N, Mikhailidis DP, Mantzoros CS. Non-alcoholic fatty liver disease and dyslipidemia: an update. Metabolism. 2016;65(8):1109–1123. doi:10.1016/j.metabol.2016.05.003
23. Crudele L, De Matteis C, Piccinin E, et al. Low hdl-cholesterol levels predict hepatocellular carcinoma development in individuals with liver fibrosis. JHEP Rep. 2023;5(1):100627. doi:10.1016/j.jhepr.2022.100627
24. Karami S, Poustchi H, Sarmadi N, et al. Association of anti-oxidative capacity of hdl with subclinical atherosclerosis in subjects with and without non-alcoholic fatty liver disease. Diabetol Metab Syndr. 2021;13(1):121. doi:10.1186/s13098-021-00741-5
25. Tutunchi H, Saghafi-Asl M, Ebrahimi-Mameghani M, Ostadrahimi A. Food insecurity and lipid profile abnormalities are associated with an increased risk of nonalcoholic fatty liver disease (nafld): a case-control study. Ecol Food Nutr. 2021;60(4):508–524. doi:10.1080/03670244.2021.1875453
26. Hung MC, Chen CF, Tsou MT, Lin HH, Hwang LC, Hsu CP. Relationship between gallstone disease and cardiometabolic risk factors in elderly people with non-alcoholic fatty liver disease. Diabetes Metab Syndr Obes. 2020:133579–133585. doi:10.2147/DMSO.S266947
27. Fan JG, Jia JD, Li YM, et al. Guidelines for the diagnosis and management of nonalcoholic fatty liver disease: update 2010: (published in Chinese on chinese journal of hepatology 2010; 18:163-166). J Dig Dis. 2011;12(1):38–44. doi:10.1111/j.1751-2980.2010.00476.x
28. Cen J, Han Y, Liu Y, Hu H. Evaluated glomerular filtration rate is associated with non-alcoholic fatty liver disease: a 5-year longitudinal cohort study in Chinese non-obese people. Front Nutr. 2022:9916704. doi:10.3389/fnut.2022.916704
29. Wu L, Zhang M, Hu H, Wan Q. Elevated gamma-glutamyl transferase has a non-linear association with incident non-alcoholic fatty liver disease in the non-obese Chinese population: a secondary retrospective study. Lipids Health Dis. 2021;20(1):142. doi:10.1186/s12944-021-01577-8
30. Shen L, Lin Y, Chen W, Peng H. Association between lipid accumulation product and non-alcoholic fatty liver disease with normal weight: a population-based study. Front Med Lausanne. 2025:121565997. doi:10.3389/fmed.2025.1565997
31. Allison PD. Missing data techniques for structural equation modeling. J Abnorm Psychol. 2003;112(4):545–557. doi:10.1037/0021-843X.112.4.545
32. Erviti J, Alonso A, Oliva B, et al. Oral bisphosphonates are associated with increased risk of subtrochanteric and diaphyseal fractures in elderly women: a nested case-control study. BMJ Open. 2013;3(1):e002091. doi:10.1136/bmjopen-2012-002091
33. Haneuse S, Vanderweele TJ, Arterburn D. Using the e-value to assess the potential effect of unmeasured confounding in observational studies. JAMA. 2019;321(6):602–603. doi:10.1001/jama.2018.21554
34. von Elm E, Altman DG, Egger M, Pocock SJ, Gøtzsche PC, Vandenbroucke JP. Strengthening the reporting of observational studies in epidemiology (strobe) statement: guidelines for reporting observational studies. BMJ. 2007;335(7624):806–808. doi:10.1136/bmj.39335.541782.AD
35. European Association for the Study of the Liver. Easl-aleh clinical practice guidelines: non-invasive tests for evaluation of liver disease severity and prognosis. J Hepatol. 2015;63(1):237–264. doi:10.1016/j.jhep.2015.04.006
36. Xie J, Huang H, Liu Z, et al. The associations between modifiable risk factors and nonalcoholic fatty liver disease: a comprehensive mendelian randomization study. Hepatology. 2023;77(3):949–964. doi:10.1002/hep.32728
37. Alkassabany YM, Farghaly AG, El-Ghitany EM. Prevalence, risk factors, and predictors of nonalcoholic fatty liver disease among schoolchildren: a hospital-based study in Alexandria, Egypt. Arab J Gastroenterol. 2014;15(2):76–81. doi:10.1016/j.ajg.2014.05.002
38. Defilippis AP, Blaha MJ, Martin SS, et al. Nonalcoholic fatty liver disease and serum lipoproteins: the multi-ethnic study of atherosclerosis. Atherosclerosis. 2013;227(2):429–436. doi:10.1016/j.atherosclerosis.2013.01.022
39. Castillejo-López C, Bárcenas-Walls JR, Cavalli M, Larsson A, Wadelius C. A regulatory element associated to nafld in the promoter of dio1 controls ldl-c, hdl-c and triglycerides in hepatic cells. Lipids Health Dis. 2024;23(1):48. doi:10.1186/s12944-024-02029-9
40. Elfayoumy KN, Berengy MS, Emran T. Insulin/high-density lipoprotein cholesterol ratio: a newly-discovered predictor of esophageal varices in patients with hepatitis c virus-related cirrhosis in the absence of diabetes mellitus. Turk J Gastroenterol. 2019;30(2):155–162. doi:10.5152/tjg.2018.18237
41. Qin J, Sun R, Ding D. Effects of serum c-peptide level on blood lipid and cardiovascular and cerebrovascular injury in patients with type 2 diabetes mellitus: a meta-analysis. Contrast Media Mol Imaging. 2022:20226314435. doi:10.1155/2022/6314435
42. Friedman SL, Neuschwander-Tetri BA, Rinella M, Sanyal AJ. Mechanisms of nafld development and therapeutic strategies. Nat Med. 2018;24(7):908–922. doi:10.1038/s41591-018-0104-9
43. Tilg H, Moschen AR. Inflammatory mechanisms in the regulation of insulin resistance. Mol Med. 2008;14(3–4):222–231. doi:10.2119/2007-00119.Tilg
44. Shpakov AO, Granstrem OK. C-peptide physiological effects. Ross Fiziol Zh Im I M Sechenova. 2013;99(2):196–211.
45. Yosten GL, Maric-Bilkan C, Luppi P, Wahren J. Physiological effects and therapeutic potential of proinsulin c-peptide. Am J Physiol Endocrinol Metab. 2014;307(11):E955–E968. doi:10.1152/ajpendo.00130.2014
46. Hui JM, Sud A, Farrell GC, et al. Insulin resistance is associated with chronic hepatitis c virus infection and fibrosis progression [corrected]. Gastroenterology. 2003;125(6):1695–1704. doi:10.1053/j.gastro.2003.08.032
47. Marques RG, Fontaine MJ, Rogers J. C-peptide: much more than a byproduct of insulin biosynthesis. Pancreas. 2004;29(3):231–238. doi:10.1097/00006676-200410000-00009
48. Gomaraschi M, Basilico N, Sisto F, et al. High-density lipoproteins attenuate interleukin-6 production in endothelial cells exposed to pro-inflammatory stimuli. Biochim Biophys Acta. 2005;1736(2):136–143. doi:10.1016/j.bbalip.2005.08.003
49. Ganjali S, Momtazi AA, Banach M, Kovanen PT, Stein EA, Sahebkar A. Hdl abnormalities in familial hypercholesterolemia: focus on biological functions. Prog Lipid Res. 2017:6716–6726. doi:10.1016/j.plipres.2017.05.001
50. Ouimet M, Barrett TJ, Fisher EA. Hdl and reverse cholesterol transport. Circ Res. 2019;124(10):1505–1518. doi:10.1161/CIRCRESAHA.119.312617
51. Ma A, Wang J, Yang L, An Y, Zhu H. Ampk activation enhances the anti-atherogenic effects of high density lipoproteins in apoe(-/-) mice. J Lipid Res. 2017;58(8):1536–1547. doi:10.1194/jlr.M073270
52. Wu N, Zhai X, Yuan F, et al. Genetic variation in tbc1 domain family member 1 gene associates with the risk of lean nafld via high-density lipoprotein. Front Genet. 2022:131026725. doi:10.3389/fgene.2022.1026725
53. Zhang Y, Wang F, Tang J, Shen L, He J, Chen Y. Association of triglyceride glucose-related parameters with all-cause mortality and cardiovascular disease in nafld patients: nhanes 1999-2018. Cardiovasc Diabetol. 2024;23(1):262. doi:10.1186/s12933-024-02354-4
 © 2025 The Author(s). This work is published and licensed by Dove Medical Press Limited. The
full terms of this license are available at https://www.dovepress.com/terms
and incorporate the Creative Commons Attribution
- Non Commercial (unported, 4.0) License.
By accessing the work you hereby accept the Terms. Non-commercial uses of the work are permitted
without any further permission from Dove Medical Press Limited, provided the work is properly
attributed. For permission for commercial use of this work, please see paragraphs 4.2 and 5 of our Terms.
© 2025 The Author(s). This work is published and licensed by Dove Medical Press Limited. The
full terms of this license are available at https://www.dovepress.com/terms
and incorporate the Creative Commons Attribution
- Non Commercial (unported, 4.0) License.
By accessing the work you hereby accept the Terms. Non-commercial uses of the work are permitted
without any further permission from Dove Medical Press Limited, provided the work is properly
attributed. For permission for commercial use of this work, please see paragraphs 4.2 and 5 of our Terms.
Recommended articles

Association Between Obesity and COVID-19 Disease Severity in Saudi Population
Alqahtani FY, Aleanizy FS, Mohamed RAEH, Al-Maflehi N, Alrfaei BM, Almangour TA, Alkhudair N, Bawazeer G, Shamlan G, Alanazi MS
Diabetes, Metabolic Syndrome and Obesity 2022, 15:1527-1535
Published Date: 16 May 2022
Is Intermittent Fasting Better Than Continuous Energy Restriction for Adults with Overweight and Obesity?
Ye YF, Zhang MX, Lin Z, Tang L
Diabetes, Metabolic Syndrome and Obesity 2022, 15:2813-2826
Published Date: 15 September 2022
Baseline Serum BCAAs are Related to the Improvement in Insulin Resistance in Obese People After a Weight Loss Intervention
Zhang C, Wang S, Wu Y, Guo Y, Wang X
Diabetes, Metabolic Syndrome and Obesity 2023, 16:179-186
Published Date: 19 January 2023
GLP-1RA Liraglutide and Semaglutide Improves Obesity-Induced Muscle Atrophy via SIRT1 Pathway
Xiang J, Qin L, Zhong J, Xia N, Liang Y
Diabetes, Metabolic Syndrome and Obesity 2023, 16:2433-2446
Published Date: 15 August 2023
The Economic Impact of Obesity in Turkey: A Micro-Costing Analysis
Gogas Yavuz D, Akhtar O, Low K, Gras A, Gurser B, Yilmaz ES, Basse A
ClinicoEconomics and Outcomes Research 2024, 16:123-132
Published Date: 5 March 2024