Back to Journals » Neuropsychiatric Disease and Treatment » Volume 22
Association Between Triglyceride-Glucose Index and Hyperuricemia in Hospitalized Patients with Depression: A Cross-Sectional Study
Authors Zhang L, Guo Y ![]() , Wang Z
, Wang Z ![]() , Wang Y, Yu T
, Wang Y, Yu T ![]() , Tian Y
, Tian Y
Received 17 October 2025
Accepted for publication 25 February 2026
Published 10 March 2026 Volume 2026:22 575137
DOI https://doi.org/10.2147/NDT.S575137
Checked for plagiarism Yes
Review by Single anonymous peer review
Peer reviewer comments 2
Editor who approved publication: Dr Roger Pinder
Loufeng Zhang,1 Yuanyuan Guo,2 Zhihui Wang,3 Yanhong Wang,4 Tao Yu,5 Yanghua Tian6
1Department of Geriatric Psychology, Affiliated Psychological Hospital of Anhui Medical University (Anhui Mental Health Center; The Fourth People’s Hospital of Hefei), Hefei, Anhui, People’s Republic of China; 2Department of Neurology, The First Affiliated Hospital of Anhui Medical University, Hefei, Anhui, People’s Republic of China; 3Department of Medical Record Management, Affiliated Psychological Hospital of Anhui Medical University (Anhui Mental Health Center; The Fourth People’s Hospital of Hefei), Hefei, Anhui, People’s Republic of China; 4Department of Medical Affairs, Affiliated Psychological Hospital of Anhui Medical University (Anhui Mental Health Center; The Fourth People’s Hospital of Hefei), Hefei, Anhui, People’s Republic of China; 5Department of Clinical Nutrition, Affiliated Psychological Hospital of Anhui Medical University (Anhui Mental Health Center; The Fourth People’s Hospital of Hefei), Hefei, Anhui, People’s Republic of China; 6Department of Neurology, The First Affiliated Hospital of Anhui Medical University; Anhui Province Key Laboratory of Cognition and Neuropsychiatric Disorders; Collaborative Innovation Center of Neuropsychiatric Disorders and Mental Health, Hefei, Anhui, People’s Republic of China
Correspondence: Yanghua Tian, Email [email protected]
Objective: This study aimed to investigate the association between the triglyceride-glucose (TyG) index and hyperuricemia (HUA) in hospitalized patients with depression and to explore subgroup heterogeneity, thus providing evidence for early prevention and management of HUA in this population.
Methods: A retrospective cross-sectional study was conducted on 3196 hospitalized patients with depression (aged ≥ 18 years) admitted to the Affiliated Mental Hospital of Anhui Medical University between May 2022 and June 2024. HUA was defined as serum uric acid (SUA) > 420 μmol/L in men and > 360 μmol/L in women. After assessing multicollinearity using variance inflation factors (VIF), we performed hierarchical multivariable logistic regression to examine the association between the TyG index and HUA. Restricted cubic spline (RCS) analysis and quartile grouping were used to explore the dose-response relationship. Subgroup analyses were conducted to investigate potential heterogeneity.
Results: The overall prevalence of HUA was 11.5% (16.0% in men and 9.5% in women). After adjusting for potential confounders, the TyG index was significantly associated with HUA risk (OR = 1.76, 95% CI: 1.37– 2.25, p < 0.001). RCS analysis revealed a positive dose-response relationship between the TyG index and HUA risk, with an accelerated increase observed when the TyG index exceeded 9. A TyG index ≥ 9 was identified as a potential risk threshold.
Conclusion: The TyG index is an independent risk factor for HUA in hospitalized patients with depression. Incorporating the TyG index into metabolic risk assessment may facilitate early identification and intervention of HUA in this population.
Keywords: depression, TyG index, hyperuricemia, cross-sectional study
Introduction
Depression is a common mental disorder characterized by core clinical symptoms including persistent low mood, diminished interest or pleasure, and cognitive deficits.1 Mood (affective) disorders are a group of conditions primarily characterized by disturbances in mood; depressive disorders are a major subtype, defined by persistent depressed mood and/or loss of interest or pleasure with associated cognitive and somatic symptoms. According to the 2021 Global Burden of Disease Study (GBD), the age-standardized Disability-Adjusted Life Years (DALYs) rate for depression increased by 16.4% between 2010 and 2021, indicating a continuing rise in its disease burden.2 The World Health Organization (WHO) estimates that approximately 350 million people worldwide are affected by depression, and this number continues to climb. It is projected that by 2030, depression will become the leading cause of the global disease burden.3 Patients with depression often present with various metabolic disturbances and have a significantly higher risk of cardiovascular diseases, type 2 diabetes, obesity, and dyslipidemia compared to the general population.4
Uric Acid (UA) (2, 6, 8-trioxopurine-C5H4N4O3) is a heterocyclic organic compound,5 and abnormal levels of UA may be associated with the onset and remission of depressive symptoms.6,7 UA is primarily excreted through the kidneys. Disorders in purine metabolism, increased UA production, or impaired excretion can lead to Hyperuricemia (HUA), which contributes to various complications such as kidney diseases, metabolic syndrome, hypertension, and cardiovascular diseases.8–10 Research on the association between depression and HUA has gradually gained attention in recent years, but existing findings remain highly controversial. Some studies have reported elevated serum uric acid (SUA) levels and a higher prevalence of HUA in depressed patients (particularly among the elderly, adolescents, and those with specific severity levels),11–13 and have found that depressive symptoms are associated with higher UA and C-Reactive Protein (CRP) levels.14 Other studies, however, have reported contradictory results.15 Moreover, a meta-analysis and a two-sample bidirectional Mendelian randomization study involving European and South American populations found no causal relationship between SUA and depression.16
Insulin Resistance (IR) itself represents a low-grade inflammatory state and is associated with various metabolic diseases.17 Recent studies have revealed a bidirectional promoting relationship between HUA and IR.18 The Homeostasis Model Assessment of Insulin Resistance (HOMA-IR) is the most commonly used clinical indicator for assessing IR. Studies have found that the Triglyceride-Glucose (TyG) index outperforms other IR indicators in predicting HUA.19 The TyG index, calculated as ln[fasting TG (mg/dL) × FPG (mg/dL) /2], is simple, economical, and reliable. Shi et al found that individuals with a higher TyG index had a significantly increased likelihood of developing depressive symptoms.20 A systematic review evaluating the significance of the TyG index in depressed patients indicated that for every 1-unit increase in the TyG index, the odds of developing depression were significantly elevated.21 However, no studies to date have explored the predictive value of the TyG index for HUA in patients with depression. Patients with depression are often accompanied by metabolic disorders, and the TyG index is associated with depressive symptoms. Thus, this study aims to investigate the association between the TyG index and HUA in this population.
Materials and Methods
Study Design and Participants
This cross-sectional study was conducted at a large public psychiatric specialty hospital in China—the Anhui Medical University Affiliated Mental Hospital. A total of 3196 inpatients diagnosed with depression were included. All patients were independently diagnosed by two experienced psychiatrists using the Structured Clinical Interview for DSM-IV (SCID). The recruitment period spanned from May 2022 to June 2024. The inclusion criteria were as follows: (1) Meeting the diagnostic criteria for “depressive episode” (F32) or “recurrent depressive disorder” (F33) according to the International Classification of Diseases, 10th Revision (ICD-10); (2) Age ≥18 years, regardless of gender; (3) Ability to comprehend the scale content and cooperate in completing clinical data collection. The exclusion criteria were as follows: (1) History of traumatic brain injury, neurological disorders, or other severe chronic physical diseases; (2) Female patients who were pregnant or breastfeeding; (3) Comorbidity with other severe mental disorders such as schizophrenia or personality disorders; (4) Patients with communication difficulties; (5) Patients with missing data as height and weight (shown in Figure 1).
 |
Figure 1 Flow chart of the study participants. |
This study strictly adhered to the ethical principles of the Declaration of Helsinki and was reviewed by the Ethics Committee of Anhui Medical University Affiliated Mental Hospital (Hefei Fourth People’s Hospital). The study met the criteria for exemption (Approval No.: HFSY-IRB-YJ-MCLL-ZLF [2025–069-001]), and the requirement for written informed consent was waived because this was a retrospective analysis of routinely collected, de-identified clinical data with minimal risk to participants. All data were de-identified prior to analysis, were accessible only to the research team, and were reported in aggregate to protect confidentiality.
Methods
General Information
General demographic data and clinical information of patients were collected from the hospital’s electronic medical record system.
- Demographic data: Gender; age; Marital status: married; unmarried (including single, divorced, and widowed participants); educational level (primary school and below; junior high school; senior high school; college and above).
- Clinical indicators: Disease duration; presence of comorbid psychotic symptoms (delusions, hallucinations, catatonia, etc).; presence of comorbid hypertension; presence of comorbid diabetes.
Blood Sample Collection and Detection
All data on biochemical indicators were collected by nurses between 06:00 and 07:00 after an overnight fast (8–12 hours). Blood samples were sent to the hospital laboratory for analysis within 1 hour. Plasma biochemical parameters were measured using an automatic biochemical analyzer and commercial kits. The detected indicators included fasting plasma glucose (FPG), total cholesterol (TC), triglycerides (TG), high-density lipoprotein cholesterol (HDL-C), SUA, and serum creatinine (SCr).
Collection of Body Weight and Height Data
Height was measured using a standard method: participants stood upright without shoes, kept their heads level, and height was measured vertically to the nearest centimeter using a stadiometer. Weight was measured in kilograms using a digital scale, which was calibrated before each measurement; all participants were barefoot during weight measurement. The formula for calculating Body Mass Index (BMI) is: Weight (kg) / [Height (m)] 2.
Definition of Relevant Indicators
HUA: SU >420 μmol/L in males or >360 μmol/L in females.22
Non-hyperuricemia (NUA): SUA ≤420 μmol/L in males and ≤360 μmol/L in females.
TyG Index:23 The calculation formula is: TyG index= ln [Fasting TG (mg/dL) × Fasting FPG (mg/dL) /2]. Since the units of TG and FPG in laboratory test reports were mmol/L, unit conversion was performed: 1 mmol/L TG = 88.57 mg/dL and 1 mmol/L FPG = 18.018 mg/dL. Participants were divided into four groups according to the quartiles of the TyG index (P25, P50, P75). The TyG quartile Q4 group was set as the reference: Q1 (TyG<8.1157), Q2 (8.1157≤TyG <8.4855), Q3 (8.4855≤TyG < 8.8785), Q4 (TyG ≥ 8.8785).
Hypertension: Hypertension was defined as either a self-reported history of hypertension diagnosed by a physician, or a systolic blood pressure (SBP) ≥140 mmHg and/or a diastolic blood pressure (DBP) ≥90 mmHg.24 A validated upper-arm electronic sphygmomanometer (meeting international standards) was used. After admission, a professionally trained nurse measured the participants’ blood pressure once every 1–2 minutes, and the average value of three measurements was taken.
Diabetes Mellitus: In accordance with the criteria established by the American Diabetes Association (ADA): Normal blood glucose: FPG<5.6 mmol/L; Impaired fasting glucose (IFG): 5.6 mmol/L≤FPG <7 mmol/L; Diabetes mellitus: FPG ≥7.0 mmol/L, or a self-reported history of diabetes mellitus diagnosed by a physician.25
Depression with Psychotic Symptoms (Psychiatric Sx): In accordance with the diagnostic criteria of the International Classification of Diseases, 10th Revision (ICD-10), it refers to cases that meet the diagnostic criteria for a depressive episode and are accompanied by delusions and/or hallucinations.26
Statistical Analysis
Statistical analyses were conducted using IBM SPSS Statistics (Version 27.0) and R software (Version 4.3.0). The normality of continuous variables was assessed using the Kolmogorov–Smirnov test. Continuous variables with non-normal distribution were presented as median (interquartile range), and categorical variables as frequencies and percentages. Between-group comparisons were performed using the t-test, Mann–Whitney U-test, Kruskal–Wallis test, or chi-square test, as appropriate. Participants with missing key variables required for the primary analyses (eg, height/weight for BMI) were excluded; remaining analyses were performed using complete cases. Univariate and multivariable logistic regression models were used to examine the association between the TyG index and HUA, with the TyG index modeled both as a continuous variable and by quartiles. To reduce multicollinearity, triglycerides (TG) and fasting plasma glucose (FPG) —which are components of the TyG index—were not included in the fully adjusted model. Within the logistic regression framework, restricted cubic splines (RCS) were applied to evaluate potential non-linear associations between the TyG index and HUA, adjusting for prespecified confounders. Subgroup analyses were performed by sex, age, marital status, presence of psychotic symptoms, hypertension, BMI category, and diabetes status, and interaction was assessed by including multiplicative terms. Results were visualized using forest plots. A two-tailed P value < 0.05 was considered statistically significant.
Results
Comparative Analysis of Clinical Characteristics Between the HUA Group and the NUA Group
Among the 3196 patients with depression, there were 979 male patients, accounting for 30.6%, and 2217 female patients, accounting for 69.4%. The Kolmogorov–Smirnov test was used for normality testing. The measurement data including age, course of disease, SBP, DBP, BMI, TyG index, TC, TG, SCr, FPG, and HDL-C did not conform to the normal distribution. All measurement data were described using median (P25, P75), and nonparametric tests were used for intergroup comparison. Table 1 shows that among the 3196 patients with depression, there were 368 cases (11.5%) in the HUA group and 2828 cases (88.5%) in the NUA group. Patients in the HUA group were younger (median 46 years vs 54 years, p < 0.001), and the proportion of males was higher. In terms of marital status and education level, the proportions of unmarried (42.9% vs 23.4%), those with senior high school education (17.1% vs 14.3%), and those with college education or above (29.9% vs 23.0%) in the HUA group were all higher than those in the NUA group (all p < 0.05). At the same time, the proportion of comorbid Psychiatric Sx in the HUA group was also higher (25.0% vs 15.7%, P < 0.001). In terms of metabolic indicators, the HUA group had a higher BMI (24.23 kg/m2 vs 22.51 kg/m2), a higher TyG index (8.72 vs 8.45), a higher TC level (4.52 mmol/L vs 4.31 mmol/L), a higher TG level (1.52 mmol/L vs 1.14 mmol/L), a lower HDL-C level (1.22 mmol/L vs 1.34 mmol/L), and a higher SCr level (70 μmol/L vs 61 μmol/L) (all p < 0.05).
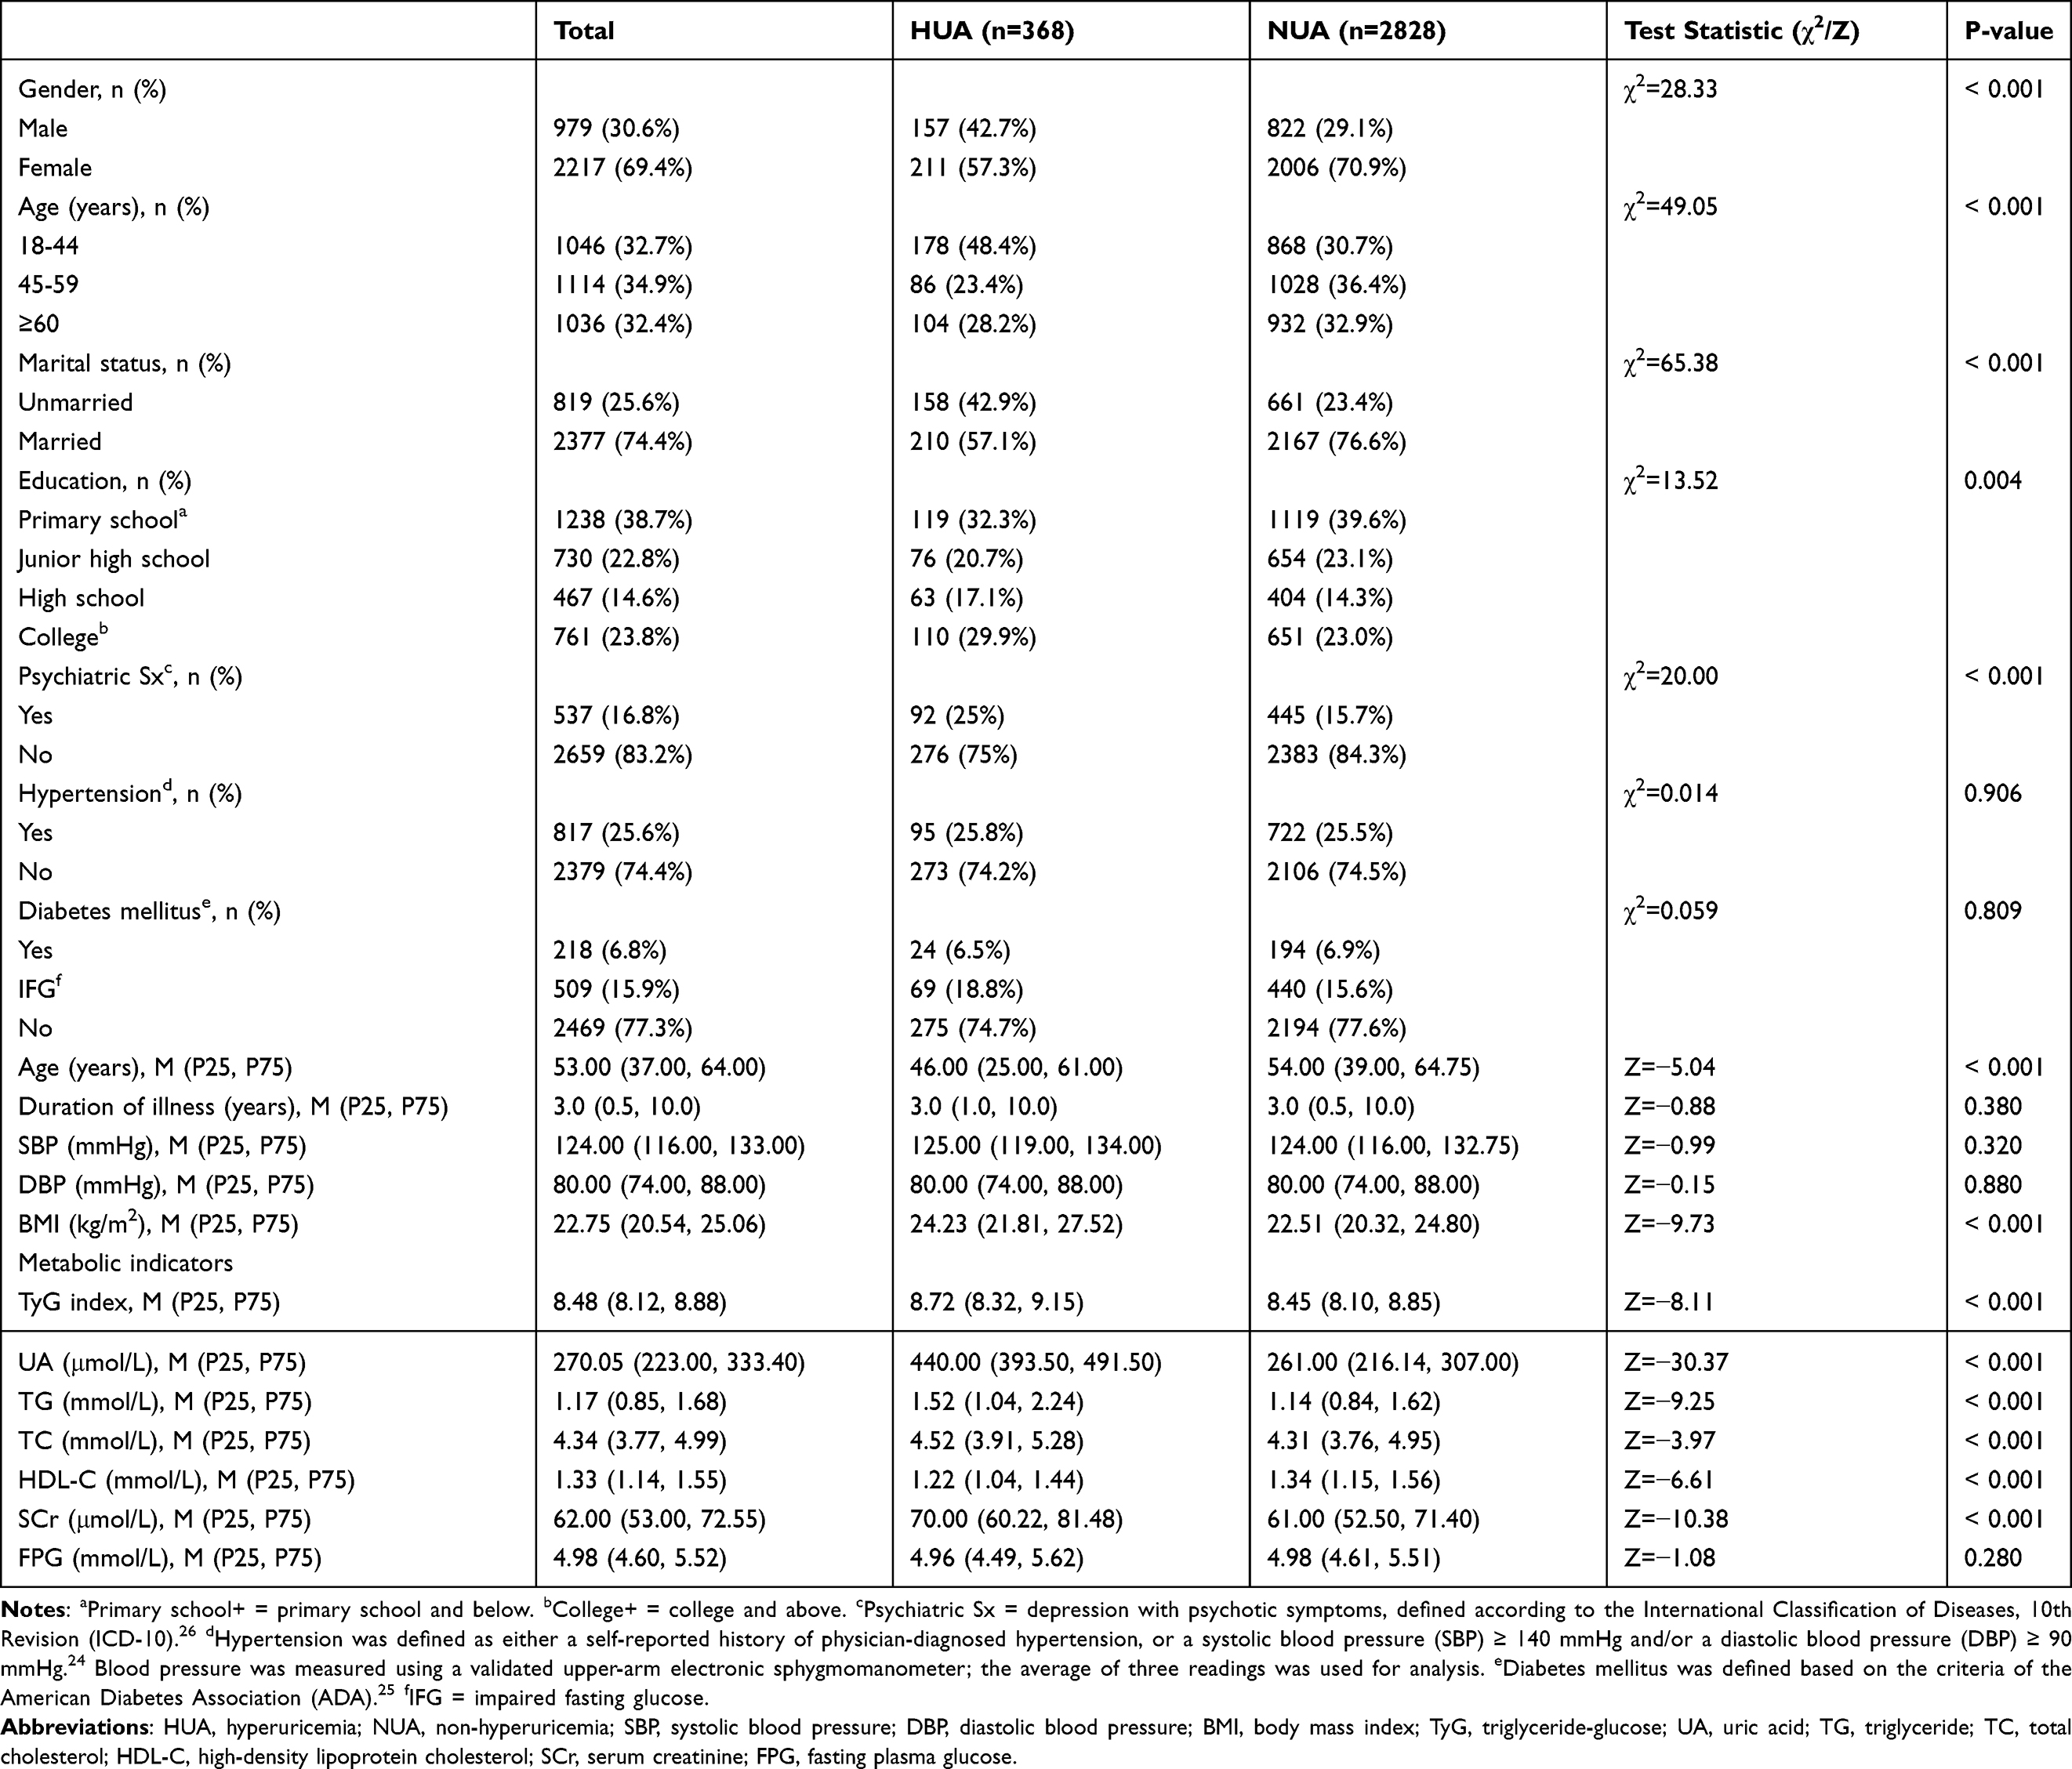 |
Table 1 Comparative Analysis of Clinical Characteristics Between the HUA Group and the NUA Group |
Comparison of Clinical Indicators Among Four Subgroups Stratified by TyG Levels Using Quartile Method
As shown in Table 2, when patients were grouped by TyG index quartiles, no significant difference was observed in gender distribution among the four groups (p=0.783). Regarding marital status, the Q1 group had the highest proportion of unmarried patients (39.4%), while the Q4 group had the highest proportion of married patients (81.9%), with a significant intergroup difference (p < 0.001). The proportion of patients with primary school education or below increased with the elevation of TyG quartiles (Q1: 22.5%→Q4: 46.3%, p < 0.001), whereas the proportion of patients with college education or above decreased gradually (Q1: 35.9%→Q4: 16.1%, p < 0.001). Among patients with depression, the Q1 group had the highest proportion of those with Psychiatric Sx (20.3%), and the Q4 group had the lowest (14.1%), with a significant intergroup difference (p=0.010). With the increase of TyG index, patient age increased gradually (Q1: median 42 years→Q4: 57 years, p < 0.001). The Q4 group had the longest duration of depression (median: 4 years), while the Q1 group had the shortest (median: 2 years), with a significant intergroup difference (p < 0.001). Both SBP and DBP increased with the elevation of TyG index (both p < 0.001). BMI was the highest in the Q4 group (median: 23.93 kg/m2) and the lowest in the Q1 group (median: 20.96 kg/m2), with a significant intergroup difference (p < 0.001). TG, TC, and FPG increased with the elevation of quartile groups, while HDL-C decreased (all p < 0.001). No statistically significant difference in SCr was found among the four groups (p=0.078). The prevalence of hyperuricemia increased significantly with the elevation of TyG quartiles (Q1: 7.0%→Q4: 18.3%, p < 0.001).
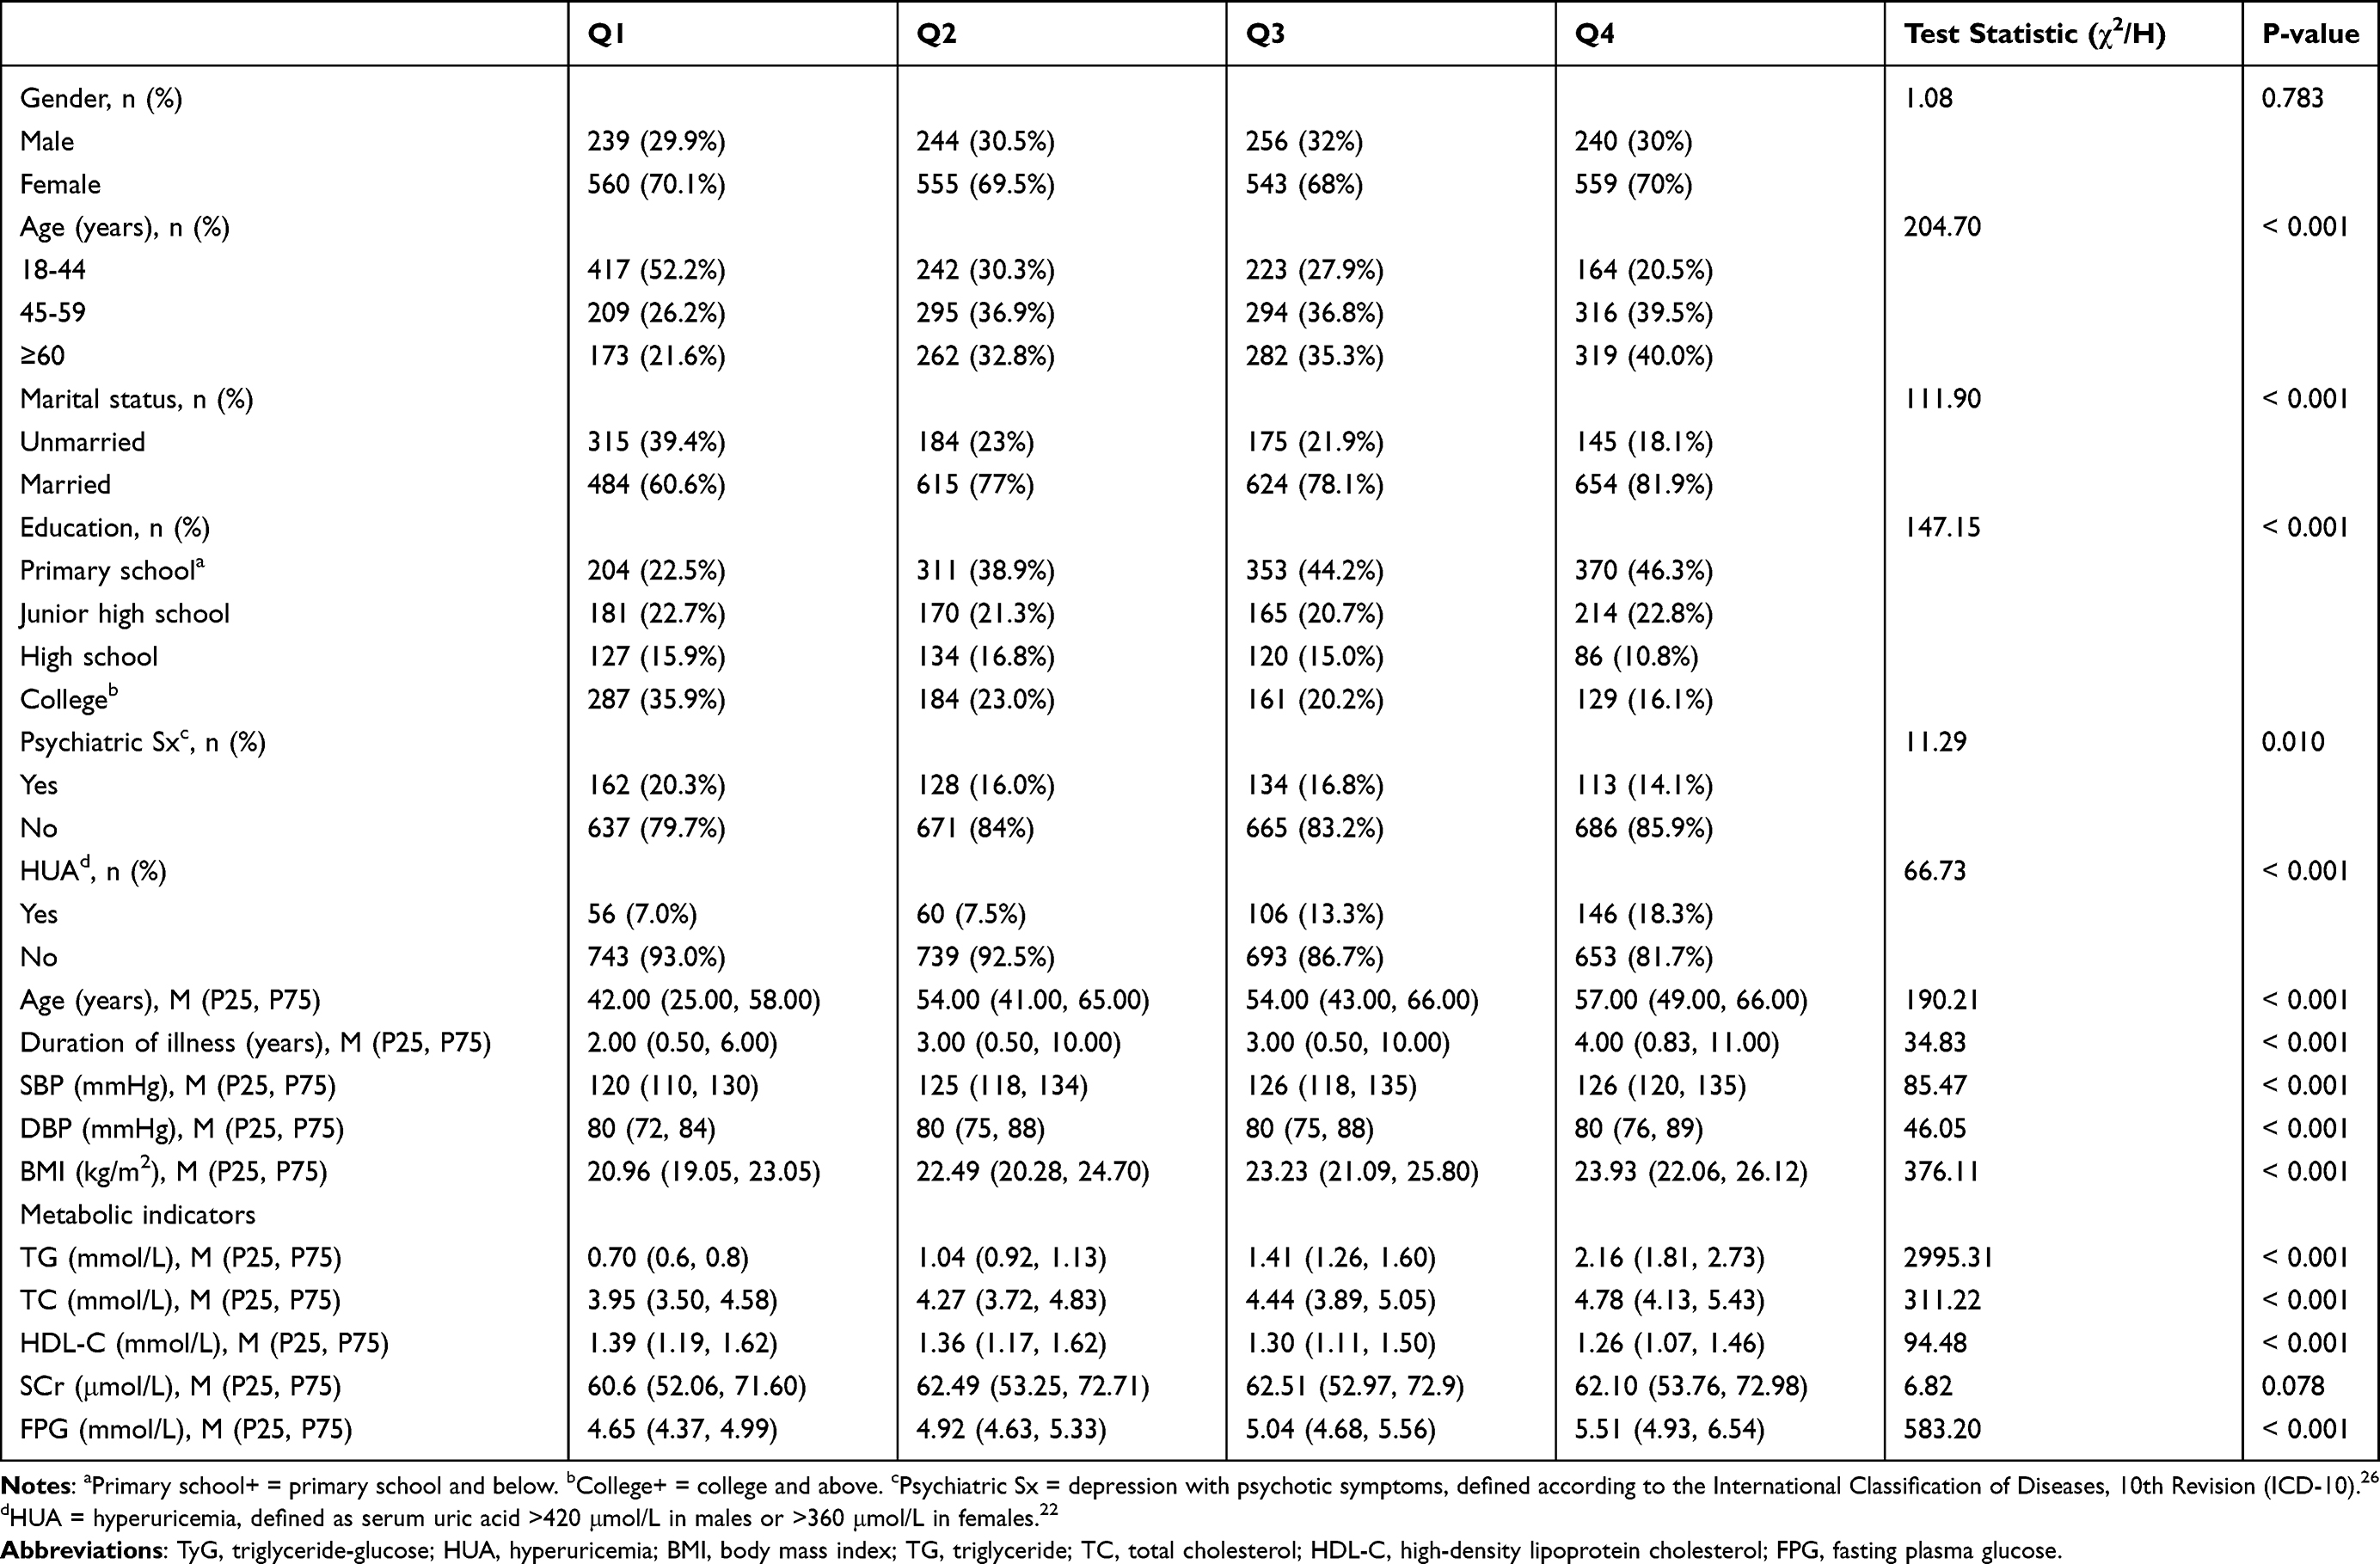 |
Table 2 Comparison of Clinical Indicators Among Four Subgroups of Patients Stratified by TyG Levels Using the Quartile Method |
The Association Between TyG Index and HUA
The results of linear regression analysis showed that the VIF of the TyG index itself was 9.525. Since the formula of the TyG index includes TG (VIF=6.673) and FPG, after excluding TG and FPG, the VIF of the TyG index was 1.570. In the multivariate logistic regression analysis presented in Table 3, TG and FPG were excluded in Model 2 to avoid the accumulation of multicollinearity. As shown in Table 3, in Model 0 (without adjusting for any covariates), each 1-unit increase in the TyG index was associated with a 2.16-fold higher risk of HUA (OR=2.16, 95% CI: 1.80–2.60, p < 0.001). After adjusting for gender, marital status, age, education level, and Psychiatric Sx in Model 1, the risk increased to 2.80-fold (OR=2.80, 95% CI: 2.28–3.38, p < 0.001). In Model 2, after further adjusting for SBP, DBP, BMI, TC, SCr, and HDL-C, each 1-unit increase in the TyG index was still associated with a 1.76-fold higher risk of HUA (OR=1.76, 95% CI: 1.37–2.25, p < 0.001), confirming that the TyG index is an independent risk factor for HUA. When the TyG index was analyzed by quartiles (with Q1 as the reference group), a clear dose-response relationship was observed. The observed probability of HUA increased from 7.0% in Q1 to 18.3% in Q4. After full adjustment in Model 2, the adjusted probabilities followed a similar increasing trend (Q1: 6.6%; Q2: 8.5%; Q3: 12.7%; Q4: 18.3%). Accordingly, the adjusted ORs for HUA risk in Q3 and Q4 were significantly higher than in Q1 (OR=1.67, 95% CI: 1.12–2.49, p=0.01; and OR=2.10, 95% CI: 1.37–3.20, p=0.001, respectively), while the risk in Q2 was not significantly different from Q1 (OR=1.06, 95% CI: 0.70–1.60, p=0.80). The p-value for trend across quartiles was 0.001, further supporting a graded association. This positive dose-response relationship was corroborated by the RCS analysis (Figure 2). The probability of HUA occurrence increased continuously with the elevation of the TyG index, and the rate of risk increase accelerated significantly when the TyG index exceeded 9, suggesting a potential risk threshold around TyG >9.
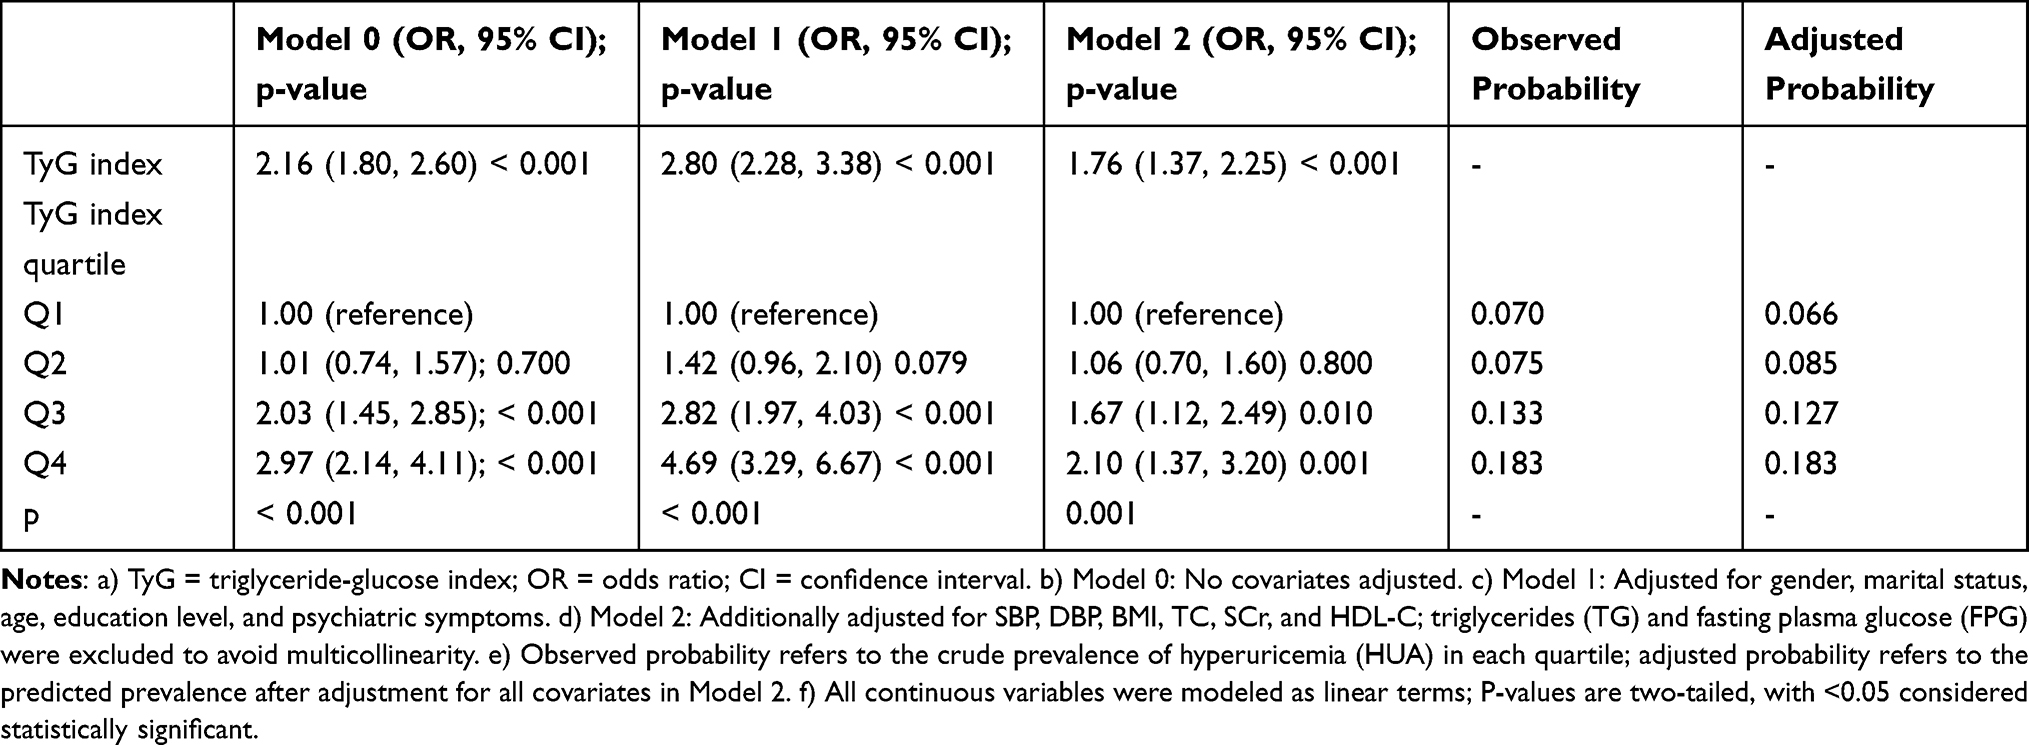 |
Table 3 Multivariate Logistic Regression Analysis of TyG Index and HUA Risk[a-f] |
 |
Figure 2 Restricted cubic spline relationship between TyG index and HUA risk. Notes: The predicted probability of HUA was derived from a logistic regression model incorporating a restricted cubic spline (RCS) for the TyG index, adjusted for gender, marital status, age, education level, psychiatric symptoms, systolic blood pressure (SBP), diastolic blood pressure (DBP), body mass index (BMI), total cholesterol (TC), serum creatinine (SCr), and high-density lipoprotein cholesterol (HDL-C) (Model 2 covariates, excluding triglycerides (TG) and fasting plasma glucose (FPG) to avoid multicollinearity). The gray shaded area indicates the 95% confidence interval. The black dashed line indicates the threshold of TyG index = 9, where the rate of increase in HUA risk accelerates significantly. The histogram along the x-axis shows the distribution of TyG index values. |
Subgroup Analysis of the Correlation Between TyG Index and HUA
Figure 3‘s representation of the findings of the subgroup analysis shows a pattern that is constant across subgroups for hypertension (yes, no), Psychiatric Sx (yes, no), etc., with no significant interaction effects observed (all p for interaction > 0.05). Detailed quantitative data, including the odds ratios (ORs), 95% confidence intervals (CIs), and P values for each subgroup, as well as the formal P values for interaction, are summarized in Table 4. These results indicate that the predictive value of the TyG index for HUA is stable across different genders, age groups, and comorbid states, supporting its potential as a universal screening tool.
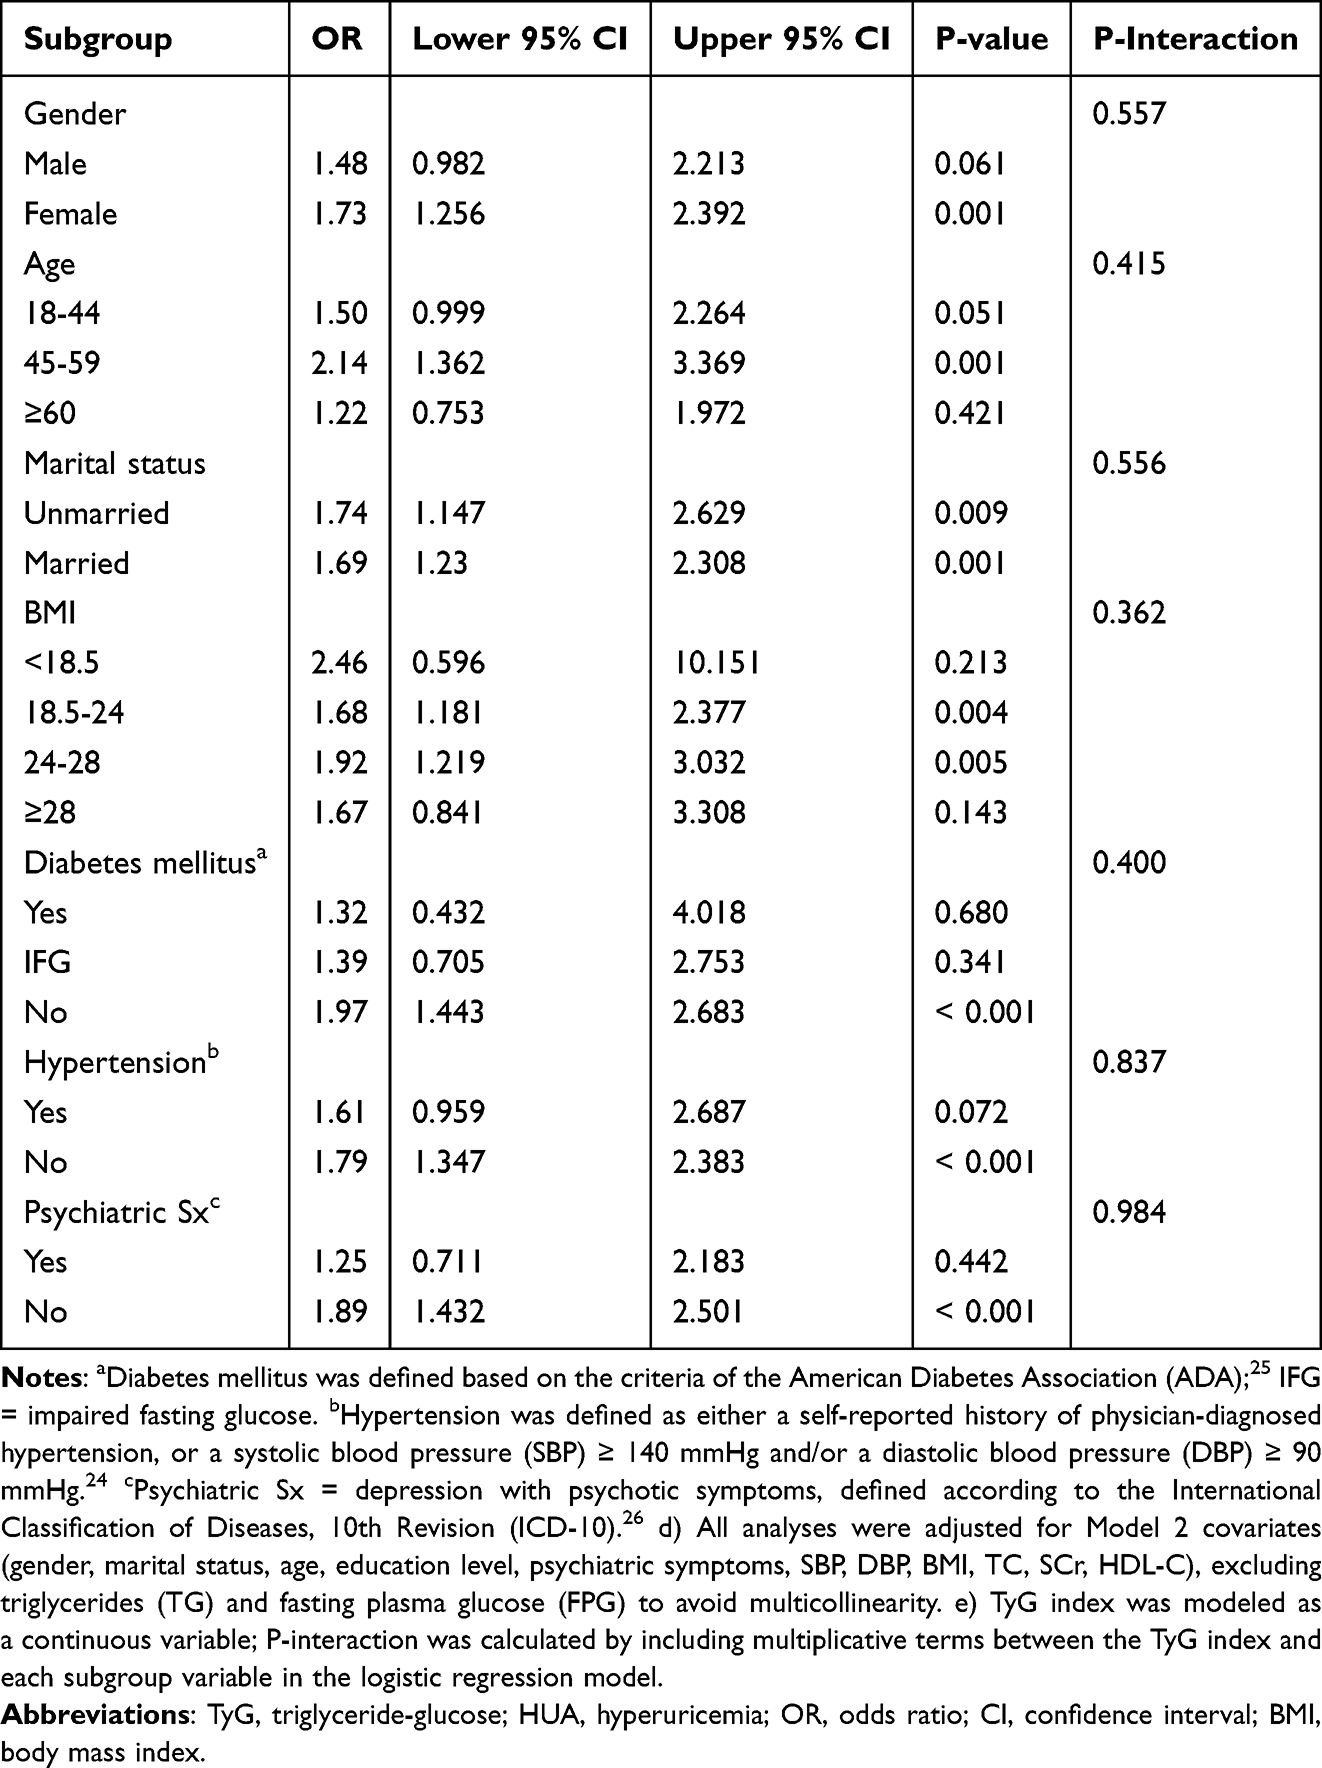 |
Table 4 Subgroup-Specific Odds Ratios (ORs) and 95% Confidence Intervals (CIs) for the Association Between TyG Index and Hyperuricemia (HUA) [d,e] |
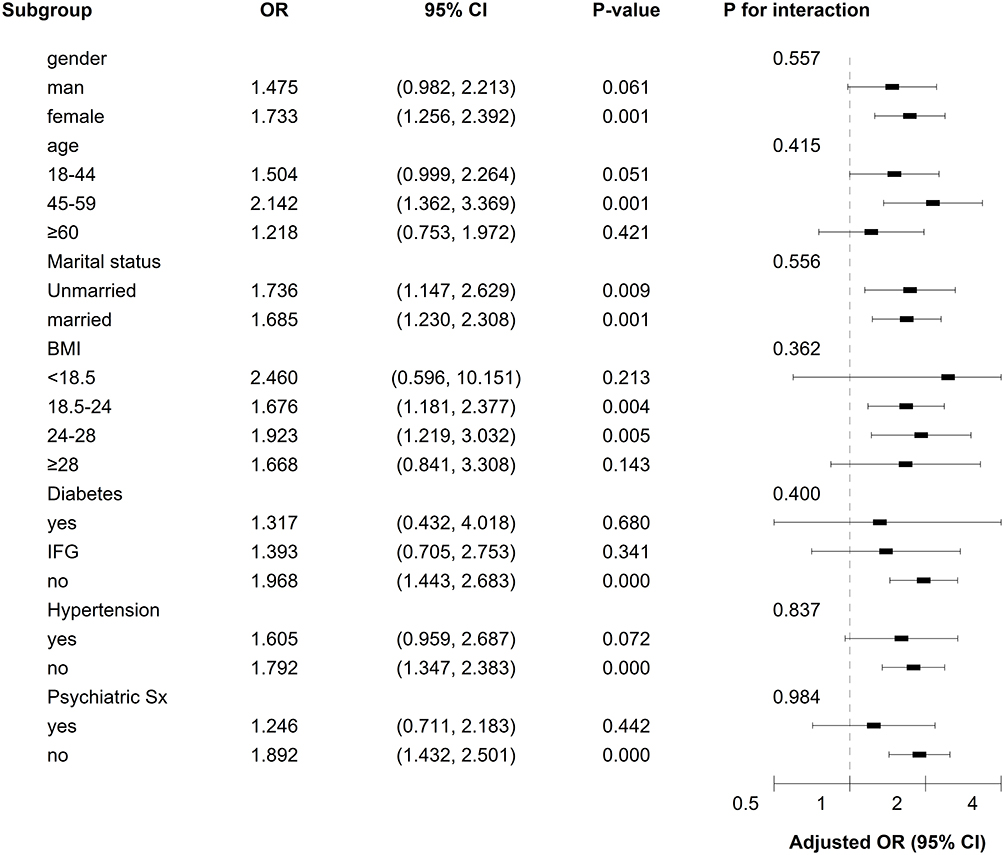 |
Figure 3 Forest plot of subgroup analysis on the association between TyG index and HUA. Notes: Odds ratios (ORs) and 95% confidence intervals (CIs) were derived from a logistic regression model adjusted for gender, age, marital status, education level, psychiatric symptoms, systolic blood pressure (SBP), diastolic blood pressure (DBP), body mass index (BMI), total cholesterol (TC), serum creatinine (SCr), and high-density lipoprotein cholesterol (HDL-C). Squares represent ORs; horizontal lines indicate 95% CIs. The vertical dashed line denotes OR = 1.0. P-values for interaction, shown next to each subgroup heading, were calculated by including multiplicative interaction terms in the model. Exact numerical results, including ORs, CIs, and P-values, are presented in Table 4. |
Discussion
To our knowledge, this study is the first to investigate the association between the TyG index and HUA in a large sample of hospitalized patients with depression in China. Our results demonstrate that the TyG index remained significantly associated with the risk of HUA even after adjusting for various potential confounders, exhibiting a positive dose-response relationship with an accelerated risk increase when the TyG index exceeded 9. The TyG index was identified as an independent risk factor for HUA (adjusted OR=1.758). These findings provide a new perspective for the early identification of HUA in patients with depression, although the underlying mechanisms require further investigation.
This study found that the prevalence of HUA among 3196 patients with depression was 11.5% (16.0% in males and 9.5% in females). Previous studies have shown that the prevalence of HUA in hospitalized patients with depression was 21.68%,27 while the proportion of HUA in a study involving adolescent patients with depression reached 49.34%.13 The results of this study are lower than the previously reported HUA prevalence in depressive populations. There may be multiple factors contributing to this discrepancy. First, differences in pharmacotherapy may affect the results. The subjects of this study were inpatients, most of whom were receiving antidepressant or antipsychotic treatment. It is known that certain drugs (eg, bupropion) may indirectly affect uric acid levels by improving glucose and lipid metabolism.28 Second, inconsistencies in the age of the study populations may also have an impact. The median age of patients in this study was relatively high (50.65 years), which is not a high-incidence age group for HUA.6 Third, geographical region and lifestyle factors should be considered: the subjects of this study were patients from inland areas of China, where the incidence of HUA is relatively low.29 Fourth, the patients were in different stages of the disease. Previous studies have shown that SUA levels increase after treatment,30 which may be associated with the remission of depressive symptoms following treatment. However, all subjects in this study were hospitalized patients experiencing an acute episode. Finally, the gender composition of the study subjects must be taken into account. The proportion of female patients in this study was relatively high (69.4%), and the prevalence of HUA in females is usually lower than that in males.31 This gender ratio may have led to a lower overall prevalence of HUA in this study.
The TyG index is associated with various metabolic diseases.32 Studies in different populations have shown that the risk of HUA increases with the elevation of the TyG index, and the TyG index can serve as a potential monitoring indicator for HUA.33–35 This study further validates its positive correlation with HUA in the depressive population, supporting its generalizability as a marker for metabolic dysregulation. Multivariate models indicate that the TyG index still independently predicts the risk of HUA. RCS analysis suggests that the risk of HUA accelerates when the TyG index exceeds 9. Subgroup analyses reveal no significant interaction effects (all p>0.05), indicating that the predictive effect of the TyG index on HUA in patients with depression is consistent across different genders, ages, and comorbidity statuses.
The association between the TyG index and SUA levels in patients with depression may be influenced by inflammatory responses and oxidative stress. Patients with depression are often accompanied by activation of the hypothalamic-pituitary-adrenal (HPA) axis and a chronic inflammatory state, which may exacerbate the interaction between insulin resistance and disorder of uric acid metabolism.36 SUA is associated with metabolic diseases such as metabolic syndrome, type 2 diabetes mellitus, and hypertension.9,37 Studies have shown that in patients with mood disorders, the more severe the emotional symptoms are, the higher the SUA levels.7 A randomized, double-blind, placebo-controlled trial revealed a positive correlation between SUA levels and interleukin-6 (IL-6), interleukin-17 (IL-17), and tumor necrosis factor-alpha (TNF-α).38 Elevated levels of SUA may induce oxidative stress and increase the expression of TNF-α in the hippocampus of rats,39 while the levels of pro-inflammatory cytokines are also significantly elevated in patients with depression.40 A growing body of studies has shown that there is an association between IR and HUA.41,42 The development of HUA may be associated with increased expression of urate transporter 1 (URAT1) and glucose transporter 9 (GLUT9), as well as glycolytic disorders caused by IR.43 Specifically, IR may affect renal UA transport, resulting in increased UA reabsorption.44 Furthermore, IR may lead to an increased fat lipolysis rate and decreased activity of lipoprotein lipase (LPL) in adipose tissue, which in turn results in HUA and excessive UA production.45
This study should be regarded as a proof-of-concept investigation. While our findings suggest that the TyG index may serve as a simple, low-cost, and routinely available marker to identify hospitalized patients with depression who are at higher risk of HUA, several important limitations must be carefully considered. First, the cross-sectional design precludes any causal inference and is inherently susceptible to reverse causation. Second, all participants were recruited from a single psychiatric specialty hospital in inland China and were exclusively inpatients; therefore, selection bias is possible, and the findings may not generalize to outpatients, community-dwelling individuals, or populations from other healthcare settings or geographic regions. Third, despite adjusting for multiple confounders, residual confounding cannot be excluded. Key variables not available in the electronic medical records, such as dietary purine intake, alcohol consumption, smoking status, physical activity, and detailed pharmacotherapy (eg, specific antidepressants, antipsychotics, diuretics, or urate-lowering agents) may influence both the TyG index and serum uric acid levels. Fourth, renal function was only partially accounted for via serum creatinine; more precise measures (eg, estimated glomerular filtration rate) and comorbidities affecting urate handling were not comprehensively assessed. Fifth, laboratory measurements were based on single time points; thus, intra‑individual variability and temporal changes in TyG and uric acid could not be evaluated. Sixth, the suggested TyG threshold of 9, while statistically derived from restricted cubic spline analysis, should be considered hypothesis‑generating and may be sample‑dependent; it requires external validation in larger, multi‑center, and more diverse cohorts before it can be applied clinically.
In light of these limitations, we emphasize that our results are not sufficient to change current clinical practice on their own. Rather, they provide preliminary evidence that the TyG index may be a useful adjunct to existing metabolic screening protocols in psychiatric settings. Future studies should adopt prospective, multi-center designs with repeated measurements, more comprehensive confounder assessment, and formal evaluation of predictive performance (eg, calibration and discrimination) to determine whether TyG-informed strategies improve clinically meaningful outcomes, such as earlier detection, timely referral, and effective management of HUA in patients with depression. When formulating treatment plans, psychiatrists should consider prioritizing antipsychotic medications that have a neutral or beneficial impact on UA metabolism, avoiding those known to elevate uric acid levels, such as some second‑generation antipsychotics (eg, olanzapine, risperidone).46,47 The feasibility of using medications that improve insulin resistance (eg, metformin) should be promptly evaluated.48 If HUA is diagnosed, patients should be promptly referred to the endocrinology department to initiate standard uric acid‑lowering therapy.49
Conclusion
In summary, the prevalence of HUA among hospitalized patients with depression in inland China is 11.5%. A positive correlation exists between the TyG index and HUA in this population, with the TyG index serving as an independent predictor of HUA risk. Notably, the risk of HUA increases at a significantly accelerated rate once the TyG index exceeds 9. The TyG index represents a stable, simple, and cost-effective indicator for assessing HUA risk in patients with depression, and its predictive value remains consistent across most clinically relevant subgroups. Given the simplicity and stability of the TyG index, it may serve as an auxiliary indicator for HUA risk screening in patients with depression, and its clinical utility warrants further validation in clinical management of patients with depression, utilizing it as a key tool for identifying high-risk individuals, guiding stratified management, and facilitating early intervention, with the ultimate goal of improving long-term metabolic outcomes and overall health status.
Data Sharing Statement
The data that support the findings of this study are available from the corresponding author upon reasonable request.
Ethics Approval and Consent to Participate
This study was reviewed and confirmed to meet the exemption criteria by the Ethics Committee of Hefei Fourth People’s Hospital (Approval No. HFSY-IRB-YJ-MCLL-ZLF[2025-069-001]). Written informed consent was waived due to the retrospective design and use of de-identified data with minimal risk. Participant confidentiality was protected through data de-identification and secure storage.
Acknowledgments
We would like to thank all participants and all co-authors in this study. We are grateful to those staff who contributed to the clinical assessments and diagnosis.
Author Contributions
All authors made a significant contribution to the work reported, whether that is in the conception, study design, execution, acquisition of data, analysis and interpretation, or in all these areas; took part in drafting, revising or critically reviewing the article; gave final approval of the version to be published; have agreed on the journal to which the article has been submitted; and agree to be accountable for all aspects of the work.
Funding
This work was supported by National Clinical Key Specialty Construction Project of China; the School Funded Project of Anhui Medical University (2023xkj234).
Disclosure
The authors declare that they do not have any conflicts of interest related to the data presented in this manuscript.
References
1. Xu DR, Gao X, Zhao LB, et al. Association between triglyceride and depression: a systematic review and meta-analysis. PLoS One. 2024;19(10):e0311625. doi:10.1371/journal.pone.0311625
2. IHME Global Burden of Disease Collaborative Network, Global incidence, prevalence, years lived with disability (YLDs), disability-adjusted life-years (DALYs), and healthy life expectancy (HALE) for 371 diseases and injuries in 204 countries and territories and 811 subnational locations, 1990-2021: a systematic analysis for the global burden of disease study 2021. Lancet. 2024;403(10440):2133–15. doi:10.1016/S0140-6736(24)00757-8
3. Zhang J, He J, Hu J, Ji Y, Lou Z. Exploring the role of gut microbiota in depression: pathogenesis and therapeutic insights. Asian J Psychiatry. 2025;105:104411. doi:10.1016/j.ajp.2025.104411
4. Li Y, Du X, Shi S, et al. Trends in prevalence and multimorbidity of metabolic, cardiovascular, and chronic kidney diseases among US adults with depression from 2005 to 2020. J Affect Disord. 2025;372:262–268. doi:10.1016/j.jad.2024.12.021
5. Mijailovic NR, Vesic K, Borovcanin MM. The influence of serum uric acid on the brain and cognitive dysfunction. Front Psychiatry. 2022;13:828476. doi:10.3389/fpsyt.2022.828476
6. Dai TY, Cao JD, Ma DQ, et al. Prevalence and related factors of hyperuricemia in adults in Zhaotong City, Yunnan Province. J Chronic Dis. 2024;25(11):1614–1619.
7. Immanuel S, Kaki A, Jetty RR, Vupputuri SM, VR K, AS R. Uric acid as a biomarker for mood disorders: a comparative study of blood uric acid levels correlating with the symptom severity and treatment response. Cureus. 2024;16(8):e66784. doi:10.7759/cureus.66784
8. Li C, Hsieh MC, Chang SJ. Metabolic syndrome, diabetes, and hyperuricemia. Curr Opin Rheumatol. 2013;25(2):210–216. doi:10.1097/BOR.0b013e32835d951e
9. Amiya E. Link between hyperuricemia, renal dysfunction, and hypertension. J Clin Hypertension. 2021;23(12):2078–2079. doi:10.1111/jch.14389
10. Hu H, Li W, Hao Y, et al. The SGLT2 inhibitor dapagliflozin ameliorates renal fibrosis in hyperuricemic nephropathy. Cell Rep Med. 2024;5(8):101690. doi:10.1016/j.xcrm.2024.101690
11. Ge XD, Zhang YL, Xu XR, Wang YL, Li Q, Liu J. Relationship between serum uric acid level and somatic symptoms in elderly patients with depression. J Med Theory Pract. 2022;35(04):551–553+568.
12. Wu D, Wu WJ, Cui LB, Wang HN, Zhang YH. Comparative analysis of uric acid levels in middle-aged, young and elderly patients with depression. J Air Force Med. 2020;36(06):509–510.
13. Tao R, Li H. High serum uric acid level in adolescent depressive patients. J Affect Disord. 2015;174:464–466. doi:10.1016/j.jad.2014.12.031
14. Luo Y, Wang S, Cheng Q, et al. Associations between uric acid and depressive symptoms, and the mediating role of immunoinflammatory: findings from rural older adults. Brain Behav Immunity. 2024;42:100893.
15. Meng X, Huang X, Deng W, Li J, Li T. Serum uric acid a depression biomarker. PLoS One. 2020;15(3):e0229626. doi:10.1371/journal.pone.0229626
16. Chen Z, Liang S, Bai Y, et al. Serum uric acid is not associated with major depressive disorder in European and South American populations: a meta-analysis and two-sample bidirectional Mendelian randomization study. Eur J Clin Nutr. 2022;76(12):1665–1674. doi:10.1038/s41430-022-01165-8
17. Badmus OO, Hillhouse SA, Anderson CD, Hinds TD, Stec DE. Molecular mechanisms of metabolic associated fatty liver disease (MAFLD): functional analysis of lipid metabolism pathways. Clin Sci. 2022;136(18):1347–1366. doi:10.1042/CS20220572
18. Han R, Zhang Y, Jiang X. Relationship between four non-insulin-based indexes of insulin resistance and serum uric acid in patients with type 2 diabetes: a cross-sectional study. Diab Metab Syndrome Obes. 2022;15:1461–1471. doi:10.2147/DMSO.S362248
19. Xiong F, Yu C, Zhu LJ, et al. [Associations between insulin resistance indexes and hyperuricemia in hypertensive population]. Zhongguo yi xue ke xue yuan xue bao. 2023;45(3):390–398. doi:10.3881/j.issn.1000-503X.15414
20. Shi YY, Zheng R, Cai JJ, Qian SZ. The association between triglyceride glucose index and depression: data from NHANES 2005-2018. BMC Psychiatry. 2021;21(1):267. doi:10.1186/s12888-021-03275-2
21. Behnoush AH, Mousavi A, Ghondaghsaz E, Shojaei S, Cannavo A, Khalaji A. The importance of assessing the triglyceride-glucose index (TyG) in patients with depression: a systematic review. Neurosci Biobehav Rev. 2024;159:105582. doi:10.1016/j.neubiorev.2024.105582
22. Liu Y, Zhao W, Liu X, et al. Identifying reliable obesity indices for hyperuricemia among middle-aged and elderly populations: a longitudinal study. Lipids Health Dis. 2024;23(1):305. doi:10.1186/s12944-024-02296-6
23. Zhang F, Hou X. Association between the triglyceride glucose index and heart failure: NHANES 2007-2018. Front Endocrinol. 2023;14:1322445. doi:10.3389/fendo.2023.1322445
24. Gui J, Li Y, Liu H, et al. Obesity-and lipid-related indices as a risk factor of hypertension in mid-aged and elderly Chinese: a cross-sectional study. BMC Geriatr. 2024;24(1):77. doi:10.1186/s12877-023-04650-2
25. Kabootari M, Asgari S, Ghavam SM, Abdi H, Azizi F, Hadaegh F. Long term prognostic implication of newly detected abnormal glucose tolerance among patients with stable cardiovascular disease: a population-based cohort study. J Transl Med. 2021;19(1):277. doi:10.1186/s12967-021-02950-y
26. Sun S, Jin W, Hou T, et al. Psychotic symptoms in Chinese adolescent patients with major depressive disorder: prevalence and related endocrine clinical factors. BMC Psychiatry. 2024;24(1):598. doi:10.1186/s12888-024-06023-4
27. Wang X, Wang S, Qi W, Wang Y, Zhang L, Sun P. Hyperuricemia in Chinese patients with mood disorders: prevalence, related factors, and predictive model. Neuropsychiatr Dis Treat. 2025;21:1885–1897. doi:10.2147/NDT.S535310
28. Ahmed M, El-Bakly WM, Zaki AM, Abd Alzez LF, El Serafi O. El serafi O. Bupropion effects on high-fat diet-induced steatohepatitis and endothelial dysfunction in rats: role of tumour necrosis factor-alpha. J Pharm Pharmacol. 2014;66(6):793–801. doi:10.1111/jphp.12213
29. Song J, Jin C, Shan Z, Teng W, Li J. Prevalence and risk factors of hyperuricemia and gout: a cross-sectional survey from 31 provinces in Mainland China. J Transl Internal Med. 2022;10(2):134–145. doi:10.2478/jtim-2022-0031
30. Gong Y, Lu Z, Kang Z, et al. Peripheral non-enzymatic antioxidants as biomarkers for mood disorders: evidence from a machine learning prediction model. Front Psychiatry. 2022;13:1019618. doi:10.3389/fpsyt.2022.1019618
31. Piao W, Zhao L, Yang Y, et al. The prevalence of hyperuricemia and its correlates among adults in China: results from CNHS 2015-2017. Nutrients. 2022;14(19):4095. doi:10.3390/nu14194095
32. Sun Y, Ji H, Sun W, An X, Lian F. Triglyceride glucose (TyG) index: a promising biomarker for diagnosis and treatment of different diseases. Eur J Internal Med. 2025;131:3–14. doi:10.1016/j.ejim.2024.08.026
33. Sun J, Sun M, Su Y, et al. Mediation effect of obesity on the association between triglyceride-glucose index and hyperuricemia in Chinese hypertension adults. J Clin Hypertension. 2022;24(1):47–57. doi:10.1111/jch.14405
34. Li Q, Shao X, Zhou S, et al. Triglyceride-glucose index is significantly associated with the risk of hyperuricemia in patients with diabetic kidney disease. Sci Rep. 2022;12(1):19988. doi:10.1038/s41598-022-23478-1
35. Shi W, Xing L, Jing L, Tian Y, Liu S. Usefulness of triglyceride-glucose index for estimating hyperuricemia risk: insights from a general population. Postgrad Med. 2019;131(5):348–356. doi:10.1080/00325481.2019.1624581
36. Mehdi S, Wani SUD, Krishna KL, Kinattingal N, Roohi TF. A review on linking stress, depression, and insulin resistance via low-grade chronic inflammation. Biochem Biophys Rep. 2023;36:101571. doi:10.1016/j.bbrep.2023.101571
37. Martínez-Sánchez FD, Vargas-Abonce VP, Guerrero-Castillo AP, et al. Serum uric acid concentration is associated with insulin resistance and impaired insulin secretion in adults at risk for type 2 diabetes. Prim Care Diab. 2021;15(2):293–299. doi:10.1016/j.pcd.2020.10.006
38. Huang YY, Ye Z, Gu SW, Jiang ZY, Zhao L. The efficacy and tolerability of febuxostat treatment in a cohort of Chinese Han population with history of gout. J Int Med Res. 2020;48(5):300060520902950. doi:10.1177/0300060520902950
39. Tian T, Liu XR, Li TT, et al. Detrimental effects of long-term elevated serum uric acid on cognitive function in rats. Sci Rep. 2021;11(1):6732. doi:10.1038/s41598-021-86279-y
40. Harsanyi S, Kupcova I, Danisovic L, Klein M. Selected biomarkers of depression: what are the effects of cytokines and inflammation? Int J Mol Sci. 2022;24(1):578. doi:10.3390/ijms24010578
41. McCormick N, O’Connor MJ, Yokose C, et al. Assessing the causal relationships between insulin resistance and hyperuricemia and gout using bidirectional mendelian randomization. Arthritis Rheumatol. 2021;73(11):2096–2104. doi:10.1002/art.41779
42. Zhu J, Sun L, Yang J, Fan J, Tse LA, Li Y. Genetic predisposition to type 2 diabetes and insulin levels is positively associated with serum urate levels. J Clin Endocrinol Metab. 2021;106(7):e2547–e56. doi:10.1210/clinem/dgab200
43. Yanai H, Adachi H, Hakoshima M, Katsuyama H. Molecular biological and clinical understanding of the pathophysiology and treatments of hyperuricemia and its association with metabolic syndrome, cardiovascular diseases and chronic kidney disease. Int J Mol Sci. 2021;22(17):9221. doi:10.3390/ijms22179221
44. Toyoki D, Shibata S, Kuribayashi-Okuma E, et al. Insulin stimulates uric acid reabsorption via regulating urate transporter 1 and ATP-binding cassette subfamily G member 2. Am J Physiol Renal Physiol. 2017;313(3):F826–f34. doi:10.1152/ajprenal.00012.2017
45. Bjornstad P, Eckel RH. Pathogenesis of lipid disorders in insulin resistance: a brief review. Curr Diab Reports. 2018;18(12):127. doi:10.1007/s11892-018-1101-6
46. Ma J, Zhang L, Huang Z, Wang G. Clinical patterns of metabolic syndrome in young, clinically stable, olanzapine-exposed patients with schizophrenia. Ann General Psychiatry. 2024;23(1):46. doi:10.1186/s12991-024-00532-y
47. Wang S, Yuan X, Pang L, Song P, Jia R, Song X. Establishment of an assistive diagnostic model for schizophrenia with oxidative stress biomarkers. Front Pharmacol. 2023;14:1158254. doi:10.3389/fphar.2023.1158254
48. Dai H, Hou T, Wang Q, et al. The effect of metformin on urate metabolism: findings from observational and Mendelian randomization analyses. Diab Obes Metab. 2024;26(1):242–250. doi:10.1111/dom.15310
49. Terkeltaub R. Emerging urate-lowering drugs and pharmacologic treatment strategies for gout: a narrative review. Drugs. 2023;83(16):1501–1521. doi:10.1007/s40265-023-01944-y
 © 2026 The Author(s). This work is published and licensed by Dove Medical Press Limited. The
full terms of this license are available at https://www.dovepress.com/terms
and incorporate the Creative Commons Attribution
- Non Commercial (unported, 4.0) License.
By accessing the work you hereby accept the Terms. Non-commercial uses of the work are permitted
without any further permission from Dove Medical Press Limited, provided the work is properly
attributed. For permission for commercial use of this work, please see paragraphs 4.2 and 5 of our Terms.
© 2026 The Author(s). This work is published and licensed by Dove Medical Press Limited. The
full terms of this license are available at https://www.dovepress.com/terms
and incorporate the Creative Commons Attribution
- Non Commercial (unported, 4.0) License.
By accessing the work you hereby accept the Terms. Non-commercial uses of the work are permitted
without any further permission from Dove Medical Press Limited, provided the work is properly
attributed. For permission for commercial use of this work, please see paragraphs 4.2 and 5 of our Terms.
Recommended articles
Anxiety and Depression in People with Eczema or Psoriasis: A Comparison of Associations in UK Biobank and Linked Primary Care Data
Matthewman J, Mansfield KE, Hayes JF, Adesanya EI, Smith CH, Roberts A, Langan SM, Henderson AD
Clinical Epidemiology 2023, 15:891-899
Published Date: 7 August 2023
Prevalence and Factors Associated with Depression in Patients with Diabetes Mellitus and Pulmonary Tuberculosis (DM-PTB): A Hospital-Based Cross-Sectional Study
Li X, Fang X, Zhou L, Mao Y
International Journal of General Medicine 2023, 16:3465-3472
Published Date: 14 August 2023
Prevalence and Associations of Night Eating Syndrome Among Medical Students in Saudi Arabia
Haneef S, Almuammar S
Psychology Research and Behavior Management 2024, 17:529-535
Published Date: 14 February 2024
Prevalence and Determinants of Anxiety and Depression Among Healthcare Workers in Liaoning Province, China
Lu J, Dou X, Yi Y, Yu Y, Zhou L
Risk Management and Healthcare Policy 2024, 17:983-993
Published Date: 23 April 2024
Prevalence of Depression Among Women Using Hormonal Contraceptives in Mogadishu, Somalia: A Cross-Sectional Study
Yusuf AM, Warsame MO, Gedi S, Abdullahi NA, Ahmed DI
Open Access Journal of Contraception 2024, 15:89-98
Published Date: 19 June 2024