")
Back to Journals » Infection and Drug Resistance » Volume 12
Association Between Ambient Air Pollution and Elevated Risk of Tuberculosis Development
Authors Lin YJ , Lin HC, Yang YF, Chen CY, Ling MP, Chen SC , Chen WY , You SH , Lu TH, Liao CM
Received 19 August 2019
Accepted for publication 24 November 2019
Published 6 December 2019 Volume 2019:12 Pages 3835—3847
DOI https://doi.org/10.2147/IDR.S227823
Checked for plagiarism Yes
Review by Single anonymous peer review
Peer reviewer comments 2
Editor who approved publication: Dr Eric Nulens
Yi-Jun Lin,1 Hsing-Chieh Lin,2 Ying-Fei Yang,2 Chi-Yun Chen,2 Min-Pei Ling,3 Szu-Chieh Chen,4,5 Wei-Yu Chen,6,7 Shu-Han You,8 Tien-Hsuan Lu,2 Chung-Min Liao2
1Institute of Food Safety and Health Risk Assessment, National Yang-Ming University, Taipei, Taiwan; 2Department of Bioenvironmental Systems Engineering, National Taiwan University, Taipei, Taiwan; 3Department of Food Science, National Taiwan Ocean University, Keelung City, Taiwan; 4Department of Public Health, Chung Shan Medical University, Taichung, Taiwan; 5Department of Family and Community Medicine, Chung Shan Medical University Hospital, Taichung, Taiwan; 6Department of Biomedical Science and Environmental Biology, Kaohsiung Medical University, Kaohsiung, Taiwan; 7Research Center for Environmental Medicine, Kaohsiung Medical University, Kaohsiung, Taiwan; 8Institute of Food Safety and Risk Management, National Taiwan Ocean University, Keelung City, Taiwan
Correspondence: Chung-Min Liao
Department of Bioenvironmental Systems Engineering, National Taiwan University, Taipei, Taiwan, ROC
Tel +886 2 3366 3475
Email [email protected]
Background: Broad-scale evidence has shown the significant association between ambient air pollutants and the development of tuberculosis (TB). However, the impact of air quality on the risk of TB in Taiwan is still poorly understood.
Objective: To develop a probabilistic integrated population-level risk assessment approach for evaluating the contribution of ambient air pollution exposure to the risk of TB development among different regions of Taiwan.
Materials and methods: A Bayesian-based probabilistic risk assessment model was implemented to link exposure concentrations of various air pollutants quantified in a probabilistic manner with the population-based exposure-response models developed by using an epidemiological investigation.
Results: The increment of the risk of TB occurred in a region with a higher level of air pollution, indicating a strong relationship between ambient air pollution exposures and TB incidences. Carbon monoxide (CO) exposure showed the highest population attributable fraction (PAF), followed by nitrogen oxides (NOX) and nitrogen dioxide (NO2) exposures. In a region with higher ambient air pollution, it is most likely (80% risk probability) that the contributions of CO exposure to development of TB were 1.6–12.2% (range of median PAFs), whereas NOX and NO2 exposures contributed 1.2–9.8% to developing TB.
Conclusion: Our findings provide strong empirical support for the hypothesis and observations from the literature that poor air quality is highly likely to link aetiologically to the risk of TB. Therefore, substantial reductions in CO, NOX, and NO2 exposures are predicted to have health benefits to susceptible and latently infected individuals that provide complementary mitigation efforts in reducing the burden of TB. Considering that people continue to be exposed to both TB bacilli and ambient air pollutants, our approach can be applied for different countries/regions to identify which air pollutants contribute to a higher risk of TB in order to develop potential mitigation programs.
Keywords: tuberculosis, ambient air pollution, exposure-response function, probabilistic risk assessment, population attributable fraction
Introduction
Tuberculosis (TB) infection is caused by inhalation of the pathogen Mycobacterium tuberculosis. In more than 90% of infected individuals, bacteria contained inside the granuloma are inactive and the cases are considered to be latently infected.1 A recent estimate indicated that 23.0% (95% confidence interval (CI): 20.4–26.4%) of the world’s population has been infected with TB bacilli, amounting to approximately 1.7 (95% CI: 1.5–1.9) billion people.2 In later life, latently infected individuals have a 10% lifetime risk of developing active TB through mycobacteria reactivation due to the compromise of host immune systems.1 Infection with human immunodeficiency virus, diabetes, and malnutrition are well-established risk factors for the progression of TB.3,4
Other than these risk factors, two meta-analyses have revealed that air pollution from passive smoking and biomass fuel combustion is related to an increased risk of TB.5,6 There is increasingly strong evidence for the robust association between ambient air pollution and the risk of TB. Broad evidence has shown that exposures to particulate matters with aerodynamic diameters less than 10 μm (PM10) and 2.5 μm (PM2.5), carbon monoxide (CO), nitrogen oxides (NOX), and nitrogen dioxide (NO2) are highly likely to be associated with the elevated risk of TB.7–12 Recently, a cohort study on air pollution and the incidence of TB revealed positive associations with NO2, NOX, CO, and PM2.5 among Taiwan regions.13
TB has consistently been the highest morbidity among all communicable diseases in Taiwan, although the incidence rate of TB in Taiwan was ~73 per 100,000 populations in 2005 and then declined to ~44 per 100,000 populations in 2016.14 The population density of Taiwan is the seventh highest in the world with an area of just 36,000 km2 and a population of 23.46 million.15 Urbanization coupled with a high density of vessel traffic flow affects air quality and causes air pollution. Both short- and long-term exposures to ambient air pollution could increase susceptibility to M. tuberculosis infection and to the development of TB by impairing the immunology of the human respiratory system,8–10,16 thereby resulting in an increased risk of TB.
Risk assessment of ambient air pollution to TB is crucial not only at the national level but also at the sub-national level because pollutant concentrations vary by region. Therefore, a better understanding of how air pollution influences the risk of TB is imperative in order to establish effective public control programs and environmental policies for central and local governments. However, the contribution of air pollution exposure to the risk of TB development among regions of Taiwan is still poorly understood. To move forward, the primary objective of this study was to develop an integrative approach of probabilistic and population-level risk assessment with data from regional air monitoring systems and an epidemiological investigation for evaluating the contribution of ambient air pollution exposure to the risk of TB development among different regions of Taiwan.
Materials and Methods
Framework and Population
The proposed integrative approach that links the probabilistic and population-level risk assessment is illustrated in Figure 1. Air pollutants may directly or indirectly affect the immune process that inhibits TB in humans. As such, upon exposure to M. tuberculosis, air pollution exposure would increase susceptibility to developing active TB following primary infection or latent infection (Figure 1A). Briefly, exposure concentrations of various air pollutants at the sub-national regions of Taiwan were quantified in a probabilistic manner (Figure 1B). The scheme of population attributable fraction (PAF) was used to reanalyze the epidemiological data for constructing the population exposure–response relationship between exposure to ambient air pollutants and the PAF of the incidence of TB (Figure 1B). The population-level risk of the development of TB associated with air pollution exposure can then be quantified by integrating exposure and effect analyses into a probabilistic risk assessment model (Figure 1C).
 |
Figure 1 Schematic representation of the probabilistic risk assessment framework used in this study: (A) problem formulation, (B) exposure/effect analyses, and (C) risk characterization (see text for the symbolic meaning). |
The TB incidence rates among different regions of Taiwan in the period 2006–2016 (Table S1) were calculated using the annual regional TB cases obtained from the TB monitor database of the Centers for Disease Control of Taiwan14 divided by the regional mid-year population size available from the Ministry of Health and Welfare of Taiwan.17 As seen in Table S1, the incidences in all cities and counties of Taiwan have a gradually decreasing trend. We found that the average incidence rates were the highest in Hualien County of 93.5 per 100,000 populations and Taitung County of 89.1 per 100,000 populations in the eastern region of Taiwan as well as Pingtung County of 90.3 per 100,000 populations in the southern region of Taiwan. By contrast, Taipei City, the capital of Taiwan and located in the northern region, has a relatively low incidence with an average rate of 38.6 per 100,000 populations. Therefore, Hualien, Taitung, Pingtung, and Taipei City were selected as our study sites.
Exposure Analysis
The well-developed air quality monitoring network allows us an opportunity to quantify the probabilistic distributions of pollutant concentrations of NO2, NOX, CO, PM2.5, and PM10 in various regions of Taiwan. Monthly based average air pollution data in the period 2006–2016 (Figure S1) were collected from the Environmental Resource Database of the Taiwan Environmental Protection Administration (EPA) (https://erdb.epa.gov.tw/ENG/). There are 1, 2, 3, and 7 monitoring stations in Hualien, Taitung, Pingtung, and Taipei City, respectively, established by the Taiwan EPA. We analyzed the time-series data (Figure S1) to obtain the best-fitted probabilistic distribution of concentration for each air pollutant i, denoted as P(Ci), for each study site (Figure 1B) by using the Monte Carlo (MC) simulation.
To test the convergence and the stability of the numerical output of MC simulation, we performed independent runs at 1, 4, 5 and 10 thousand iterations. The result showed that 10,000 iterations were sufficient to ensure the stability of results. The optimal probability distribution was determined based on the Kolmogorov–Smirnov statistics. The MC technique was applied to generate 2.5th and 97.5th percentiles as 95% CI for quantifying the uncertainties of air pollutant concentrations. Oracle® Crystal Ball software (Version 11.1, Oracle Corporation, Redwood Shores, CA, USA) was used to implement the MC simulation.
Effect Analysis
Here the epidemiological scheme of PAF was used to construct a population dose–response relationship between ambient air pollution exposure and the incidence of TB. The PAF was calculated on the basis of valuable epidemiological data available from Lai et al.13 In brief, a prospective cohort study was conducted in Taiwan using 106,678 participants recruited from a community-based screening service during 2005–2012. After a median follow-up of 6.7 years, 418 cases of incident TB occurred. Individual exposure to ambient air pollution was estimated by using the data from the nearest Taiwan EPA monitoring stations. The Cox regression models with the penalized smoothing spline method were used to examine the exposure–response trends between air pollutants and the hazard ratios (HRs) of active TB, adjusting for major TB risk factors.
Based on the data from Lai et al,13 only HR > 1 implying positive association was considered. There were two scenarios designated in the dose–response analysis: (1) the 95% upper confidence limit of HR data were defined as the severe scenario, representing air pollutant exposure having a serious impact on active TB and (2) the model-predicted HR data were as the moderate scenario, representing weaker effect on active TB caused by air pollution (Figure 1B and S2). The data of 95% lower confidence limit were not considered in the dose–response analysis because all HRs were less than 1. The dose–response patterns for PM2.5 and PM10 appeared only in the severe scenario. Hence, we constructed the population dose–response relationships for both severe and moderate scenarios on NO2, NOX, and CO, whereas the concentrations of PM2.5 ≥ 25 and PM10 ≥ 45 μg m−3 were selected to establish the severe population dose–response relationships.
Broadly, HR is a proxy for relative risk.18 We, therefore, calculated PAF describing the TB incidence attributable to air pollutants as PAF = (HR – 1)/HR.19 The population dose–response relationships between concentrations of air pollutant i (Ci) and the PAFs of incident TB can then be constructed by fitting those calculated PAFs with the three-parameter Hill model, resulting in a conditional probability of PAF given all probable Ci taking into account (i.e., P(PAFi|Ci)),
(1)
where PAFmax stands for the maximum PAF, AC50 characterizes the half-maximum PAF posed by particular air pollutant concentration (ppb for NO2 and NOX; ppm for CO; μg/m3 for PM2.5 and PM10), and n is the Hill coefficient which is a measure of cooperativity. A value of n = 1 represents a linear response at low concentration, n > 1 represents a sublinear (sigmoidal) response indicating positive cooperatively, and n < 1 represents a superlinear response. TableCurve 2D (Version 5.01, AISN Software Inc., Mapleton, OR, USA) was used to fit with PAF data to determine the governing population dose–response relationships.
Risk Characterization
Following the Bayesian inference, the ambient air pollution exposure-induced risk of TB development can be quantified through jointing prior probability of pollutant concentration (P(Ci)) with conditional probability (P(PAFi|Ci)), resulting in a joint probability (i.e., posterior probability) that can be expressed mathematically as,
(2)
where ΦR(PAFi) is the cumulative distribution function characterizing the PAF of TB associated with exposure to a specific air pollutant i.
To better understand the likely probability of ambient air pollution exposure-induced risk of TB, we used the maximum probability of 1 to subtract the cumulative risk profile as 1 – ΦR(PAFi), leaving an exceedance risk (ER) profile ΦER(PAFi), representing the probability for the PAF to exceed a particular level at a given air pollution exposure. The contribution of air pollution exposure to the TB incidence rate can then be estimated by multiplying ΦER(PAFi) to the site-specific incidence rate.
Results
Air Pollutant Concentrations
Figure S1 shows that the concentrations of all air pollutants in the four study sites have a downward trend. The concentration fluctuations of NO2 and NOX are barely seen in Taitung County, whereas PM2.5 and PM10 concentrations in Pingtung County show a different pattern from those in other study sites, with the largest fluctuations (Figure S1). Simulation results showed that the lognormal (LN) function with a geometric mean (gm) and a geometric standard deviation (gsd) was the most suitable fitted distribution for the monthly air pollutant concentration in the period 2006–2016 among four study sites (Figures 2 and S1, Table S2). The ranges of gm concentrations of NO2, NOX, CO, PM2.5, and PM10 were 5.07–20.53 ppb, 7.49–31.17 ppb, 0.33–0.62 ppm, 12.04–27.22 μg/m3, and 27.56–51.44 μg/m3, respectively (Table S2).
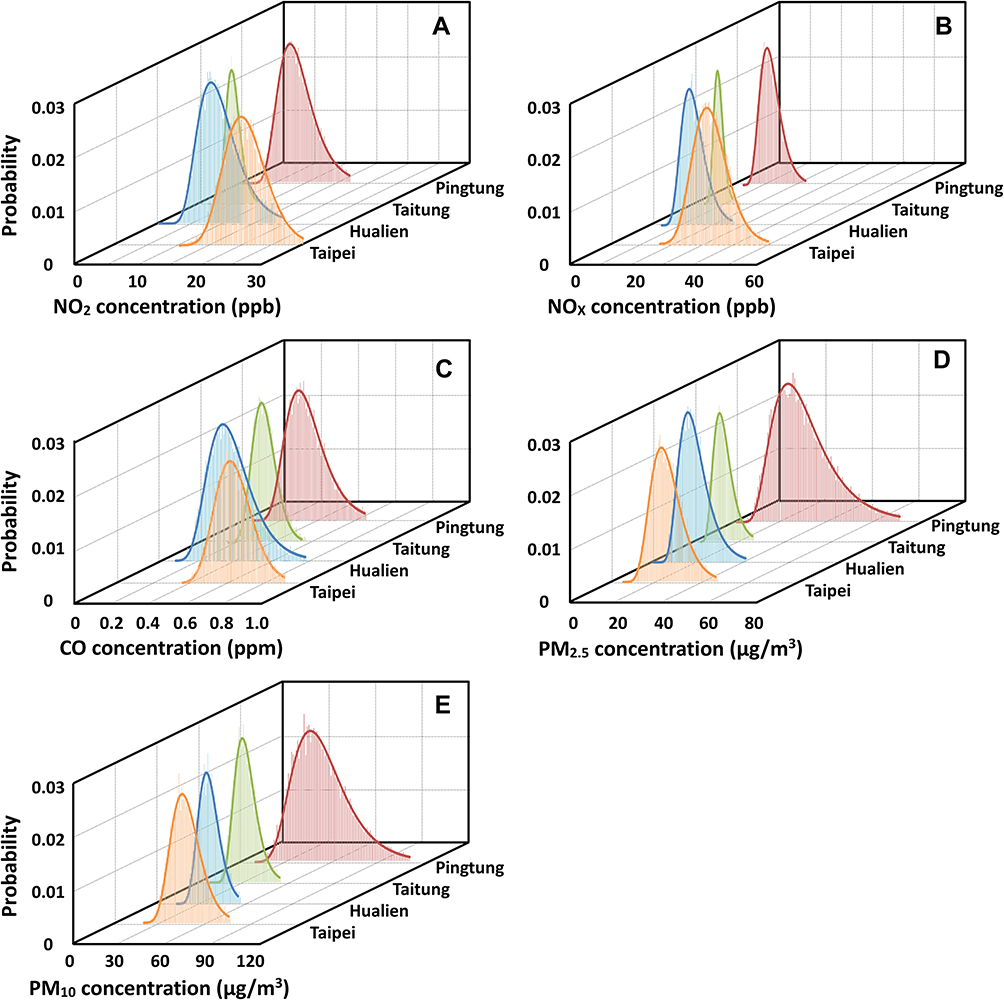 |
Figure 2 Probability distributions of concentrations of air pollutants for (A) NO2, (B) NOX, (C) CO, (D) PM2.5, and (E) PM10 in Taipei City, Hualien, Taitung, and Pingtung Counties, respectively. |
We found that Taipei City had the highest concentrations of NO2 (gm: 20.53 ppb, gsd: 1.18), NOX (31.17 ppb, 1.20), and CO (0.62 ppm, 1.17), whereas the highest concentrations of PM2.5 (27.22 μg/m3, 1.57) and PM10 (51.44 μg/m3, 1.41) were found in Pingtung County (Figure 2, Table S2). By contrast, Hualien and Taitung Counties had the relatively low concentrations of NO2 (rang of gm: 5.07–9.60 ppb), NOX (7.49–12.55 ppb), CO (0.34–0.39 ppm), PM2.5 (12.04–17.23 μg/m3), and PM10 (27.56–30.83 μg/m3) (Table S2).
Population Dose–Response Relationship Between Air Pollution and PAF
Under the severe scenario, PAFmax estimates associated with exposures to NO2, NOX, and CO could be as high as 1. Therefore, the fixing PAFmax of 1 was used in the dose–response fittings to avoid unreasonable upper limits higher than 1. Figure 3A–H demonstrates that Hill models could adequately elucidate the population dose–response relationships between air pollutant concentrations (Ci) and the PAF of incident TB (r2 = 0.86–0.98; p-value < 0.01) (Table 1). Compared with NO2, NOX, and CO, the optimally fitted PAFmax estimates for PM2.5 and PM10 under the severe scenario were 0.34 ± 0.01 (mean ± se) and 0.36 ± 0.04, respectively (Figure 3D and E, Table 1). Moreover, AC50 for NO2, NOX, CO, PM2.5, and PM10 were 31.59 ± 1.15 ppb, 46.33 ± 1.88 ppb, 1.12 ± 0.07 ppm, 28.46 ± 0.11 μg/m3, and 53.32 ± 1.39 μg/m3, respectively (Figure 3A–E, Table 1).
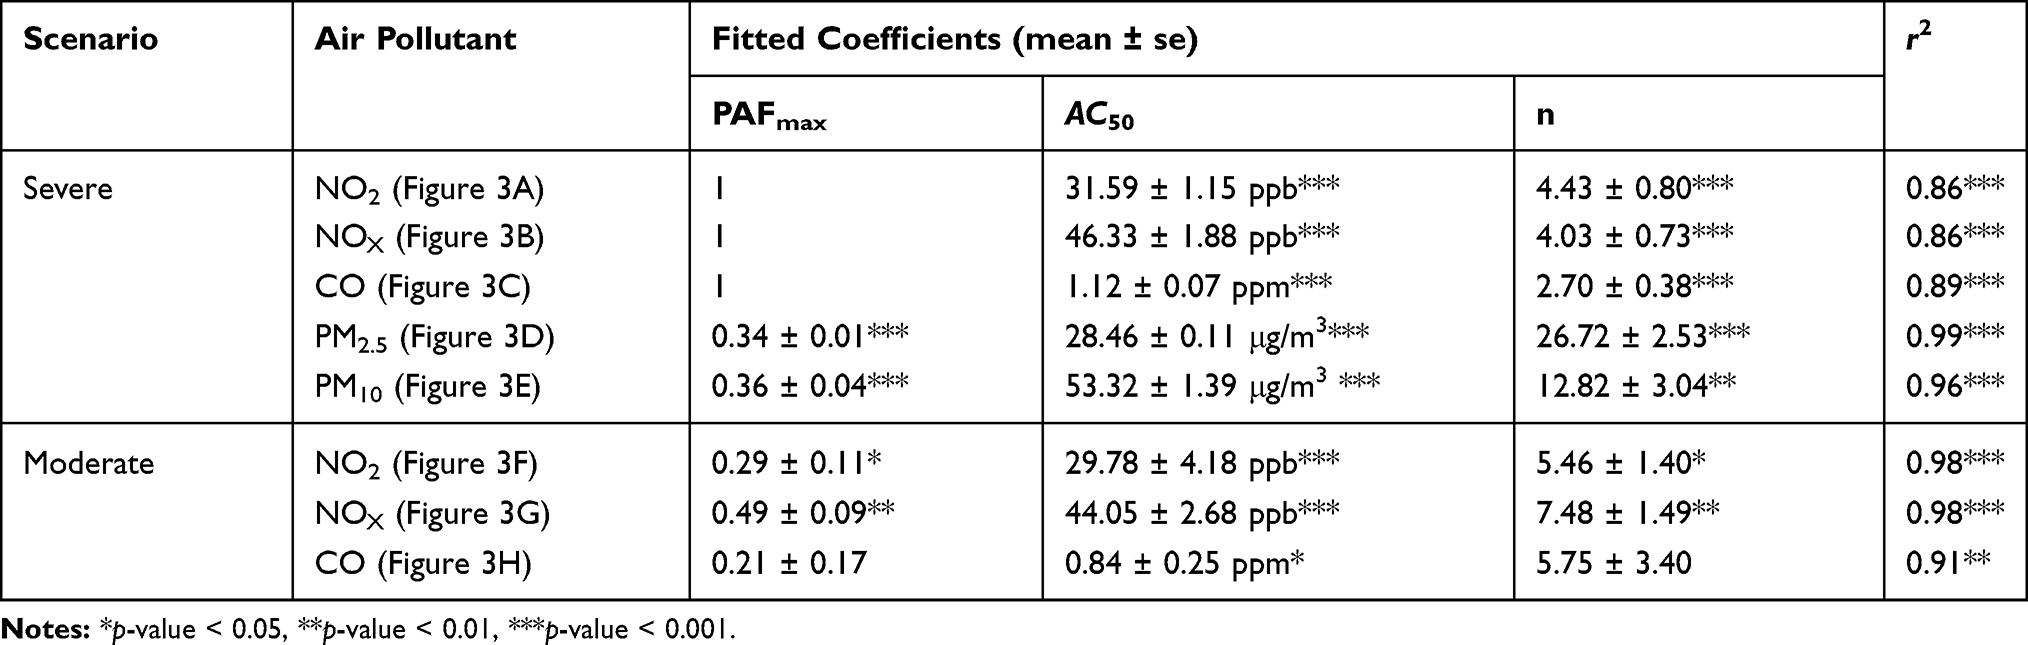 |
Table 1 Fitted Coefficients of Three-Parameter Hill Models for Describing the Relationships Between Air Pollutant Concentrations and Population Attributable Fraction (PAF) of Incident TB |
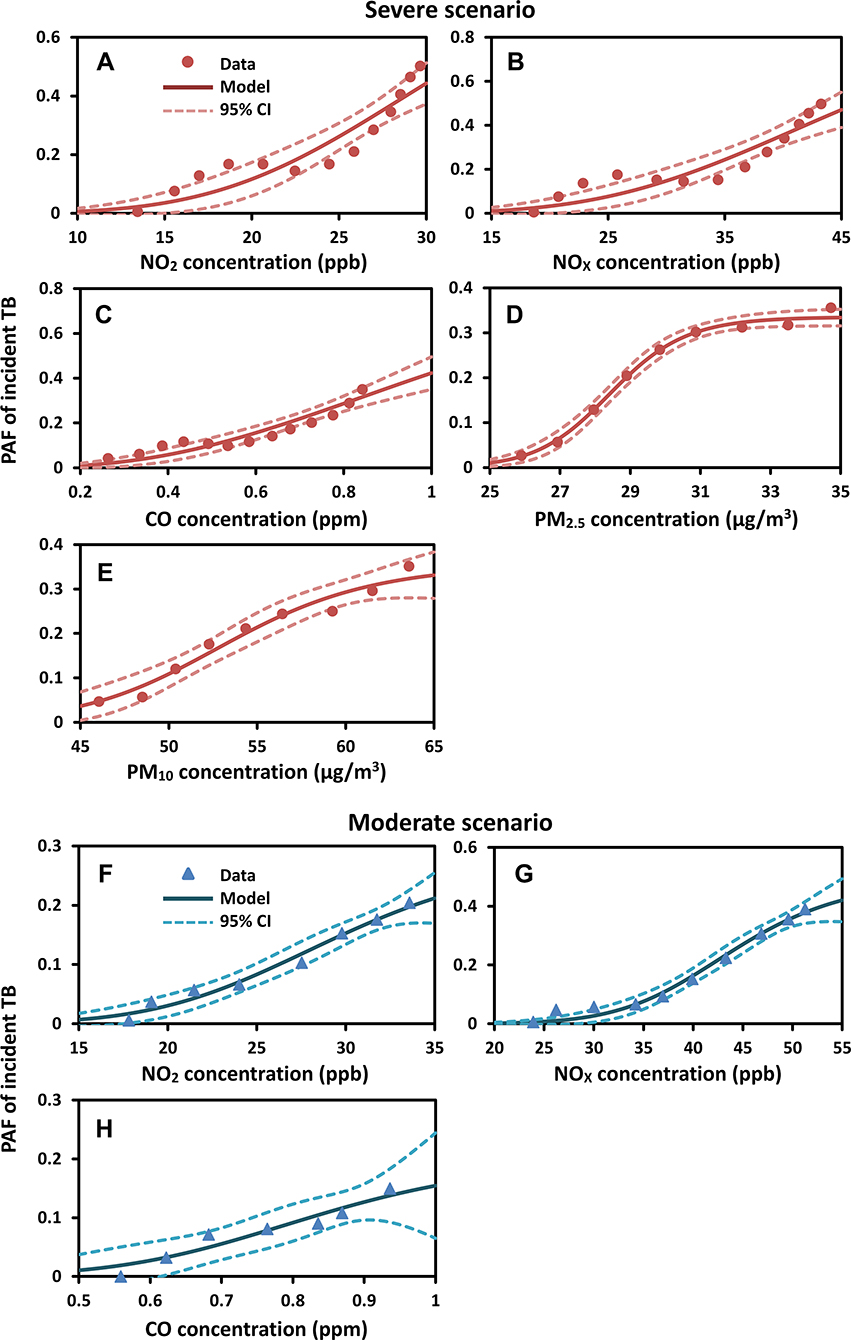 |
Figure 3 Population dose–response profiles describing the relationship between air pollutant concentrations and population attributable fraction (PAF) of incident TB for (A–E) NO2, NOX, CO, PM2.5, and PM10 under the severe scenario; and for (F–H) NO2, NOX, and CO under the moderate scenario. |
For the moderate scenario (Figure 3F–H), PAFmax was in the following order of NOX > NO2 > CO with estimates of 0.49 ± 0.09, 0.29 ± 0.11, and 0.21 ± 0.17, respectively (Table 1). Under the same scenario, AC50 estimates of NOX, NO2, and CO were 44.05 ± 2.68 ppb, 29.78 ± 4.18 ppb, and 0.84 ± 0.25 ppm, respectively (Table 1). For both severe and moderate scenarios, all of the fitted Hill coefficients n were larger than 1, indicating positive cooperativity of the population exposure-response (Ci–PAF) relationships (Table 1).
Contribution of Ambient Air Pollution to the Risk of TB Development
Figure 4 displays the population-level ER profiles of the PAF of TB due to exposure to ambient air pollutants for Taipei City and Hualien, Taitung, and Pingtung Counties under severe and moderate scenarios. The highest estimated PAFs of TB related to ambient air pollution exposure at exceedance probabilities of 0.8 (ER = 0.8, most likely) and 0.5 (ER = 0.5, likely) are summarized in Table 2.
 |
Table 2 Estimated the Highest Population Attributable Fraction (PAF) of TB Associated with Air Pollution Exposure at Exceedance Risk Probabilities of 0.8 (Most Likely) and 0.5 (likely) for Taipei City, Hualien, Taitung, and Pingtung, Respectively |
 |
Figure 4 Population-level exceedance risk curve of air pollutants-associated population attributable fraction (PAF) of incident TB under severe and moderate scenarios for (A, B) Taipei City, (C, D) Hualien County, (E, F) Taitung County, and (G, H) Pingtung County, respectively. |
Under the severe scenario at ER = 0.8, CO exposure showed the highest median PAFs in all study sites, indicating that there was 80% probability for the contribution of CO exposure to incident TB cases exceeding 12.2% (95% CI: 9.0–15.4%), 2.7% (0.7–4.8), 2.6% (0.6–4.5%), and 1.6% (0.1–3.1%) in Taipei, Hualien, Taitung, and Pingtung, respectively (Figure 4A,C,E and G, Table 2). Under the same scenario at ER = 0.5, CO exposure also had the highest PAFs ranging from 3.8% (1.4–6.3%) to 16.6% (13.7–19.5%) in Taipei, Hualien, and Taitung (Figure 4A,C and E, Table 2), whereas PM10 showed the highest median PAF only in Pingtung County with estimates of 11.9% (9.0–14.8%) (Figure 4G, Table 2). Additionally, we found that the PAFs due to NOX were comparable with that of CO in Taipei City, with the median PAFs of 16.4% at ER = 0.5 and 9.8% at ER = 0.8 (Figure 4A).
Under the moderate scenario at ERs = 0.5 and 0.8, the results showed that the median PAFs posed by air pollutants were ≤0.2% in Hualien, Taitung, and Pingtung Counties (Figure 4D,F and H, Table 2). By contrast, air pollutants had a certain contribution to the incidence of TB in Taipei City even under the moderate scenario (Figure 4B, Table 2). Specifically, the highest PAFs posed by NO2 and NOX exposures were 1.7% (0.1–3.2%) at ER = 0.8 and 3.3% (1.0–5.6%) at ER = 0.5, respectively (Figure 4B, Table 2). However, it is most likely (ER = 0.8) that NOx exposure contributed 1.2% (median PAF) to developing TB (Figure 4B). The exposure to CO also had a contribution to the risk of TB development, with median PAFs of 3.1% at ER = 0.5 and 1.6% at ER = 0.8 (Figure 4B). Overall, our results revealed that Taipei City had the highest PAF associated with exposure to ambient air pollutants under both severe and moderate scenarios.
On the basis of the 11-year annual TB incidence data (Table S1) and the PAF estimates in four study sites, the contribution of a specific air pollutant exposure on the annual TB incidence rate can be estimated (Table 2). The air pollutant-induced contribution to the TB incidence rates at ERs = 0.8 and 0.5 ranged from 0.04 (0–0.17) to 4.72 (2.80–6.96) per 100,000 population and from 0.15 (0–0.63) to 10.74 (7.26–14.75) per 100,000 population, respectively (Table 2). Under severe scenario, it is most likely (i.e., 80% risk probability) that the contributions of CO exposure to the TB incidences were 4.72 (2.80–6.96), 2.58 (0.60–4.96), 2.29 (0.49–4.41), and 1.46 (0.10–2.94) per 100,000 population in Taipei, Hualien, Taitung, and Pingtung, respectively (Table 2).
Discussion
Since the incidence of TB and the concentration of air pollutants vary by region, three high-incidence regions in Hualien, Taitung, and Pingtung Counties, and a relatively low-incidence region in metropolitan Taipei City were selected as our study sites to conduct a risk assessment of ambient air pollution to TB. To the best of our knowledge, the present study was the first attempt to integrate probabilistic and population-level risk assessment to assess the contribution of ambient air pollution exposure to the risk of TB development on a regional scale. Although an increasing number of epidemiological studies have explored the association between ambient air pollutants and the risk of TB in recent years,7–13,20 none of these studies implemented a probabilistic approach incorporating the epidemiological perspective of PAF to evaluate the potential population-level risk of TB development attributable to ambient air pollution. Therefore, this study provided an integrative approach by using a Bayesian-based probabilistic risk assessment model to link exposure concentrations of air pollutants quantified in a probabilistic manner with the PAF-based population dose–response models for offering the important insights into the contribution of air quality to the risk of TB.
In this study, we showed that the contribution of CO exposure to the risk of TB development was higher than other air pollutants. Epidemiological studies conducted in Northern California of the United States,9 Iran,11 and Taiwan13 indicated that the elevated risk of TB was more associated with exposure to ambient CO than that to NOX and NO2. Lai et al13 revealed that CO had the highest adjusted HR (1.89; 97.5th percentile: 4.58) compared with NOX (1.21; 1.41), NO2 (1.33; 1.70), PM2.5 (1.39; 2.03), and PM10 (0.95; 1.17). By using 10-year data to assess the individual level of air pollution exposure in Iran, Rajaei et al11 indicated that long-term exposure to CO was positively associated with TB development. Their study also found that the level of NOX was not significantly related to TB.11 Smith et al9 showed an apparent dose–response relationship between CO levels and odds of pulmonary TB among both individuals and smokers; however, once stratified on smoking status, the dose–response pattern between NO2 and pulmonary TB odds was less pronounced. There was a 50% (95% CI: 15 – 95%) increase in the risk of pulmonary TB for those exposed to the highest concentration of CO relative to those with the lowest exposure.9 In addition, a 5-year time-series study in Jinan of China also found positive associations between CO and the increased pulmonary TB risk among gender, age group, and smear-negative cases.20
Different PAF patterns among geographical regions were also observed in this study, reflecting the regional differences in pollution levels. In Taipei City with the highest exposure levels of CO (gm: 0.62 ppm), NOX (31.17 ppb), and NO2 (20.53 ppb), the contribution of CO exposure to the risk of TB development under the severe scenario ranged from 12.2% to 16.6% (range of median PAFs), while NOX and NO2 exposures contributed 9.8–16.4% to developing TB. By contrast, Pingtung County had the highest level of PM10 (gm: 51.44 μg/m3). However, in Pingtung County, the impact of PM10 exposure on TB incidence was obviously only observed under the severe scenario, with a median PAF of 11.9%. Ambient air pollutants originate from different causes and exist in varying quantities in various regions. In Taipei City, nearly 94% of CO emissions and 80% of NOX emissions resulted from motor vehicles.21 It implies that urbanization accompanied by substantial amounts of vehicle emissions could cause an increase in the risk of TB, even in a low-incidence region such as Taipei City. The industrial construction activities (78%) and combustion and agriculture (8%) are the primary sources of PM10 contributing to Pingtung County’s air pollution.21 Previous epidemiological studies have provided inconsistent results in the association between PM10 and the incidence of TB. Most studies have found no significant associations between PM10 and TB.8,9,11,13,22,23 However, an epidemiological study in China reported that TB was positively correlated with the concentration of PM10.12 Further studies are needed to elucidate the possible associations between PM10 exposure and the incidence of TB.
The underlying mechanisms for the increase in the risk of TB development with ambient air pollution exposure might be multifactorial. Growing evidence in terms of the physiological mechanism supports the association between exposure to ambient air pollutants and the elevated risk of developing TB. Animal studies showed that long-term exposure to diesel exhaust can reduce macrophage functions such as productions of tumor necrosis factor-alpha (TNF-α) and interferon-gamma (IFN-γ),24,25 resulting in the indirect increase of the mycobacterial load in mice.26 TNF-α has been suggested to play a central role in the granulomata formation for host defenses against M. tuberculosis.27–29 Furthermore, the inhibition of TNF-α by drugs in clinical medicine has been linked to an increased risk of reactivation TB.30 IFN-γ is also essential to activate macrophages and facilitate killing bacteria.1,31
In addition, CO may activate interleukin-10 cascade in lung macrophage and promote the risk of M. tuberculosis reactivation.32 From the microbiological perspective, Park at el33 indicated that mycobacteria can use CO as the carbon and energy source to grow under aerobic conditions. Accordingly, CO may be a potential risk factor to activate M. tuberculosis. A murine study revealed that inhalation of NO2 might decrease pulmonary bactericidal ability and increase the risk of respiratory bacterial infections.34 PM-bound transition metals (e.g., iron) are thought to induceoxidative stress in the lung and have been associated with altered host defenses in rats.35,36 Chronic exposure to air pollution impairs the normal clearance of secretions on the tracheobronchial mucosal surface, allowing the TB bacilli to reach the alveoli by avoiding the first level of host defenses.37
A systematic review indicated TB risk factors consisting of diabetes (PAF = 6.3%), HIV infection (7.3%), alcohol use > 40 g/day (13.1%), active smoking (22.7%), indoor pollution (26.2%), and malnutrition (34.1%).3 Our results showed that the PAF due to ambient air pollution exposure could reach up to 20% that were comparable with the PAFs due to active smoking and indoor pollution. Notably, indoor pollution contributes to a distinct proportion of the TB burden. Pollutants of concern indoors include CO, NOX, and PM.38,39 Exposure to indoor CO, NOX, and PM could interfere with mucociliary clearance, reducing the antibacterial effects of macrophages.5 Because of our attention only on ambient air pollution, we suggest that future studies explore the joint effects of ambient and household air pollution as well as personal smoking habits on the risk of TB development.
Moreover, our results showed that air pollutants had a relatively low contribution to the risk of TB development (range of PAFs: 0–8.0%) in the highest incidence regions of Hualien and Taitung. There were three reasons that could be explained for this finding. First, the concentration levels of air pollutants in rural Hualien and Taitung regions were generally lower than those in Taipei City and Pingtung County. Second, the statistical data have indicated that aborigines residing in Hualien and Taitung Counties have substantially higher TB incidence rates, with nearly 4 times higher than the general population.40 Genetic factor such as NRAMP 1 polymorphism has been demonstrated to play an important role in affecting susceptibility to and increase the risk for TB in Taiwanese aborigines.41 Third, environmental and socio-economic factors such as poor hygiene, lower-income, information barriers, and inconvenience of transportation along with the social behaviors such as alcoholism and the relatively intact village lifestyle are considered to be associated with the high prevalence of TB among Taiwanese aborigines.41–43
There are several limitations to our study. First, this study did not include individual factors such as age, gender, and subpopulations into assessment; therefore, our results were more applicable to the general population. Because of the lack of dose–response data regarding sulfur dioxide (SO2) in Taiwan, we did not consider the effect of SO2 on TB, which has been reported a positive association with TB incidences in South Korea22 and in Chengdu of China.12
Second, the present assessment results for the contribution of ambient air pollution exposure to the risk of TB development might be underestimated due to insufficient accuracy of the exposure and effect analyses. We used ambient air monitoring data to conduct a time-series exposure analysis to estimate the levels of population exposure to air pollutants, which may not accurately reflect the intensity of personal exposure. The data used in the effect analysis were extracted from Lai et al,13 which is the only one epidemiological study in Taiwan concerning the ambient air pollution-related TB issue. However, the effect of ambient air pollution on TB might be underestimated in their study due to the misclassification of exposure. Besides, their estimated associations between ambient air pollution and TB were unstable and had wider CIs. The wider CIs may disturb the precision of the dose–response analysis. Thus, we designed the severe and moderate scenarios to construct pollutant concentration–PAF relationship profiles.
Third, our population dose–response relationships for PM2.5 and PM10 were only applied to the concentrations ≥25 and 45 μg/m3, respectively. Further epidemiological investigations for providing more robust evidence on the association between ambient air pollution and TB incidences are urgently necessary to improve our insights into the perspective on the influence of ambient air pollution exposure on the risk of TB development.
Despite these limitations, our results based on the probabilistic population-level risk assessment contribute to the understanding of the contribution of air quality to the risk of TB. The assessment results showed that CO exposure had the highest contribution to the risk of TB development, followed by NOX and NO2 exposures. While the relationship between TB and exposure to air pollution is still under study, the positive associations of TB with ambient CO, NOx, or NO2 have been observed in different countries, including the United States,8,9 Iran,11 China,12,20 and Taiwan.13 Comparatively limited studies for exploring the impacts of ambient air pollution on TB from Africa and Latin America are available. However, using data in Africa, Mexico of the Latin America, India, and other countries, previous meta-analyses have revealed an association between indoor air pollution, primarily from biomass fuel combustion, and TB.5,6 Taken together, our findings support the hypothesis and observations of previous studies that the linkage between poor air quality and the risk of TB development, particularly the CO, NOX, and NO2. Considering that people continue to be exposed to both TB bacilli and ambient air pollutants, our integrated approach can be applied for different countries/regions to identify which air pollutants contribute to the higher risk of TB in order to develop potential mitigation programs.
Conclusion
Our study indicates that, on a regional scale, the elevated risk of TB development is inexorably associated with ambient air pollutant exposures, which implicates the multifaceted processes that underlie the global TB burden. By implementing the probabilistic population-level risk assessment, we found that CO exposure showed the highest PAF, followed by NOX and NO2 exposures. These findings provide strong empirical support for the hypothesis and observations from the literature that poor air quality is highly likely to link aetiologically to the risk of TB development. It suggests that preventing overexposure to CO, NOX, and NO2 and developing mitigation strategies are robust to have health benefits to susceptible and latently infected individuals in reducing the TB burden. The approach presented here will be applicable across TB infection systems for which ambient air pollution data exist, allowing a wide range of insights into the contribution of air quality to the risk of TB.
Acknowledgment
This study was supported by the Ministry of Science and Technology of the Republic of China under Grant MOST 104-2222-E-002-030-MY3.
Disclosure
The authors report no conflicts of interest in this work.
References
1. Kaufmann SHE. How can immunology contribute to the control of tuberculosis? Nat Rev Immunol. 2001;1:20–30. doi:10.1038/35095558
2. Houben RM, Dodd PJ. The global burden of latent tuberculosis infection: a re-estimation using mathematical modelling. PLoS Med. 2016;13:e1002152. doi:10.1371/journal.pmed.1002152
3. Lönnroth K, Castro KG, Chakaya JM, et al. Tuberculosis control and elimination 2010–50: cure, care, and social development. Lancet. 2010;375:1814–1829. doi:10.1016/S0140-6736(10)60483-7
4. Narasimhan P, Wood J, MacIntyre CR, Mathai D. Risk factors for tuberculosis. Pulm Med. 2013;2013:828939. doi:10.1155/2013/828939
5. Lin HH, Ezzati M, Murray M. Tobacco smoke, indoor air pollution and tuberculosis: a systematic review and meta-analysis. PLoS Med. 2007;4:173–189. doi:10.1371/journal.pmed.0040020
6. Sumpter C, Chandramohan D. Systematic review and meta-analysis of the associations between indoor air pollution and tuberculosis. Trop Med Int Health. 2013;18:101–108. doi:10.1111/tmi.12013
7. Jassal MS, Bakman I, Jones B. Correlation of ambient pollution levels and heavily-trafficked roadway proximity on the prevalence of smear-positive tuberculosis. Public Health. 2013;127:268–274. doi:10.1016/j.puhe.2012.12.030
8. Smith GS, Schoenbach VJ, Richardson DB, Gammon MD. Particulate air pollution and susceptibility to the development of pulmonary tuberculosis disease in North Carolina: an ecological study. Int J Environ Health Res. 2014;24:103–112. doi:10.1080/09603123.2013.800959
9. Smith GS, van den Eeden SK, Garcia C, et al. Air pollution and pulmonary tuberculosis: a nested case–control study among members of a northern California health plan. Environ Health Perspect. 2016;124:761–768. doi:10.1289/ehp.1408166
10. You SM, Tong YW, Neoh KG, Dai YJ, Wang CH. On the association between outdoor PM2.5 concentration and the seasonality of tuberculosis for Beijing and Hong Kong. Environ Pollut. 2016;218:1170–1179. doi:10.1016/j.envpol.2016.08.071
11. Rajaei E, Hadadi M, Madadi M, et al. Outdoor air pollution affects tuberculosis development based on geographical information system modeling. Biomed Biotechnol Res J. 2018;2:39–45. doi:10.4103/bbrj.bbrj_5_18
12. Zhu S, Xia L, Wu JL, et al. Ambient air pollutants are associated with newly diagnosed tuberculosis: a time-series study in Chengdu, China. Sci Total Environ. 2018;631-632:47–55. doi:10.1016/j.scitotenv.2018.03.017
13. Lai TC, Chiang CY, Wu CF, et al. Ambient air pollution and risk of tuberculosis: a cohort study. Occup Environ Med. 2016;73:56–61. doi:10.1136/oemed-2015-102995
14. Centers for Disease Control of Taiwan. CDC Monitor for Tuberculosis. Available from: https://daily.cdc.gov.tw/stoptb/CareMagChart.aspx.
15. Chang CO, Peng CW. Urban renewal and affordable housing in Taiwan. In: Altmann E, Gabriel M, editors. Multi-Owned Property in the Asia-Pacific Region. London: Palgrave Macmillan; 2018:137–151. doi:10.1057/978-1-137-56988-2_8
16. Shilova MV, Glumnaia TV. Influence of seasonal and environmental factors on the incidence of tuberculosis. Probl Tuberk Bolezn Legk. 2004;2:17–22.
17. Taiwan Ministry of Health and Welfare. National health insurance annual statistical. Available from: https://dep.mohw.gov.tw/DOS/np-1918-113.html.
18. Stare J, Maucort-Boulch D. Odds ratio, hazard ratio and relative risk. Metodološki Zvezki. 2016;13:59–67.
19. Natarajan S, Lipsitz SR, Rimm E. A simple method of determining confidence intervals for population attributable risk from complex surveys. Stat Med. 2007;26:3229–3239. doi:10.1002/sim.2779
20. Liu Y, Cui L, Hou L, et al. Ambient air pollution exposures and newly diagnosed pulmonary tuberculosis in Jinan, China: a time series study. Sci Rep. 2018;27:17411. doi:10.1038/s41598-018-35411-6
21. Environmental Protection Administration, Executive Yuan R.O.C. Taiwan Emission Data System (TEDS9.0). Available from: https://teds.epa.gov.tw/TEDS.aspx.
22. Hwang SS, Kang S, Lee JY, et al. Impact of outdoor air pollution on the incidence of tuberculosis in the Seoul metropolitan area, South Korea. Korean J Intern Med. 2014;29:183–190. doi:10.3904/kjim.2014.29.2.183
23. Ge E, Fan M, Qiu H, et al. Ambient sulfur dioxide levels associated with reduced risk of initial outpatient visits for tuberculosis: a population based time series analysis. Environ Pollut. 2017;228:408–415. doi:10.1016/j.envpol.2017.05.051
24. Saito Y, Azuma A, Kudo S, Takizawa H, Sugawara I. Effects of diesel exhaust on murine alveolar macrophages and a macrophage cell line. Exp Lung Res. 2002;28:201–217. doi:10.1080/019021402753570509
25. Saito Y, Azuma A, Kudo S, Takizawa H, Sugawara I. Long-term inhalation of diesel exhaust affects cytokine expression in murine lung tissues: comparison between low-and high-dose diesel exhaust exposure. Exp Lung Res. 2002;28:493–506. doi:10.1080/01902140290096764
26. Hiramatsu K, Saito Y, Sakakibara K, et al. The effects of inhalation of diesel exhaust on murine mycobacterial infection. Exp Lung Res. 2005;31:405–415. doi:10.1080/01902140590918786
27. Mohan VP, Scanga CA, Yu K, et al. Effects of tumor necrosis factor alpha on host immune response in chronic persistent tuberculosis: possible role for limiting pathology. Infect Immun. 2001;69:1847–1855. doi:10.1128/IAI.69.3.1847-1855.2001
28. Van Deventer SJH. Transmembrane TNF-α, induction of apoptosis, and the efficacy of TNF-targeting therapies in Crohn’s disease. Gastroenterology. 2001;121:1242–1246. doi:10.1053/gast.2001.29035
29. Fallahi-Sichani M, El-Kebir M, Marino S, Kirschner DE, Linderman JJ. Multiscale computational modeling reveals a critical role for TNF-α receptor 1 dynamics in tuberculosis granuloma formation. J Immunol. 2011;186:3472–3483. doi:10.4049/jimmunol.1003299
30. Wallis RS. Tumour necrosis factor antagonists: structure, function, and tuberculosis risks. Lancet Infect Dis. 2008;8:601–611. doi:10.1016/S1473-3099(08)70227-5
31. Sugawara I, Yamada H, Kazumi Y, et al. Induction of granulomas in interferon-γ gene-disrupted mice by avirulent but not by virulent strains of Mycobacterium tuberculosis. J Med Microbiol. 1998;47:871–877. doi:10.1099/00222615-47-10-871
32. Tremblay GA. Historical statistics support a hypothesis linking tuberculosis and air pollution caused by coal. Int J Tuberc Lung Dis. 2007;11:722–732.
33. Park SW, Hwang EH, Park H, et al. Growth of mycobacteria on carbon monoxide and methanol. J Bacteriol. 2003;185:142–147. doi:10.1128/JB.185.1.142-147.2003
34. Goldstein E, Eagle MC, Hoeprich PD. Effect of nitrogen dioxide on pulmonary bacterial defense mechanisms. Arch Environ Health. 1973;26:202–204. doi:10.1080/00039896.1973.10666256
35. Kelly FJ. Oxidative stress: its role in air pollution and adverse health effects. Occup Environ Med. 2003;60:612–616. doi:10.1136/oem.60.8.612
36. Zelikoff JT, Schermerhorn KR, Fang K, Cohen MD, Schlesinger RB. A role for associated transition metals in the immunotoxicity of inhaled ambient particulate matter. Environ Health Perspect. 2002;110:871. doi:10.1289/ehp.02110s5871
37. Houtmeyers E, Gosselink R, Gayan-Ramirez G, Decramer M. Regulation of mucociliary clearance in health and disease. Eur Respir J. 1999;13:1177–1188. doi:10.1034/j.1399-3003.1999.13e39.x
38. Mihucz VG, Záray G. Indoor air pollution. Compr Anal Chem. 2016;73:45–71. doi:10.1016/bs.coac.2016.02.003
39. Dai D, Prussin AJ, Marr LC, Vikesland PJ, Edwards MA, Pruden A. Factors shaping the human exposome in the built environment: opportunities for engineering control. Environ Sci Technol. 2017;51:7759–7774. doi:10.1021/acs.est.7b01097
40. Hsueh PR, Liu YC, So J, Liu CY, Yang PC, Luh KT. Mycobacterium tuberculosis in Taiwan. J Infect. 2006;52:77–85. doi:10.1016/j.jinf.2005.08.008
41. Hsu YH, Chen CW, Sun HS, Jou RW, Lee JJ, Su IJ. Association of NRAMP 1 gene polymorphism with susceptibility to tuberculosis in Taiwanese aboriginals. J Formos Med Assoc. 2006;105:363–369. doi:10.1016/S0929-6646(09)60131-5
42. Tsai HT, Liu TM. Challenges and solutions in improving tuberculosis care among aboriginal people in Taiwan. East-West Center Working Papers. 2006;32:1–7.
43. Dou HY, Chen YY, Kou SC, Su IJ. Prevalence of Mycobacterium tuberculosis strain genotypes in Taiwan reveals a close link to ethnic and population migration. J Formos Med Assoc. 2015;114:484–488. doi:10.1016/j.jfma.2014.07.006
 © 2019 The Author(s). This work is published and licensed by Dove Medical Press Limited. The full terms of this license are available at https://www.dovepress.com/terms.php and incorporate the Creative Commons Attribution - Non Commercial (unported, v3.0) License.
By accessing the work you hereby accept the Terms. Non-commercial uses of the work are permitted without any further permission from Dove Medical Press Limited, provided the work is properly attributed. For permission for commercial use of this work, please see paragraphs 4.2 and 5 of our Terms.
© 2019 The Author(s). This work is published and licensed by Dove Medical Press Limited. The full terms of this license are available at https://www.dovepress.com/terms.php and incorporate the Creative Commons Attribution - Non Commercial (unported, v3.0) License.
By accessing the work you hereby accept the Terms. Non-commercial uses of the work are permitted without any further permission from Dove Medical Press Limited, provided the work is properly attributed. For permission for commercial use of this work, please see paragraphs 4.2 and 5 of our Terms.