")
Back to Journals » OncoTargets and Therapy » Volume 14
Artificial Intelligence Based on Blood Biomarkers Including CTCs Predicts Outcomes in Epithelial Ovarian Cancer: A Prospective Study
Authors Ma J, Yang J, Jin Y, Cheng S, Huang S, Zhang N, Wang Y
Received 24 February 2021
Accepted for publication 3 May 2021
Published 18 May 2021 Volume 2021:14 Pages 3267—3280
DOI https://doi.org/10.2147/OTT.S307546
Checked for plagiarism Yes
Review by Single anonymous peer review
Peer reviewer comments 3
Editor who approved publication: Dr Sanjeev K. Srivastava
Jun Ma,* Jiani Yang,* Yue Jin, Shanshan Cheng, Shan Huang, Nan Zhang, Yu Wang
Department of Obstetrics and Gynecology, Renji Hospital, School of Medicine, Shanghai Jiao Tong University, Shanghai, People’s Republic of China
*These authors contributed equally to this work
Correspondence: Yu Wang
Department of Obstetrics and Gynecology, Renji Hospital, School of Medicine, Shanghai Jiao Tong University, 160 Pujian Road, Shanghai, 200127, People’s Republic of China
Tel +86-21-68383715
Email [email protected]
Objective: We aimed to develop an ovarian cancer-specific predictive framework for clinical use platinum-sensitivity and prognosis using machine learning methods based on multiple biomarkers, including circulating tumor cells (CTCs).
Patients and Methods: We enrolled 156 epithelial ovarian cancer (EOC) patients, randomly assigned into the training and validation cohorts. Eight machine learning classifiers, including Random Forest (RF), Support Vector Machine, Gradient Boosting Machine, Conditional RF, Neural Network, Naive Bayes, Elastic Net, and Logistic Regression, were used to derive predictive information from 11 peripheral blood parameters, including CTCs. Through the advanced CanPatrol CTC-enrichment technique, we detect CTCs and classify them into subpopulations: epithelial, mesenchymal, and hybrids. Survival curves were generated by Kaplan–Meier method and calculated through the Log rank test.
Results: Machine learning techniques, especially the Random Forest classifier, were superior to conventional regression-based analyses in predicting multiple clinical parameters related to EOC. The values for the receiver operating characteristic (ROC) curve for segregating EOC with advanced clinical stages and platinum-sensitivity were 0.796 (95% CI, 0.727– 0.866) and 0.809 (95% CI, 0.742– 0.876), respectively. Stepwise, we used the unsupervised clustering analysis to identify EOC subgroups with significantly worse overall survival (OS), especially in the advanced-stage group with the p-value of 0.0018 (HR, 2.716; 95% CI, 1.602– 4.605) for progression-free survival (PFS) and 0.0037 (HR, 2.359; 95% CI, 1.752– 6.390) for overall survival (OS).
Conclusion: Machine learning systems could provide risk stratification for EOC patients before initial intervention through blood variables, including circulating tumor cells. The predictive algorithms could facilitate personalized treatment options through promising pre-treatment stratification of EOC patients.
Trial registration: ChiCTR-DDD-16009601 Registered 25 October 2016.
Keywords: artificial intelligence, circulating tumor cell, blood biomarkers, epithelial ovarian cancer
Introduction
About 21,750 cases of ovarian cancer will be newly diagnosed in the United States in 2020.1 While in China, the incidence and mortality of epithelial ovarian cancer (EOC) have increased by 30% and 18%, respectively, evidenced by an average of 15,000 deaths yearly for the past 10 years.2 Due to the absence of clinical symptoms in the early stage of EOC and the lack of effective screening tests, approximately 70% of patients with EOC are diagnosed at advanced stages (stage III and IV).3 Primary disease is treated with original debulking surgery, followed by standard adjuvant chemotherapy, a combination of platinum and taxane-based treatment.4,5 However, 75% of patients at an advanced stage will eventually experience recurrence, resulting in poor survival.6
To improve EOC patients’ long-term outcomes, it is crucial to identify stratification indicators, which could accurately define characteristics and predict outcomes before initial intervention.7 Traditionally, clinical factors such as age and tumor grade have been used to assess prognosis, with limited predictive value.8,9 Emerging evidence indicated that circulating tumor cells (CTC) in ovarian cancer patients’ blood had great potential as a prognosis indicator for poor overall survival in various malignancies.10 Our research team have carried out a clinical trail (ChiCTR-DDD-16009601) and developed a prognosis nomogram model for 152 EOC patients, with the area under curve (AUC) of 0.8705.40 Moreover, several other studies have also reported the prognostic role of CTCs in ovarian cancer, but no consistent results have been obtained.11 In the realm of precision medicine, there is a desperate urgency to develop a promising risk stratification model in ovarian cancer-specific predictive framework. Recently, in order to support clinical decisions, machine learning is widely used by oncologists to generate prediction models with improved performance.12 The cutting-edge artificial intelligence technology could allow computers to “learn” potential patterns derived from previous databases.13 Several researches indicated that machine learning algorithms, such as decision trees and neural networks, played an essential role in risk stratification for carcinomas.14 Random Forest, an ensemble learning algorithm of machine learning with the basic unit of a decision tree, can independently train some relatively weak learning models by ensemble learning, integrating results, and realizing overall prediction.15 Therefore, we combined a large number of simple predictors into complex combinations of multiple biomarkers through various machine learning algorithms for prognosis model construction.
In this study, we aimed to develop an ovarian cancer-specific predictive framework for clinical stages, platinum-sensitivity, and prognosis using machine learning methods based on multiple biomarkers, including circulating tumor cells and clinical variables of patients with EOC.
Materials and Methods
Patients Selection
Firstly, we enrolled a set of ovarian cancer patients (n=185) undergoing treatment between June 2017 to November 2019 in our institution based on the inclusion criteria: 1) with histologically confirmed EOC; 2) without co-existing or prior cancers within 5 years; 3) with available demographic information and clinical data. Then, patients were excluded if they: 1) underwent other treatments, such as radiotherapy, neoadjuvant therapy, or immunotherapy (n=5); 2) without consents for the usage of their medical information for research purpose (n=4); 3) with clinical evidence of sepsis, autoimmune diseases or hematological disorders (n=2); 4) lost to follow-up (n=10); 5) without detailed clinical, imaging, and treatment data (n=8). Finally, we assessed 156 patients in the analysis (Figure 1). Patients were split into training cohort (n = 106) and validation cohort (n = 50) for stepwise analysis.
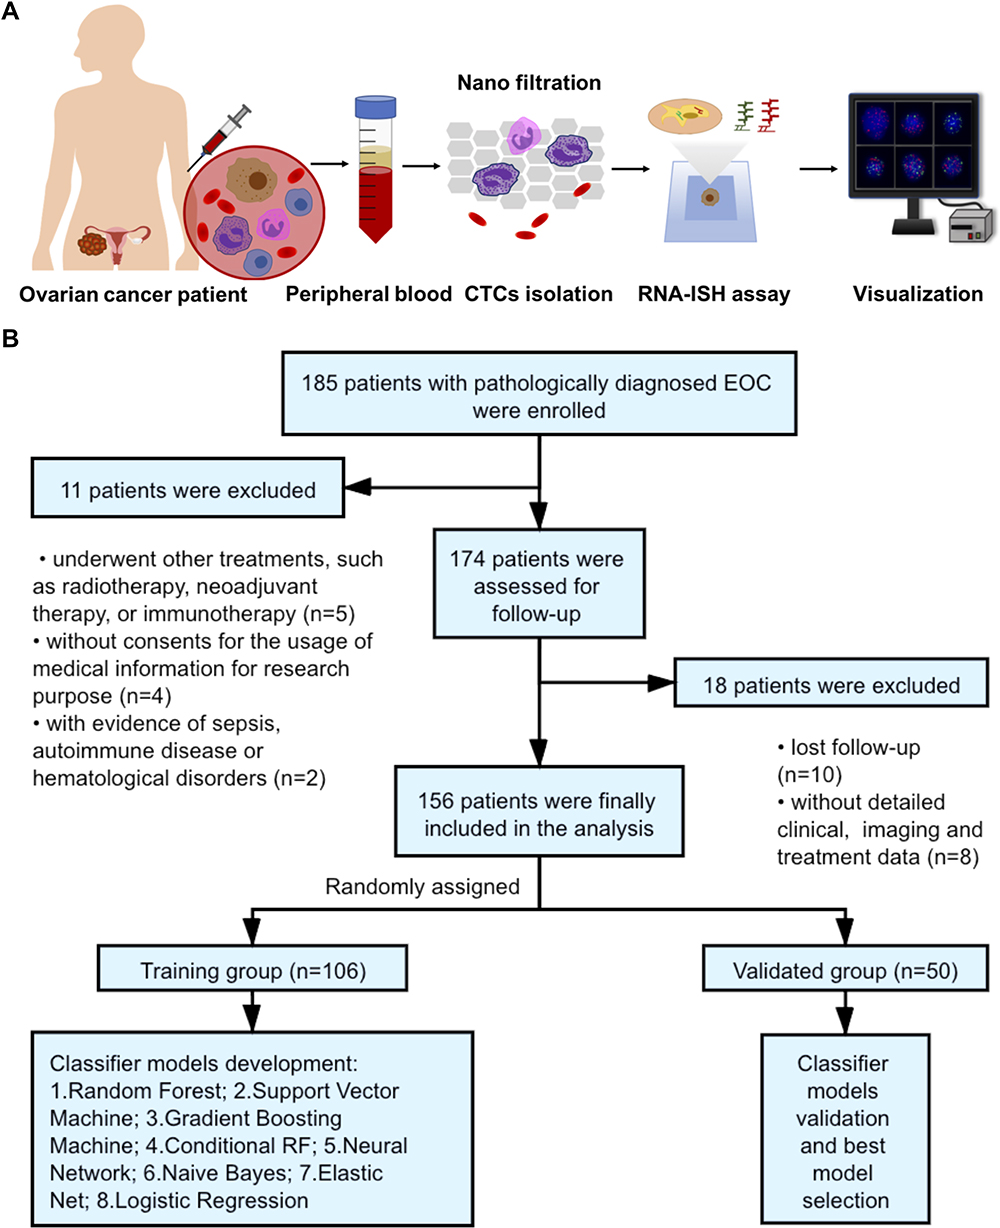 |
Figure 1 The flowchart of the study. (A) We detected the circulating tumor cells (CTCs) through the advanced CanPatrolTM technique. After collecting 5 mL of peripheral blood samples, we used a nanofiltration system for CTCs isolation. Then, CTCs were detected by RNA-In Situ Hybridization (RNA-ISH). (B) We enrolled in 156 epithelial ovarian cancer (EOC) patients according to the inclusion and exclusion criteria. Patients were then randomly assigned to a training group (n=106) and a validated group (n=50) for machine learning model development. |
To achieve optimal tumor debulking, all patients’ operation was aimed at maximal tumor resection without visible residual tumor (R0). The operation was followed by standardized paclitaxel and platinum-based chemotherapy.16 In our study, follow-up visits were performed every 3 months through both clinical and radiological evaluation. The overall survival (OS) was measured from the date of operation to the last follow-up visit or death. The progression-free survival (PFS) was identified from the date of operation to the last follow-up visit or ovarian cancer progression, which was defined through radiographic and clinical evidence. Based on the Gynecologic Cancer Inter-Group (GCOG) consensus statement, platinum-resistance was defined when the progression-free interval since the last line of platinum treatment was less than 6 months.17 This research was approved by the Ethics Committee of Renji Hospital Affiliated to Shanghai Jiao Tong University School of Medicine. We conducted the research in accordance with the Declaration of Helsinki. All participants were informed about the purpose of the trial and signed consent forms for the usage of their information.
Data Collection and Management
Clinicopathologic characteristics, including age, body mass index (BMI), tumor size, histology type, and tumor grade were collected retrospectively from medical records. The clinical stage was evaluated based on the International Federation of Obstetrics and Gynecology Association (FIGO) staging system. Routine blood tests, including hemoglobin (HB), neutrophil, lymphocyte, and platelet, were conducted 1 day before surgery. Tumor biomarkers, including CA-125, CA-199, Human epididymis protein 4 (HE4), Carcinoembryonic antigen (CEA), and Alpha-fetoprotein (AFP) were collected for analysis. Other blood indexes, including C-reaction protein (CRP), albumin, fibrinogen, Lactate dehydrogenase (LDH), Alanine aminotransferase (ALT), Aspartate aminotransferase (AST), and total bile acid (TBA), were also collected 1 day before surgery.
Characterization of CTCs by CanPatrol System
Peripheral blood samples (5 mL) anticoagulated with Ethylene Diamine Tetra-acetic Acid (EDTA) were collected 1 day before surgery. The first 2 mL of blood was discarded to avoid potential skin cell contamination due to venipuncture. After sampling, the blood should be stored at 2 to 8°C and processed within 4 hours.18
To isolate and characterize CTCs, we used the advanced CanPatrolTM technique. The blood samples preserved in the cell preservation solution were centrifuged at 1850 rpm for 5 minutes to remove the supernatant.19 Then, we mixed the samples with 4% formaldehyde and phosphate buffer saline (PBS) solution for 8 minutes.20 Next, the samples were run through the vacuum filtration system, including a filtration tube containing the membrane with a pore size of 8μm diameters, a vacuum pump, and a manifold vacuum plate with valve settings at the pressure of 0.08 MPa.21
Secondly, we detected CTCs and classified them into three subpopulations, mesenchymal, mesenchymal/epithelial hybrid, and epithelial, by RNA-In Situ Hybridization (RNA-ISH). The samples were treated with protease K, while the cells were hybridized with fluorescent probes specific for the following target sequences: green probes for mesenchymal molecules (Vimentin and Twist) and red for epithelial cell adhesion molecules (CK8/18/19 and EpCAM). Finally, we stained nuclei with 40,6-diamidino-2-phenylindole (DAPI) and analyzed the cells through a fluorescent microscope21 (Figure 1). Based on these markers, we classified CTCs into three subgroups: epithelial CTCs (EpCAM and CK8/18/19 +/Vimentin and Twist -, Supplement Figure 1A), hybrids CTCs (EpCAM and CK8/18/19 +/Vimentin and Twist +, Supplement Figure 1B-D), and mesenchymal CTCs (EpCAM and CK8/18/19 -/Vimentin and Twist +, Supplement Figure 1E). Moreover, M-CTC was defined as the percentage of the mesenchymal CTCs subgroup among all CTCs.
Supervised Machine Learning Classifiers
The dataset was repeatedly and randomly sampled until divided into training and validation cohorts with no significant difference (P < 0.20, Table 1). Differences in clinicopathologic characteristics between two cohorts for categorical and continuous variables were analyzed by Chi-square test and T-test, respectively. The model inputs included clinicopathologic characteristics (such as age and BMI) and blood biomarkers (such as CTCs, M-CTC, HB, neutrophil, lymphocyte, platelet, CA-125, CA-199, HE4, CEA, AFP, CRP, albumin, fibrinogen, LDH, ALT, AST, and TBA). The prognostic factors were determined using both univariate and multivariate analyses through Cox’s hazards regression model. Stepwise, we evaluated 7 types of machine learning models, including Support Vector Machine (SVM), Gradient Boosting Machine (GBM), Random Forest (RF), Naive Bayes (NB), Conditional Random Forest (CRF), Elastic Net (EN) and Neural Network (NN). All the classifiers were assessed by R package (“svmRadial” for SVM, “gbm” for GBM, “rf” for RF, “nb” for NB, “cforest” for CRF, “glmnet” for EN and “ nnet” for NN). The RF classifier comprises two machine learning techniques: random feature selection and bagging. Based on multiple variables, we used unsupervised RF clustering to evaluate similarity among patients.
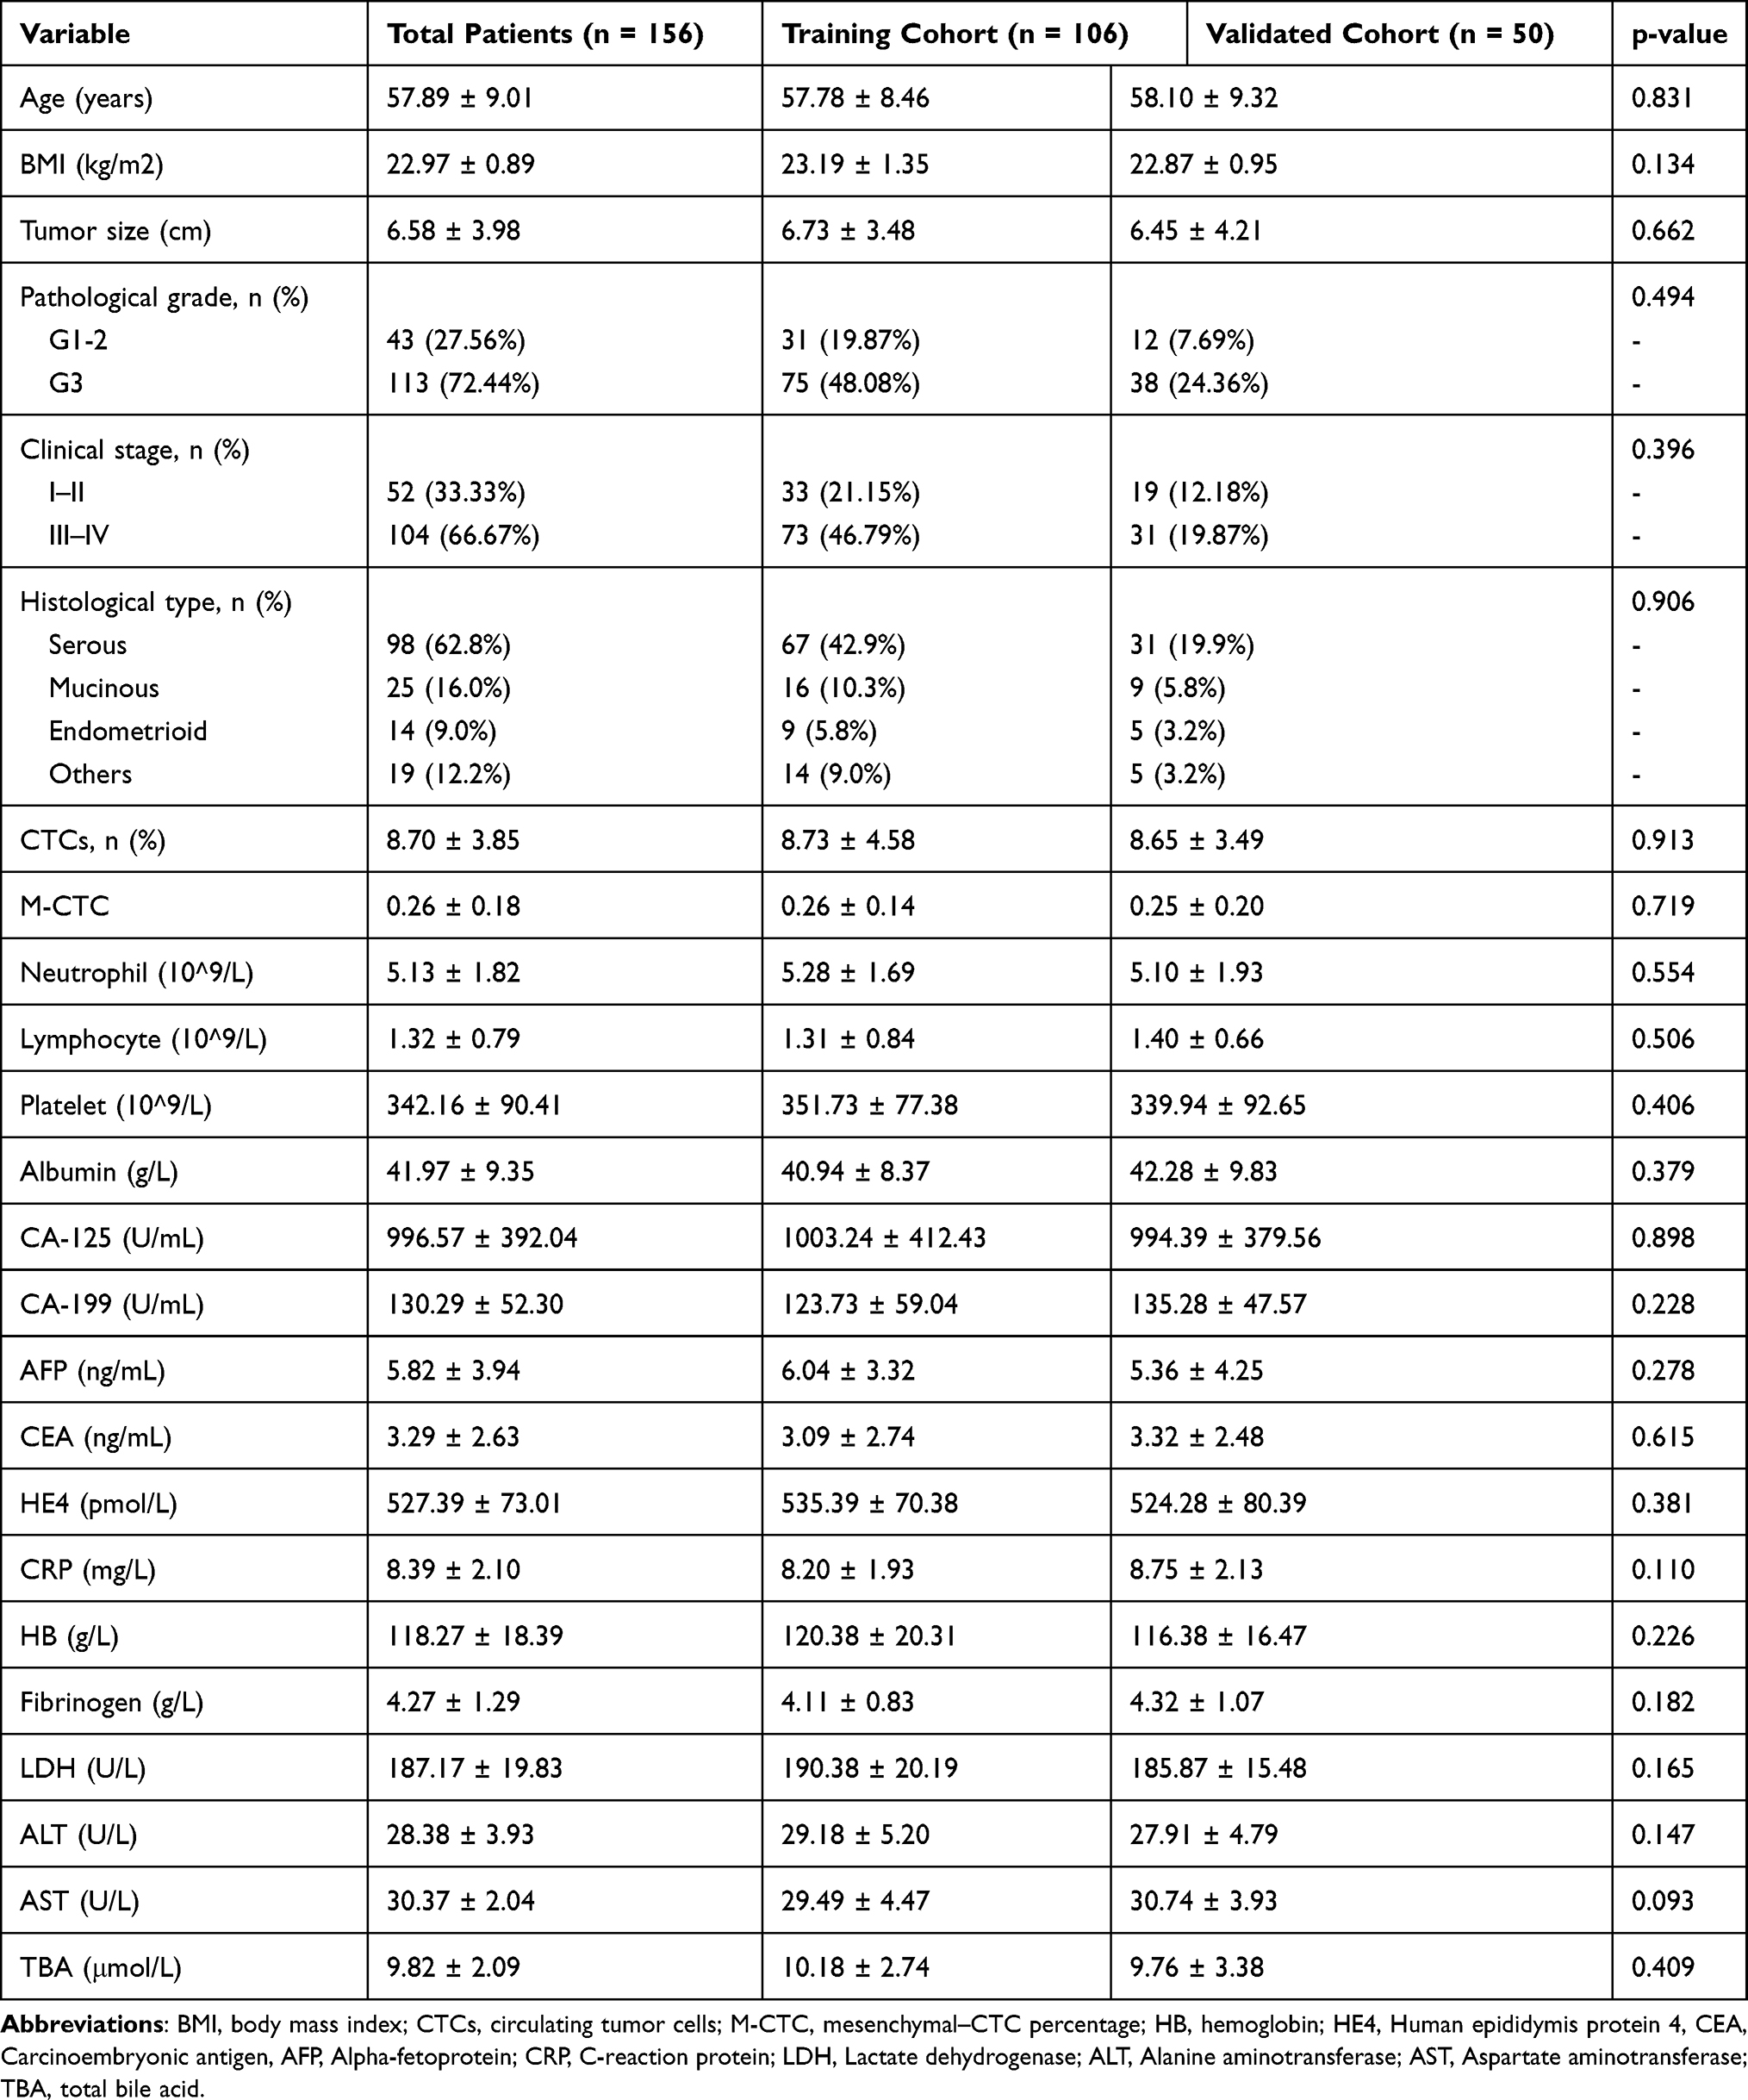 |
Table 1 Characteristics Between Patients in the Training Cohort and the Validated Cohort |
A receiver operating characteristic (ROC) curve analysis was used for assessment to identify the prognostic value of each machine learning classifier according to the area under the curve (AUC) and the Youden index. Kaplan–Meier survival curves were then generated, and prognostic differences were evaluated through a Log rank test. All statistical analyses were conducted by R software Version 4.0.2 (GUI 1.72 Catalina build) and graphed by Graph Prism Version 7.0a (GraphPad Software, San Diego, CA, USA). P < 0.05 was defined as statistically significant.
Results
Patient Characteristics
Baseline demographic and clinical characteristics of the training cohort (n = 106) and the validated cohort (n = 50) were assessed in Table 1. The patients with high pathological grades (G3) and those at an advanced clinical stage (FIGO stage III–IV) accounted for 113 (72.44%) and 104 (66.67%), respectively. There were 98 patients (62.8%) diagnosed with serous ovarian cancer. The mean value of CTC count and percentage were 8.70 ± 3.85 and 0.26 ± 0.18, respectively. All characteristics included were similar among the two groups with no significant differences (P < 0.05, Table 1). The median time of follow-up of patients was 33 months (range, 26–38 months).
According to the Youden index of the ROC curve, we divided patients into two CTC groups by setting the cut-off value at 5 counts (Figure 2A). Table 2 showed the baseline features of EOC patients grouped by CTC count. We found significant correlation of CTC count with clinical FIGO stage (P = 0.007), tumor size (P = 0.016), and CA-125 (P = 0.037) (Table 2). Patients in the high-CTC group (≥ 5 counts) had a higher FIGO stage. The mean CA-125 (± SD) values and tumor size in high-CTCs patients were 1013.01 ± 385.24 and 6.22 ± 1.09, significantly higher than 897.92 ± 293.59 and 5.72 ± 1.43 in low-CTCs patients. No significant differences among the two CTC groups were found for age, BMI index, tumor size, pathological grade, histological type, neutrophil, lymphocyte, platelet, albumin, CA-199, AFP, CEA, and HE4 (P ≥ 0.05).
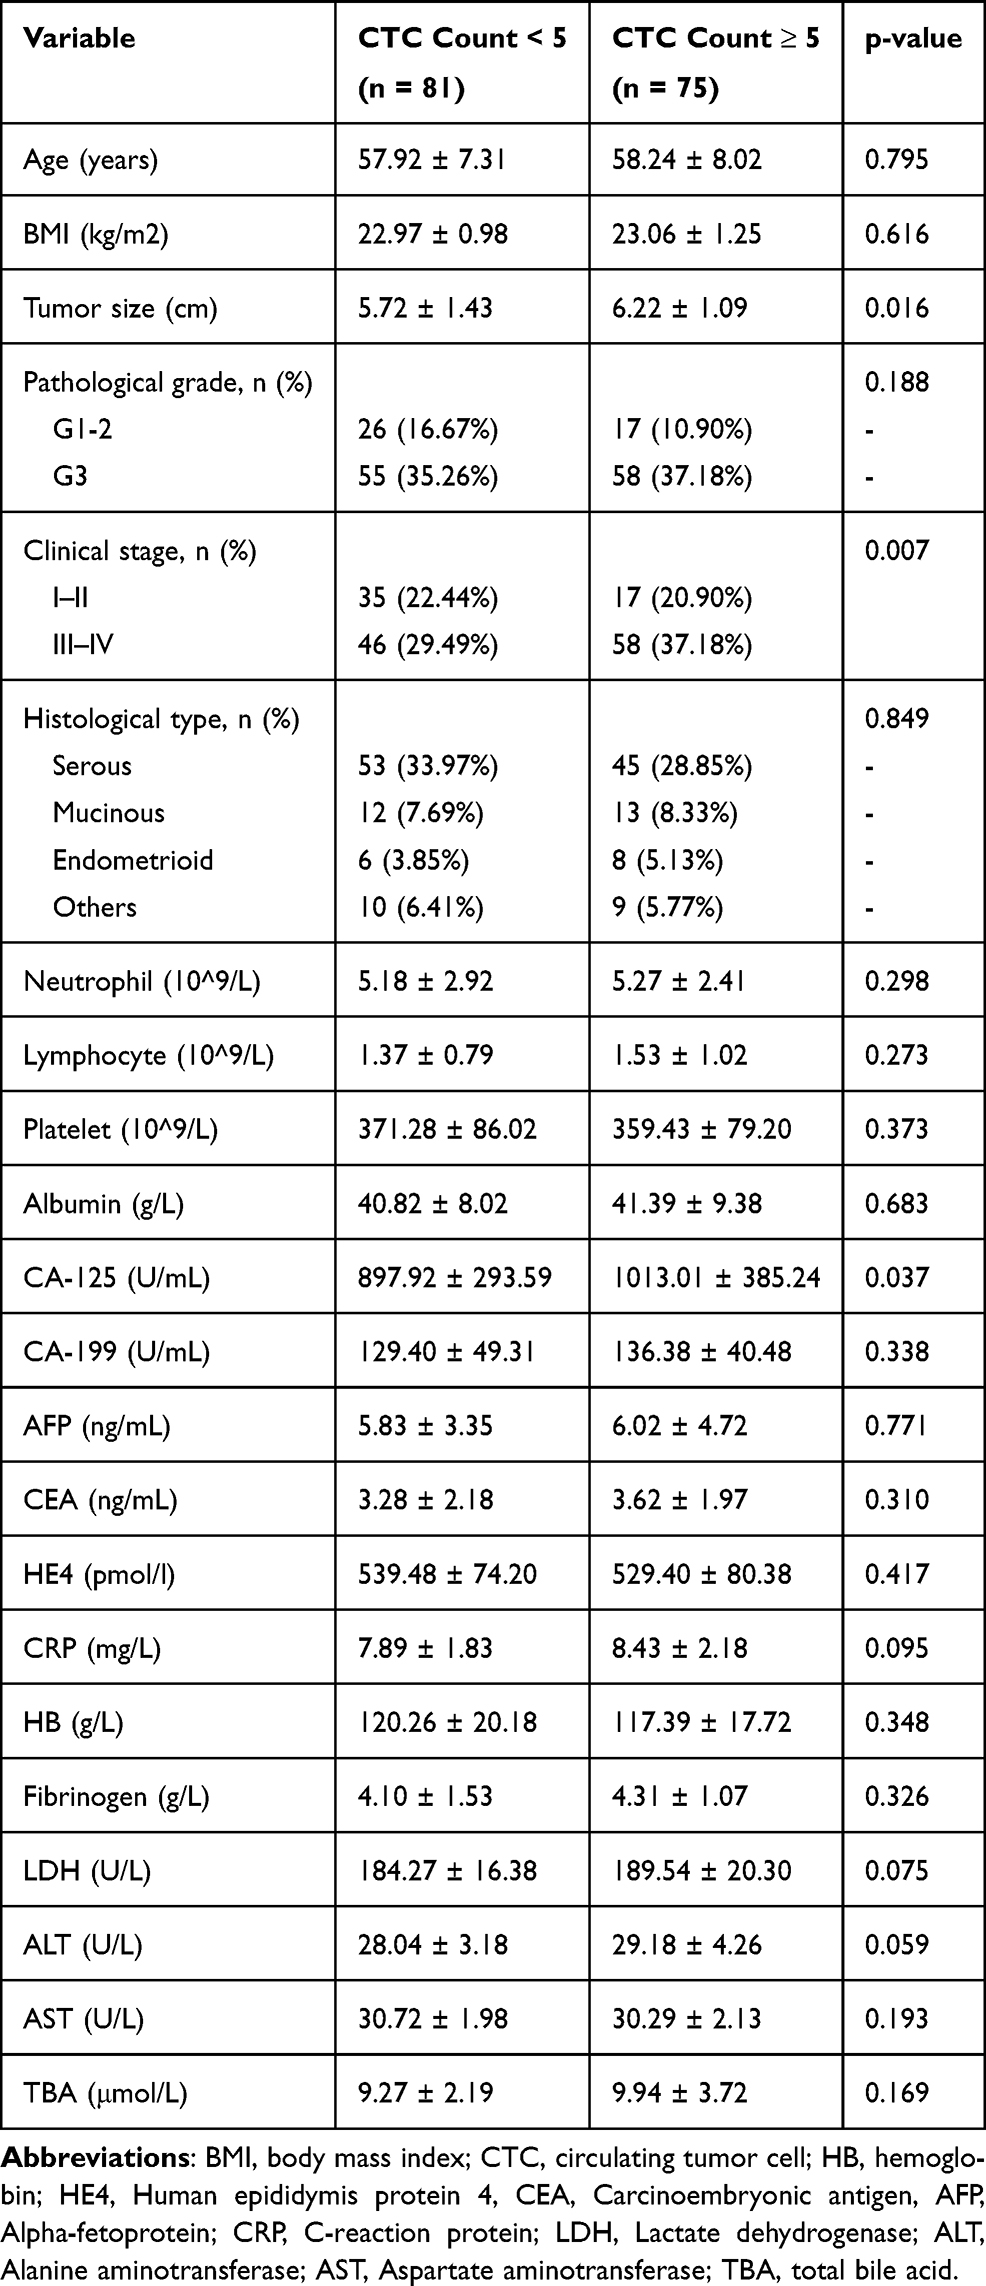 |
Table 2 Correlation Between Preoperative Circulating Tumor Cell (CTC) Count and Clinicopathological Features of Epithelial Ovarian Cancer Patients |
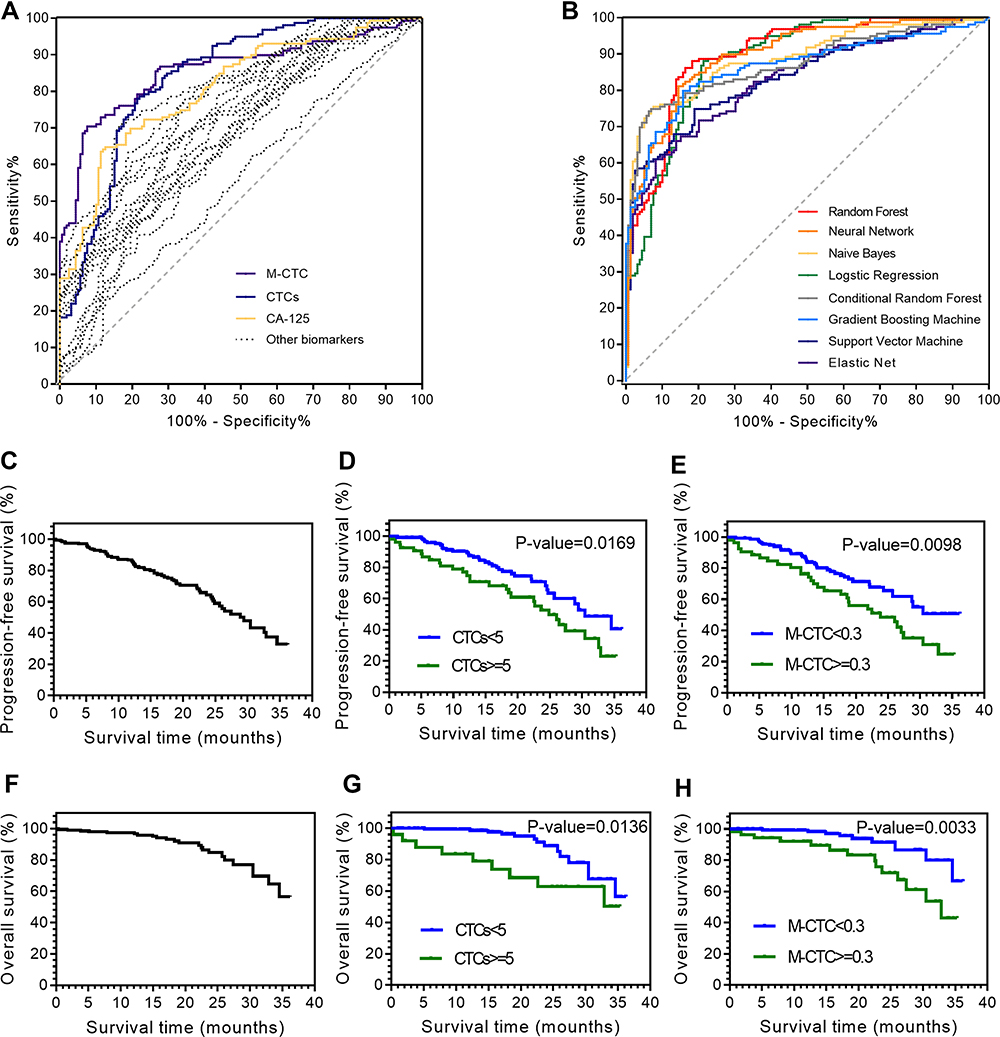 |
Figure 2 Differentiation of epithelial ovarian cancer (EOC) prognosis based on multiple preoperative blood biomarkers. (A) receiver operating characteristic (ROC) curves derived from logistic regression for single blood biomarkers. (B) the ROC curves derived from 8 supervised machine learning methods. The progression-free survival (PFS) analysis among (C) all patients; patients stratified by (D) circulating tumor cell (CTC) counts and (E) mesenchymal–CTC (M-CTC) percentage. The overall survival (OS) analysis among (F) all patients; patients stratified by (G) CTCs counts and (H) M-CTC percentage. |
CTCs and M-CTC as Prognosis Biomarkers
The normal logistic regression model based on univariable analysis of clinicopathologic parameters showed that age (HR, 1.28; 95% CI, 1.09–1.47; P = 0.033), tumor size (HR, 1.32; 95% CI, 1.10–1.79; P = 0.042), pathological grade (HR, 1.47; 95% CI, 1.23–1.64; P = 0.038), FIGO stage (HR, 2.11; 95% CI, 1.28–3.73; P = 0.009), CTCs counts (HR, 2.03; 95% CI, 1.64–4.04; P = 0.002), M-CTC percentage (HR, 1.74; 95% CI, 1.54–2.57; P = 0.005), albumin (HR, 0.84; 95% CI, 0.54–0.93; P = 0.016), CA-125 (HR, 1.43; 95% CI, 1.04–1.74; P = 0.029), CRP (HR, 1.47; 95% CI, 1.04–2.92; P = 0.037) and fibrinogen (HR, 1.58; 95% CI, 1.18–2.10; P = 0.041) were significant prognostic factors for survival (Table 3). Then, these selected indicators were included into the multivariable regression model, which demonstrated that pathological grade (HR, 1.38; 95% CI, 1.23–1.94; P = 0.042), FIGO stage (HR, 1.94; 95% CI, 1.26–3.73; P = 0.015), CTC count (HR, 1.95; 95% CI, 1.55–3.96; P = 0.007), M-CTC percentage (HR, 1.84; 95% CI, 1.48–2.64; P = 0.009), CA-125 (HR, 1.34; 95% CI, 1.03–1.84; P = 0.038) and CRP (HR, 1.36; 95% CI, 1.29–2.80; P = 0.041) were independent factors for EOC prognosis (Table 3).
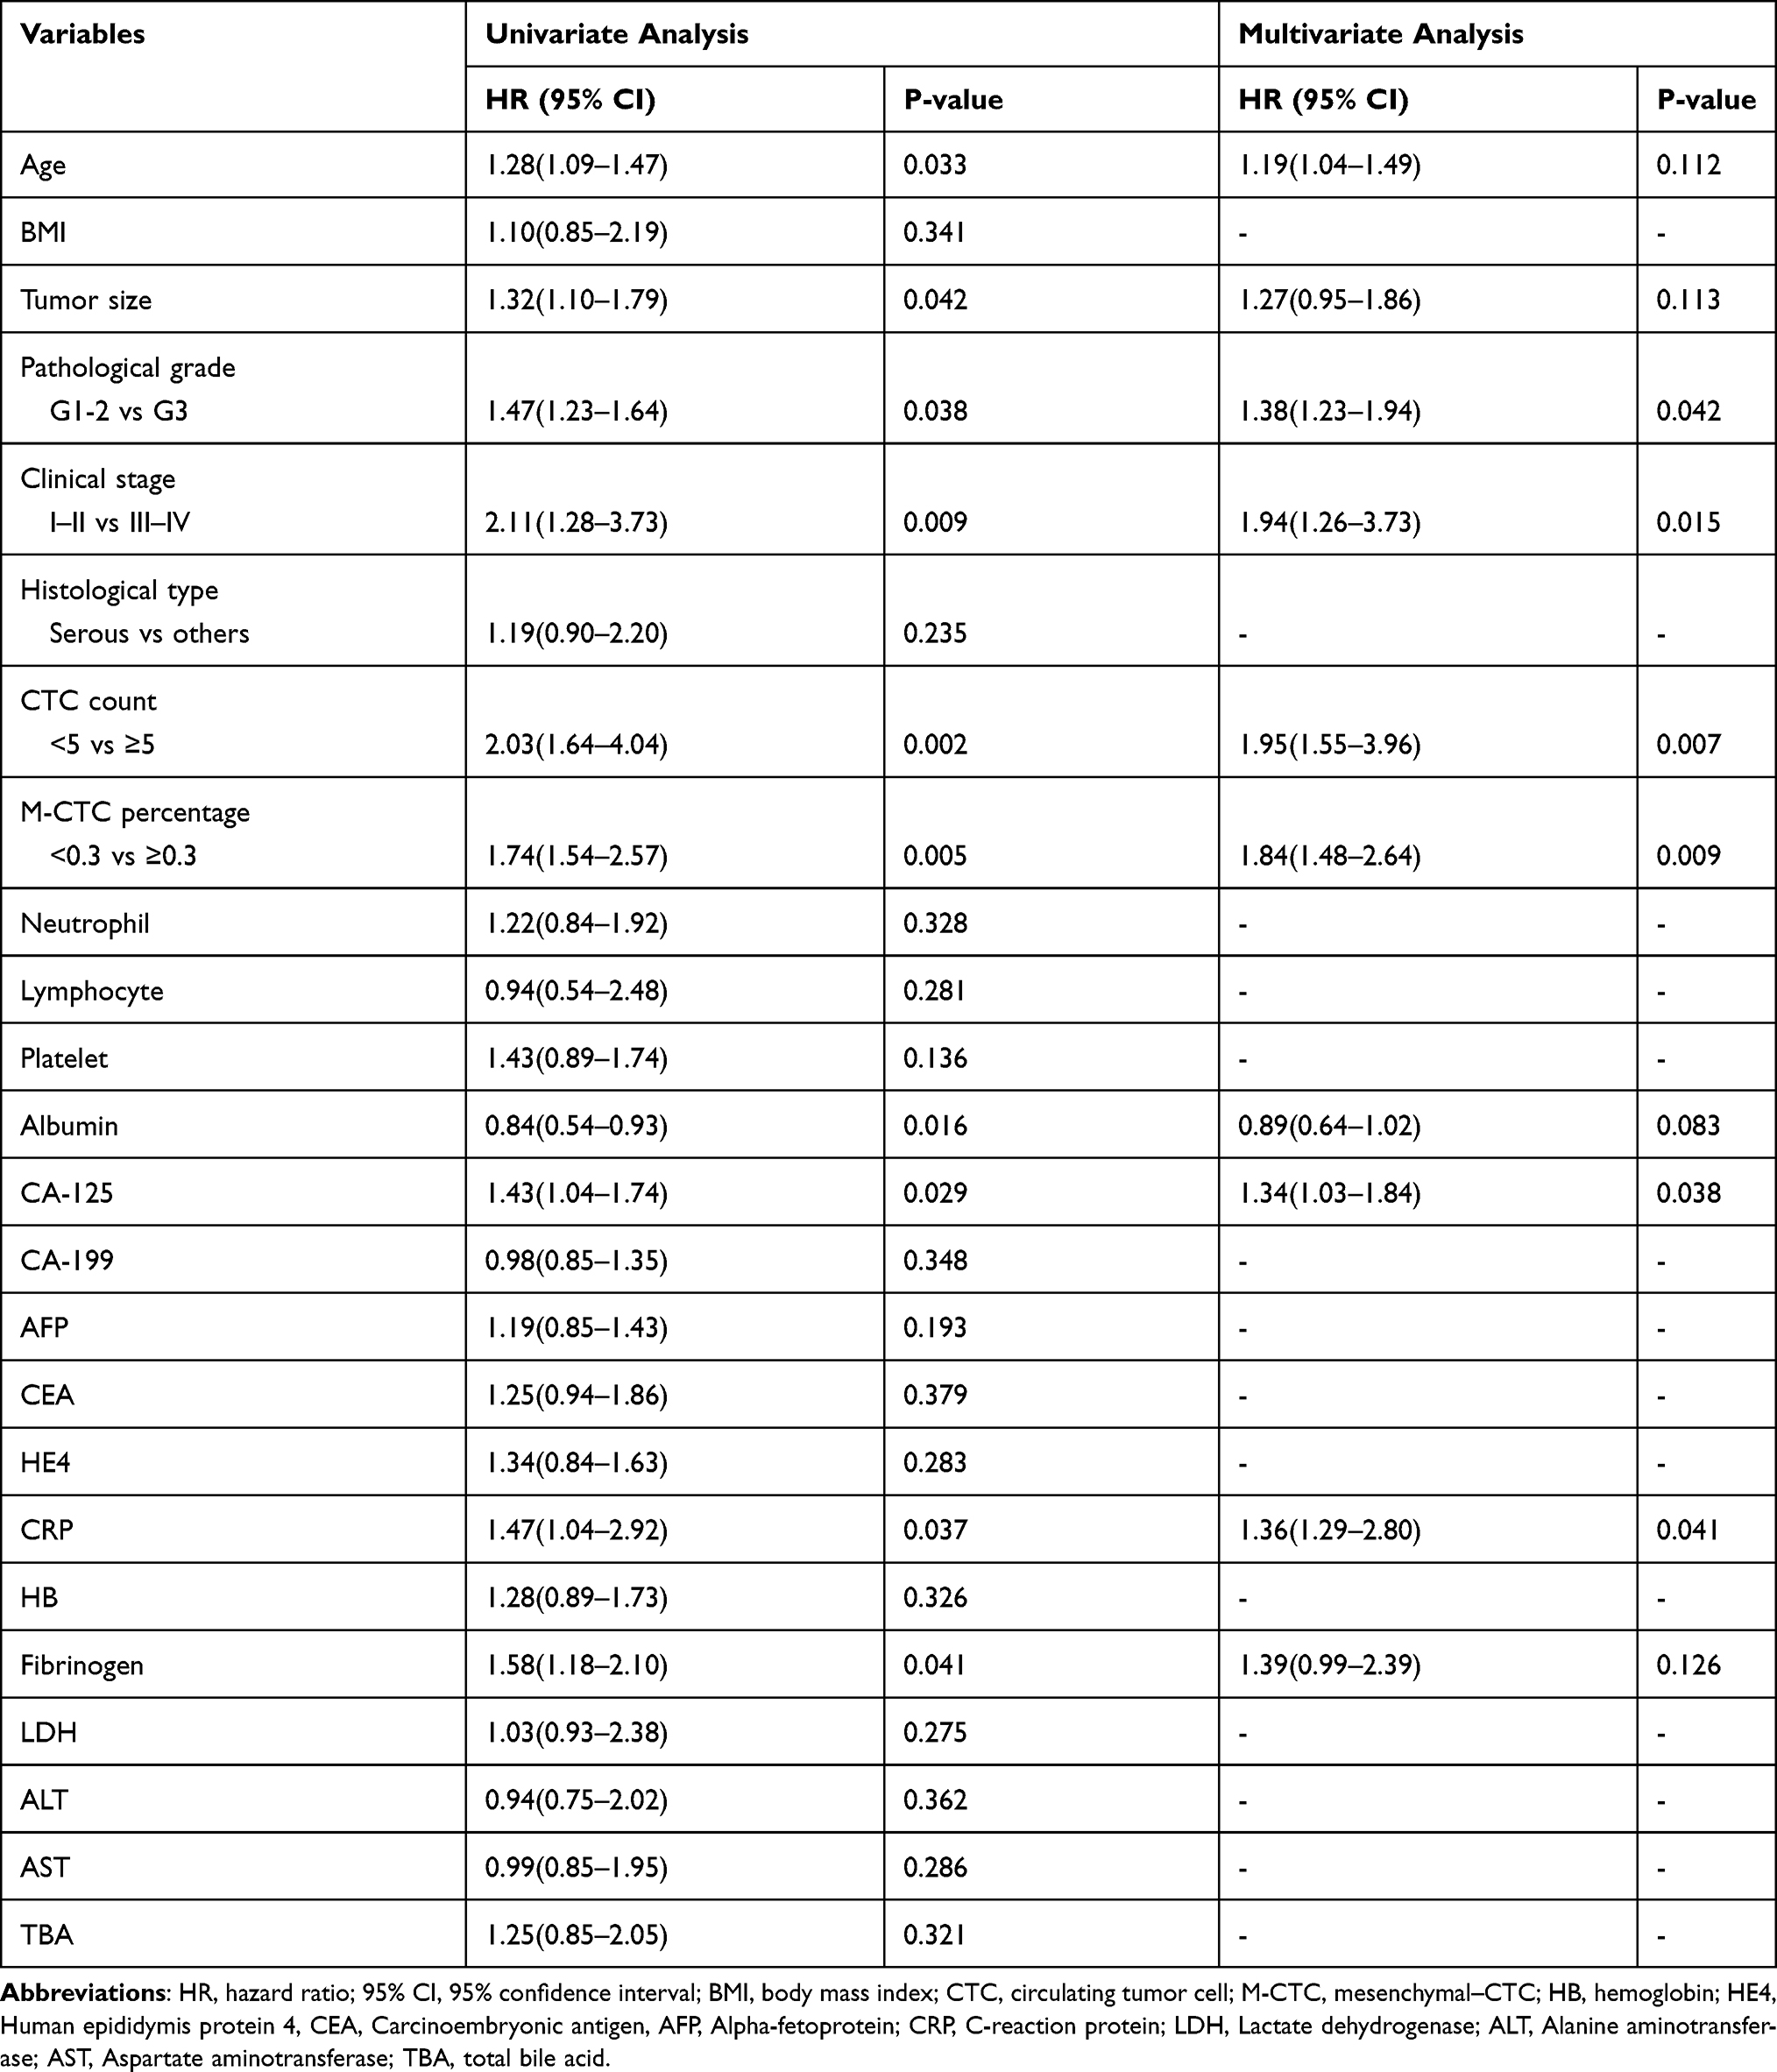 |
Table 3 Univariate and Multivariate Regression Analyses with Clinicopathologic Parameters for Epithelial Ovarian Cancer (EOC) Patient’s Prognosis |
In Figure 2A, we compared the univariable logistic regression analysis using each peripheral blood biomarker (dash line). The univariable regression analysis indicated that the CTCs counts (area under the ROC curve (AUC) = 0.841, p-value < 0.001) and M-CTC percentage (AUC = 0.859, p-value < 0.001) have better predictive value than other biomarkers, including CA-125 (AUC = 0.809, p-value = 0.003) (Figure 2A). The Youden Index evaluated that the cut-off value was 5 for CTCs and 0.3 for M-CTC, considered as thresholds for a positive test. Stepwise, the survival curves were graphed in Figure 2 for all EOC patients. The PFS survival curves were significantly different when stratified by CTC count (P = 0.0169, Figure 2D) and M-CTC percentage (P = 0.0098, Figure 2E). The OS survival curves also differed significantly when stratified by CTC counts (P = 0.0136, Figure 2G) and M-CTC percentage (P = 0.0033, Figure 2H).
The training dataset was then used to predict EOC using machine learning methods in Figure 2B. The values for AUC and the highest accuracy of the prediction were 0.892 and 85.9% for multiple logistic analysis. For other machine learning models, the AUC were 0.961 for RF, 0.948 for GBM, 0.933 for CRF, 0.930 for NN, 0.926 for NB, 0.899 for SVM, and 0.869 for EN, respectively. The results reveal that supervised machine learning classifies, especially the RF analysis (AUC 0.961, 95% CI 0.928–0.994), could predict more accurately than the conventional logistic regression analysis, which had an AUC of 0.892 (95% CI 0.869–0.941). So, the RF algorithm was used in the subsequent analysis to replace the conditional logistic regression model.
Prediction of FIGO Clinical Stages of EOC Patients with the RF Classifier
Through the RF classifier based on circulating biomarkers, we tended to predict clinical stages of EOC preoperatively. Using the RF model to predict the FIGO stage, we found that the AUC value of the ROC curve was 0.796 (95% CI, 0.727–0.866) and 0.743 (95% CI, 0.688–0.798), based on biomarkers with and without CTCs, respectively (Figure 3A). The results also indicated that CTC count, CRP, and M-CTC percentage are essential parameters for predicting the clinical stage of EOC, rather than traditional tumor markers such as CA-125, HE4, and CA-199, according to the variable importance measured by mean decrease in the Gini index (Figure 3B). As shown in Figure 3C, as the clinical stage progressed, CTC count, CRP, M-CTC, CA-125, HE4, and neutrophil also increased, whereas others, including albumin and lymphocyte decreased.
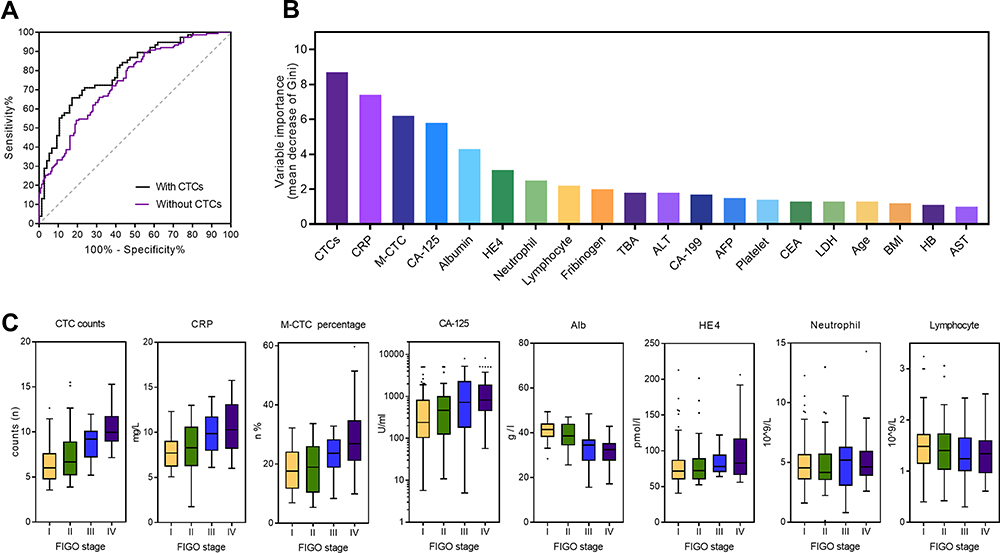 |
Figure 3 Prediction of clinical stages of epithelial ovarian cancer (EOC) with Random Forest (RF) classifier. (A) Receiver operating characteristic (ROC) curve for RF prediction of clinical stage based on circulating biomarkers with/without CTCs. (B) Variable importance for RF prediction of clinical stages measured by mean decrease in Gini index. (C) The box plot show distribution of the top eight important blood markers for RF prediction of clinical stages. Abbreviations: AUC, the area under the curve; BMI, body mass index; CTC, circulating tumor cell; M-CTC, mesenchymal–CTC; HB, hemoglobin; HE4, Human epididymis protein 4, CEA, Carcinoembryonic antigen, AFP, Alpha-fetoprotein; CRP, C-reaction protein; LDH, Lactate dehydrogenase; ALT, Alanine aminotransferase; AST, Aspartate aminotransferase; TBA, total bile acid; FIGO, the International Federation of Obstetrics and Gynecology Association staging system. |
Prediction of Platinum-Resistance of EOC with the RF Classifier
Based on the biomarkers, we then attempted to predict platinum-resistance preoperatively. Using the RF model to predict platinum-resistance, we found that the AUC value of the ROC curve was 0.809 (95% CI, 0.742–0.876) and 0.759 (95% CI, 0.705–0.813), based on biomarkers with and without CTCs, respectively (Figure 4A). The relative variable importance for segregating platinum-resistant patients from others was calculated by a predictive RF classifier (Figure 4B). We identified the top eight factors, including M-CTC percentage, fibrinogen, carbohydrate antigen-125 (CA-125), CTCs count, albumin, lymphocyte, C-reactive protein (CRP), and neutrophils as predictors for distinguishing patients with platinum-resistance through the RF algorithm. Box plots that present the distribution of each selected variable between platinum-resistant and platinum-sensitive patients were shown in Figure 4C. Platinum-resistant patients tended to with higher M-CTC, fibrinogen, CA-125, CTCs, CRP, and neutrophils, but lower albumin and lymphocyte.
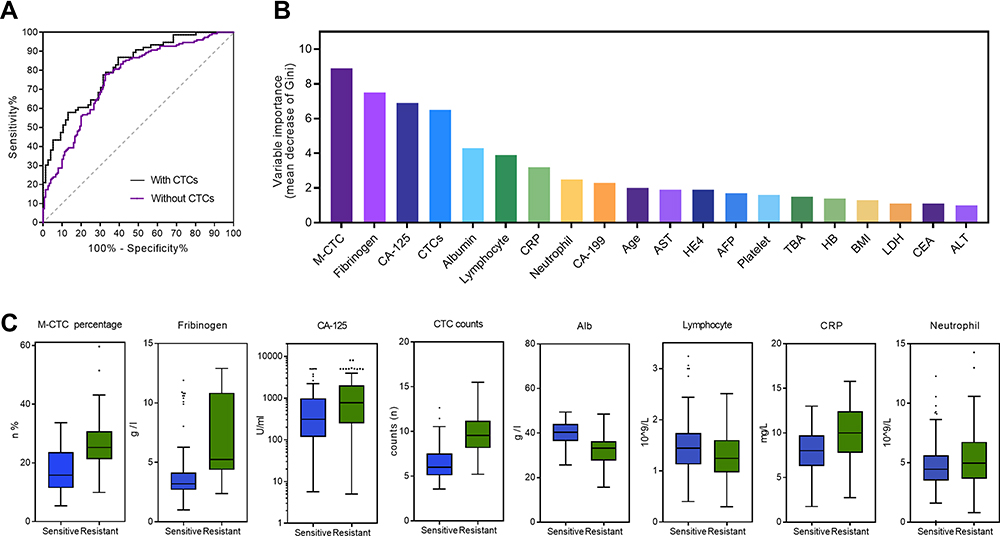 |
Figure 4 Prediction of platinum-resistance of epithelial ovarian cancer (EOC) with the Random Forest (RF) classifier. (A) The receiver operating characteristic (ROC) curve for RF prediction of platinum-resistance based on circulating biomarkers with/without CTCs. (B) Variable importance for RF prediction of platinum-resistance measured by mean decrease in the Gini index. (C) The box plot shows the distribution of the top eight important blood markers for RF prediction of platinum-resistance. Abbreviations: AUC, the area under the curve; BMI, body mass index; CTC, circulating tumor cell; M-CTC, mesenchymal–CTC; HB, hemoglobin; HE4, Human epididymis protein 4, CEA, Carcinoembryonic antigen, AFP, Alpha-fetoprotein; CRP, C-reaction protein; LDH, Lactate dehydrogenase; ALT, Alanine aminotransferase; AST, Aspartate aminotransferase; TBA, total bile acid. |
Unsupervised Clustering Analysis for EOC Prognosis with the RF Classifier
In addition, we performed unsupervised clustering analysis with the RF algorithm to classify patients into two clusters, based on preoperative blood markers for EOC prognosis. For the progression-free survival (PFS) rate, the two clusters showed significant differences among all the patients (Figure 5A, P = 0.0007). Taking clinical stage into separation, patients had the log-rank p-value of 0.1608 (Figure 5B, HR, 2.465; 95% CI, 0.540–11.260) for the early-stage and 0.0018 (Figure 5C, HR, 2.716; 95% CI, 1.602–4.605) for the advanced-stage. Moreover, we found a statistically significant difference between two clusters on the OS (overall survival) rate in all the patients (Figure 5D, P = 0.0021) and those at an advanced stage (Figure 5E, P = 0.0037). In contrast, the early-stage patients had no significant difference (Figure 5F, P = 0.0869). The multiple blood markers, including M-CTC, CTC count, CRP, Fibrinogen, CA-125, albumin, lymphocyte, and neutrophils were significantly different among advanced-stage cases in the two clusters (Figure 5G).
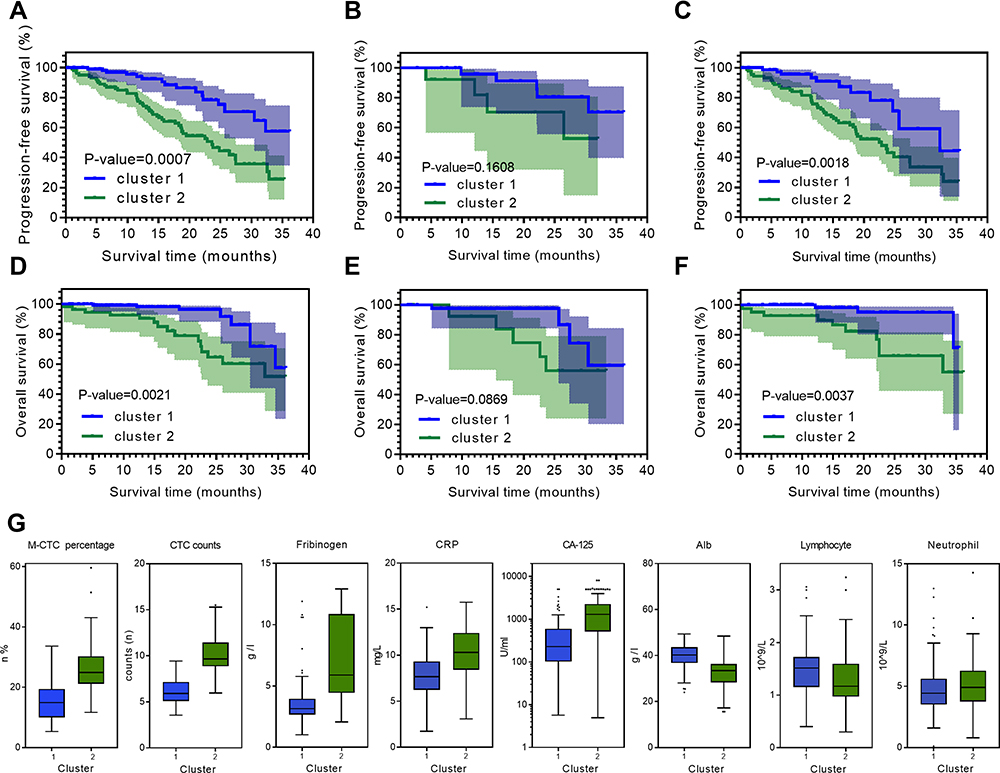 |
Figure 5 Unsupervised machine learning clustering associated with EOC prognosis. EOC patients were clustered into two groups by the unsupervised clustering analysis with RF classifier. Kaplan–Meier curves indicating progression-free survival (PFS) of each cluster in (A) all EOC patients, (B) early clinical stage group, and (C) advanced clinical stage group. Kaplan–Meier curves indicating overall survival (OS) of each cluster in (D) all EOC patients, (E) early clinical stage group, and (F) advanced clinical stage group. (G) Box plots showed the distribution of the top eight peripheral blood biomarkers between two clusters. Abbreviations: CTC, circulating tumor cell; M-CTC, mesenchymal–CTC; CRP, C-reaction protein. |
Discussion
In the present study, we developed and validated a prognosis model for EOC based on blood biomarkers, including CTCs. To the best of our knowledge, this is the very first study to combine the advanced CTC CanPatrol technique together with the machine learning techniques for risk stratification among ovarian cancer patients. Our results showed that CTC count, M-CTC percentage, together with other blood biomarkers, could provide significantly great prediction values for clinical stages, platinum-resistance, and survival by machine learning approaches, especially the RF Classifier. The machine learning model could facilitate the selection of treatment strategies in precision medicine.
A previous study from Enshaei et al constructed a risk stratification model, based on clinical variables including age, clinical stage, histopathology grade, and CA-125 level. They demonstrated that the neural network (NN) algorithm was capable of predicting OC survival with high accuracy (93%) and an AUC of 0.74, outperforming the traditional logistic regression.22 In our study, the multivariable regression model showed that besides normal factors, including pathological grade (HR 1.38; P = 0.042), FIGO stage (HR 1.94; P = 0.015), CA-125 (HR 1.34; P = 0.038) and CRP (HR 1.36; P = 0.041), CTC count (HR 1.95; P = 0.007) and M-CTC percentage (HR 1.84; P = 0.009) were also independent factors for EOC prognosis.
Stepwise, we further revealed the association of pre-operation biomarkers with important EOC features, which may facilitate the risk stratification of patients through supervised machine learning models. Machine learning techniques have been widely accepted in various cancer studies for both diagnostic and prognostic assessment.22,23 This cutting-edge approach was able to illustrate embedded patterns within data and discover the underlying mechanism between biomarkers and cancer progression.24 However, the machine learning algorithm that may provide the promising pre-operation predictive potential for blood biomarkers, including CTCs is poorly understood in the EOC domain. We conducted the comparison among various supervised algorithms and identified the RF classifier as the best approach with a good predictive performance (AUC 0.961, 95% CI 0.928–0.994), which is consistent with the results of a recent study.25 The RF classifier consists of decision trees based on the bagging and random feature selection technique. By considering interactions among variables, the RF classifier could stratify samples and avoid overfitting.26
Ovarian cancer has various heterogeneous features, including clinical stages and histological types with different grades. So, we investigated and found that unsupervised RF clustering analysis was able to segregate EOC clusters, which were associated with clinical stages and survival. We found that the RF classifier could predict several clinical characteristics based on pre-operation blood biomarkers with a promising AUC of 0.796 (95% CI, 0.727–0.866) for the clinical stage and 0.809 (95% CI, 0.742–0.876) for platinum-resistance, which was not very significant. However, a recent research from Kawakami et al25 also developed an ovarian cancer-specific predictive framework for clinical stage using machine learning methods based on multiple biomarkers, though without CTCs. They indicated that the AUC for predicting clinical stages with RF model was 0.760, which is even lower than our findings. The relatively low significance was partly due to limited sample size of 156 patients, thus future studies of large database are of great urgency to develop promising models.
Moreover, the subgroup unsupervised machine learning approach revealed that two clusters in advanced-stage EOC were significantly associated with PFS (P = 0.002) and OS (P = 0.004). In previous studies, blood biomarkers including indicators of systemic inflammatory response had prognostic relevance in patients with EOC. A recent meta-analysis involving 2919 patients showed that elevated neutrophil-to-lymphocyte ratio is significantly associated with disease progression and EOC patients’ survival.27 Inflammatory indicators may promote tumor progression by producing cytokines (including VEGF, interleukin, and tumor necrosis factor-α, etc.), which play a vital role in the tumor microenvironment.28 In addition, coagulation factors could also stimulate cancer proliferation and angiogenesis by interaction with VEGF and fibroblast growth factor-2 (FGF-2).29 Studies reported that elevated levels of pre-operation plasma fibrinogen, CRP, and albumin were useful in predicting unfavorable EOC prognosis,30,31 which is consistent with our results.
Apart from the inflammatory and coagulation-related biomarkers, we revealed that CTC count was also an independent prognosis factor for ovarian cancer prognosis with the AUC value of 0.841 (95% CI, 0. 802–0.880). Among the “liquid biopsy” alternatives for the prognosis of solid carcinomas, CTCs have shown great potential in prostate cancer, breast cancer, and hepatocellular cancer.32–34 However, whether CTCs characteristics were associated with prognosis still remains controversial in EOC.35 Poveda et al36 concluded that elevated CTCs detected through the CellSearch system were an independent risk factor for ovarian cancer prognosis, which supported our findings. In this study, we used the updated CanPatrol CTC-enrichment technique with high sensitivity, which uses the filter-based separation method to reduce CTC loss caused by centrifugation.37
Moreover, recent researches indicated that CTCs could disseminate to distant sites by epithelial-mesenchymal transition (EMT) that could help them change phenotype and penetrate blood vessels.38 Therefore, we classified CTCs into three subtypes: epithelial, epithelial/mesenchymal hybrids, and mesenchymal through the advanced CanPatrol CTC-enrichment technique. We demonstrated that M-CTC percentage had great prediction value for ovarian cancer prognosis, with the AUC value of 0.859 (95% CI, 0.818–0.903). Consistent with our findings, a previous study also indicated the prognosis value of both M-CTC percentage (AUC 0.74; 95% CI 0.64–0.84) and CTCs (AUC 0.75; 95% CI 0.66–0.84) in hepatocellular carcinoma.18 In ovarian cancer, researchers indicated that tumor cells underwent EMT process showed cancer stem cell (CSC) features and could drive tumor growth in vivo,39 which might partly explain the significant association between high M-CTC percentage and poor prognosis.
However, there were some limitations of this study. Firstly, this prospective study involved a relatively small sample size of 156 patients within a single institution, which might cause selection bias and limited accuracy in our results. To solve this problem, future carrying out multi-center studies with larger sample sizes and more input variables is important. Secondly, detection efficiency might be biased since the CanPatrol system is a filtration-based system, allowing small CTCs to cross the barrier easily. Thus, other CTC collection techniques might also be used to improve detection efficiency in future studies. Finally, in this research, we aimed at developing a pre-operation machine learning model based on multiple blood biomarkers, so as to facilitate personalized treatment options before primary therapeutic approach, in the realm precision medicine. However, in order to realize dynamic tumor monitor, future studies are still needed to construct prediction models, especially based on biomarkers collected periodically, including pre-chemotherapy.
In conclusion, we developed a serum-based CTCs model through machine learning techniques for the prognosis of ovarian cancer that could address the mentioned concerns and demonstrate the clinical significance of this diagnostic technique. Through the newly developed machine learning model, we may facilitate a personalized treatment before the primary therapeutic approach in nearly future.
Data Sharing Statement
The data of these findings cannot be shared at this time as the data also forms part of an ongoing study. However, requests for data will be considered by the corresponding author after publication of the study.
Ethics Approval and Informed Consent
This study was approved by the Ethics Committee of Renji Hospital Affiliated to Shanghai Jiao Tong University School of Medicine. We conducted the research in accordance with the Declaration of Helsinki. All participants were informed about the purpose of the trial and signed consent forms for the usage of their information.
Funding
This work was supported by the Three-Year Action Plan of the Program of Shanghai Hospital Development Center for Promoting Clinical Skills and Innovative Ability of Municipal Hospitals (16CR2012A) and the National Natural Science Foundation of China (Grant No. 81572560 and Grant No. 82072866).
Disclosure
The authors declare no potential conflicts of interest.
References
1. Siegel RL, Miller KD, Jemal A. Cancer statistics, 2020. CA Cancer J Clin. 2020;70(1):7–30. doi:10.3322/caac.21590
2. Chen W, Zheng R, Baade PD, et al. Cancer statistics in China, 2015. CA Cancer J Clin. 2016;66(2):115–132. doi:10.3322/caac.21338
3. Jacobs IJ, Menon U, Ryan A, et al. Ovarian cancer screening and mortality in the UK Collaborative Trial of Ovarian Cancer Screening (UKCTOCS): a randomised controlled trial. Lancet. 2016;387(10022):945–956. doi:10.1016/S0140-6736(15)01224-6
4. Du Bois A, Reuss A, Pujade-Lauraine E, et al. Role of surgical outcome as prognostic factor in advanced epithelial ovarian cancer: a combined exploratory analysis of 3 prospectively randomized Phase 3 multicenter trials: by the Arbeitsgemeinschaft Gynaekologische Onkologie Studiengruppe Ovarialkarzinom (AGO-OVAR) and the Groupe d’Investigateurs Nationaux Pour les Etudes des Cancers de l’Ovaire (GINECO). Cancer. 2009;115(6):1234–1244. doi:10.1002/cncr.24149
5. Wimberger P, Wehling M, Lehmann N, et al. Influence of residual tumor on outcome in ovarian cancer patients with FIGO stage IV disease: an exploratory analysis of the AGO-OVAR (Arbeitsgemeinschaft Gynaekologische Onkologie Ovarian Cancer Study Group). Ann Surg Oncol. 2010;17(6):1642–1648. doi:10.1245/s10434-010-0964-9
6. Cotte E, Glehen O, Mohamed F, et al. Cytoreductive surgery and intraperitoneal chemo-hyperthermia for chemo-resistant and recurrent advanced epithelial ovarian cancer: prospective study of 81 patients. World J Surg. 2007;31(9):1813–1820. doi:10.1007/s00268-007-9146-8
7. Narod S. Can advanced-stage ovarian cancer be cured? Nat Rev Clin Oncol. 2016;13(4):255–261. doi:10.1038/nrclinonc.2015.224
8. Kang J, D’Andrea AD, Kozono D. A DNA repair pathway-focused score for prediction of outcomes in ovarian cancer treated with platinum-based chemotherapy. J Natl Cancer Inst. 2012;104(9):670–681. doi:10.1093/jnci/djs177
9. Chen HY, Yu SL, Chen CH, et al. A five-gene signature and clinical outcome in non-small-cell lung cancer. N Engl J Med. 2007;356(1):11–20. doi:10.1056/NEJMoa060096
10. Aktas B, Kasimir-Bauer S, Heubner M, Kimmig R, Wimberger P. Molecular profiling and prognostic relevance of circulating tumor cells in the blood of ovarian cancer patients at primary diagnosis and after platinum-based chemotherapy. Int J Gynecol Cancer. 2011;21(5):822–830. doi:10.1097/IGC.0b013e318216cb91
11. Kourou K, Exarchos TP, Exarchos KP, Karamouzis MV, Fotiadis DI. Machine learning applications in cancer prognosis and prediction. Comput Struct Biotechnol J. 2015;13:8–17. doi:10.1016/j.csbj.2014.11.005
12. Lu M, Fan Z, Xu B, et al. Using machine learning to predict ovarian cancer. Int J Med Inform. 2020;141:104195. doi:10.1016/j.ijmedinf.2020.104195
13. Barber EL, Garg R, Persenaire C, Simon M. Natural language processing with machine learning to predict outcomes after ovarian cancer surgery. Gynecol Oncol. 2021;160(1):182–186. doi:10.1016/j.ygyno.2020.10.004
14. Adamson AS, Welch HG. Machine learning and the cancer-diagnosis problem - no gold standard. N Engl J Med. 2019;381(24):2285–2287. doi:10.1056/NEJMp1907407
15. Strobl C, Boulesteix AL, Kneib T, Augustin T, Zeileis A. Conditional variable importance for random forests. BMC Bioinform. 2008;9:307. doi:10.1186/1471-2105-9-307
16. McGee J, Bookman M, Harter P, et al. Fifth Ovarian Cancer Consensus Conference: individualized therapy and patient factors. Ann Oncol. 28(4):702–710. doi:10.1093/annonc/mdx010
17. Stuart GC, Kitchener H, Bacon M, et al. 2010 Gynecologic Cancer InterGroup (GCIG) consensus statement on clinical trials in ovarian cancer: report from the Fourth Ovarian Cancer Consensus Conference. Int J Gynecol Cancer. 2011;21(4):750–755. doi:10.1097/IGC.0b013e31821b2568
18. Qi LN, Xiang BD, Wu FX, et al. Circulating tumor cells undergoing EMT provide a metric for diagnosis and prognosis of patients with hepatocellular Carcinoma. Cancer Res. 2018;78(16):4731–4744. doi:10.1158/0008-5472.CAN-17-2459
19. Wu S, Liu S, Liu Z, et al. Classification of circulating tumor cells by epithelial-mesenchymal transition markers. PLoS One. 2015;10(4):e0123976. doi:10.1371/journal.pone.0123976
20. Liu YK, Hu BS, Li ZL, He X, Li Y, Lu LG. An improved strategy to detect the epithelial-mesenchymal transition process in circulating tumor cells in hepatocellular carcinoma patients. Hepatol Int. 2016;10(4):640–646. doi:10.1007/s12072-016-9732-7
21. Adams DL, Alpaugh RK, Tsai S, Tang CM, Stefansson S. Multi-Phenotypic subtyping of circulating tumor cells using sequential fluorescent quenching and restaining. Sci Rep. 2016;6:33488. doi:10.1038/srep33488
22. Ming C, Viassolo V, Probst-Hensch N, Chappuis PO, Dinov ID, Katapodi MC. Machine learning techniques for personalized breast cancer risk prediction: comparison with the BCRAT and BOADICEA models. Breast Cancer Res. 2019;21(1):75. doi:10.1186/s13058-019-1158-4
23. Parikh RB, Manz C, Chivers C, et al. Machine learning approaches to predict 6-month mortality among patients with cancer. JAMA Netw Open. 2019;2(10):e1915997. doi:10.1001/jamanetworkopen.2019.15997
24. Deo RC. Machine learning in medicine. Circulation. 2015;132(20):1920–1930. doi:10.1161/CIRCULATIONAHA.115.001593
25. Kawakami E, Tabata J, Yanaihara N, et al. Application of artificial intelligence for preoperative diagnostic and prognostic prediction in epithelial ovarian cancer based on blood biomarkers. Clin Cancer Res. 2019;25(10):3006–3015. doi:10.1158/1078-0432.CCR-18-3378
26. Bini SA. Artificial intelligence, machine learning, deep learning, and cognitive computing: what do these terms mean and how will they impact health care? J Arthroplasty. 2018;33(8):2358–2361. doi:10.1016/j.arth.2018.02.067
27. Zhu Y, Zhou S, Liu Y, Zhai L, Sun X. Prognostic value of systemic inflammatory markers in ovarian Cancer: a PRISMA-compliant meta-analysis and systematic review. BMC Cancer. 2018;18(1):443. doi:10.1186/s12885-018-4318-5
28. Matassa DS, Amoroso MR, Lu H, et al. Oxidative metabolism drives inflammation-induced platinum resistance in human ovarian cancer. Cell Death Differ. 2016;23(9):1542–1554. doi:10.1038/cdd.2016.39
29. Sahni A, Simpson-Haidaris PJ, Sahni SK, Vaday GG, Francis CW. Fibrinogen synthesized by cancer cells augments the proliferative effect of fibroblast growth factor-2 (FGF-2). J Thromb Haemost. 2008;6(1):176–183. doi:10.1111/j.1538-7836.2007.02808.x
30. Allensworth SK, Langstraat CL, Martin JR, et al. Evaluating the prognostic significance of preoperative thrombocytosis in epithelial ovarian cancer. Gynecol Oncol. 2013;130(3):499–504. doi:10.1016/j.ygyno.2013.05.038
31. Nie D, Gong H, Mao X, Li Z. Systemic immune-inflammation index predicts prognosis in patients with epithelial ovarian cancer: a retrospective study. Gynecol Oncol. 2019;152(2):259–264. doi:10.1016/j.ygyno.2018.11.034
32. Budd GT, Cristofanilli M, Ellis MJ, et al. Circulating tumor cells versus imaging–predicting overall survival in metastatic breast cancer. Clin Cancer Res. 2006;12(21):6403–6409. doi:10.1158/1078-0432.CCR-05-1769
33. Hayes DF, Cristofanilli M, Budd GT, et al. Circulating tumor cells at each follow-up time point during therapy of metastatic breast cancer patients predict progression-free and overall survival. Clin Cancer Res. 2006;12(14 Pt 1):4218–4224. doi:10.1158/1078-0432.CCR-05-2821
34. Scher HI, Jia X, de Bono JS, et al. Circulating tumour cells as prognostic markers in progressive, castration-resistant prostate cancer: a reanalysis of IMMC38 trial data. Lancet Oncol. 2009;10(3):233–239. doi:10.1016/S1470-2045(08)70340-1
35. Fan T, Zhao Q, Chen JJ, Chen WT, Pearl ML. Clinical significance of circulating tumor cells detected by an invasion assay in peripheral blood of patients with ovarian cancer. Gynecol Oncol. 2009;112(1):185–191. doi:10.1016/j.ygyno.2008.09.021
36. Poveda A, Kaye SB, McCormack R, et al. Circulating tumor cells predict progression free survival and overall survival in patients with relapsed/recurrent advanced ovarian cancer. Gynecol Oncol. 2011;122(3):567–572. doi:10.1016/j.ygyno.2011.05.028
37. Guo W, Yang XR, Sun YF, et al. Clinical significance of EpCAM mRNA-positive circulating tumor cells in hepatocellular carcinoma by an optimized negative enrichment and qRT-PCR-based platform. Clin Cancer Res. 2014;20(18):4794–4805. doi:10.1158/1078-0432.CCR-14-0251
38. Dongre A, Weinberg RA. New insights into the mechanisms of epithelial-mesenchymal transition and implications for cancer. Nat Rev Mol Cell Biol. 2019;20(2):69–84. doi:10.1038/s41580-018-0080-4
39. Loret N, Denys H, Tummers P, Berx G. The role of epithelial-to-mesenchymal plasticity in ovarian cancer progression and therapy resistance. Cancers (Basel). 2019;11:6. doi:10.3390/cancers11060838
40. Yang J, Ma J, Jin Y, et al. Development and validation for prognostic nomogram of epithelial ovarian cancer recurrence based on circulating tumor cells and epithelial-mesenchymal transition. Sci Rep. 2021;11(1):6540. doi:10.1038/s41598-021-86122-4
 © 2021 The Author(s). This work is published and licensed by Dove Medical Press Limited. The full terms of this license are available at https://www.dovepress.com/terms.php and incorporate the Creative Commons Attribution - Non Commercial (unported, v3.0) License.
By accessing the work you hereby accept the Terms. Non-commercial uses of the work are permitted without any further permission from Dove Medical Press Limited, provided the work is properly attributed. For permission for commercial use of this work, please see paragraphs 4.2 and 5 of our Terms.
© 2021 The Author(s). This work is published and licensed by Dove Medical Press Limited. The full terms of this license are available at https://www.dovepress.com/terms.php and incorporate the Creative Commons Attribution - Non Commercial (unported, v3.0) License.
By accessing the work you hereby accept the Terms. Non-commercial uses of the work are permitted without any further permission from Dove Medical Press Limited, provided the work is properly attributed. For permission for commercial use of this work, please see paragraphs 4.2 and 5 of our Terms.