Back to Journals » Nature and Science of Sleep » Volume 14
Mandibular Movements are a Reliable Noninvasive Alternative to Esophageal Pressure for Measuring Respiratory Effort in Patients with Sleep Apnea Syndrome
Authors Pepin JL ![]() , Le-Dong NN, Cuthbert V, Coumans N, Tamisier R
, Le-Dong NN, Cuthbert V, Coumans N, Tamisier R ![]() , Malhotra A, Martinot JB
, Malhotra A, Martinot JB ![]()
Received 3 November 2021
Accepted for publication 7 March 2022
Published 13 April 2022 Volume 2022:14 Pages 635—644
DOI https://doi.org/10.2147/NSS.S346229
Checked for plagiarism Yes
Review by Single anonymous peer review
Peer reviewer comments 2
Editor who approved publication: Prof. Dr. Ahmed BaHammam
Video abstract of "Mandibular movements, alternative to PES for measuring RE in OSA" [ID 346229].
Views: 528
Jean-Louis Pepin,1,* Nhat-Nam Le-Dong,2,* Valérie Cuthbert,3 Nathalie Coumans,3 Renaud Tamisier,1 Atul Malhotra,4 Jean-Benoit Martinot3,5
1HP2 Laboratory, Inserm U1300, University Grenoble Alpes, Grenoble, France; 2Sunrise, Namur, Belgium; 3Sleep Laboratory, CHU Université Catholique de Louvain (UCL) Namur Site Sainte-Elisabeth, Namur, Belgium; 4University of California San Diego, La Jolla, CA, USA; 5Institute of Experimental and Clinical Research, UCL Bruxelles Woluwe, Brussels, Belgium
*These authors contributed equally to this work
Correspondence: Jean-Benoit Martinot, Centre du Sommeil et de la Vigilance, CHU-UCL Namur Site Ste Elisabeth, 15 Place Louise Godin, Namur, 5000, Belgium, Tel +32 495502608, Fax +32 81570754, Email [email protected]
Purpose: Differentiation between obstructive and central apneas and hypopneas requires quantitative measurement of respiratory effort (RE) using esophageal pressure (PES), which is rarely implemented. This study investigated whether the sleep mandibular movements (MM) signal recorded with a tri-axial gyroscopic chin sensor (Sunrise, Namur, Belgium) is a reliable surrogate of PES in patients with suspected obstructive sleep apnea (OSA).
Patients and Methods: In-laboratory polysomnography (PSG) with PES and concurrent MM monitoring was performed. PSGs were scored manually using AASM 2012 rules. Data blocks (n=8042) were randomly sampled during normal breathing (NB), obstructive or central apnea/hypopnea (OA/OH/CA/CH), respiratory effort-related arousal (RERA), and mixed apnea (MxA). Analyses were evaluation of the similarity and linear correlation between PES and MM using the longest common subsequence (LCSS) algorithm and Pearson’s coefficient; description of signal amplitudes; estimation of the marginal effect for crossing from NB to a respiratory disturbance for a given change in MM signal using a mixed linear-regression.
Results: Participants (n=38) had mild to severe OSA (median AH index 28.9/h; median arousal index 23.2/h). MM showed a high level of synchronization with concurrent PES signals. Distribution of MM amplitude differed significantly between event types: median (95% confidence interval) values of 0.60 (0.16– 2.43) for CA, 0.83 (0.23– 4.71) for CH, 1.93 (0.46– 12.43) for MxA, 3.23 (0.72– 18.09) for OH, and 6.42 (0.88– 26.81) for OA. Mixed regression indicated that crossing from NB to central events would decrease MM signal amplitude by – 1.23 (CH) and – 2.04 (CA) units, while obstructive events would increase MM amplitude by +3.27 (OH) and +6.79 (OA) units (all p< 10− 6).
Conclusion: In OSA patients, MM signals facilitated the measurement of specific levels of RE associated with obstructive, central or mixed apneas and/or hypopneas. A high degree of similarity was observed with the PES gold-standard signal.
Keywords: obstructive sleep apnea, respiratory effort, mandibular movements, esophageal pressure
Introduction
The assessment of respiratory effort (RE) reflecting neural respiratory drive directed to diaphragm and upper airway muscle is key information that is recorded during polysomnography (PSG). The revised manual for the scoring of sleep and associated events by the American Academy of Sleep Medicine (AASM) recommends the use of esophageal manometry or dual thoracoabdominal respiratory inductance plethysmography for assessing RE or considering the shape of inspiratory nasal pressure to detect and define obstructive sleep apneas and hypopneas.1,2
Differentiating between obstructive and central apnea and hypopnea events during sleep is an essential task because this provides an accurate diagnosis on which to base therapeutic decisions relating to appropriate positive airway pressure (PAP) modalities and for accurate monitoring of patients during treatment.3–5
During obstructive events there is a reduction or cessation of airflow and persistent RE. In contrast, RE decreases (hypopneas) or ceases (apneas) during central events. Differentiation between obstructive and central hypopneas (the most frequently scored respiratory event during sleep) is the most challenging issue when scoring PSGs, and is often insufficiently or inadequately performed when characterizing sleep apnea patients. Esophageal pressure (PES) is the optimal measurement for determining RE changes during sleep but cannot be used in daily practice. In sleep laboratories, the presence of elevated RE is assessed by the examination of the dual respiratory inductive plethysmography (RIP) belts signal (eg amplitude and phase shift) and changes in the shape of inspiratory nasal pressure (eg flow limitation or plateau aspect) and/or the appearance of a crescendo or stable snoring.5–8 RIP signals can be misleading because the presence of obesity can cause misclassification of obstructive events as central. In addition, the shape of the nasal pressure signal is altered by mouth breathing. Therefore, a reliable backup signal for RE is required to increase robustness and reliability.9
The activity of upper airway muscles anchored on the mandibular jaw reflects the activation of brainstem respiratory and sleep centers, and their respective interactions (physiological aspects and significance of the mandibular signal are presented in the Supplemental Materials). This muscle activity triggers specific MM patterns that might represent a powerful noninvasive tool for measuring RE across the diverse variety of respiratory events and different sleep stages.10–12
This study investigated the reliability of mandibular jaw movements (MM) for determining RE during sleep in patients being evaluated for suspected obstructive sleep apnea (OSA). MM measurements were compared to the gold standard method of PES in terms of cycle by cycle variations (ie similarity) and amplitudes of variations during the variety of central and obstructive respiratory events.
Materials and Methods
Study Design
This prospective cross-sectional study was performed during a single night of in-laboratory PSG. The study was approved by the local ethics committee (IRB 00004890 - number B707201523388), and all participants provided a written informed consent.
Study Population
Consecutive adults referred to CHU de Namur (CHU UCL Namur, Saint Elisabeth site, Namur, Belgium) for suspected OSA syndrome (OSAS) were invited to participate. All participants had symptoms suggestive of underlying OSAS.
Polysomnography
In-laboratory PSG was recorded with a commercial digital acquisition system (Somnoscreen Plus, Somnomedics, Randersacken, Germany). The parameters monitored included EEG (Fz-A+, Cz-A+, Pz-A+), right and left electro-occulogram, submental electromyogram (EMG), tibial EMG, chest and abdominal wall motion by respiratory inductance plethysmography (SleepSense S.L.P. Inc, St. Charles, IL, USA), nasal and oral flows with a pressure transducer and a thermistor, respectively, and oxygen saturation by digital oximeter displaying pulse wave form oxygen saturation (SpO2; Nonin, Nonin Medical, Plymouth, MN, USA).
After instillation of local anesthetic, a 2.5-mm external diameter soft silicone covered catheter (Gaeltec Ltd, Dunvegan, Isle of Skye, Scotland, UK) was inserted through the nares into the esophagus. The catheter was mounted with a pressure transducer containing thin film resistive strain gauge sensors. Proper positioning of the catheter was verified by visual inspection of the signal. The catheter was secured with tape to the patient’s nose, lip, and cheek. The transducer was calibrated relative to atmospheric pressure (zero) and then a known pressure applied to set the gain to the required level before each recording. The catheter was connected to a miniature computer recorder (digitraper) that was placed on the bedside locker overnight.13 In order to provide accurate acceleration and angular rate measurement, the inertial measurement unit (accelerometer and gyroscope) is calibrated under steady conditions when the sensor is assembled.
PSG Scoring
PSG scoring (sleep stages and respiratory events supplemented with PES measurement) was performed in strict accordance with AASM criteria1,2 by two trained technicians who were blinded to the study aims and to the MM traces; intraclass correlation coefficient (2,1) = 0.927 (95% confidence interval 0.901–0.962; p<0.001).
Analysis was restricted to patients who spent a minimum of 4 hours sleeping and had good quality signals on all recorded channels, including the PES. Normal breathing (NB) periods, respiratory effort-related arousals (RERA), obstructive and central apneas and hypopneas (OA, OH, CA, and CH), and mixed apneas (MxA) were scored.
Apneas were scored when the flow was ≤10% of baseline regardless of oxygen desaturation. Hypopnea was defined as a reduction in the nasal pressure signal (flow) for >10 seconds ended by an arousal or a ≥3% decrease in oxygen saturation (SpO2) relative to baseline.1,2
The increased RE associated with obstructive respiratory events and the return to baseline upon arousal with or without oxygen desaturation can be accurately demonstrated with PES monitoring. In this study, the PES obstructive swings consisted of more negative signal amplitudes during at least two successive respiratory cycles and terminated by a sudden return to a less negative level. A progressive RE associated with arousal from sleep can easily be observed in many obstructive apneas or hypopneas, and is per definition present in all RERAs where flow does not decrease by ≥30% compared with pre-event baseline.1,2,14
Central apneas were scored when PES and flow were ≤10% of baseline regardless of oxygen desaturation. Hypopneas were characterized as obstructive versus central events depending on the presence or absence of increased RE during the period of flow reduction, respectively. Obstructive hypopneas were characterized by increasing inspiratory PES accompanied by at least one other PSG signal reporting RE (ie flow pressure limitation, respiratory belt asynchrony or snoring) during at least two respiratory cycles and ending in an abrupt PES reversal. A central hypopnea was identified if there was a clear reduction in PES swings from pre-event baseline concomitantly with a ≥30% decrease in flow.1,2
Apneas showing combined periods of no RE or decreasing RE and then at least one respiratory cycle with marked increasing RE were scored as MxA.1,2 An example of fragment is shown in Supplementary Figure 1 after unblinding. Nevertheless, to optimize the validity of labelling, only labels where there was perfect agreement between both scorers were included in the main analysis. Fragments including artefacts in PES originating from swallowing, yawning, coughing, cardiac beating or from changes in thoracic volumes induced by an arousal were discarded.
Mandibular Jaw Movements
MMs were assessed using the Sunrise system (Sunrise, Namur, Belgium). This system is composed of a coin-sized, tri-axial gyroscopic sensor attached to the patient’s chin (in the mentolabial sulcus) by a sleep technician. The embedded inertial measurement device senses MMs and is externally controlled by a smartphone application via Bluetooth (technical aspects regarding capture and measurements of sleep mandibular movements are presented in the Supplemental Materials). The collected MM data were automatically transferred to a cloud-based infrastructure at the end of the night, and data analysis was conducted as described in data processing section of methods.
Data Processing and Statistical Analysis
Data processing and statistical analysis are visually represented in Figure 1. A total of 8042 data blocks were randomly sampled from the original database, each corresponding to periods of NB, RERA, OH, OA, CH, CA and MxA with three channels included: gyroscope, accelerometer and PES. Raw signals were sampled at 10 Hz then filtered with a low pass filter at 1 Hz to form a 2D panel-data structure. An enveloping algorithm was then applied to determine the lower and upper bounds of the signal amplitude. Next, peak-to-peak distance (amplitude) was calculated (defined as the difference between upper and lower bands). The final database contained peak-to-peak distance, patient ID, time stamps and seven respiratory event labels (NB, RERA, OH, OA, CH, CA and MxA).
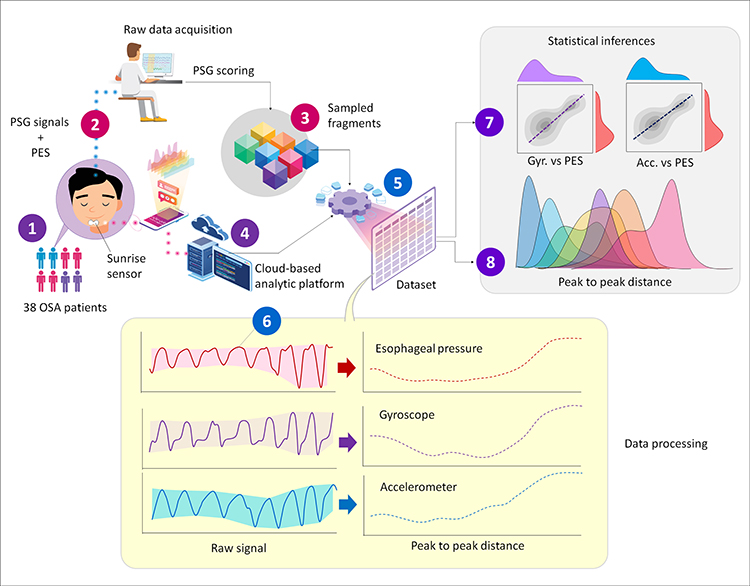 |
Figure 1 Overview of the experimental and analysis protocol. |
To verify the relationship between PES and MM signals within an event, Pearson’s r coefficient was estimated for every pair of PES and MM signal sequences recorded during the same event, then a bootstrap resampling analysis was applied to determine the median of r coefficient and its 95% bootstrapped confidence interval for the seven scored periods. The longest common subsequence (LCSS) algorithm was also applied for matching MM and PES signals, and evaluating their similarity as an index from 0 to 1.0. In contrast to Pearson’s method, which does not consider the temporality factor, the LCSS algorithm allows for matching the entire time series of the two signaling sequences.
The distribution of PES, MM-Gyr and MM-Acc signal amplitudes within periods of NB, RERA, OH, OA, CH, CA and MxA were described at the 5th, 25th, 50th, 75th and 95th percentiles. A mixed linear regression analysis was performed to estimate the marginal effect on the MM-Gyr and MM-Acc signal amplitudes when crossing from NB to different types of respiratory disturbance events, with subject and signal identities treated as nested random effects.
Results
Study Population
Of 42 enrolled patients, 38 had a sleep duration of ≥4 hours and good quality signals on all recorded channels and were included in the final analysis (Table 1). The study population had moderate-to-severe OSA (median apnea-hypopnea index 25.8/h) and were predominantly middle age and obese (Table 1).
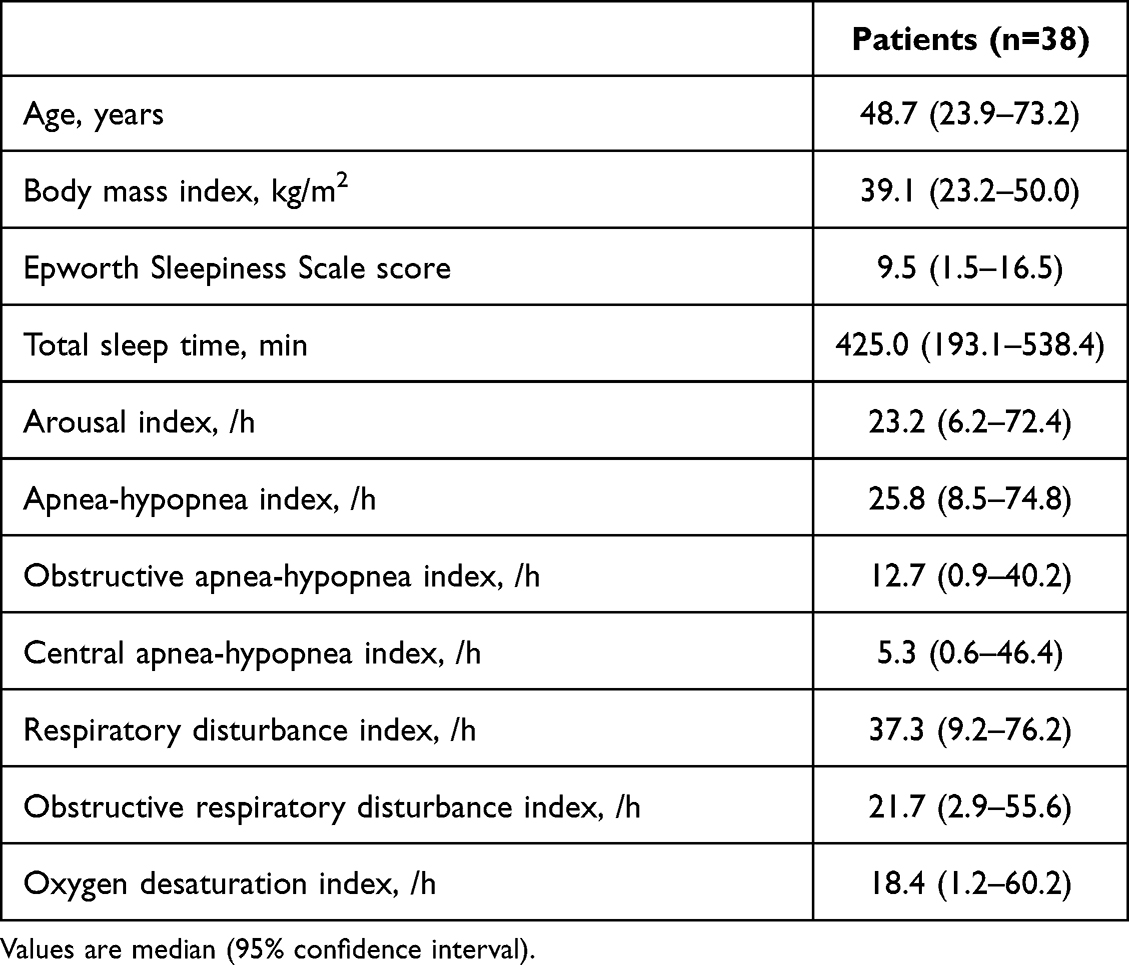 |
Table 1 Clinical Characteristics of the Study Population |
Overview of Signal Data Samples
A total of 8042 signal sequences were extracted from the PES and MM recordings of 38 patients. These included periods of NB (n=1481), RERA (n=874), OH (n=2519), CH (n=1180), OA (n=100), CA (n=1233), and MxA (n=655). Statistics on cumulated and average durations for each event type are provided in the Supplementary Table 1.
On average, the longest sequences (eg RERA) lasted for 19–938 seconds at a sample rate of 10 Hz, while shorter events (eg OH or OA) lasted for 21–52 seconds; CA was the shortest event type, containing around 100 sample points. By considering each sample point as observation unit, 20.4% of data were from NB, 68.6% from obstructive respiratory efforts (RERA, OA and OH), and 6.94% of data were from central events (Supplementary Table 2).
Association Between MM and PES Signals
Overall, the amplitude of both PES and MM signals nicely reflected RE across central and obstructive events, and for apneas and hypopneas (Figure 2). Obstructive events were characterized by higher values across all quartiles and a wider range of MM amplitudes compared with central events. There was also a proportional relationship between PES and MM amplitudes in obstructive hypopneas and obstructive apneas (Figure 2).
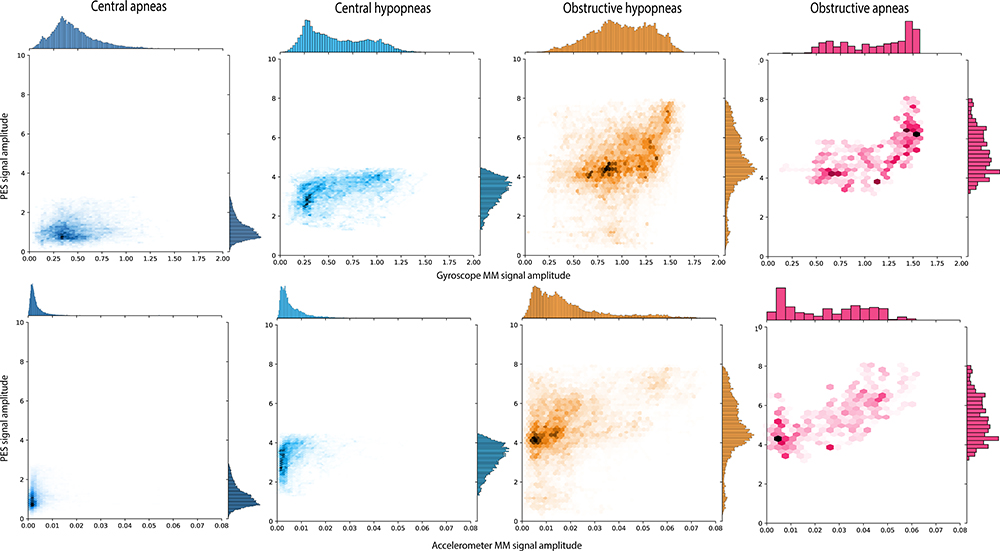 |
Figure 2 Joint distribution and relationship between esophageal pressure (PES) and mandibular jaw movement (MM) amplitudes for central and obstructive events. Each of the bidimensional-density plots represents the joint distribution of the amplitudes of PES (y-axis) and MM (x-axis) signals recorded by the gyroscope (Gyr) or accelerometer (Acc) sensor. Due to a large quantity of value points, data were split into several hexagonal units (hexbins).22 The color density of each hexbin is proportional to the number of points in it. A Yeo-Johnson transformation was applied to both PES and MM scale to optimize the normality of the distribution. The same scales were used for PES, MM-Gyr and MM-Acc. |
The strongest linear correlations were observed within OH and OA (Table 2). In addition, there was a high level of synchronization between PES and MM signal sequences, with median similarity scores of 0.82–0.99 (Table 3).
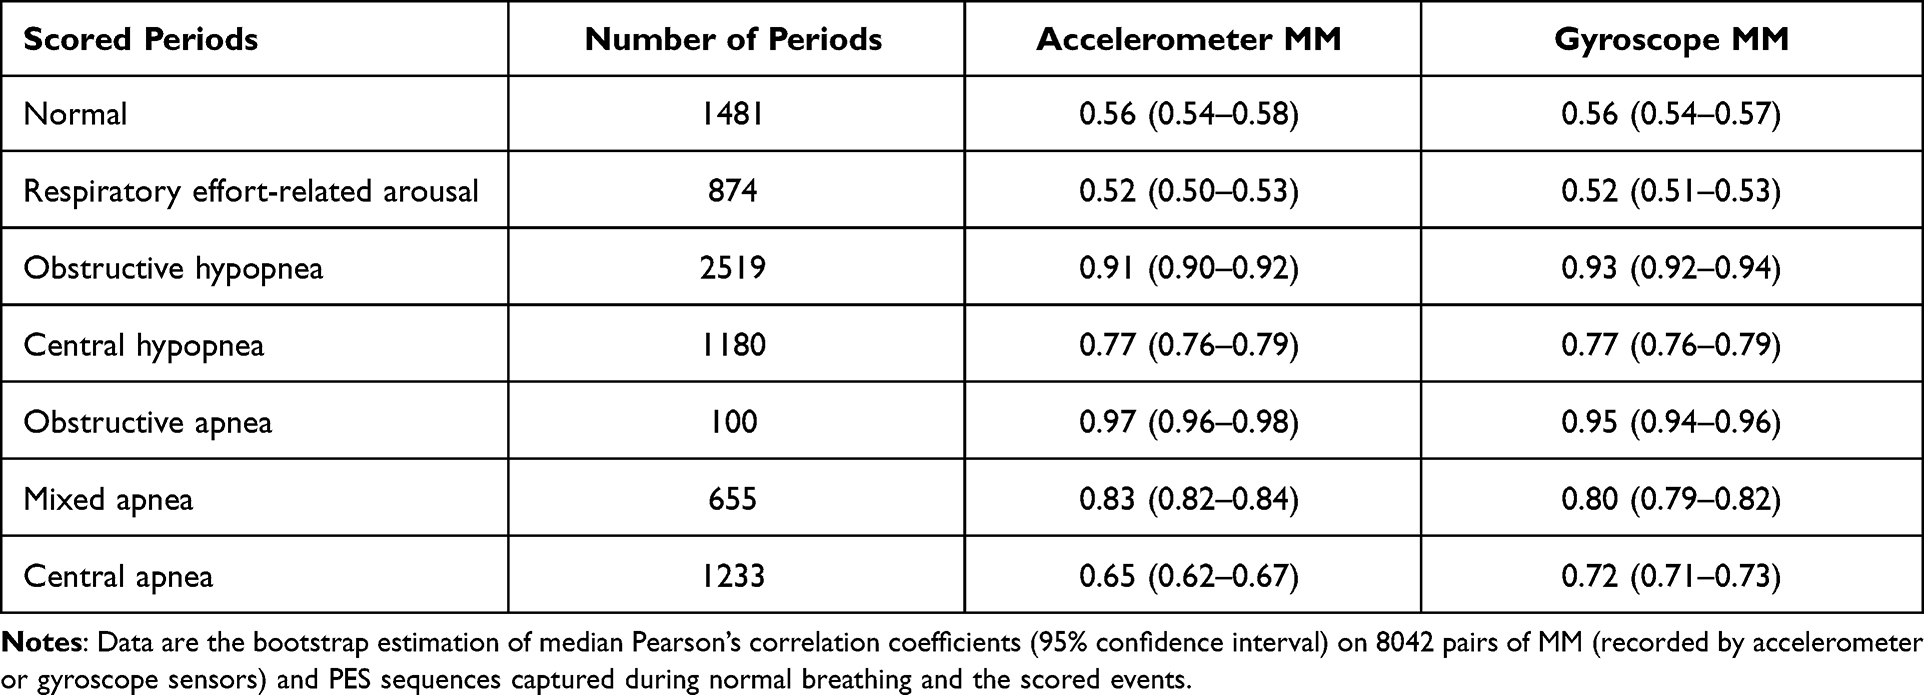 |
Table 2 Linear Correlation Between Esophageal Pressure (PES) and Mandibular Jaw Movement (MM) Signal Amplitudes |
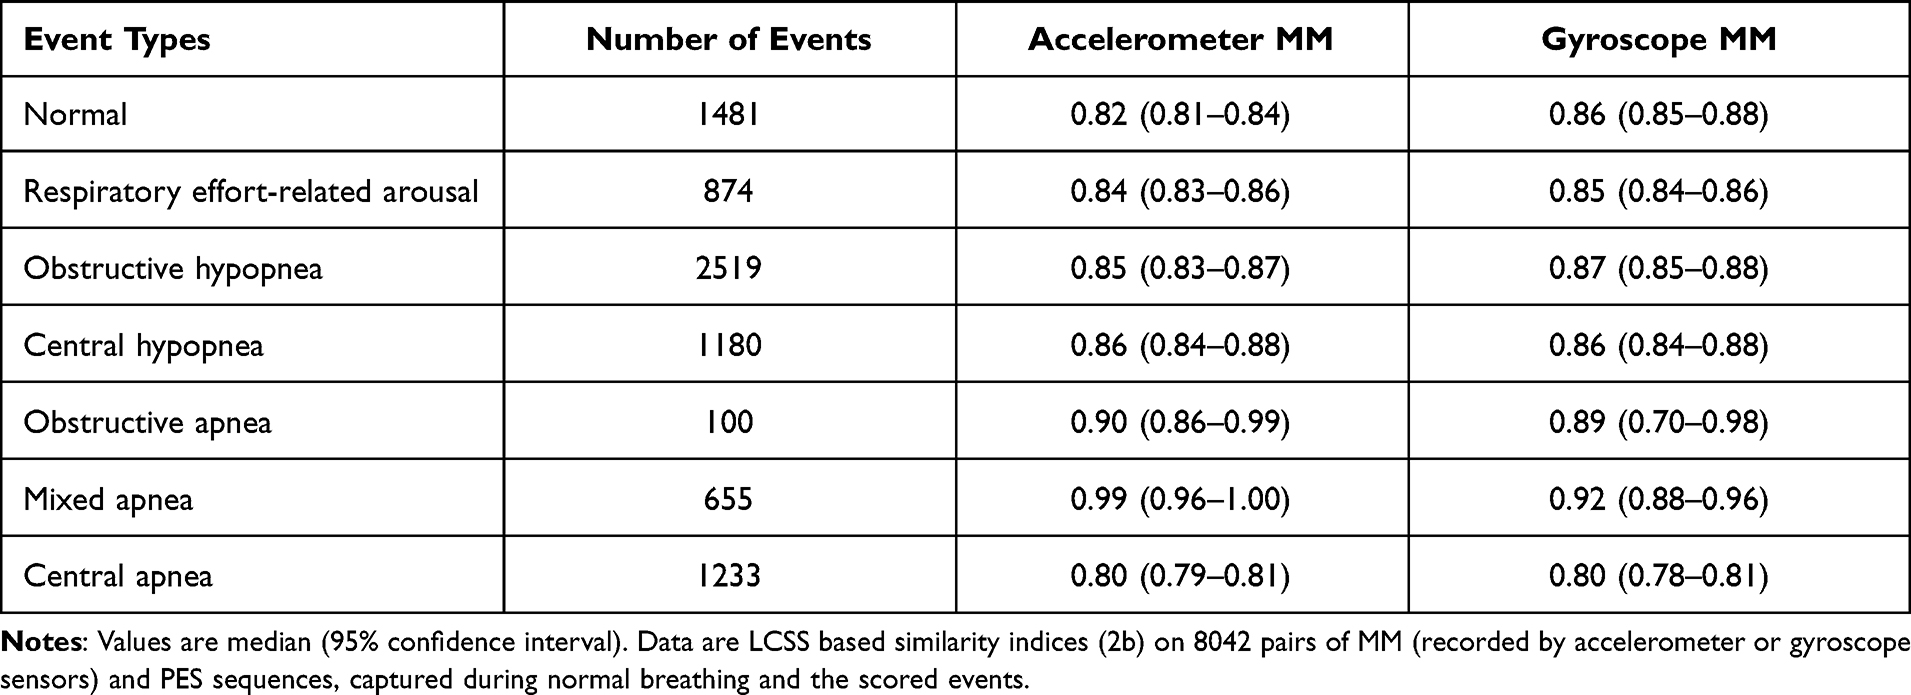 |
Table 3 Similarity in Signal Pattern Between Esophageal Pressure (PES) and Mandibular Jaw Movement (MM) for Different Types of Event |
MM Signal Amplitude as a Surrogate of Respiratory Effort Level
The distribution of PES, MM-Gyr and MM-Acc signal amplitudes across six event types is visualized in Figure 3. A comprehensive descriptive analysis of these distributions is provided in Supplementary Tables 3–5. Together, these results indicate that the ranking of MM signal amplitudes was as follows: CA < CH < NB < RERA < OH < OA.
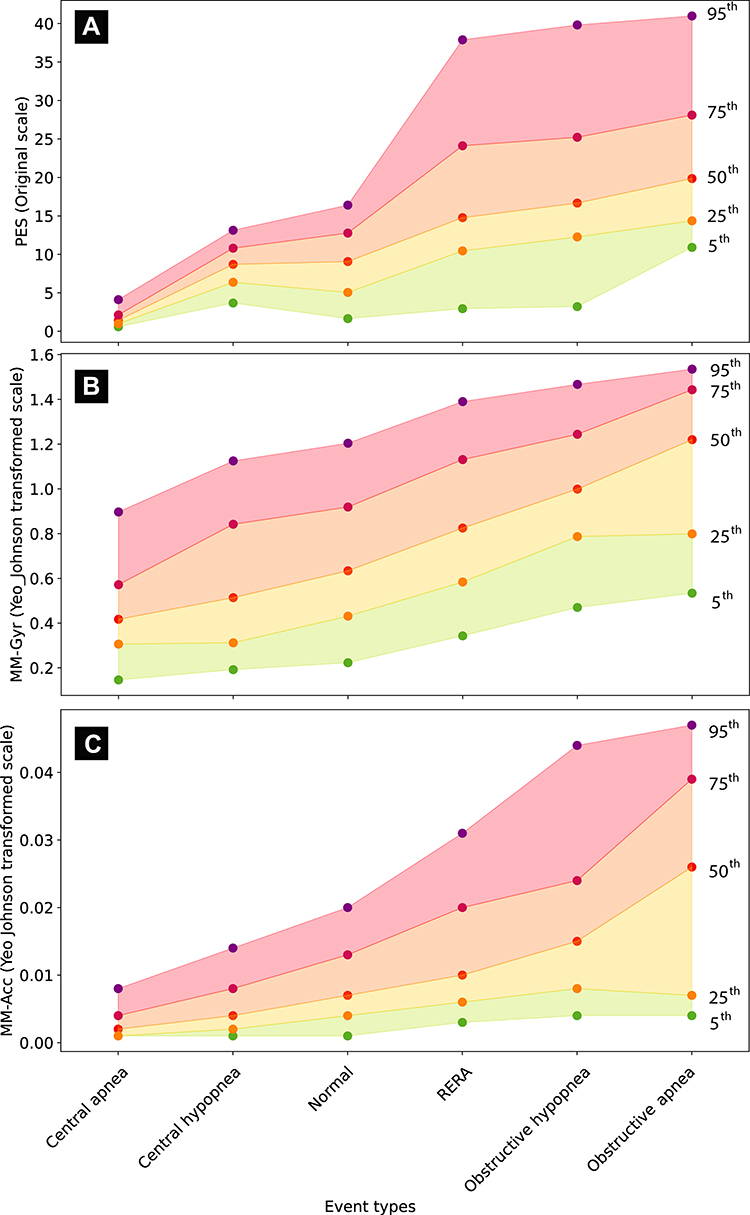 |
Figure 3 Distribution of esophageal pressure (PES; A), gyroscope mandibular jaw movement (MM-Gyr; B) and accelerometer mandibular jaw movement (MM-Acc; C) signal amplitudes during normal breathing and different respiratory disturbances. Each panel on the graph shows the change in distribution of signal amplitudes across normal breathing and the scored respiratory disturbances. Within each event type, the distribution of signal amplitude is summarized in five centiles (95th, 75th, 50th, 25th and 5th, purple, dark red, red, orange, and green points, respectively). The PES signal was evaluated in original scale (mmHg), but the MM-Gyr and MM-Acc amplitudes were transformed using the Yeo-Johnson method to optimize the visual effect. The order of event types on the x-axis was established by sorting the median signal amplitude values. Abbreviation: RERA, respiratory effort-related arousals. |
A mixed linear regression analysis was performed to determine the marginal effect of central and obstructive respiratory disturbances on MM-Gyr and MM-Acc signal amplitudes. As summarized in Table 4, the models indicated that crossing from NB to central events would decrease the amplitude of the MM-Gyr signal by an average of –2.04 units (CA) and –1.23 units (CH). In contrast, the occurrence of RERA, OH and OA was associated with an increase the mean MM-Gyr amplitude, by 1.29, 3.27 and 6.79 units, respectively. Qualitatively similar effects were observed for the MM-Acc signal, and all were statistically highly significant.
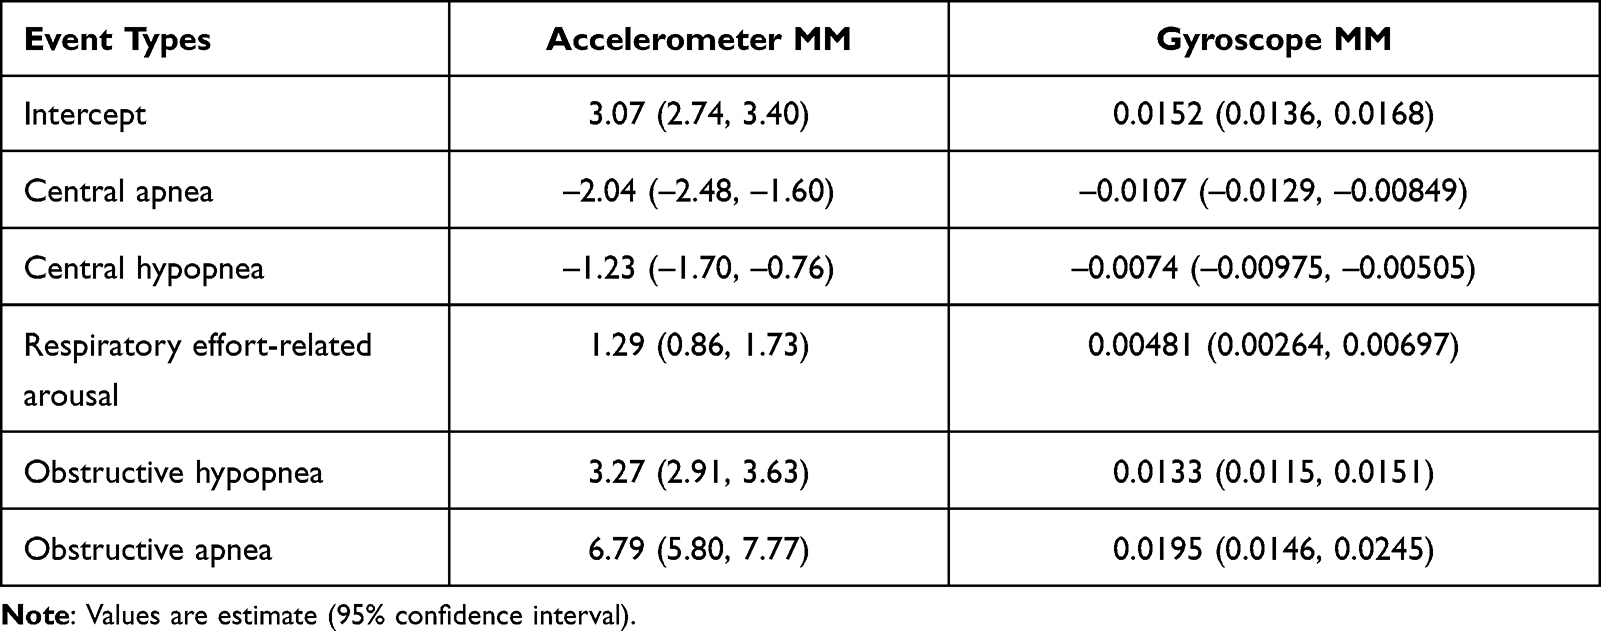 |
Table 4 Marginal Effects of the Different Types of Sleep Respiratory Disturbance on the Amplitude of Two Mandibular Jaw Movement (MM) Signals |
Table 4 summarizes statistical inference of the fixed effects of a mixed linear regression analysis evaluating the average change in MM-Gyr and MM-Acc signal amplitudes when a subject crosses from NB to the different types of scored respiratory disturbances, with subject and signal identities treated as nested random effects. These marginal effects were all statistically significant with p-values below 10−6.
Discussion
Our study demonstrates the high reliability of non-invasive recordings of MM for characterizing RE during sleep. Time series of PES and MM signals displayed concomitant and proportional changes in the same direction showing that they are depicting similar RE information over time. The MM signal produced comparable peak-to-peak amplitudes compared with the envelope drawn around the PES signal during periods of NB and through the different abnormal respiratory events. Our data also provide reference values for variations in MM amplitude associated with the different types of respiratory events concurrently validated by PES measurements.
Intrathoracic PES monitoring remains the recommended quantitative measurement to assess RE during sleep. This recommendation is not realistic because acceptance and tolerance of this invasive technique are poor, and the vast majority of sleep centers do not practice this measurement. The presence of the catheter in the upper airway can modify pharyngeal dynamics and alter sleep quality by increasing sleep fragmentation and disrupting sleep architecture.15–17 As a result, the value of the PES technique is limited not only by the unwillingness of patients to undergo this procedure but also by the fact that the data it generates cannot be interpreted in one-third of the events.7 For these reasons, thoracic and abdominal signals and nasal pressure have progressively replaced PES for assessment of RE in routine practice. However, abdominal signals and nasal pressure are purely qualitative and have some major limitations. RIP belts have only been validated against PES in a limited number of studies and in patients with a mild sleep apnea.18–20 The reliability of the signal is poor in obese patients with OSA, and there is overestimation of central events. The inspiratory nasal pressure curve provides information about pharyngeal resistances but does not truly reflect the progressive increase in amplitude of RE during obstructive events.21 Flow limitation is also observed during REM hypopneas while the central drive is decreasing, which is confusing for event scoring.
Due to the complexity and invasiveness of the investigation, this study was performed in a relatively small sample of patients. However, we did analyze 6561 respiratory events representing 46.2 hours of abnormal breathing disorders, suggesting that our findings are applicable across the OSA spectrum. Differentiating a normal level of RE from periods of increased RE during RERAs was less obvious during our study, with some overlap between the two situations (Supplementary Tables 3–5) This is likely to be explained by the high proportion of obese individuals in the study population (Table 1). We must stay cautious when considering the absolute value of Sunrise technology in a particular patient to classify obstructive versus central abnormal RE. In contrast, there was only minimal overlap between the PES and MM signal distributions during central and obstructive apneas or hypopneas (Figure 2).
Conclusion
Non-invasively recorded MM signals are highly reliable for measuring RE during NB and during episodes of obstructive, central or mixed respiratory disturbances.
Acknowledgments
The authors wish to thank Ms. Liesbeth Ory and Ms. Ravzat Ashurlaeva for their secretarial assistance and support. English language editing and formatting assistance was provided by Nicola Ryan, independent medical writer, funded by Sunrise. Jean-Louis Pepin and Nhat-Nam Le-Dong are co-first authors for this study.
Author Contributions
All authors helped revise the manuscript and approved it for submission. All authors made a significant contribution to the work reported, whether that is in the conception, study design, execution, acquisition of data, analysis and interpretation, or in all these areas; took part in drafting, revising or critically reviewing the article; gave final approval of the version to be published; have agreed on the journal to which the article has been submitted; and agree to be accountable for all aspects of the work.
Funding
J-L.P. and RT are supported by the French National Research Agency in the framework of the “Investissements d’avenir” program (ANR-15-IDEX-02) and the “e-health and integrated care and trajectories medicine and MIAI artificial intelligence” chairs of excellence from the Grenoble Alpes University Foundation. This work has been partially supported by MIAI @ Grenoble Alpes, (ANR-19-P3IA-0003). AM is funded by US National Institutes of Health.
Disclosure
J-L.P. reports being a scientific advisor to Sunrise; receiving grants and/or personal fees from ResMed, Philips, Fisher & Paykel, Sefam, AstraZeneca, AGIR à dom, Elevie, VitalAire, Boehringer Ingelheim, Jazz Pharmaceuticals, Night Balance, and Itamar Medical Ltd; and receiving research support for clinical studies from Mutualia and Air Liquide Foundation. N-N.L-Dong is an employee of Sunrise. J-B.M. reports being a non-remunerated scientific advisor to Sunrise and being an investigator in pharmacy trials for Jazz Pharmaceuticals, Theranexus and Desitin. RT reports grants from Resmed, board and lecture fees from Jazz Pharm and Bioprojet, outside the submitted work. AM reports income related to medical education from Livanova, Equillium, Jazz, Sunrise, Corvus; ResMed provided a philanthropic donation to UCSD. All other authors have no conflicts of interest to declare in this work.
References
1. Berry RB, Brooks R, Gamaldo C, et al. AASM scoring manual updates for 2017 (version 2.4). J Clin Sleep Med. 2017;13(5):665–666. doi:10.5664/jcsm.6576
2. Berry RB, Budhiraja R, Gottlieb DJ, et al. Rules for scoring respiratory events in sleep: update of the 2007 AASM manual for the scoring of sleep and associated events. Deliberations of the sleep apnea definitions task force of the American Academy of Sleep Medicine. J Clin Sleep Med. 2012;8(5):597–619. doi:10.5664/jcsm.2172
3. Malhotra A, Mesarwi O, Pepin JL, Owens RL. Endotypes and phenotypes in obstructive sleep apnea. Curr Opin Pulm Med. 2020;26(6):609–614. doi:10.1097/mcp.0000000000000724
4. Martinot JB, Le-dong NN, Cuthbert V, et al. Respiratory mandibular movement signals reliably identify obstructive hypopnea events during sleep. Front Neurol. 2019;10:828. doi:10.3389/fneur.2019.00828
5. Randerath W. It’s possible: why don’t we do it? J Clin Sleep Med. 2021;17(6):1149–1150. doi:10.5664/jcsm.9322
6. Dupuy-McCauley KL, Mudrakola HV, Colaco B, Arunthari V, Slota KA, Morgenthaler TI. A comparison of 2 visual methods for classifying obstructive vs central hypopneas. J Clin Sleep Med. 2021;17(6):1157–1165. doi:10.5664/jcsm.9140
7. Randerath WJ, Treml M, Priegnitz C, Stieglitz S, Hagmeyer L, Morgenstern C. Evaluation of a noninvasive algorithm for differentiation of obstructive and central hypopneas. Sleep. 2013;36(3):363–368. doi:10.5665/sleep.2450
8. Vandenbussche NL, Overeem S, van Dijk JP, Simons PJ, Pevernagie DA. Assessment of respiratory effort during sleep: esophageal pressure versus noninvasive monitoring techniques. Sleep Med Rev. 2015;24:28–36. doi:10.1016/j.smrv.2014.12.006
9. Koutsourelakis I, Vagiakis E, Roussos C, Zakynthinos S. Obstructive sleep apnoea and oral breathing in patients free of nasal obstruction. Eur Respir J. 2006;28(6):1222–1228. doi:10.1183/09031936.00058406
10. Le-dong NN, Martinot JB, Coumans N, et al. Machine learning-based sleep staging in sleep apnea patients using a single mandibular movement signal. Am J Respir Crit Care Med. 2021;204(10):1227–1231. doi:10.1164/rccm.202103-0680LE
11. Martinot JB, Le-dong NN, Cuthbert V, et al. Mandibular movements as accurate reporters of respiratory effort during sleep: validation against diaphragmatic electromyography. Front Neurol. 2017;8:353. doi:10.3389/fneur.2017.00353
12. Pépin JL, Letesson C, Le-dong NN, et al. Assessment of mandibular movement monitoring with machine learning analysis for the diagnosis of obstructive sleep apnea. JAMA Netw Open. 2020;3(1):e1919657. doi:10.1001/jamanetworkopen.2019.19657
13. Kushida CA, Giacomini A, Lee MK, Guilleminault C, Dement WC. Technical protocol for the use of esophageal manometry in the diagnosis of sleep-related breathing disorders. Sleep Med. 2002;3(2):163–173. doi:10.1016/s1389-9457(0100143-5
14. Loiodice C, Selek M, Loire M, Lévy P, Pépin JL. Mesure de l’effort respiratoire (pression œsophagienne) et estimation des résistances des voies aériennes supérieures au cours de l’enregistrement de sommeil: indications, limites, résultats. Neurophysiol Clin. 1998;28(6):507–520. doi:10.1016/S0987-7053(9980019-7
15. Chediak AD, Demirozu MC, Nay KN. α EEG sleep produced by balloon catheterization of the esophagus. Sleep. 1990;13(4):369–370. doi:10.1093/sleep/13.4.369
16. Chervin RD, Aldrich MS. Effects of esophageal pressure monitoring on sleep architecture. Am J Respir Crit Care Med. 1997;156(3 Pt 1):881–885. doi:10.1164/ajrccm.156.3.9701021
17. Woodson BT, Wooten MR. A multisensor solid-state pressure manometer to identify the level of collapse in obstructive sleep apnea. Otolaryngol Head Neck Surg. 1992;107(5):651–656. doi:10.1177/019459989210700507
18. Loube DI, Andrada T, Howard RS. Accuracy of respiratory inductive plethysmography for the diagnosis of upper airway resistance syndrome. Chest. 1999;115(5):1333–1337. doi:10.1378/chest.115.5.1333
19. Masa JF, Corral J, Martín MJ, et al. Assessment of thoracoabdominal bands to detect respiratory effort-related arousal. Eur Respir J. 2003;22(4):661–667. doi:10.1183/09031936.03.00010903
20. Masa JF, Corral J, Teran J, et al. Apnoeic and obstructive nonapnoeic sleep respiratory events. Eur Respir J. 2009;34(1):156–161. doi:10.1183/09031936.00160208
21. Pamidi S, Redline S, Rapoport D, et al. An official American Thoracic Society Workshop Report: noninvasive identification of inspiratory flow limitation in sleep studies. Ann Am Thorac Soc. 2017;14(7):1076–1085. doi:10.1513/AnnalsATS.201704-318WS
22. Carr DB, Littlefield RJ, Nicholson WL, Littlefield JS. Scatterplot matrix techniques for large N. J Am Stat Assoc. 1987;82(398):424–436. doi:10.1080/01621459.1987.10478445
 © 2022 The Author(s). This work is published and licensed by Dove Medical Press Limited. The
full terms of this license are available at https://www.dovepress.com/terms
and incorporate the Creative Commons Attribution
- Non Commercial (unported, 3.0) License.
By accessing the work you hereby accept the Terms. Non-commercial uses of the work are permitted
without any further permission from Dove Medical Press Limited, provided the work is properly
attributed. For permission for commercial use of this work, please see paragraphs 4.2 and 5 of our Terms.
© 2022 The Author(s). This work is published and licensed by Dove Medical Press Limited. The
full terms of this license are available at https://www.dovepress.com/terms
and incorporate the Creative Commons Attribution
- Non Commercial (unported, 3.0) License.
By accessing the work you hereby accept the Terms. Non-commercial uses of the work are permitted
without any further permission from Dove Medical Press Limited, provided the work is properly
attributed. For permission for commercial use of this work, please see paragraphs 4.2 and 5 of our Terms.