
Back to Journals » ClinicoEconomics and Outcomes Research » Volume 18
Financial Impact of Treatment Choice in Chronic Myeloid Leukemia: A Comparison of Later Generation TKIs versus Imatinib from Patient and Payer Perspectives
Authors Vaughn JE, Zawadzki N, Zhang S, Pinkston P, Wei D, Shafrin J 
Received 30 May 2026
Accepted for publication 30 June 2026
Published 8 July 2026 Volume 2026:18 626752
DOI https://doi.org/10.2147/CEOR.S626752
Checked for plagiarism Yes
Review by Single anonymous peer review
Peer reviewer comments 2
Editor who approved publication: Professor Giorgio Colombo
Jennifer E Vaughn,1 Nadine Zawadzki,2 Shurui Zhang,3 Paul Pinkston,4 David Wei,4 Jason Shafrin2
1James Cancer Hospital and Solove Research Institute, The Ohio State University Comprehensive Cancer Center, Columbus, OH, USA; 2Center for Healthcare Economics and Policy, FTI Consulting, Los Angeles, CA, USA; 3Center for Healthcare Economics and Policy, FTI Consulting, Washington, DC, USA; 4Novartis Pharmaceuticals Corporation, East Hanover, NJ, USA
Correspondence: Jason Shafrin, Center for Healthcare Economics and Policy, FTI Consulting, 350 S. Grand Avenue Suite 3000, Los Angeles, CA, 90071, USA, Email [email protected]
Purpose: To evaluate the financial impact of treating CML with later-generation TKIs relative to imatinib on US patients and payers.
Methods: The financial impact of later-generation TKIs (asciminib, bosutinib, dasatinib, nilotinib, and ponatinib) and imatinib was measured from patients’ and payers’ perspectives before (2024) and after the implementation of Inflation Reduction Act (2025), respectively. Changes in patient’s annual out-of-pocket (OOP) costs of CML therapies by payer type (Medicare, Medicaid, and commercial) were used to indicate the financial impact on patients. Per patient per year (PPPY) treatment costs were measured as the weighted average cost across indicated adult CML populations derived using FDA label-based dosing and wholesale acquisition costs. Annual OOP limits by payer types were determined through literature review. The financial impact from payers’ perspective was estimated as difference in monthly premium based on per member per month (PMPM) budget impact.
Results: In 2025, the estimated PPPY cost for imatinib ($22,430 across generic and branded products, weighted by market share) and for later-generation TKIs (all >$100,000 except for dasatinib and nilotinib, which were $72,693 and $89,138, respectively) exceeded annual OOP limits under Medicare Part D, the average commercial plan, and the commercial plan with highest possible annual OOP limit, resulting in no change in patient financial impact when switching from imatinib to a later-generation TKI. An all-payer blended US health plan with 1 million members could expect to have 200 patients with Philadelphia chromosome-positive CML eligible for TKI therapy. Switching from imatinib to a later-generation TKI would increase the PMPM budget impact between $0.76 and $4.23.
Conclusion: Both imatinib and later-generation TKI costs were projected to exceed annual OOP caps in 2025, likely resulting in minimal change in insured CML patients’ OOP costs. The impact on insurance premiums from the adoption of TKI is likely to be relatively modest.
Keywords: chronic myeloid leukemia, financial toxicity, tyrosine kinase inhibitors, out-of-pocket costs
Introduction
Chronic myeloid leukemia (CML) is a hematologic malignancy characterized by excessive proliferation of myeloid cells. There were over 150,000 individuals in the US living with CML in 2024, with an annual incidence of about 2 cases per 100,0000 individuals corresponding to an estimated 9,560 new patients diagnosed with CML in the US.1,2 Approximately half of patients with CML are age 65 years or older at diagnosis in the US.1 The introduction of tyrosine kinase inhibitors (TKIs) for the treatment of CML has dramatically improved prognosis from fatal to that of a chronic disease. FDA-approved TKIs include first-generation TKI imatinib, second-generation TKIs dasatinib, nilotinib, and bosutinib, third-generation TKI ponatinib, and first-in-class Specifically Targeting the ABL Myristoyl Pocket (STAMP) inhibitor asciminib.3,4 Compared to imatinib, later-generation TKIs have achieved deeper and more rapid molecular responses and fewer accelerated transformations in CML.5,6
Many healthcare providers have voiced concerns about the increased cost associated with these newer TKIs, citing its impact on patient financial well-being, treatment adherence and outcomes, as well as the healthcare system at large.7 Research has linked high treatment costs to worse health-related quality of life in patients with CML treated with TKIs, largely due to increased financial stress or “financial toxicity”,8 and has also linked increased patient out-of-pocket (OOP) costs to poor treatment adherence.9,10
“Financial impact”, when referring to cancer drugs, is a broad term that may include patient OOP cost, drug list prices (eg., wholesale acquisition costs), or the burden to payers which would translate to higher premiums.8,11,12 OOP costs are a particularly salient concern in the US healthcare system, where patients bear a greater share of drug costs compared to many other countries (eg., United Kingdom, Australia, or New Zealand) and patient financial burden may impact medication choice and patient adherence. Healthcare providers in the US often treat patients with a variety of insurance types and may be unaware of how the different benefit designs across payers—for instance, differences in deductibles, copayments, coinsurance, and annual OOP limits across Medicare, Medicaid, and commercial plans—shape the financial burden of TKI treatments for patients with CML. Moreover, the Inflation Reduction Act of 2022 introduced significant changes to Medicare Part D drug coverage, including a $2,000 annual out-of-pocket cap on prescription drug costs beginning in 2025, with direct implications for the financial burden borne by Medicare beneficiaries with CML.13 In light of the availability of newer, more efficacious TKIs as well as the genericization of imatinib, which generally results in substantially lower drug costs relative to branded products, understanding the extent of financial impact associated with choice of TKI treatment for CML can help to inform clinical decisions of healthcare providers regarding treatment affordability and patient access. Therefore, the aim of this study was to measure the financial impact on patients and payers of treating CML with later-generation TKIs relative to imatinib in publicly and privately insured US populations. Patient OOP cost and payer PMPM budget impact were selected as the primary metrics in this analysis because they most directly reflect the financial experience of patients and insurers, respectively.
Materials and Methods
This study evaluated the financial impact of treating CML using later-generation TKIs and using imatinib from patients’ and payers’ perspectives, with analyses conducted from a US payer perspective. The financial impact on patients was measured as changes in OOP costs and financial impact on payers was measured as changes in insurance premiums. The analysis was limited to adult indications. This study did not require ethical approval as no human subjects or primary data collection were involved.
Patient Financial Impact
The financial impact of using later-generation TKIs (asciminib, bosutinib, dasatinib, nilotinib, and ponatinib) compared to imatinib was measured using patient OOP treatment cost across US payer types, such as Medicare (a US federal health insurance program primarily covering individuals aged 65 and older or those with certain disabilities), Medicaid (a joint federal and state program providing coverage to low-income individuals and families), and commercial (private health plans typically obtained through employers or purchased individually).14 Per patient per year (PPPY) treatment cost for each TKI was estimated as the weighted average of annual drug costs across indicated CML populations derived using FDA label recommended dosing and 2024 and 2025 wholesale acquisition costs (WACs).15–18 List prices were used as the study assumed no rebates or discounts impacted TKI drug prices (Table 1).
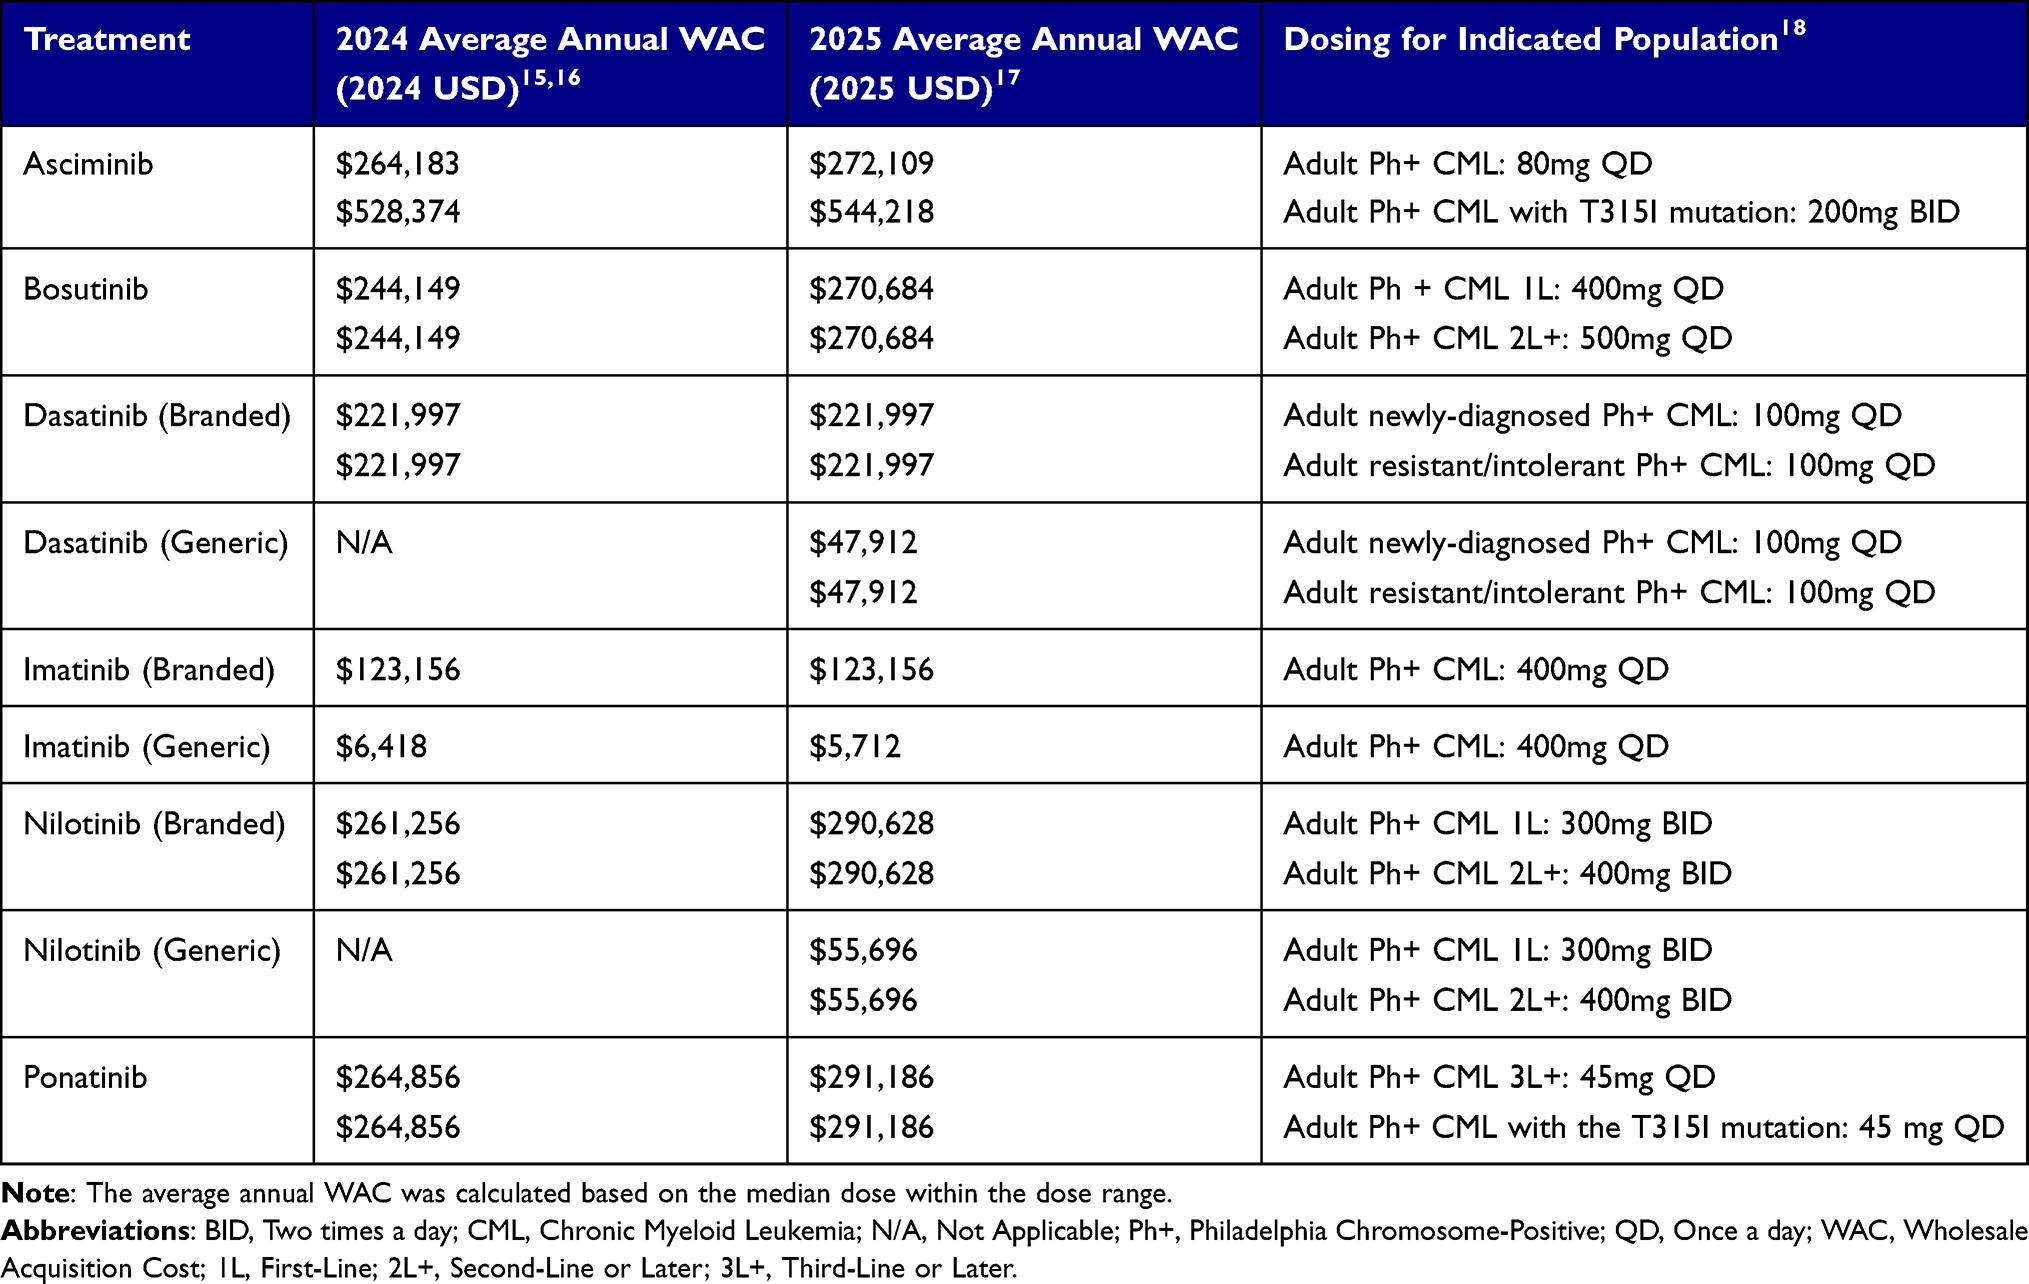 |
Table 1 Treatment Annual Wholesale Acquisition Costs |
Wholesale acquisition cost (WAC) was selected as the basis for drug pricing in this analysis for several reasons. WAC represents a standardized, publicly available list price that is consistently reported across all TKIs and serves as the foundational reference price from which patient cost-sharing obligations—including OOP costs under Medicare Part D, Medicaid, and commercial plans—are typically calculated. While net prices after rebates and payer negotiations may differ, these figures are proprietary and not publicly available in a manner that would allow systematic comparison across all included therapies. Furthermore, because the primary objective of this analysis was to compare the relative financial impact of TKI choices on patients and payers rather than to estimate absolute drug expenditures, WAC-based costs provide a consistent and transparent basis for comparison. The use of WAC is consistent with established health economic modeling practice in the US context.
Due to the growing use of generic imatinib, imatinib cost was specified in four different ways. These include: (1) the average WAC across generic imatinib products only (14 products at 100 mg and 13 products at 400 mg in 2024; 19 products at 100 mg and 17 products at 400 mg in 2025); (2) the WAC of branded imatinib only (Table 1); (3) the weighted average of generic and branded WAC weighted by their real-world relative market share obtained from literature (85.8% generic, 14.2% brand);19 and (4) the retail price of imatinib from Mark Cuban CostPlus Drug Company (30 tablets at 400 mg for $34.50 in 2024 and 2025; 90 tablets at 100 mg for $29.55 in 2024 and 2025), included to represent the lowest price option available to patients irrespective of insurance design and/or rebates.20 Because Mark Cuban Pharmacy does not process insurer claims, patients can only purchase their prescriptions OOP with cash.20
Dasatinib and nilotinib costs in 2024 were based on the branded product WACs. To account for the introduction of generic dasatinib in September 202421 and generic nilotinib in May 2025,22 dasatinib and nilotinib costs in 2025 were each calculated as a weighted average of generic and branded WACs based on the market share of generic and branded imatinib as a proxy.15,20 The retail price of dasatinib from Mark Cuban CostPlus Drug Company (30 tablets at 100 mg for $258.24 in 2025) was additionally included as the lowest price option for generic dasatinib.
US prevalence of indicated adult CML populations—Philadelphia chromosome positive (Ph+) CML in first-line (1L), second-line (2L), or third-line or later (3L+)—by payer was estimated using Surveillance, Epidemiology, and End Results Program (SEER) data and real-world distributions of indicated populations from literature (Supplementary Table 1).23–27
Patient annual OOP limits were identified separately for each payer type. In addition, OOP limits were evaluated separately based on both 2024 and 2025 benefit designs (Supplementary Table 1), as the annual OOP limit for pharmacy expenditures under Medicare Part D was $8,000 per individual,28 but—due to the Inflation Reduction Act (IRA), a landmark US federal law aimed at reducing prescription drug costs for Medicare beneficiaries—the Centers for Medicare & Medicaid Services (CMS) introduced a $2,000 annual OOP cap for Medicare Part D beneficiaries in 2025.13 Unlike Medicare, commercial plans in the US typically combine OOP costs for both medical care and pharmaceuticals into a single OOP maximum for the plan year. The average OOP limit under a commercial plan in 2024 was $4,101,29 and the highest commercial OOP limit ($9,450) was based on the 2024 Affordable Care Act (ACA) limit.30 The 2024 annual OOP copayment maximum for Medicaid plans nationwide was assumed to be the same as the 2024 limit for New York (NY) State Medicaid ($200),31 which represented a defined upper bound for state Medicaid OOP limits given some states have no copayments or fixed limits, and its use as a national standard represented a conservative assumption, as higher OOP limits would permit a greater potential cost difference between later-generation TKIs and imatinib.32 In 2025, commercial and Medicaid changes to OOP limits were modest; the highest commercial OOP limit in 2025 was based on the 2025 ACA limit ($9,200),30 and the average commercial OOP limit in 2025 was assumed to be the same as 2024.29 The Medicaid annual OOP copayment maximum in 2025 was assumed to be the same as 2024.31 We conducted a threshold sensitivity analysis to determine the price reduction each TKI would require for patient OOP cost to fall below the 2025 annual OOP limit under each payer.
Payer Financial Impact
Payer financial impact was measured as change in monthly premium based on per member per month (PMPM) budget impact, calculated as the difference in PMPM treatment cost between newer TKIs and imatinib multiplied by the US prevalence of the respective indicated adult CML populations by payer type derived from literature (Supplementary Table 1).15,16,23–27,33,34 A one-way sensitivity analysis was additionally conducted on the 2025 PMPM budget impact of each later-generation TKI relative to imatinib, varying imatinib pricing to generic-only, each later-generation’s WAC ±20%, and generic availability of dasatinib and nilotinib.
Assumptions
Because medical OOP spending contributes to commercial plan OOP maximums, this study estimated medical cost OOP for patients enrolled in commercial plans. Typical OOP non-pharmacy medical care costs for patients under commercial plans were estimated based on literature on medical costs in CML by line of therapy,35,36 assuming 20% coinsurance rate based on the 2023 KFF Employer Health Benefits Survey.29 Patients under commercial plans were assumed to pay 100% of prescription drug costs until reaching their annual OOP maximum. Variations in copayments, coinsurance, and formulary structures were not considered to allow for a direct comparison of the maximum potential OOP burden across TKIs. In addition, Medicare plans reflected Medicare fee-for-service benefit design and did not include Medicare Advantage.
Results
2024 Results
Estimated PPPY cost was highest for later-generation TKIs and lowest for generic imatinib. Based on the annual WAC, the modeled imatinib annual cost was $23,035 for generic and branded imatinib weighted by market share, $6,418 for generic-only imatinib ($1,550-$32,850 across generic products), and $123,156 for branded imatinib. Lowest PPPY cost modeled for generic imatinib based on the Mark Cuban CostPlus retail price was $420. Estimated PPPY cost for treatment with later-generation TKIs in 2024 exceeded $100,000 (asciminib: $272,637; dasatinib: $221,997; bosutinib: $244,149; nilotinib: $261,256; ponatinib: $264,856).
Despite the large variance in WAC costs, the model-estimated impact of CML treatment on patient OOP cost was minimal. In 2024, pharmaceutical costs for all CML therapies except generic imatinib were projected to exceed OOP limits. Specifically, these OOP limits in the pre-IRA era were $8,000 for Medicare Part D, $4,101 for the average commercial plan, and $9,450 as the legal limit for a commercial plan. Thus, the model projected there would be no change in patient OOP cost under these plans between later-generation TKIs and imatinib, assuming imatinib cost based on branded WAC or weighted average of generic and branded WACs (Supplementary Figure 1). While the estimated pharmaceutical cost for WAC-based generic imatinib exceeded the average commercial plan OOP limit, it did not reach the OOP limit under Medicare or the highest-limit commercial plan, resulting in a lower OOP cost impact compared to later-generation TKIs under Medicare ($1,582 less) and the highest commercial plan limit ($3,032 less). Mark Cuban retail price-based generic imatinib did not reach OOP limits under Medicare or commercial plans, resulting in a lower OOP cost impact to patients than later-generation TKIs ($7,580 less under Medicare, $3,681 less under average commercial plans, $9,030 less under highest-limit commercial plans). Moreover, because commercial plans typically include both medical and pharmacy cost towards the annual out-of-pocket maximum, it is even less likely that CML treatment choice would impact OOP cost for commercially insured patients. Typical OOP costs in 2024 for non-pharmacy medical care range between $9,806/year for CML patients receiving 1L treatment to $25,978/year once patients reach 3L+. Thus, commercially insured patients would reach OOP limits due to medical care costs alone with all TKIs, including generic imatinib. Among Medicaid beneficiaries with CML, copays for generic and preferred brands ($1 per prescription) versus non-preferred brands ($3 per prescription) resulted in an estimated annual OOP cost difference of $0-$24 between later-generation TKIs and imatinib, depending on later-generation TKIs’ preferred status under Medicaid.
In contrast to the minimal impact on patient OOP costs, the full cost difference between TKIs is largely absorbed by the payer, as patients across Medicare, commercial, and Medicaid plans are largely shielded from drug price variation through OOP caps and copay structures. Reflecting this payer-absorbed cost differential, the model-estimated differences in payer PMPM budget impact between imatinib and later-generation TKIs were relatively modest. Based on an overall annual US prevalence of CML of 21 per 100,000 individuals,26 of which 95% are Ph+,27 approximately 200 patients are estimated to have Ph+ CML in a 1 million-member all-payer blended health plan, of whom 98.5% are adults (Supplementary Table 1). Payer-specific prevalence varies, with an estimated 570 CML Ph+ patients in a 1 million-member Medicare plan, 151 in a 1 million-member Medicaid plan, and 150 in a 1 million-member commercial payer plan.24,26 The model-estimated difference in payer PMPM budget impact from imatinib varied by later-generation TKIs, ranging from $0.68 to $4.09 in an all-payer blended health plan, with higher monthly premium increases for Medicare ($1.98-$11.86) compared to Medicaid ($0.53-$3.15) or commercial ($0.52-$3.11) enrollees (Supplementary Figure 2).
2025 Results
There were modest changes in drug prices in 2025 relative to 2024. Estimated PPPY cost for imatinib in 2025 based on annual WACs averaged $22,430 for generic and branded imatinib weighted by market share, $5,712 for generic only imatinib ($1,118-$32,850 across generic products), and $123,156 for branded imatinib. Lowest PPPY cost for generic imatinib based on the Mark Cuban CostPlus retail price was $420. Accounting for the entry of generic dasatinib and nilotinib, estimated PPPY costs of later-generation TKIs still exceeded $100,000 in 2025, except for dasatinib and nilotinib (asciminib: $280,816; bosutinib: $270,684; ponatinib: $291,186). Based on WAC, dasatinib had a PPPY cost of $72,693, and based on lowest possible retail price from Mark Cuban it had a PPPY cost of $3,142. The estimated PPPY cost for nilotinib was $89,138.
Due to the implementation of IRA benefit redesign—which set Medicare Part D OOP maximum to $2,000—the impact of treatment choice had an even smaller impact on patient OOP than in prior years. Specifically, patients covered by Medicare in 2025 see no change in OOP costs with later-generation TKIs vs. imatinib, as pharmaceutical costs for all TKIs, except Mark Cuban retail price-based generic imatinib, would exceed the annual Medicare Part D OOP limit ($2,000). Similar to 2024, WAC-based pharmaceutical costs for all CML therapies in 2025 were projected to exceed OOP limits under the average commercial plan ($4,101), resulting in no change in OOP cost (Figure 1). When additionally considering typical medical care costs in CML, OOP costs would exceed the annual maximum of the highest-limit commercial plan ($9,200), regardless of TKI choice. In 2025, the annual OOP cost difference between later-generation TKIs and imatinib for Medicaid patients would again be $0-$24, depending on the preferred status (Table 2). In the threshold sensitivity analysis, every later-generation TKI would require a price reduction exceeding 80% to fall below even the highest commercial OOP limit (>95% to fall below the Medicare cap), indicating that patient OOP costs in 2025 were insensitive to drug price and market share in the model; only the generic-only imatinib and Mark Cuban Cost Plus price specifications for imatinib and dasatinib fell below an OOP cap at 2025 prices (Supplementary Table 2).
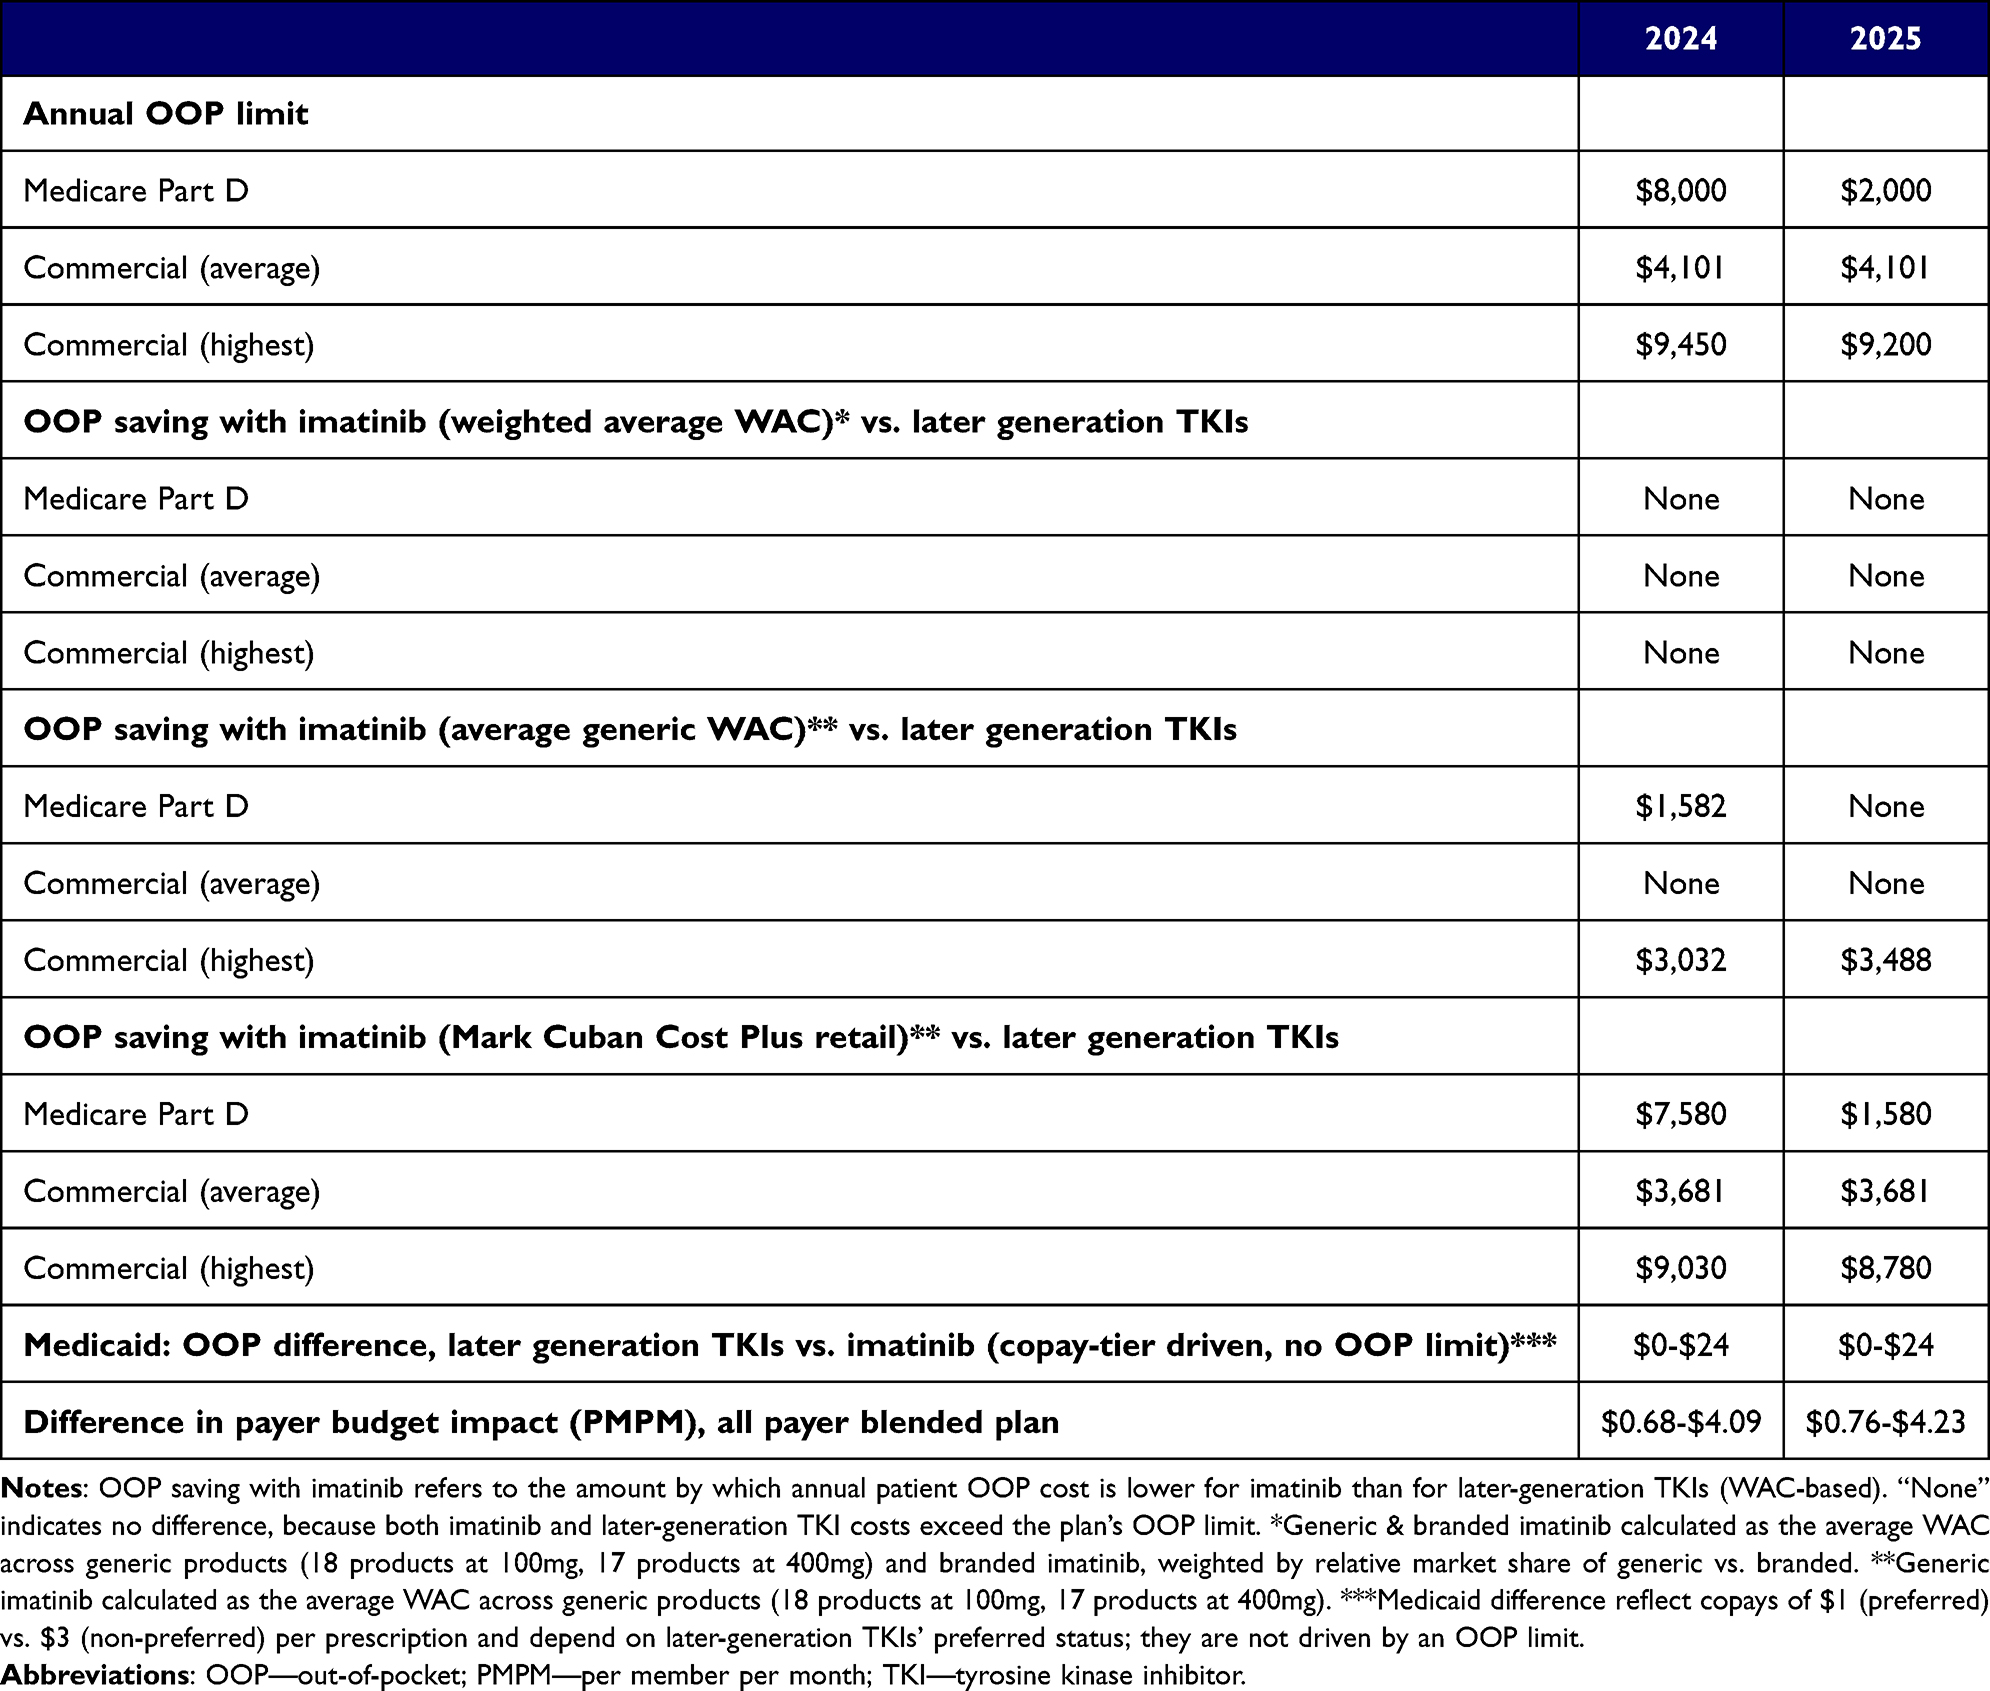 |
Table 2 Difference in Patient Out-of-Pocket Cost and Payer Budget Impact, Later Generation TKIs vs. Imatinib, by Payer, 2024 vs 2025 |
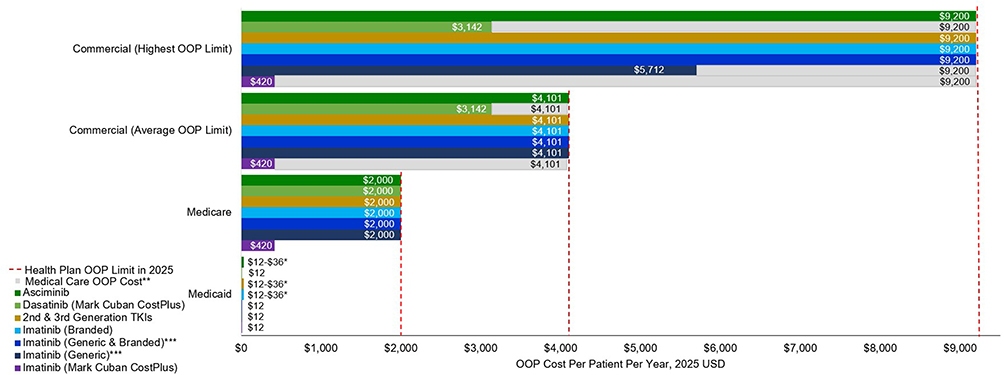 |
Figure 1 Expected per patient annual OOP cost for imatinib versus newer TKIs by payer type in 2025. *Medicaid beneficiary copays for generic and preferred brands is $1 per prescription versus $3 per prescription for non-preferred brands. Thus, annual difference in OOP costs with newer TKIs vs. imatinib ranged $0-$24, depending on newer TKIs’ preferred status. **Typical medical care OOP costs (2025 USD) under commercial plan range between $10,032/year in 1L to $26,575/year in 3L+. ***Generic & branded imatinib calculated as the average WAC across generic products (18 products at 100 mg, 17 products at 400 mg) and branded imatinib, weighted by relative market share of generic vs. branded; generic only imatinib calculated as the average WAC across generic products. Mark Cuban CostPlus imatinib represents the lowest possible retail pharmacy cost of imatinib. Abbreviations: TKI, Tyrosine Kinase Inhibitor; OOP, Out-of-Pocket. Medicare refers to Medicare Part D coverage. |
Accounting for generic dasatinib and nilotinib entry, difference in payer PMPM budget impact from imatinib in 2025 remained similar to 2024, ranging from $0.76 to $4.23 across later-generation TKIs in an all-payer blended health plan, with higher monthly premium increases for Medicare ($2.20-$12.27) compared to Medicaid ($0.58-$3.26) or commercial ($0.58-$3.22) enrollees (Table 2 and Figure 2). Comparing impact of generic vs. branded later-generation TKIs, difference in PMPM budget impact from imatinib with generic dasatinib ($0.42 in an all-payer plan) was 12.8% of that with branded dasatinib ($3.27), while difference in PMPM with generic nilotinib ($0.54) was about 12.4% of its branded form ($4.39) (Supplementary Figure 3). Overall, differences in PMPM budget impact with generic dasatinib and generic nilotinib were lower than all other branded later-generation TKIs. Other payers similarly followed this pattern (Supplementary Figure 3). In one-way sensitivity analysis varying imatinib pricing, later-generation treatment WAC ±20%, and generic availability of dasatinib and nilotinib, the all-payer PMPM budget impact of later-generation TKIs relative to imatinib across all scenarios ranged from $0.42 to $5.15 (Supplementary Table 3).
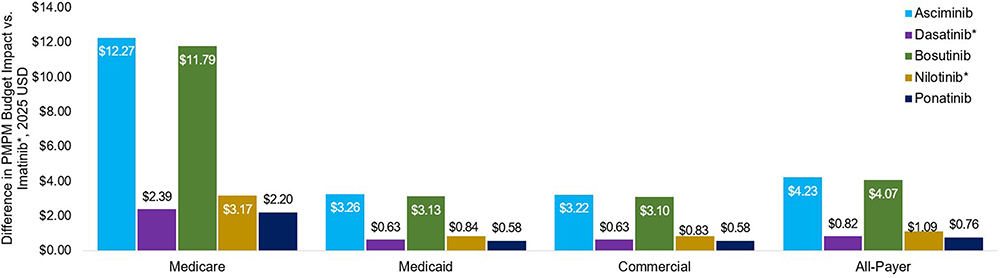 |
Figure 2 Difference in PMPM budget impact with newer TKIs vs. imatinib* by payer in 2025. *Average of generic and branded products weighted by relative market share of generic vs. branded. Calculation of PMPM budget impact for each TKI: (1) determine total US adult CML prevalence (overall and by payer), (2) apply the share of each indicated subgroup in CML (listed in Supplementary Table 1) to total adult CML prevalence to estimate prevalence of each subgroup, (3) sum prevalence across indicated subgroups to get total prevalence of indicated population, (4) apply annual per person TKI cost to indicated population prevalence to estimate PMPM budget impact. For overall and Medicare populations, total US adult CML prevalence was calculated using SEER data on total CML prevalence among all patients and among patients aged ≥65 years, with pediatric cases excluded. For Medicaid and Commercial populations, total US CML prevalence was estimated by multiplying overall number of CML patients in US from SEER by payer distribution among CML patients from literature, then dividing by total number of payer beneficiaries in US. Pediatric prevalence was excluded to obtain estimates among adults. Abbreviations: SEER, Surveillance, Epidemiology, and End Results Program; PMPM, Per Member Per Month; TKI, Tyrosine Kinase Inhibitor. |
Discussion
There is growing concern among healthcare providers about the financial burden associated with novel treatments for cancers such as CML.37 However, financial burden is rarely formally defined, making the magnitude of its impact unclear. This study quantified the impact of higher pricing associated with later generation TKIs on patients and payers as the change in patient OOP costs and insurance premiums with later-generation TKIs relative to imatinib across insured US populations with CML, before and after changes in OOP policy and TKI drug prices between 2024 and 2025.
Prior economic studies of TKI therapy in CML have focused largely on expenditure and cost-effectiveness from the payer perspective.38–42 Studies examining health plan spending on TKIs following generic imatinib entry found that overall TKI expenditures continued to rise, driven by increased use of second-generation TKIs,39,42 though other studies have found lower medical costs associated with later-generation TKIs than imatinib, suggesting cost savings that can offset higher drug acquisition costs.41 Fewer studies have examined TKI costs from the patient perspective, where real-world data analyses have found patient OOP costs in CML to be largely decoupled from the rising spending on TKIs.39,43 Our model’s results are consistent with these findings and extend them to the post-IRA period.
Our findings suggest that, for commercially insured, Medicare and Medicaid patients, TKI treatment choice will likely have little impact on OOP costs, particularly after the IRA’s recent changes to Medicare Part D OOP policies. The most significant impact was observed for patients under Medicare, prior to 2024. Medicare patients comprise over half of US patients diagnosed with CML.1 After the implementation of the IRA in 2025, this impact diminished. While Medicare patients can purchase generic imatinib at very low cost through Mark Cuban Pharmacy, Mark Cuban Pharmacy does not process insurer claims, meaning the purchase cannot count toward their annual OOP spending. Thus, patients may still choose to obtain generic imatinib through Part D if they have other high-cost medications, so the cost will contribute toward reaching their annual OOP limit. Furthermore, imatinib availability at Mark Cuban Cost Plus Drug Company and other direct-to-consumer pharmacies is more limited than that of common generic medications.44
In both 2024 and 2025, only when considering the commercial plan with the highest possible OOP limit under ACA and generic-only imatinib did we find a lower OOP impact with imatinib relative to later-generation TKIs. Given that the typical OOP costs for CML-related medical care alone would exceed commercial annual OOP limits, there would likely be little change in patient financial burden even in these scenarios. Similarly, the differences in patient financial impact between newer TKIs and imatinib across payers were relatively modest.44 It is important to note, however, that insurance plan design varies across and within payer types. Patients enrolled in plans with higher deductibles, higher cost-sharing tiers for specialty medications, or more restrictive formulary placement of certain TKIs may face meaningfully different OOP exposure than the average plan parameters modeled here. For example, a commercially insured patient in a high-deductible health plan may bear a greater share of drug costs before reaching their OOP maximum, and formulary tier placement, which determines whether a TKI is subject to preferred or non-preferred cost-sharing, can vary by plan and employer. Patients with lower annual medical care costs who do not reach their OOP maximum through non-pharmacy spending may also be more sensitive to differences in drug pricing across TKIs. These sources of variation suggest that while TKI choice is unlikely to affect OOP costs for most insured patients, individual plan design remains an important consideration in assessing patient financial burden.
A key takeaway from these results is that providers have greater flexibility in prescribing the most appropriate TKI without risking major adverse financial impact to the patient. The drawback is that the financial burden of prescribing newer, more efficacious but more costly TKIs would shift to payers, potentially increasing premiums. However, the impact of CML treatment choice on health plan premiums is likely to be relatively modest, largely because CML is a relatively rare cancer. Payers may be concerned that covering multiple oncology treatments for a rare cancer like CML may increase healthcare costs. Although outside the scope of this study, this is a valid concern and should be investigated in future research on financial impact to payers, including long term healthcare utilization and costs.
Limitations
First, the analysis assumed that patients are fully responsible for 100% prescription drug costs until they reach their OOP maximum, without accounting for the variations in copayments, coinsurance or tiered formulary structures. This simplifying assumption was made to focus the results on the difference in patient OOP burden between the TKIs given the payer OOP policies, rather than to model the individual patient circumstances. Therefore, with this approach, the study shows what the maximum potential OOP burden to the patient would be across the TKIs. Second, the cost impact of later-generation TKIs based on WACs was compared to that of generic imatinib from Mark Cuban Pharmacy based on the retail price. Although WACs and retail prices are not directly comparable, neither pricing approach accounted for rebates or insurer-negotiated discounts, increasing their comparability within the context of this analysis. Third, this analysis did not consider payer-negotiated rebates or manufacturer assistance programs (MAPs); thus, actual cost differentials between newer TKIs and imatinib for payers and patients may be smaller than estimated in this study. The analysis also did not consider Medigap or Medicare supplemental insurance, which would further reduce patient OOP costs. Fourth, the population size of adult patients with CML indicated for TKI treatment in this study was estimated by extrapolating the proportion of Ph+ CML adult patients by line of therapy and applying this proportion to the total number of patients with CML in the US, and thus may be larger than the actual US population of patients with CML receiving TKIs. Fifth, providers may also have increasing incentives to consider treatment costs themselves, due to value-based programs such as the Enhancing Oncology Model (EOM).45 This study did not, however, evaluate impact of provider bonus payments through EOM. Sixth, the conclusions of this study were derived from an economic model rather than real-world claims or utilization data. Patient OOP costs and payer budget impact were estimated using published WAC prices, standard plan design parameters, and population prevalence estimates, and as such reflect modeled projections under defined assumptions. Seventh, this analysis assumed that generic dasatinib and nilotinib would achieve market share penetration comparable to generic imatinib. Actual uptake may differ because of patent timelines, the number of generic entrants, formulary decisions, and the competitive landscape at generic entry. If uptake is slower than assumed, the estimated PMPM budget impact for these agents would be higher; more rapid uptake would lower it. However, our sensitivity analyses show this uncertainty does not change the study’s conclusions. Across scenarios, the PMPM budget impact remains modest, and relative ordering of treatments was preserved. Patient OOP cost findings for WAC-based prices are unaffected, as all later-generation TKI exceed annual OOP limits regardless of generic status. Eighth, this study does not evaluate whether and at what level of OOP maximum is optimal. Lower OOP maximums are good for patients as they insulate them from high cost during their disease but also may cause moral hazard, incentivizing patients to select treatments that impose higher financial burdens on other components of the healthcare system. Evaluating the optimality of current insurance benefit design is outside the scope of this analysis but should be considered in the future. Finally, this analysis was conducted within the context of the US healthcare and insurance system; findings may not be generalizable to other countries, particularly those with government-funded drug coverage programs where patient cost-sharing structures and drug pricing mechanisms differ substantially from those in the US.
Conclusion
In part due to recent policy reforms, choice of CML treatment may have little meaningful impact on OOP costs among insured US patients with CML. However, it should be acknowledged that the use of WAC-based pricing in this analysis does not account for payer-negotiated rebates or manufacturer discounts, which may have little meaningful impact on OOP costs among insured US patients with CML, while the financial experience of individual patients may vary with different insurance benefit coverage. Moreover, CML is a relatively rare cancer and, thus, the impact of CML treatment choice on health plan premiums may be relatively modest. Thus, healthcare providers may have greater flexibility in prescribing the most appropriate TKI without concerning major adverse financial impact to the patients. Future real-world studies incorporating net drug prices, actual patient cost-sharing data, and diverse insurance plan structures are recommended to validate these findings and further characterize the financial impact of TKI treatment selection across the full spectrum of insured US patients with CML.
Abbreviations
CML, Chronic Myeloid Leukemia; TKI(s), Tyrosine Kinase Inhibitor(s); Ph+, Philadelphia chromosome-positive; STAMP, Specifically Targeting the ABL Myristoyl Pocket; 1L, First-line; 2L, Second-line; 3L+, Third-line or later; OOP, Out-of-Pocket; PPPY, Per Patient Per Year; WAC, Wholesale Acquisition Cost; PMPM, Per Member Per Month; MAP(s), Manufacturer Assistance Program(s); IRA, Inflation Reduction Act; ACA, Affordable Care Act; CMS, Centers for Medicare & Medicaid Services; SEER, Surveillance, Epidemiology, and End Results Program; EOM, Enhancing Oncology Model; KFF, Kaiser Family Foundation; FDA, Food and Drug Administration; ASH, American Society of Hematology; BID, Two times a day; QD, Once a day.
Data Sharing Statement
The authors confirm that the data supporting the findings of this study are available within the article and its supplementary materials.
Acknowledgments
No assistance in the preparation of this article is to be declared. Results of this study were presented in a poster presentation at ASH 2024 Annual Meeting, December 7–10, 2024, San Diego, California.
Author Contributions
All authors made a significant contribution to the work reported, whether that is in the conception, study design, execution, acquisition of data, analysis and interpretation, or in all these areas; took part in drafting, revising or critically reviewing the article; gave final approval of the version to be published; have agreed on the journal to which the article has been submitted; and agree to be accountable for all aspects of the work.
Funding
This study was sponsored by Novartis.
Disclosure
PP and DW are employees of and own stocks from Novartis. JS, NZ, SZ are employees of FTI Consulting, which received payment from Novartis for contracted analyses. JV receives consulting fees from Novartis, DISC Medicine, Takeda Pharmaceuticals, Cogent Biotherapeutics. She also reports data safety/advisory board participation for Sanofi, Incyte, Cogent Therapeutics, DISC Therapeutics, Takeda, outside the submitted work. The authors report no other conflicts of interest in this work.
References
1. Jabbour E, Kantarjian H. Chronic myeloid leukemia: 2025 update on diagnosis, therapy, and monitoring. Am J Hematol. 2024;99(11):2191–12. doi:10.1002/ajh.27443
2. American Cancer Society. Key Statistics for Chronic Myeloid Leukemia. Available from: https://www.cancer.org/cancer/types/chronic-myeloid-leukemia/about/statistics.html.
3. Hochhaus A, Baccarani M, Silver RT, et al. European LeukemiaNet 2020 recommendations for treating chronic myeloid leukemia. Leukemia. 2020;34(4):966–984. doi:10.1038/s41375-020-0776-2
4. Senapati J, Sasaki K, Issa GC, et al. Management of chronic myeloid leukemia in 2023–common ground and common sense. Blood Cancer J. 2023;13(1):58. doi:10.1038/s41408-023-00823-9
5. Jabbour E, Makenbaeva D, Lingohr-Smith M, Lin J. Use of real-world claim databases to assess prevalence of comorbid conditions relevant to the treatment of chronic myelogenous leukemia based on national comprehensive network treatment guidelines. Clin Lymphoma Myeloma Leukemia. 2015;15(12):797–802.e1. doi:10.1016/j.clml.2015.09.008
6. Kantarjian HM, Hughes TP, Larson RA, et al. Long-term outcomes with frontline nilotinib versus imatinib in newly diagnosed chronic myeloid leukemia in chronic phase: eNESTnd 10-year analysis. Leukemia. 2021;35(2):440–453. doi:10.1038/s41375-020-01111-2
7. Leukemia EiCM. The price of drugs for chronic myeloid leukemia (CML) is a reflection of the unsustainable prices of cancer drugs: from the perspective of a large group of CML experts. Blood. 2013;121(22):4439–4442. doi:10.1182/blood-2013-03-490003.
8. Burns EJ, Paul S, Lee S, et al. Financial Toxicity and Quality of Life Among People with Chronic Myeloid Leukemia on Tyrosine Kinase Inhibitors. American Society of Clinical Oncology; 2023.
9. Dusetzina SB, Winn AN, Abel GA, Huskamp HA, Keating NL. Cost sharing and adherence to tyrosine kinase inhibitors for patients with chronic myeloid leukemia. J Clin Oncol. 2014;32(4):306–311. doi:10.1200/JCO.2013.52.9123
10. Winn AN, Keating NL, Dusetzina SB. Factors associated with tyrosine kinase inhibitor initiation and adherence among Medicare beneficiaries with chronic myeloid leukemia. J Clin Oncol. 2016;34(36):4323–4328. doi:10.1200/JCO.2016.67.4184
11. Shankaran V. Mitigating the morbidity of financial toxicity in cancer care. J Adv Pract Oncol. 2021;12(3):271. doi:10.6004/jadpro.2021.12.3.10
12. Narra RK, Flynn KE, Atallah E. Chronic myeloid leukemia—the promise of tyrosine kinase inhibitor discontinuation. Curr Hematol Malig Rep. 2017;12:415–423. doi:10.1007/s11899-017-0404-z
13. Sayed BA, Anders Olsen KF,T, Kaavya A, Sarah S, Steven S. Medicare Part D Enrollee Out-Of-Pocket Spending. Recent Trends and Projected Impacts of the Inflation Reduction Act. 2023. https://aspe.hhs.gov/sites/default/files/documents/1b652899fb99dd7e6e0edebbcc917cc8/aspe-part-d-oop.pdf.
14. Medicare DB. Medicaid, and Commercial Payers. RCM Centric. Available from: https://help.rcmcentric.com/difference-between-medicare-medicaid-and-commercial-payers/.
15. Texas Health and Human Services. Data Overview. Available from: https://www.dshs.texas.gov/prescription-drug-price-disclosure-program/data-overview.
16. Redbook Online™. Truven Health Analytics; 2024.
17. Analysource. 2025. https://www.analysource.com/.
18. U.S. Food & Drug Administration. Data From: FDA Label Database; 2025.
19. Campbell D, Blazer M, Bloudek L, Brokars J, Makenbaeva D. Realized and projected cost-savings from the introduction of generic imatinib through formulary management in patients with chronic myelogenous leukemia. American Health Drug Benefits. 2019;12(7):333.
20. Mark Cuban CostPlus Drug Company. Available from: https://www.costplusdrugs.com/medications/imatinib-400mg-tablet/.
21. Apotex. Available from: https://www.apotex.com/us/about-us/news/2024/09/05/apotex-corp.-is-the-first-generic-manufacturer-to-launch-dasatinib-tablets-in-the-united-states.
22. Apotex Inc. Apotex launches nilotinib capsules, the first generic version of Tasigna®(1) in the United States, with 180 days of exclusivity. Available from: https://www.prnewswire.com/news-releases/apotex-launches-nilotinib-capsules-the-first-generic-version-of-tasigna1-in-the-united-states-with-180-days-of-exclusivity-302465840.html.
23. Bosi GR, Fogliatto LM, Costa TEV, et al. What happens to intolerant, relapsed or refractory chronic myeloid leukemia patients without access to clinical trials? Hematol Transfus Cell Ther. 2019;41(3):222–228. doi:10.1016/j.htct.2018.11.005
24. Sasaki K, Haddad FG, Short NJ, et al. Outcome of Philadelphia chromosome-positive chronic myeloid leukemia in the United States since the introduction of imatinib therapy—The Surveillance, Epidemiology, and End Results database, 2000–2019. Cancer. 2023;129(23):3805–3814. doi:10.1002/cncr.35038
25. Kota VK, Wei D, Yang D, et al. Treatment Patterns and Modifications of Tyrosine Kinase Inhibitors (TKI) Therapy in Early Lines in Patients with Chronic Myeloid Leukemia in Chronic Phase (CML-CP): real-World Analysis from a Large Commercial Claims Database in the United States (US). Blood. 2023;142:5190. doi:10.1182/blood-2023-180789
26. SEER*Explorer: an interactive website for SEER cancer statistics [Internet]. Surveillance Research Program, National Cancer Institute. Available from: https://seer.cancer.gov/statistics-network/explorer/.
27. Huret JL. Complex translocations, simple variant translocations and Ph-negative cases in chronic myelogenous leukaemia. Hum Genet. 1990;85(6):565–568. doi:10.1007/bf00193575
28. Centers for Medicare & Medicaid Services. Lower out-of-pocket drug costs in 2024 and 2025. Available from: https://www.cms.gov/files/document/lower-out-pocket-drug-costs-2024-and-2025-article.pdf.
29. KFF. 2023 Employer Health Benefits Survey. Available from: https://www.kff.org/report-section/ehbs-2023-section-7-employee-cost-sharing/.
30. Health Insurance Marketplace. Out-of-pocket maximum/limit. Available from: https://www.healthcare.gov/glossary/out-of-pocket-maximum-limit/#:~:text=The%20out%2Dof%2Dpocket%20limit%20for%20Marketplace%20plans%20varies%2C,an%20individual%20and%20$18%2C400%20for%20a%20family.
31. New York State Department of Health. Benefits and Coverage. Available from: https://member.emedny.org/pharmacy/benefits.
32. California Department of Health Care Services. Medi-Cal Eligibility & Covered California - FAQ’s. Available from: https://www.dhcs.ca.gov/services/medi-cal/eligibility/Pages/Medi-CalFAQs2014a.aspx.
33. Perry AM, Brunner AM, Zou T, et al. Association between insurance status at diagnosis and overall survival in chronic myeloid leukemia: a population-based study. Cancer. 2017;123(13):2561–2569. doi:10.1002/cncr.30639
34. LNB KK-S. Health Insurance Coverage in the United States: 2023. 2024. https://www2.census.gov/library/publications/2024/demo/p60-284.pdf.
35. McGarry LJ, Chen YJ, Divino V, et al. Increasing economic burden of tyrosine kinase inhibitor treatment failure by line of therapy in chronic myeloid leukemia. Curr Med Res Opin. 2016;32(2):289–299. doi:10.1185/03007995.2015.1120189
36. Atallah EL, Maegawa R, Latremouille-Viau D, et al. Chronic myeloid leukemia: part i—real-world treatment patterns, healthcare resource utilization, and associated costs in later lines of therapy in the United States. J Health Econ Outcomes Res. 2022;9(2):19. doi:10.36469/jheor.2022.36975
37. Zafar SY, Abernethy AP. Financial toxicity, part I: a new name for a growing problem. Oncology. 2013;27(2):80.
38. Padula WV, Larson RA, Dusetzina SB, et al. Cost-effectiveness of tyrosine kinase inhibitor treatment strategies for chronic myeloid leukemia in chronic phase after generic entry of imatinib in the United States. J Natl Cancer Inst. 2016;108(7):djw003. doi:10.1093/jnci/djw003
39. Kenzik KM, Bhatia R, Bhatia S. Expenditures for first-and second-generation tyrosine kinase inhibitors before and after transition of imatinib to generic status. JAMA Oncol. 2020;6(4):542–546. doi:10.1001/jamaoncol.2019.6390
40. Lyman GH, Henk HJ. Association of generic imatinib availability and pricing with trends in tyrosine kinase inhibitor use in patients with chronic myelogenous leukemia. JAMA Oncol. 2020;6(12):1969–1971. doi:10.1001/jamaoncol.2020.4660
41. Smith TA, Verma S, Liu Y, Sikirica S, Janjan NA. Retrospective real-world comparison of clinical and economic burden between first-generation and second-generation tyrosine kinase inhibitors (TKIs) in chronic myeloid leukemia (CML). J Clin Oncol. 2021;39(15_suppl):e19030–e19030. doi:10.1200/JCO.2021.39.15_suppl.e19030
42. Wilkes JJ, Lyman GH, Doody DR, et al. Health care cost associated with contemporary chronic myelogenous leukemia therapy compared with that of other hematologic malignancies. JCO Oncol Pract. 2021;17(3):e406–e415. doi:10.1200/OP.20.00143
43. Talon B, Calip GS, Lee TA, Sharp LK, Patel P, Touchette DR. Trend in tyrosine kinase inhibitor utilization, price, and out-of-pocket costs in patients with chronic myelogenous leukemia. JCO Oncol Pract. 2021;17(11):e1811–e1820. doi:10.1200/op.20.00967
44. Lalani HS, Tessema FA, Kesselheim AS, Rome BN. Availability and cost of expensive and common generic prescription drugs: a cross-sectional analysis of direct-to-consumer pharmacies. J Gen Intern Med. 2024;39(12):2187–2195. doi:10.1007/s11606-024-08623-y
45. Centers for Medicare & Medicaid Services. Enhancing Oncology Model. Available from: https://www.cms.gov/priorities/innovation/innovation-models/enhancing-oncology-model.
 © 2026 The Author(s). This work is published and licensed by Dove Medical Press Limited. The
full terms of this license are available at https://www.dovepress.com/terms
and incorporate the Creative Commons Attribution
- Non Commercial (unported, 4.0) License.
By accessing the work you hereby accept the Terms. Non-commercial uses of the work are permitted
without any further permission from Dove Medical Press Limited, provided the work is properly
attributed. For permission for commercial use of this work, please see paragraphs 4.2 and 5 of our Terms.
© 2026 The Author(s). This work is published and licensed by Dove Medical Press Limited. The
full terms of this license are available at https://www.dovepress.com/terms
and incorporate the Creative Commons Attribution
- Non Commercial (unported, 4.0) License.
By accessing the work you hereby accept the Terms. Non-commercial uses of the work are permitted
without any further permission from Dove Medical Press Limited, provided the work is properly
attributed. For permission for commercial use of this work, please see paragraphs 4.2 and 5 of our Terms.
Recommended articles

Asciminib in the Treatment of Philadelphia Chromosome-Positive Chronic Myeloid Leukemia: Focus on Patient Selection and Outcomes
Hijiya N, Mauro MJ
Cancer Management and Research 2023, 15:873-891
Published Date: 23 August 2023