Back to Journals » Clinical Epidemiology » Volume 15
An Evaluation of Different Strategies for Sampling Controls in an Online Case-Crossover Study of Acute Flares in Knee Osteoarthritis
Authors Rathod-Mistry T ![]() , Peat G
, Peat G ![]() , Neogi T, Thomas MJ
, Neogi T, Thomas MJ ![]()
Received 21 December 2022
Accepted for publication 19 April 2023
Published 16 May 2023 Volume 2023:15 Pages 635—644
DOI https://doi.org/10.2147/CLEP.S401488
Checked for plagiarism Yes
Review by Single anonymous peer review
Peer reviewer comments 2
Editor who approved publication: Professor Henrik Toft Sørensen
Trishna Rathod-Mistry,1 George Peat,2,3 Tuhina Neogi,4 Martin J Thomas2,5
1Centre for Statistics in Medicine, Nuffield Department of Orthopaedics, Rheumatology, and Musculoskeletal Sciences, University of Oxford, Oxford, UK; 2Primary Care Centre Versus Arthritis, School of Medicine, Keele University, Staffordshire, UK; 3Centre for Applied Health & Social Care Research (CARe), Sheffield Hallam University, Sheffield, UK; 4Department of Medicine, Section of Rheumatology, Boston University School of Medicine, Boston, MA, USA; 5Haywood Academic Rheumatology Centre, Midlands Partnership University NHS Foundation Trust, Haywood Hospital, Staffordshire, UK
Correspondence: Martin J Thomas, Primary Care Centre Versus Arthritis, School of Medicine, Keele University, Staffordshire, ST5 5BG, UK, Tel +44 1782 734874, Fax +44 1782 734719, Email [email protected]
Objective: To evaluate bias and precision of exposure-outcome effect estimates from three control sampling strategies in a case-crossover study.
Methods: Online case-crossover study investigating eight physical activity-related triggers for acute flares in knee osteoarthritis. Exposures were measured in hazard periods (≤ 24 hours before self-declared flare onset). Control period exposure was measured in three ways: (1) four scheduled questionnaires over 13-weeks, (2) “usual” physical activity levels ascertained at baseline, (3) over three days before flare onset. Derived odds ratios, 95% confidence intervals and standard errors were compared.
Results: Of 744 participants (mean age 62.1 [SD 10.2] years; 61% female), 493 reported 714 flares. Selecting controls from scheduled questionnaires, independent of hazard periods, yielded predominantly odds ratios in the expected direction (exposure “a lot” versus exposure “not at all”, range: 0.57– 3.22). When controls were sampled at baseline (range: 0.01– 1.42) or immediately before a flare (range: 0.30– 1.27) most odds ratio estimates were inverted. Standard errors of the log odds ratios were smallest when controls were sampled from scheduled questionnaires (range: 0.264– 0.473) compared to controls sampled at baseline (range: 0.267– 0.589) or immediately before a flare (range: 0.319– 0.621).
Conclusion: Our findings are sensitive to control sample selection. Under certain conditions, different patterns could be attributed to over reporting and social desirability bias, where people may want to present themselves more positively about their “usual” physical activity levels, at baseline. Exposure measurement at the time of a flare may be less precise and more susceptible to recall bias due to systematically reporting exposures differently during a flare, compared to control measurement independent of flares.
Keywords: osteoarthritis, flare, pain, case-crossover, sampling, knee
Introduction
The case-crossover is an efficient study design to estimate the effect of transient exposure on acute outcome. This self-controlled design has key advantages including no time-invariant confounding and no requirement of unexposed individuals. This is achieved by measuring exposure over a set period prior to the outcome (hazard), and then comparing this exposure measurement at other periods (controls) when the outcome did not occur, within the same individual.1
Differential information bias may arise if recall of exposure differs within the hazard and control periods. Various control sampling strategies may be employed to ensure the exposure distribution best represents the expected exposure distribution while at risk of the outcome during the hazard periods. Exposure can be measured over a short interval of time for both control and hazard periods, or for control samples, over longer intervals by capturing data on “usual” exposure frequency.1,2
Few studies have evaluated the influence of control sampling strategy on exposure-outcome effect estimates. Studies comparing a pair-matched interval approach with the usual frequency approach3–5 found that the latter approach yielded greater precision with exposure effect estimates in the same direction in both approaches. A similar finding was also observed by Bond et al6 constructing 1095 six-hour control periods over the past year (usual frequency approach) which yielded greater precision in estimates and mostly smaller exposure effect estimates than using a single control (pair-matched interval approach). Mittleman et al3 also found increasing the number of control periods (multiple intervals matched approach) led to greater precision in exposure effect estimates than using a single control in the pair-matched interval approach. Similarly, Möller et al7 observed that sampling controls 24-48 hours prior to the hazard period in a pair-matched interval approach yielded larger exposure effect estimates and standard errors than multiple controls sampled independently of the hazard period.
We sought to contribute new empirical evidence to this sparse evidence base using data from an online case-crossover study of triggers for acute flares in knee osteoarthritis. The ACT-FLARE study8 was intentionally designed to incorporate several control sampling strategies. In this analysis, we compare the direction, magnitude, and precision of exposure effects for eight self-reported physical exposures obtained from three control sampling strategies: (i) usual frequency measurement at baseline, (ii) scheduled measurement, and (iii) event-driven measurement, and critically reflect on implications for bias and efficient use of resources in the future design of similar studies.
Methods
Data Source
The ACT-FLARE case-crossover study recruited adults aged ≥40 years with knee pain and/or knee osteoarthritis from 15 general practices, local communities, and social media advertisement in England. Ethical approval was obtained from Yorkshire & The Humber-Leeds East Research Ethics Committee (REC reference number: 18/YH/0075). After consenting, participants completed a Baseline questionnaire including questions on descriptive characteristics and “usual” levels of physical activity exposures. Participants were then invited to complete four Scheduled follow-up questionnaires at 1-, 5-, 9- and 13-weeks. This included questions on physical activity exposures on the day of completion and three days prior. At any point over the 13-week study, participants could report an acute flare and complete an Event-Driven questionnaire capturing information on the flare and physical activity exposures on the day of flare and three days prior.8
Exposures
Our focus was on nine physical activities that were well-completed across the three questionnaire types and for which there is consensus on the anticipated direction of association. Exposure to one physical activity, going up and down ladders, was rare (4%) and dropped from further analysis leaving eight physical activity exposures. The question on exposure frequency differed slightly across the three questionnaires but response options were consistent (Figure 1).
 |
Figure 1 Exposure measurement in the ACT-FLARE study.8 The exposure frequency question wording was slightly different across the Baseline, Scheduled and Event-Driven questionnaires. The response options for each of the exposures measured were consistent. |
Outcome Definition
A self-reported flare was defined as a sudden onset of worsening signs and symptoms, lasting for at least 24 hours.8,9
Selection of Hazard Periods
In the Event-Driven questionnaires, exposures measured on the day of the flare represented the hazard period. Participants could report ≥1 flare during the study and therefore potentially contribute multiple hazard periods.
Selection of Control Periods
Exposures measured in the hazard period were compared with exposures measured during the control periods (when no flare occurred). Three control strategies were considered:
Strategy 1: Four Scheduled questionnaires, with exposures measured on day of questionnaire completion.
Strategy 2: Baseline questionnaire, measuring “usual” frequency of exposure.
Strategy 3: Event-Driven questionnaire, with exposures measured on days one, two, and three prior to flare occurrence.
Timing of hazard and control periods are illustrated in Figure 2. The primary analysis of the ACT-FLARE study9 utilised the four Scheduled questionnaires as the control sampling strategy, ie multiple intervals matched approach. This was more likely to yield greater precision due to matching on several controls compared to one control, and be independent of hazard periods compared to the “usual” frequency at Baseline and the Event-Driven questionnaires, where self-reported exposure data may be influenced whilst having a flare. Although we believed this to be the least biased strategy it is the most burdensome for researcher administration and participants. The Scheduled questionnaire was considered the referent control strategy for this analysis and was therefore reported first in the subsequent analyses.
 |
Figure 2 Schematic representation of the three control period sampling strategies employed in the ACT-FLARE study.8 Strategy 1 represents a participant who reported a flare and provided bi-directional control exposure measurements by completing 4 Scheduled questionnaires; strategy 2 represents a participant who reported a flare and provided control exposure measurement from the Baseline questionnaire; strategy 3 represents a participant who reported a flare and provided control measurement as part of the same Event-Driven questionnaire. |
Statistical Analysis
For the primary analysis, one hazard period per participant was matched to one control period (1:1 matching, pair-matched interval approach), to ensure any differences observed between the three control strategies was not due to differing number of control and hazard periods across exposures. For each participant, the first reported flare was taken as the hazard period to ensure the frequency exposure distribution in the hazard period was the same across all three control sampling strategies. Whilst the Baseline questionnaire and the Event-Driven questionnaire provided one control period each, for the Scheduled questionnaire, up to four control periods were potentially available. The first completed Scheduled questionnaire was selected as the control period. This was deemed acceptable as approximately 50% of controls were assessed both before and after a hazard period across all eight physical activity exposures. For each physical activity exposure, the same hazard periods were analysed and sample size was constant across the three control strategies.
In the analysis of discordant pairs in case-crossover studies, conditional logistic regression is a standard approach that has advantages of incorporating m:n matching and modelling exposure with more than two category levels, unlike the Mantel-Haenszel estimator that is restricted to binary exposure.3,10,11 Odds of exposure compared between the hazard and control periods yielded odds ratios and 95% confidence intervals. Standard errors of the log odds ratio were also estimated. Estimates were compared across the three control sampling strategies. Discordant pairs underpinning the conditional logistic regression analysis were also tabulated to examine patterns. Analyses were performed in Stata v16.0 (Stata Corporation, Texas, USA).
Four sensitivity analyses were performed following the primary analysis. First, many–to-many matching (m:n matching, multiple intervals matched approach) allows all available hazard and control periods to be included, analysing the maximum available data. Using up to four Scheduled questionnaires as controls were accounted for using m:n matching. When the baseline questionnaire was utilised as a single control, m:1 matching was performed. A single control measured one day prior to day of flare occurrence measured via the Event-Driven questionnaire was matched to day of flare occurrence (1:1 matching, pair-matched interval approach). Across the three control strategies, the sample size for controls naturally differed. Second, control period selection was restricted to only those measured prior to hazard periods, ie unidirectional sampling to examine time trends in exposure.2 This restriction was only applicable for the analysis using Scheduled questionnaires. Third, the analysis was re-run with the exclusion of participants who reported to be experiencing a flare at Baseline, which could influence how initial questionnaires were answered. Fourth, we redefined the hazard period to one day before the day of the flare occurrence to ensure all exposures had occurred prior to flare occurrence and exposures in the control period were measured two days prior to flare occurrence. The fourth sensitivity analysis using the Event-Driven questionnaires, was extended to include two and three days prior to the day of flare occurrence to further examine induction time.
Results
744 eligible adults consented to participate and completed the Baseline questionnaire between July 2018 and February 2019 (mean age [standard deviation (SD)] 62.1 [10.2] years; 61% female; mean body mass index 29.2 (SD: 5.7) kg/m2). Forty-four percent were employed, 43% were retired. The majority (36%) had knee pain for between 1–4 years, but pain for <1 year, 5–9 years and ≥10 years was also common, 16%, 18% and 27% respectively. Sixty-eight percent had consulted a General Practitioner for knee pain in the last 12 months and 32% had consulted a physiotherapist. Based on self-reported physical activity, 37% of the sample were “inactive”.9 During the study period, 714 flares were reported from 493 participants who completed Event-Driven questionnaires. In the primary analysis, between 346 and 356 participants were analysed for each exposure. Half of scheduled control periods (48–50%) occurred prior to flare onset.
Across the three control sampling strategies, the most common exposures reported “a lot” were sitting for long periods without a break (23.0–30.9%), going up and down stairs (21.0–39.9%) and walking outside without a rest (16.3–29.3%) (Figure 3).
 |
Figure 3 Exposure frequencies across the three control sampling strategies. CSS1: Control sampling strategy 1: Four Scheduled questionnaires, with exposures measured on day of questionnaire completion. CSS2: Control sampling strategy 2: Baseline questionnaire, measuring “usual” frequency of exposure. CSS3: Control sampling strategy 3: Event-Driven questionnaire, with exposures measured one day prior to flare occurrence. |
Using 1:1 matching (paired-matched interval approach) yielded sets of estimates for the eight physical activity exposures that appeared to be systematically different across the three sampling control strategies (Figure 4; Table 1; Table S1). For the sampling strategy using the Scheduled questionnaires, most odds ratio estimates were positive (>1). Conversely, when control periods were sampled from the Baseline questionnaire and from within the Event-Driven questionnaire odds ratio estimates <1 were most commonly observed. Difference in the precision of estimates were modest but favoured the Scheduled questionnaire due to the higher number of discordant pairs (Figure 4).
 |
Table 1 Comparison of Physical Activity Exposure Odds Ratios and Standard Errors Across Each Control Sampling Strategy (1:1 Matching, Pair-Interval Matched Approach) |
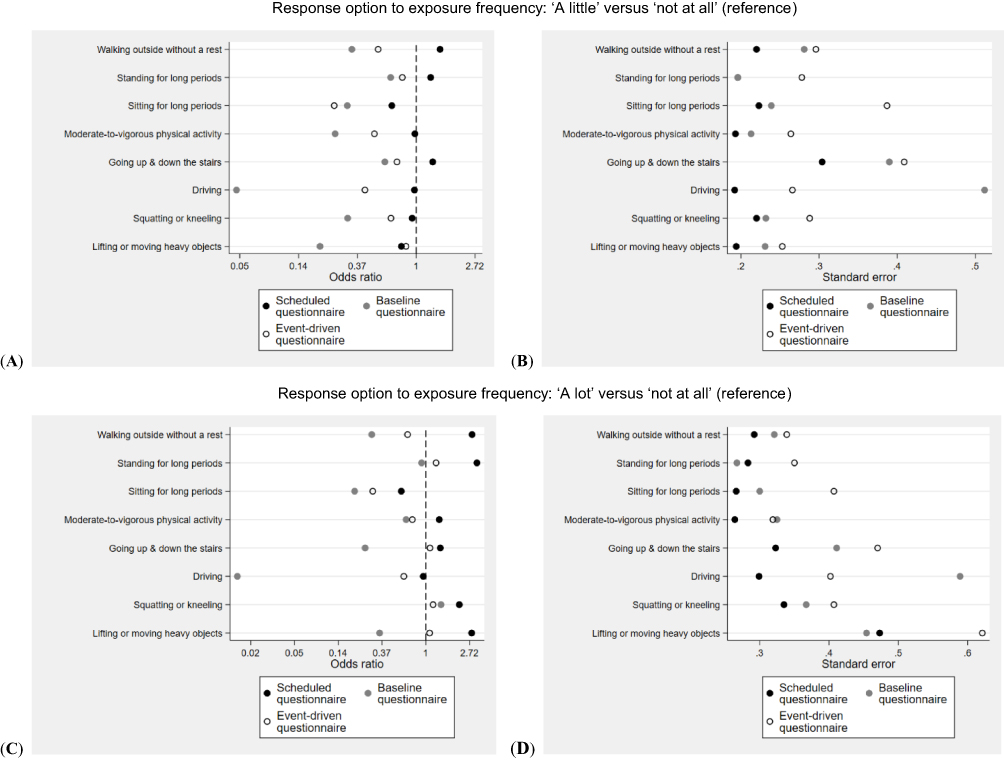 |
Figure 4 Comparison of effect estimates across the three control sampling strategies (1:1 matching). (A) odds ratio point estimates for exposure frequency: “A little” versus “not at all” (reference), (B) standard errors for exposure frequency: “A little” versus “not at all” (reference), (C) odds ratio point estimates for exposure frequency: “A lot” versus “not at all” (reference), (D) standard errors for exposure frequency: “A lot” versus “not at all” (reference). |
In sensitivity analyses using all available hazard periods and controls periods (m:n matching, multiple intervals matched approach) the patterns of exposure effect estimates and standard errors remained comparable although the standard errors were smaller from analysing a larger number of hazard and control periods (Table S2). When restricting the Scheduled Questionnaire analysis to control periods occurring before the hazard period (unidirectional sampling), derived point estimates were in the same direction, and were slightly larger in magnitude than in the primary analysis for most exposures (Table S3). Removing participants who reported having a flare when completing the Baseline questionnaire led to a slight systematic increase in the magnitude of odds ratio point estimates across most physical activity exposures, across all the control sampling strategies (Table S4). By moving the hazard period from the day of the flare to 1 day prior to flare occurrence, the odds ratio point estimates remained largely in the same direction as the primary analysis, however the magnitude varied slightly for some exposures (Table S5). Extending the Event-Driven questionnaire control period sampling, by using two and three days prior to the day of flare occurrence, yielded odds ratio point estimates in the same direction as the primary analysis. However, by sampling control periods further away from the day of flare occurrence, larger odds ratios with smaller standard errors were observed across most physical activity exposures (Table S6).
Discussion
This study demonstrates how choice of control sampling strategy may qualitatively and quantitatively affect exposure effect estimates from case-crossover analyses. By examining potential triggers for acute flares, in adults with or at risk of knee osteoarthritis, broad systematic differences were observed across sets of estimates from three control sampling strategies. Eight exposures were measured and compared, representing a range of physical activities that might be expected to vary in frequency, accuracy of recall, and strength of association. Selecting controls from Scheduled questionnaires, independent of hazard periods, yielded predominantly positive odds ratio point estimates, compared with contrasting inverse estimates when control samples were based on questions about “usual” physical activities in the cohort Baseline questionnaire, or on the day before the flare within an Event-Driven questionnaire completed at the time of the flare.
Relative to the Scheduled questionnaire sampling strategy, the Baseline questionnaire and the Event-Driven questionnaire approaches may be subject to bias. Based on the observations of discordant pairs (Table S1), it appears participants systematically over-report their “usual” exposure frequencies at Baseline. Using self-report to examine regular physical activities is known to be vulnerable to over-reporting and social desirability bias, where respondents wish to identify themselves positively, for example as active individuals [eg12]. Consequently, use of this control sampling strategy should perhaps be avoided in circumstances where recalling answers to particular questions may be inconsistent or prone to such bias. For example, judgements around “usual” frequency of going up and down stairs may be more speculative than questions such as frequency of healthcare consultation for knee pain in the last year. Support for this interpretation in the current data is the exposure to squatting or kneeling. This question yielded positive odds ratio point estimates across all three sampling strategies. It is possible that judgements about general frequency of exposure to these provocative movements is memorable (or largely avoided) for people with knee pain and therefore more robust to question format and timing.
In the Event-Driven questionnaires reporting exposures on the day of flare onset and the three days prior whilst in the midst of a flare, where being more active is a potentially plausible explanation for flare onset, physical activity questioning is likely more vulnerable to recall bias. Similarly, during Scheduled questionnaires, completed during non-flare episodes, participants may have plausibly answered these questions when they have more time on less busy or less active days. This could also render these responses vulnerable to recall bias. However, when we observed the estimates for the Scheduled questionnaire, taking into account day of the week, overall interpretation of the pattern of estimates remained comparable (data not shown). The assumption of independence between control and hazard periods,2 is more likely to be met using Scheduled questionnaires than measuring controls over three days prior to flare onset and at baseline where some participants were known to be experiencing a flare at that time, especially when an exposure may act over a longer period of time to result in the flare.
For the sensitivity analysis extending the control sampling strategy in the Event-Driven questionnaire from one day prior to two and three days prior, the observed odds ratio patterns were consistent. One explanation for this could be that recall bias persists when having a flare, regardless of how many days the questions span, and some participants may have to think back over a longer period if they delayed reporting the flare on day of onset. Another explanation could be that the induction period for a flare was mis-specified and could last four or more days, therefore the whole induction period was not fully observed. Within our dataset, it cannot be ruled out that this vulnerability applies equally to the observed hazard period in the Event-Driven questionnaire, resulting in systematic overestimation of exposure frequency in the hazard period also.
Our analysis therefore, cautions against sampling control periods at the time of a flare (or equivalent transient outcome) in several circumstances; if exposure states are less well defined or if induction time between exposure and outcome is unknown or poorly understood; if exposure measurement questioning is potentially vulnerable to recall bias; or if the induction period and impact of recall bias are likely to vary differentially amongst a set of putative exposure measurements.
Under sensitivity analysis restrictions, time-trends in exposure or flare status at study entry did not overly affect the overall interpretation; this likely reflects the short 13 week study duration. Also by moving the hazard period from the day of the flare to 1 day prior to ensure temporal ordering between flare and exposure, observations were generally unchanged. For the Scheduled questionnaire control strategy, 1:1 matching (pair-interval matched approach) and m:n matching (multiple intervals matched approach) produced comparable odds ratio estimates. This indicates that sampling one control period per hazard period may be sufficient when approaches for collecting multiple control periods are impractical, problematic (eg, using electronic health records), or increase participant burden, although precision will likely be reduced.
Our observation that increasing the number of control periods reduces the standard error in the exposure effect measurement is consistent with previous studies of physical exertion and myocardial infarction3 and triggers of attacks of Meniere’s disease.7 In contrast, irrespective of control sampling strategies (pair or multiple intervals approaches) both Mittleman et al3 and Möller et al7 estimated exposure effects consistently in the same direction. Another notable difference was exposure measurement at Baseline. In our study, “usual” frequency of exposure was measured on a normal day as determined by the participant whereas Mittleman et al3 and Sorock et al5 measured “usual” frequency of exposure by calculating the duration of time exposed by multiplying reported usual frequency of exposure by usual duration. The “usual” frequency approach yielded greater precision in exposure effect estimates than the pair interval strategy although the converse was observed in our study for the “usual” frequency approach. Möller et al7 had a similar study design to our study whereby controls were sampled at set time points during study follow-up independently of the hazard period and over a short period of time prior to the hazard period; and had also found sampling controls independently of the hazard period yielded the smallest standard errors. Inconsistent observations across studies may be attributed to different study populations and exposure measurements. This suggests there may not be one optimal control sampling strategy; rather choice will depend on context.
Conclusion
In conclusion, derived odds ratios of exposure-outcome effect estimates in this case-crossover study appear sensitive to how control samples are assembled. Our analysis suggests that compared with a control sampling strategy of repeated prospective measurement of exposure frequency, “usual” frequency control measures at baseline, or control measures ascertained at the time of flare/outcome onset may be more vulnerable to bias.
Data Sharing Statement
The datasets used and/or analysed during the current study are available from the corresponding author on reasonable request.
Ethics Approval and Informed Consent
All study procedures were compliant with the Declaration of Helsinki. Ethical approval was obtained from Yorkshire & The Humber-Leeds East Research Ethics Committee (REC reference number: 18/YH/0075). Informed consent to participate was obtained from all participants.
Funding
Tuhina Neogi was supported by NIH K24 AR070892 and NIH P30 072571. Martin J Thomas was funded by a National Institute for Health and Care Research (NIHR) and Health Education England (HEE) Integrated Clinical Academic Programme Clinical Lectureship (ICA-CL-2016-02-014) for this project and an NIHR Development and Skills Enhancement Award (NIHR300818). This publication presents independent research funded by the NIHR. The views expressed are those of the authors and not necessarily those of the NHS, the NIHR, HEE or the Department of Health and Social Care. For the purposes of open access, the authors have applied a Creative Commons Attribution (CC BY) licence to any Author Accepted Manuscript version arising from this submission.
Disclosure
Professor George Peat reports grants from Primary Care Centre Versus Arthritis, during the conduct of the study. Professor Tuhina Neogi reports grants, consultant for Pfizer/Lilly, Novartis, and Regeneron, outside the submitted work. Dr Martin J Thomas reports grants from National Institute for Health and Care Research/Health Education England, during the conduct of the study. The authors report no other conflicts of interest in this work.
References
1. Maclure M. The Case-Crossover Design: a method for studying transient effects on the risk of acute events. Am J Epidemiol. 1991;133(2):144–153. doi:10.1093/oxfordjournals.aje.a115853
2. Mittleman MA, Mostofsky E. Exchangeability in the case-crossover design. Int J Epidemiol. 2014;43(5):1645–1655. doi:10.1093/ije/dyu081
3. Mittleman MA, Maclure M, Robins JM. Control sampling strategies for case-crossover studies: an assessment of relative efficiency. Am J Epidemiol. 1995;142(1):91–98. doi:10.1093/oxfordjournals.aje.a117550
4. Hallqvist J, Möller J, Ahlbom A, Diderichsen F, Reuterwall C, de Faire U. Does heavy physical exertion trigger myocardial infarction? A case-control analysis nested in a population-based case-referent study. Am J Epidemiol. 2000;151(5):459–467. doi:10.1093/oxfordjournals.aje.a010231
5. Sorock GS, Lombardi DA, Hauser RB, Eisen EA, Herrick RF, Mittleman MA. A case-crossover study of occupational traumatic hand injury: methods and initial findings. Am J Ind Med. 2001;39(2):171–179. doi:10.1002/1097-0274(200102)39:2<171::AID-AJIM1004>3.0.CO;2-0
6. Bond J, Ye Y, Cherpitel CJ, et al. A comparison of two case-crossover methods for studying the dose-response relationship between alcohol and injury. Contemp Drug Probl. 2014;41(1):04.
7. Möller J, Hessén-Söderman AC, Hallqvist J. Differential misclassification of exposure in case-crossover studies. Epidemiology. 2004;15(5):589–596. doi:10.1097/01.ede.0000135177.10332.42
8. Thomas MJ, Rathod-Mistry T, Harper S, et al. Acute flares of knee osteoarthritis (the ACT-FLARE study): protocol for a web-based case-crossover study in community-dwelling adult. JMIR Res Protoc. 2019;8(4):e13428. doi:10.2196/13428
9. Thomas MJ, Rathod-Mistry T, Parry EL, Pope C, Neogi T, Peat G. Triggers for acute flare in adults with, or at risk of, knee osteoarthritis: a web-based case-crossover study in community-dwelling adults. Osteoarthritis Cartilage. 2021;29(7):956–964. doi:10.1016/j.joca.2021.04.007
10. Navidi W. Bidirectional case-crossover designs for exposures with time trends. Biometrics. 1998;54(2):596–605. doi:10.2307/3109766
11. Luo X, Sorock GS. Analysis of recurrent event data under the case-crossover design with applications to elderly falls. Stat Med. 2008;27(15):2890–2901. doi:10.1002/sim.3171
12. Brenner PS, DeLamater JD. Social desirability bias in reports of physical activity: is an exercise identity the culprit? Soc Indic Res. 2014;117:489–504. doi:10.1007/s11205-013-0359-y
 © 2023 The Author(s). This work is published by Dove Medical Press Limited, and licensed under a
Creative Commons Attribution License.
The full terms of the License are available at http://creativecommons.org/licenses/by/4.0/.
The license permits unrestricted use, distribution, and reproduction in any medium, provided the
original author and source are credited.
© 2023 The Author(s). This work is published by Dove Medical Press Limited, and licensed under a
Creative Commons Attribution License.
The full terms of the License are available at http://creativecommons.org/licenses/by/4.0/.
The license permits unrestricted use, distribution, and reproduction in any medium, provided the
original author and source are credited.
Recommended articles
Development and Validation of a New Patient-Reported Outcome Measure in the Arabic Language for Patients with Knee Osteoarthritis in Saudi Arabia
Alotaibi AD, Vennu V, BinNasser AS, Idres M, Mohammed A, Aldawai H, Bindawas SM
Patient Preference and Adherence 2023, 17:187-198
Published Date: 19 January 2023
Modulation of Brain Network Topological Properties in Knee Osteoarthritis by Electroacupuncture in Rats
Zhang JP, Shen J, Xiang YT, Xing XX, Kang BX, Zhao C, Wu JJ, Zheng MX, Hua XY, Xiao LB, Xu JG
Journal of Pain Research 2023, 16:1595-1605
Published Date: 17 May 2023
Network Analysis of Osteoarthritis Progression Using a Steiner Minimal Tree Algorithm
Xie Y, Shao F, Ji Y, Feng D, Wang L, Huang Z, Wu S, Sun F, Jiang H, Miyamoto A, Wang H, Zhang C
Journal of Inflammation Research 2024, 17:3201-3209
Published Date: 18 May 2024
Transforming Growth Factor-β-Activated Kinase 1 (TAK1) Alleviates Inflammatory Joint Pain in Osteoarthritis and Gouty Arthritis Preclinical Models
Freeze R, Hughes P, Haystead T, Scarneo S
Journal of Pain Research 2024, 17:2287-2298
Published Date: 27 June 2024
Pathophysiological Insights Into the Role of Osteoclasts in Osteoarthritis: Mechanisms, Therapeutic Targets, and Future Directions
Chen S, Long Y, Guo Z, Di J, Xu J, Xiang C
Journal of Inflammation Research 2025, 18:11191-11204
Published Date: 17 August 2025