Back to Journals » ImmunoTargets and Therapy » Volume 9
Acetylcholine Regulates Pulmonary Pathology During Viral Infection and Recovery
Authors Horkowitz AP, Schwartz AV, Alvarez CA, Herrera EB, Thoman ML, Chatfield DA ![]() , Osborn KG
, Osborn KG ![]() , Feuer R, George UZ
, Feuer R, George UZ ![]() , Phillips JA
, Phillips JA ![]()
Received 1 September 2020
Accepted for publication 1 December 2020
Published 17 December 2020 Volume 2020:9 Pages 333—350
DOI https://doi.org/10.2147/ITT.S279228
Checked for plagiarism Yes
Review by Single anonymous peer review
Peer reviewer comments 3
Editor who approved publication: Professor Michael Shurin
Alexander P Horkowitz,1,2 Ashley V Schwartz,3 Carlos A Alvarez,1,2 Edgar B Herrera,1 Marilyn L Thoman,1 Dale A Chatfield,4 Kent G Osborn,5 Ralph Feuer,2 Uduak Z George,3 Joy A Phillips1
1Donald P. Shiley Biosciences Center, San Diego State University, San Diego, California, USA; 2Department of Biology, San Diego State University, San Diego, California, USA; 3Department of Mathematics and Statistics, San Diego State University, San Diego, California, USA; 4Department of Chemistry, San Diego State University, San Diego, California, USA; 5Office of Animal Research, University of California San Diego, San Diego, California, USA
Correspondence: Joy A Phillips
Donald P Shiley BioSciences Center, San Diego State University, 5500 Campanile Dr MC4650, San Diego, CA 92182-4650, USA
Tel +1 619 488 2169
Fax +1 619 0594 8184
Email [email protected]
Introduction: This study was designed to explore the role of acetylcholine (ACh) in pulmonary viral infection and recovery. Inflammatory control is critical to recovery from respiratory viral infection. ACh secreted from non-neuronal sources, including lymphocytes, plays an important, albeit underappreciated, role in regulating immune-mediated inflammation.
Methods: ACh and lymphocyte cholinergic status in the lungs were measured over the course of influenza infection and recovery. The role of ACh was examined by inhibiting ACh synthesis in vivo. Pulmonary inflammation was monitored by Iba1 immunofluorescence, using a novel automated algorithm. Tissue repair was monitored histologically.
Results: Pulmonary ACh remained constant through the early stage of infection and increased during the peak of the acquired immune response. As the concentration of ACh increased, cholinergic lymphocytes appeared in the BAL and lungs. Cholinergic capacity was found primarily in CD4 T cells, but also in B cells and CD8 T cells. The cholinergic CD4+ T cells bound to influenza-specific tetramers and were retained in the resident memory regions of the lung up to 2 months after infection. Histologically, cholinergic lymphocytes were found in direct physical contact with activated macrophages throughout the lung. Inflammation was monitored by ionized calcium-binding adapter molecule 1 (Iba1) immunofluorescence, using a novel automated algorithm. When ACh production was inhibited, mice exhibited increased tissue inflammation and delayed recovery. Histologic examination revealed abnormal tissue repair when ACh was limited.
Conclusion: These findings point to a previously unrecognized role for ACh in the transition from active immunity to recovery and pulmonary repair following respiratory viral infection.
Keywords: influenza, acetylcholine, acetylcholinesterase, inflammation, pulmonary repair, ChAT, cholinergic lymphocytes, CD4 resident memory, Iba1, Aif-1, automated algorithm, MATLAB, inflammaging, cholinergic anti-inflammatory pathway
Introduction
Although the presence of acetylcholine (ACh) in serum and blood cells of mammals has long been established,1–3 lymphocytes were only confirmed to contribute to ACh production in 1996.4 It is now understood that roughly 60% of the ACh content of whole blood is sequestered within mononuclear leukocytes (MNLs), a group that is comprised of mostly lymphocytes and a small number of monocytes.5–8 A growing body of research indicates that ACh production by cholinergic (ie, ACh-producing) lymphocytes plays a critical role in regulating systemic inflammation and immunity.8–15
Immune cells preform and store ACh in a similar fashion to neurons,8,16 allowing for quick and efficient release following appropriate stimulation. Modulation of immune responses by ACh occurs in a site- and target-specific manner. For example, vagal nerve derived norepinephrine (NE) induces ACh release from cholinergic CD4+ T cells in the spleen during experimental sepsis, whereas antiviral CD4 and CD8 cells upregulate ChAT gene expression in response to IL-21 during chronic hepatitis.17,18 B-1 cells in the peritoneal cavity release ACh in response to TLR agonists, surface Ig ligation, and cholecystokinin (CCK).19
ACh secreted from either neuronal or non-neuronal sources decreases inflammation in large part by action on local macrophages. Signal transduction via the alpha-7 nicotinic ACh receptor (α7-nAChR) decreases nuclear translocation of the NF-κB transcription factor, ultimately reducing macrophage production of the pro-inflammatory cytokine TNF.11,14,15 Ligation of α7-nAChR significantly reduces lung injury and overall mortality in septic shock models.20,21 Ligation of the α7-nAChR also inhibits inflammatory cytokine expression and injury in direct models of lung inflammation.13,16,22–25
Efficient inflammatory regulation is a crucial feature of recovery from respiratory viral infection.26 Overwhelming immune-mediated inflammation during viral illness, commonly called a “cytokine storm” results in significant lung damage and greatly increased risk of death. This is well established for influenza as well as the novel coronavirus COVID-19.27,28 Conversely, the decreased ability to properly induce and regulate inflammation displayed by the elderly is also associated with increased overall morbidity and mortality from respiratory infection.28–30
This study was designed to explore the role of cholinergic activity during respiratory viral infection, using influenza A as a model viral pathogen. Although the lungs have two endogenous sources of ACh, the vagal nerve and the bronchial epithelium,16,31,32 viral infection resulted in an influx of cholinergic lymphocytes during the latter stage of infection. These cholinergic lymphocytes could be found in direct physical contact with activated macrophages throughout the influenza-infected lung. Inhibiting ACh synthesis resulted in extended pulmonary inflammation, increased inflammatory macrophage activation, and delayed tissue repair. These findings illuminate a previously unknown role of ACh in recovery from acute respiratory viral infection, and further illuminate the non-neuronal cholinergic system as an underappreciated therapeutic target for inflammatory regulation, particularly during viral infection and recovery.16,33–36
Materials and Methods
Ethics Statement
All animal experimental protocols were approved by the Institutional Animal Care and Use Committee at San Diego State University (protocol numbers 15–06-006) and 18–06-008P) prior to initiation of experiments. Animals were given free access to food and water at all times and were cared for according to guidelines set by the American Association for Laboratory Animal Care.
Animal Experimentation
Conventional C57BL/6 and ChAT (BAC) – eGFP transgenic mice [B6.Cg-Tg (RP23-268L19-EGFP) 2 Mik/J] with endogenous choline acetyltransferase (ChAT) transcriptional regulatory elements directing eGFP expression37 were originally obtained from The Jackson Laboratory (JAX, Bar Harbor, ME) and were bred in house. Animals were used between the ages of aged 12–20 weeks. Mice were infected with mouse-adapted influenza virus A/Puerto Rico/8/34 (H1N1) (PR8) (Charles River Laboratories Avian Vaccine Services, North Franklin, CT). The HA titer of the purchased virus was 1:655,360/mL. Virus was diluted 1:75,000 in saline and animals were infected with a volume of 30 μL by insufflation.38 All animals were examined for overt indications of morbidity and weighed daily starting the day of infection. For euthanasia, animals were exposed to isofluorane until respiration ceased and death was confirmed by severing the abdominal aorta. For inhibition of ACh synthesis, Hemicholinium-3 (HC3) (Millipore Sigma, Burlington, MA) was administered via intraperitoneal (IP) injection. Animals were treated daily for 6 days, beginning 7 days post infection (dpi). Each animal was administered 100 μL of a 10 μg/mL HC3 solution dissolved in PBS for a final dose of 1 μg of HC3 daily. Control animals were administered 100 μL of sterile PBS by IP injection on the same days.
Flow Cytometry
Following euthanasia, lungs were lavaged with 1 mL of sterile PBS.38 Cell counts were immediately collected using an Accuri C6 flow cytometer (Accuri Cytometers, Ann Arbor, MI) prior to centrifugation and separation of the cell pellet from the cell-free bronchial alveolar lavage (BAL) fluid. Lungs were removed, processed, and stained for flow cytometry as in.38 Flow cytometry antibodies used in this study were 1A8-FITC (BD PharMingen, San Jose, CA), CD4-APC, CD8-PE/Cy5, B220-PE (eBioscience, San Diego, CA), CD11b-APC (BioLegend, San Diego, CA), CD11c-PE/Cy5 (Tonbo Bioscience, San Diego, CA). To examine influenza specificity, lung and BAL lymphocytes were stained using the influenza-specific CD4 tetramer: I-A(b) Influenza A NP 311–325 QVYSLIRPNENPAHK as described.39 Negative control CD4 tetramer was I-A(b) human CLIP 87–101 PVSKMRMATPLLMQA. Tetramers were obtained from the NIH Tetramer Core Facility. Samples were incubated with tetramer for 60 minutes at room temperature. For all flow cytometric studies, data acquisition and analysis were performed on an Accuri C6 (BD Biosciences, San Jose, CA) flow cytometer using CFlow Plus Analysis software.
Mass Spectrometry
Choline was measured in cell-free BAL fluid by hydrophilic interaction liquid chromatography coupled to tandem mass spectrometry (HILIC LC–MS/MS), using stable isotope-labeled internal standards (choline-d4) as described.40,41 Briefly, an aliquot of the cell-free BAL fluid was spiked with a mixture of deuterated choline. The sample was adjusted to 50% methanol and ice partitioned to remove proteins. The remaining sample was lyophilized, dissolved in acetonitrile:H20 and analyzed using a Thermo-Finnigan TSQ Quantum LC-MS/MS in positive ion ESI mode. For quantification, MS/MS ion transitions m/z 104 to 60 (choline) and 108 to 60 (choline-d4).
Histology
Following euthanasia, exsanguination, and cannulation of the trachea, lungs were inflated with 1mL of a 4% paraformaldehyde solution. The trachea was clamped and all lungs were removed and fully submerged in the 4% paraformaldehyde solution overnight fixation (~18 hours), with hemostats still attached and fully restricting flow through the trachea. The following day, hemostats were removed, lung lobes were dissected from one another and fully submerged in 70% Ethanol (EtOH), which was replaced after 6–8 hours. One day prior to processing, EtOH was discarded and replaced for a further 24 hours before being sent for processing and paraffin embedding. Formalin-fixed paraffin embedded (FFPE) lung lobes were serially sectioned at 5um on a Leica RM2125 RTS Rotary Microtome, and mounted on Prism (Prism Research Glass, Raleigh, NC) positively charged microscope slides. FFPE sections were stained with hematoxylin and eosin (H&E) for histological analysis using standard methods. Tissue sections of uninfected, infected vehicle control, and infected HC3-treated lung tissue (4–5 serial sections per slide) were analyzed by a veterinary pathologist who was blinded to treatments and groups. Tissue sections were given a numerical score based on the area of each section with inflammation (none = 0; 10–20% = 1; 30–66% = 2; 75–100% = 3).
For immunofluorescence studies, FFPE sections were deparaffinized and treated for immunofluorescent imaging by standardized methods.42 Sections were blocked with a 10% normal goat serum (NGS) solution for 30 minutes and incubated with primary antibody overnight at 4°C. All antibody dilutions were made in a 2% normal goat serum solution. Detection of GFP and ionized calcium-binding adapter molecule 1 (Iba1) required high-temperature antigen unmasking in 0.01 M citrate buffer (pH 6.0) (Sigma-Aldrich, San Diego, CA). Sections were treated with biotin and streptavidin blocking solutions (Vector Laboratories, Burlingame, CA) before incubation with primary antibodies. Sections were incubated with a rabbit primary monoclonal antibody against Iba1 (polyclonal rabbit anti-Iba1 antibody; Wako Pure Chemicals Industries, Ltd, Osaka Japan) at 1:500 at 4°C overnight. A goat secondary antibody [goat biotinylated anti-rabbit IgG (H+L); Vector Laboratories, Burlingame, CA] at 1:500 was diluted in 2% normal goat serum and incubated on sections for 30 minutes. After staining with secondary antibodies, all sections were washed three times with phosphate-buffered saline and incubated with a streptavidin-AlexaFluor 594 complex [DyLight 594 streptavidin conjugate; Vector Laboratories, Burlingame, CA] 1:500 diluted in 2% normal goat serum. For tri-color-stained sections, sections were incubated for 30 minutes in a light-free environment with an anti-GFP AlexaFluor-488 conjugate [anti-GFP, rabbit polyclonal antibody, Alexa Fluor 488 conjugate; Invitrogen, Eugene, OR] diluted 1:5 in 2% normal goat serum. Specificity immunostaining controls included sections stained in the absence of primary antibody or in the presence of rabbit immunoglobulin G control antibody at 0.1 µg/mL (Vector Laboratories, Inc.). Sections were overlaid with Vectashield anti-fade mounting medium (Vector Laboratories, Burlingame, CA) containing DAPI (4ʹ,6-diamidino-2phenylindole) to detect DNA/nuclei (blue) and covered with glass coverslips. Sections were observed by fluorescence microscopy (Zeiss Axio Observer D1 Inverted Phase Contrast Fluorescent Microscope). Green, red, and blue channel images were merged using AxioVision software. Broad field images were taken on a Zeiss Axio Zoom.V16 Stereo Zoom Microscope (Zeiss, Germany). Approximately 20 sections for each condition and 20 images per section were analyzed.
Automated Image Segmentation and Quantification of Immunofluorescence
For regional comparison of the lungs between treatment groups, images were categorized into three categories based on anatomical region: open alveolar space (open), bronchus-associated lymphoid tissue (BALT), and area peripheral to large airways (peri-bronchial). Alveolar space is identified by the lack of bronchial epithelium and the presence of type 1 and 2 pneumocytes; BALT is identified by the presence of bronchial epithelium and very dense lymphocytes; peri-bronchial regions are identified by bronchial epithelium and open alveolar space with type 1 and 2 pneumocytes. All images to be quantified were captured on a Zeiss Axio Observer D1 Inverted Phase Contrast Fluorescent Microscope at the same magnification, utilizing the 20x objective with a digital zoom of 0.97. Exposure times were held constant in red, green, and blue channels for each image captured, although only the signal in the red channel was quantified, as Iba1 was marked with the AlexaFluor 594 fluorochrome. Exposure times were as follows: red (2.1s), green (2.1s), blue (200ms). The same exposure time was utilized for both the red and green channels for comparison of autofluorescent tissues within each section, such as red blood cells and fibrin deposits, commonly seen as a result of vascular leakage in inflamed tissues. For Iba1 immunofluorescence quantification, only images in the red channel were analyzed.
Automated Image Segmentation
To accurately quantify the red stains (Iba1) in the lungs, we used a novel automated algorithm designed and implemented in MATLAB 2019b Image Processing Toolbox. The program locates and segments regions of interest while simultaneously calculating the size and intensity of these regions. With a goal of capturing the red stain present in the images, the gray-scale red channel portion of the original microscopy images were used for the automated image analysis process. The program follows three main steps: image input, image segmentation, and data extraction. The step for the image input was automated for efficiency by directing the program to read multiple images in a folder sequentially. After an image is read, the program segments the red dots using Otsu’s thresholding method in which background noise in the image is eliminated by selecting a threshold automatically from a gray-level histogram using discriminant analysis.43 While there are a variety of thresholding methods present in the literature, Otsu’s method is the most accurate and most widely used.44–47 In the program, Otsu’s method determines a threshold that distinguishes the background from the region of interest. The determined threshold is then used to segment each image, removing background noise and displaying the red stain. The final step is the calculation of the total area of red stain present in the image as well as the intensity of the stains. Total pixel area of red stain coverage is calculated by determining the number of nonzero elements in the grayscale image while total image intensity is calculated by summing the intensity levels of all elements remaining in the segmented image. The program analyzed all the microscopy images (56 in total) and generated graphs for the total area of red dots and intensity in approximately 29.6 seconds.
Statistical Analysis
Single-tail t-tests were computed using Excel, R and R Studio. *p < 0.05 was considered statistically significant. Bayes factor upper bound (BFUB)48,49 was calculated in Excel; values are expressed as fold likelihood of the alternative hypothesis.
Results
Cholinergic Lymphocyte Appear in the Lungs During Acute Viral Infection
Animals were infected with a sublethal dose of influenza A/PR8 (H1N1) and weighed daily to monitor morbidity (Figure 1A). Individual cohorts were euthanized at specified time points and BAL fluid was isolated in order to measure cholinergic status. Given the high rate of ACh hydrolysis by AChE after secretion (~25,000 molecules/second),50–52 we opted to measure BAL choline concentration as a biomarker for local ACh hydrolysis,24,53 From a background concentration of 1200 ng/mL prior to infection, the BAL choline concentration increased to 4800 ng/mL 8 dpi and peaked at 6500 ng/mL 10 dpi. By 15 dpi, BAL choline concentration diminished to 1800 ng/mL, similar to the starting concentration measured 0 dpi (Figure 1B). Comparing the weight change curve to the choline concentration changes shows that ACh hydrolysis reaches a peak in the influenza-infected lungs shortly after the point of peak weight loss.
 |
Figure 1 Cholinergic changes kinetics in the influenza-infected lung. Mice were infected with a non-lethal dose of influenza A PR/8 as described in the Materials and Methods section and were weighed daily starting the day of infection. (A) Weight change following influenza infection. Group average weight change is shown as mean ± SEM. (B) Airway choline concentration was measured using HILIC LC–MS/MS with a stable choline-d4 isotope-labeled internal standard as described in the Materials and Methods section. *Difference in airway choline concentration reaches statistical significance (p < 0.005, BFUB > 50) on days 8–10 post infection. (C) Ten days after infection, airway cells were isolated by lung lavage, stained with fluorescent antibodies and analyzed as described in the Materials and Methods section. Gating strategy for BAL cell analysis is shown using wild-type C57Bl/6 mouse as a negative control for GFP fluorescence. Representative day 10 staining data are shown (30 mice); compiled data are found in Table 1. FSC: forward scatter (size); SSC: side scatter. Cholinergic capacity was defined as positive FL1+ fluorescence compared to wild-type C57Bl/6. (D) Kinetics of total airway lymphocytes; (E) Kinetics of airway cholinergic (GFP+) cells; (F) Percentage of all lymphocytes expressing GFP over the course of influenza infection. |
To examine a possible role for non-neuronal ACh production in the observed choline concentration changes, we examined the kinetics of lymphocyte populations infiltrating the BAL lumen and lungs during infection using ChAT (BAC)–eGFP transgenic mice (ChAT mice) with endogenous choline acetyltransferase transcriptional regulatory elements directing eGFP expression.37 Wild-type, influenza-infected C57BL/6 mice were used as controls for green fluorescent protein (GFP) fluorescence. Starting 8 dpi, GFP+ cells were detected in the BAL samples from the ChAT mice (Figure 1C). The number of ChAT-GFP+ lymphocytes present in BAL samples followed the same kinetic pattern as the total lymphocyte population (Figure 1D), increasing rapidly starting 7 dpi and reaching peak numbers between 8 and 10 dpi (Figure 1E). However, the percentage of ChAT-GFP+ lymphocytes remained above 7% of the total lymphocyte population in the BAL through 28 dpi (Figure 1F).
Flow cytometry identified ChAT-GFP+ subsets of both CD4+ and CD8+ T cell populations in the BAL samples during peak days of infection (8–10 dpi) (Figure 2). The majority of these ChAT-GFP+ lymphocytes were CD4+ (69.7%) while 23.3% were CD8+, indicating more cholinergic helper T cells present in BALF samples than cholinergic cytotoxic T cells, respectively. When the analysis was extended to lung tissue, ChAT-GFP was detected in B220+ B-2 lymphocytes as well as CD4 and CD8 T cells. Throughout the lung, the highest percentage of GFP+ cells was CD4+ T cells. The CD4 population also expressed the most GFP fluorescence on a per-cell basis (Table 1).
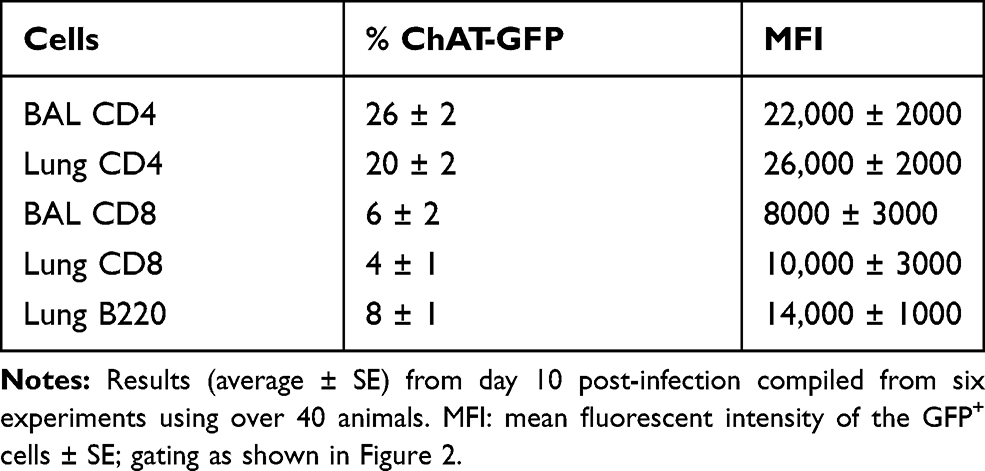 |
Table 1 Pulmonary Lymphocyte Subsets Expressing ChAT-GFP |
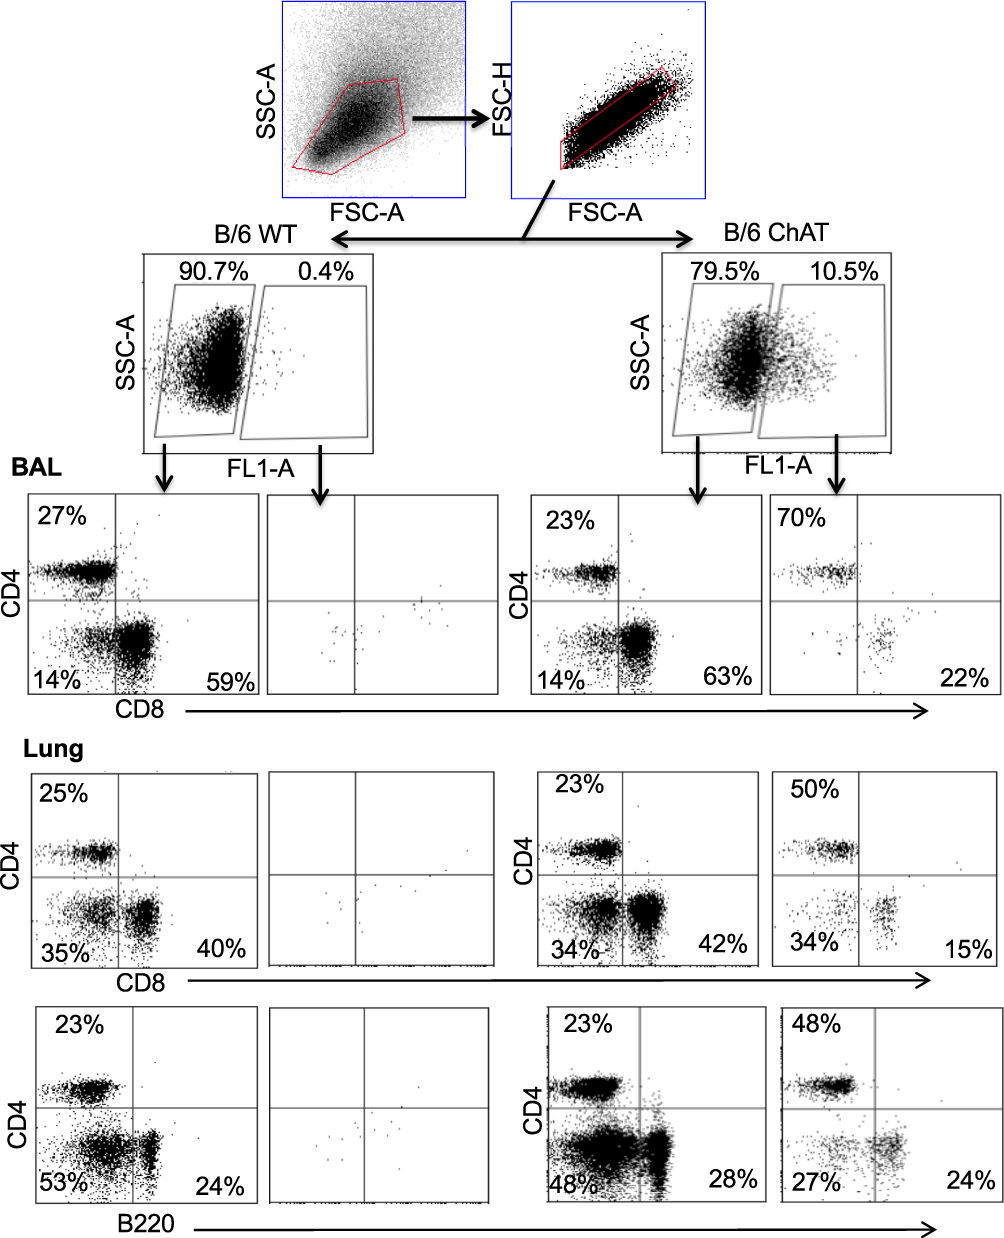 |
Figure 2 Airway and lung cholinergic cell phenotyping. Animals were infected with influenza as in Figure 1 and sacrificed 10 days later for analysis. Cells were isolated and stained for surface marker analysis as described in the Materials and Methods section. Gating strategy to examine surface phenotypes of FL-1+ (ChAT-GFP+) and FL-1− (ChAT-GFP−) cells is shown. Representative staining data are shown (10–30 mice per time point), compiled data are found in Table 1. |
Influenza antigen specificity of the TCR in cholinergic and conventional T cell populations was examined by tetramer staining. Similar percentages of cholinergic CD4 T cells and conventional T cells bound the dominant influenza A epitope NP311-325 (Figure 3A). Neither conventional nor cholinergic CD4 T cells bound to fluorescent tetramers loaded with negative control peptide (human CLIP 87–101; Figure 3B). When gating on tetramer-positive cells to examine cholinergic distribution, it is clear that cholinergic CD4 T cells are present in the tetramer-specific region (Figure 3C) as well as in those CD4 T cells that do not recognize the NP-specific tetramer (Figure 3D). Whether the non-tetramer-bonding lymphocytes represent influenza-specific cells specific for different epitopes or evidence of ChAT expression in bystander activated CD4 T cells was not determined.
 |
Figure 3 Cholinergic CD4 T bind to influenza-specific tetramers. Mice were infected with influenza A/PR8 and sacrificed for analysis 8 days later. BAL cells were isolated and stained for CD4 as in Figure 2. Cells were then stained with either the class II tetramer I-A(b) Influenza A NP 311–325 (A) or the negative control tetramer I-A(b) human CLIP 87–101 (B) as described in the Materials and Methods section. Histograms show staining of R1 = conventional CD4 T cells; R2 = cholinergic CD4 T cells vs ChAT-GFP fluorescence. (C) Gated CD4 T cells were stained for either the negative control tetramer I-A(b) human CLIP 87–101 or the class II tetramer I-A(b) Influenza A NP 311–325, and analyzed for tetramer binding vs ChAT-GFP expression. R1 = tetramer+ CD4 T cells; R2 = tetramer− CD4 T cells. (D) Histograms show GFP expression in R1 tetramer+ and R2 tetramer− CD4T cells. |
Surface staining indicated that the cholinergic CD4 T cells were uniformly CD44hiCD62Llo (Figure 4A), consistent with previous studies that described the surface phenotype of cholinergic CD4 T cells as well as the CD4 T resident memory (TRM) population.54–56 To explore the possibility that cholinergic CD4 T cells made up part of the TRM population, mice were infected with influenza A and allowed to recover for 2 months with no manipulation, then they were given an intravenous injection of fluorescent anti-CD45 antibody and sacrificed 10 minutes later. As shown in Figure 4B, CD4 positive cells in the lungs can be divided into two subsets, based on staining by the injected CD45. The T effector memory (TEM) population resides in areas of the lung accessible to the circulation and were stained following intravenous injection of fluorescent antibody. Cells not exposed to the circulation and thus left unstained following intravenous injection represent the TRM population.56 Cholinergic CD4 T cells were primarily found in the regions of the lung sequestered from circulation associated with the TRM population.
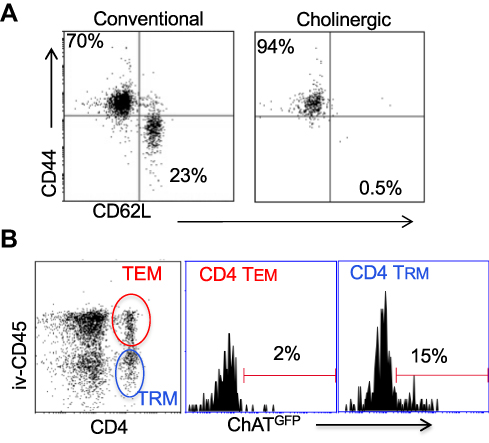 |
Figure 4 Cholinergic CD4 T cells reside in the resident memory niche of the lung. Two months after influenza infection, mice were injected intravenously with fluorescent anti-CD45 10 minutes before sacrifice. Lung lymphocytes were stained for surface markers and analyzed based on GFP expression as in Figures 1 and 2. (A) Gated CD4 cells were stained for memory markers CD44 and CD52L. (B) Total lymphocytes from ChAT-GFP mice were analyzed based on fluorescence of the injected CD45 antibody vs CD4 expression. CD4+CD45+ (TEM) and CD4+CD45− (TRM) were then analyzed for GFP expression. |
Cholinergic Lymphocytes Physically Contact Activated Macrophages
To explore the localization of cholinergic cells within the context of the overall lung architecture, lungs from animals infected with influenza A were fixed and processed for immunofluorescent (IF) staining and analysis. Staining with an anti-GFP fluorescent antibody identified cholinergic cells. Within the lungs, alveolar space was identified by the lack of bronchial epithelium and the presence of type 1 and 2 pneumocytes; BALT was identified by the presence of bronchial epithelium and very dense lymphocytes; and peri-bronchial regions were identified by bronchial epithelium and open alveolar space with type 1 and 2 pneumocytes (Figure 5). The cholinergic GFP+ cells were predominantly localized to BALT but they were also observed in open spaces, specifically the alveolar space and peri-bronchial regions proximal to the major sites of active inflammation or infection, identified by Iba1 staining (Figure 5). Iba1, also known as allograft inflammatory factor 1 (AIF-1), is a marker of activated macrophages and ongoing inflammation.7,42,57–60 Cells expressing Iba1 were large and amoeboid in shape, further supporting their identification as macrophages. As shown in Figure 5, cholinergic lymphocytes were regularly observed in direct physical contact or close spatial proximity with Iba1+ activated macrophages. Although Iba1 expression has been reported in lymphocytes, co-expression of ChAT-GFP and Iba1 was never observed within the same cell in either vehicle control or HC3-treated lungs.
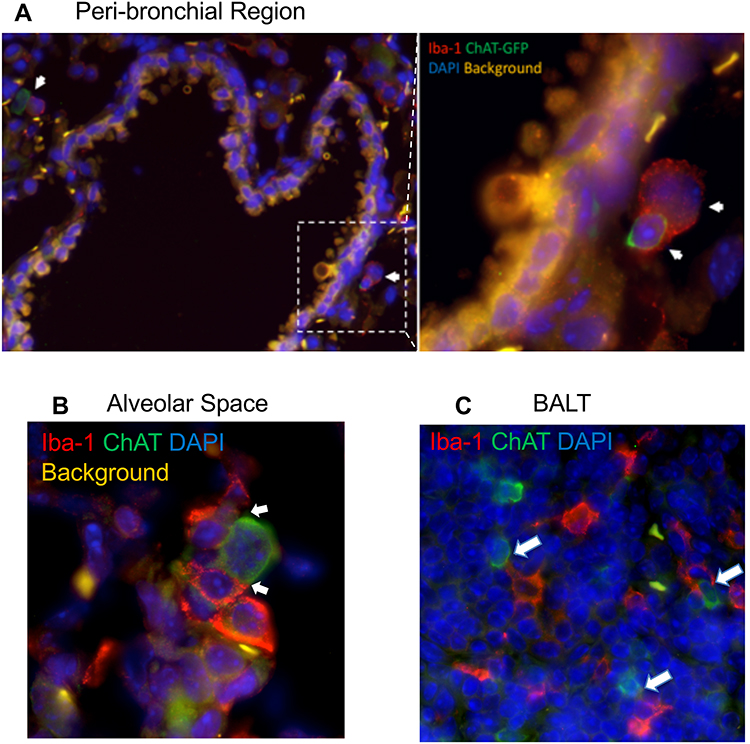 |
Figure 5 Cholinergic lymphocytes can be found in direct contact with activated macrophages throughout the lung. Animals were infected with influenza A as in Figure 1 and sacrificed for analysis 12 days later. Lungs were processed for immunofluorescent staining as described in the Materials and Methods section. Dual-labeled sections (Green: ChAT-GFP, Red: Iba1) of infected lungs show close contact of cholinergic lymphocytes (ChAT-GFP+) and activated macrophages (Iba1+). White arrows identify areas of contact between Iba1+ inflammatory cells and cholinergic lymphocytes. (A) Peri-bronchial region: left image taken at 20× with 0.5 digital zoom, enlarged inset image taken at 63× under oil immersion with 1.4 digital zoom. (B) Alveolar Space; image taken at 63× under oil immersion with 1.4 digital zoom. (C) BALT; image taken at 20× under oil immersion with 1.3 digital zoom. |
Blocking ACh Synthesis Increases Morbidity
The co-localization of cholinergic lymphocytes and activated macrophages indicated a potential role for targeted ACh delivery to activated macrophages during the later stages of influenza infection. To examine the requirement for ACh during recovery from influenza infection, we disrupt ACh synthesis by treatment with Hemicholinium-3 (HC3) to block the high-affinity choline transporter, the rate-limiting step in ACh synthesis,61–66 during the time period associated with increased ACh concentration (Figure 1). Mice were infected with influenza A/PR8 (H1N1) as above. After 7 days, mice were stratified into treatment cohorts according to the amount of weight loss to ensure equivalent pre-established morbidity in each cohort. One cohort was treated with HC3 from days 7 through 12 (infected HC3 treated), while the infected vehicle control cohort was injected with saline to control for handling/injection stress. Additional control cohorts were injected with HC3 or PBS without having been infected. Ten days after infection and 3 days after initiating HC3 treatment, BAL samples from an infected, HC3-treated cohort exhibited significantly increased choline concentration compared to infected vehicle control groups (Figure 6A), indicating that HC3 was inhibiting choline uptake in the airway lumen.67 Neither cohort of mock-infected animals showed evidence of weight change, indicating that HC3 treatment alone does not result in measurable weight loss (Figure 6B). Both infected cohorts lost weight with similar kinetics. The infected control cohort began to regain weight 9 dpi and had returned to 96% of their starting weight by 15 dpi. In contrast, the cohort treated with HC3 beginning 7 days after infection did not begin to regain weight until 11 dpi and only returned to 91% of their starting weight by 15 dpi. Representative results are shown; experiment was repeated five times using a total of 63 influenza-infected controls and 65 infected HC3-treated animals. In all experiments, the infected animals treated with HC3 showed a delay in weight regain, but this delay did not consistently reach statistical significance. Flow cytometric analysis showed an increase in the number of neutrophils in HC3-treated animals compared to vehicle control animals on days 10 and 15 after infection (Figure 6C).
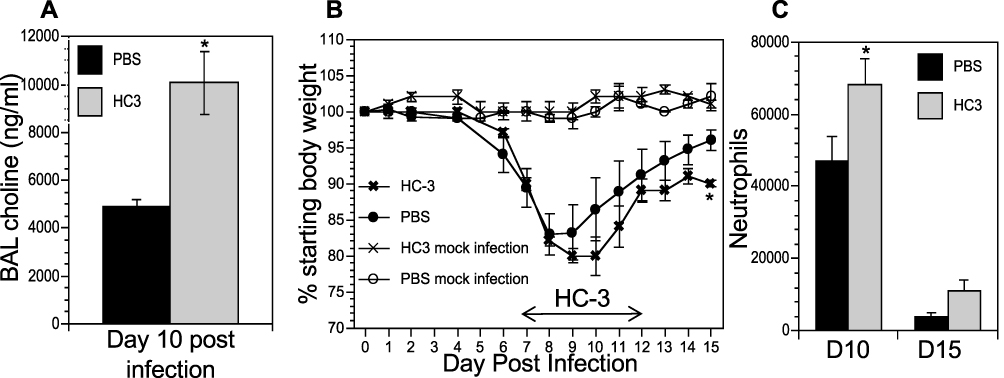 |
Figure 6 Decreasing ACh synthesis delays recovery and increases inflammation following influenza infection. Mice were infected with influenza and injected with HC3 or PBS 7–12 dpi as described in the Materials and Methods section. Mock infection controls were insufflated with PBS at the time of infection. (A) Airway choline was measured 10 days after infection as in Figure 1. *Difference in airway choline concentration was statistically significant (p < 0.05, BFUB > 6). (B) Weight was measured daily throughout infection and recovery as in Figure 1. Control cohorts were injected with either HC3 or PBS but were not infected with influenza. Group average weight changes are shown as mean ± SEM. Representative data of five separate experiments, using a total of 128 influenza-infected mice. *Difference in weight is statistically significant (p < 0.05; BFUB > 5.5) on d15 after infection. (C) On days 10 and 15 after infection, pulmonary neutrophils (SSChiCD11b+Ly6G/1A8+) in the influenza-infected cohorts were identified by FACS analysis. *Difference in airway neutrophils is statistically significant (p < 0.05, BFUB > 2)on day 10 after infection. |
Inhibiting ACh Synthesis Increases Pulmonary Inflammation
We used immunofluorescent staining of lung slices from infected control and HC3-treated animals sacrificed 15 days after infection to examine the effect of decreasing ACh on inflammatory resolution, using Iba1 as a marker of overall inflammation7,42,57–59 (Figure 7A). There was little identifiable Iba1 expression in uninfected lungs (left column). Infected animals treated with PBS (middle column) or HC3 (right column) exhibited Iba1 expression in the alveolar space, peri-bronchial region, and BALT.
 |
Figure 7 IHC Analysis of Iba1 During Recovery. Animals were infected and treated with HC3 or PBS as above and sacrificed for analysis 15 days later. Lungs were processed for immunofluorescent staining as described in the Materials and Methods section. (A) Immunofluorescence of Iba1 staining in multiple lung regions. Representative images taken at 20× showing Iba1 staining (red, AlexaFluor-594) and DAPI stained nuclei (blue) in the alveolar space, peri-bronchial region, and BALT in uninfected, infected vehicle control, and infected drug-treated animals 15dpi. (B) Quantification of Iba1 fluorescence, using a novel automated image segmentation algorithm as described in the Materials and Methods section. Area of stain was greater in infected HC3-treated lung compared to infected vehicle control lung (p < 0.01, BFUB > 6), and in the airways (p < 0.05, BFUL > 4) and peri-airway (p < 0.05, BFUB > 2.75) regions of the lung. (C) Total intensity analysis identified greater average intensity of fluorescent signal in the lungs of infected HC3-treated groups compared to infected vehicle control groups in the alveolar space and peri-bronchial regions, as well as the full lung. For (B) and (C), violin plots were used to visualize the full distribution of the data and to determine if the data distribution was multimodal. In brief, the width of the plot reflects the probability density of the data at those values. |
In order to quickly and accurately quantify Iba1 expression in the lungs, a novel automated algorithm was designed and implemented in MATLAB 2019b Image Processing Toolbox to accurately quantifying red fluorescence. The program locates and segments regions of interest while simultaneously calculating the size and intensity of these regions, using Otsu’s method of thresholding in order to remove background noise and isolate the red stain with minimal human bias.43,45–47 Area of stain, which corresponds to the total number of pixels occupied by fluorescent signal from any one image, was evaluated by region and compared between infected HC3-treated groups and infected vehicle control groups (Figure 7B). Area of stain measurements from infected HC3-treated groups were greater than those observed in infected vehicle control groups (whole lung; p < 0.01, BFUL > 6). This was reflected in increased Iba1 expression in the airways (p < 0.05, BFUL > 4) and peri-airway (p < 0.05, BFUL > 2.75) regions of the lung. These data are easily visualized in violin plots. Violin plots are similar to box plots in their representation of the sample distribution. However, violin plots carry more information than box plots by also showing the probability density of the data at different values, seen as a wider plot area where the probability is higher. This is especially informative if the data distribution is multimodal. Total intensity, corresponding to the sum of fluorescent stain intensity per pixel in one image, was also evaluated by region and compared between influenza-infected HC3 treated vs vehicle control groups (Figure 7C). The infected HC3-treated animals displayed a > 9% increase in mean Iba1 intensity compared to infected controls.
Lung samples from the HC3-treated animals and controls were fixed and processed for staining examined to determine the effect of ACh disruption on tissue repair. A board-certified veterinary pathologist who was blinded as to treatment examined tissue sections. Ten days after influenza infection, the inflammatory infiltrate in all sections was primarily perivascular, with some peribronchiolar inflammation and extension into the adjacent parenchyma (interstitial pneumonia). The inflammatory infiltrate was mixed, with both lymphocytes and neutrophils; however, animals treated with HC3 displayed increased neutrophils compared to lymphocytes. Fifteen days after infection, the inflammatory infiltrate was more extensive, affecting more adjacent interstitial/alveolar tissue (interstitial pneumonia), but it had changed in character to include primarily lymphocytes. As shown in Figure 8A, infected vehicle control lung tissue exhibited alveolar/interstitial mixed infiltrate of lymphocytes and neutrophils (green arrows) and mild/moderate multifocal perivascular mixed infiltrate (yellow arrows). The lungs from infected animals treated with HC3 were characterized as having moderate alveolar/interstitial mixed infiltrate of lymphocytes (green arrows) and neutrophils as well as perivascular mixed infiltrate (yellow arrows). Infected HC3-treated lung tissue also exhibited histological abnormalities not seen in the vehicle control lungs. These pathological anomalies including multifocal type II pneumocyte proliferation (yellow arrows, Figure 8B), mild multifocal squamous cell metaplasia (green arrows, Figure 8C), and mild fibroplasia (blue arrows Figure 8D) were observed in infected HC3-treated lung tissue but were absent in infected vehicle control lung tissue.
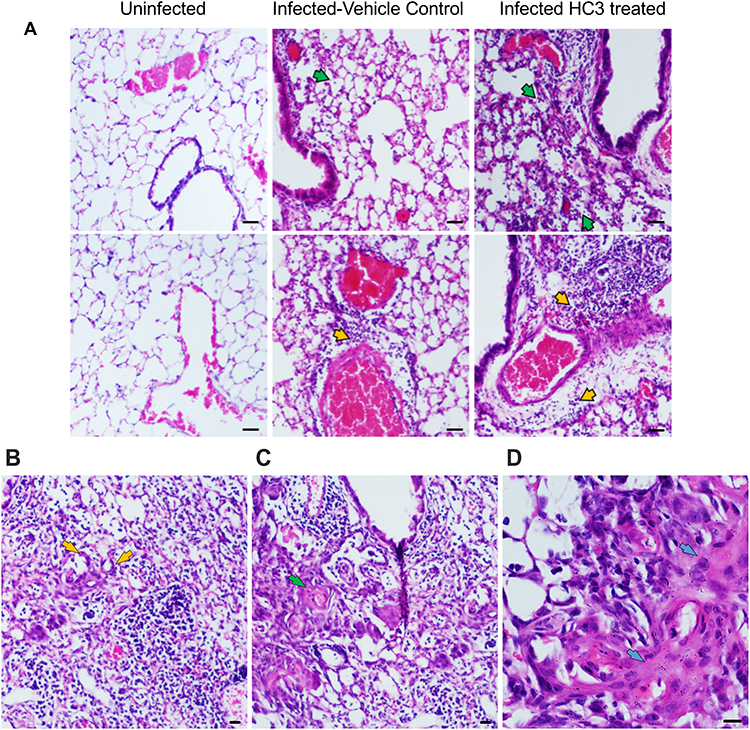 |
Figure 8 Histological Analysis of Recovery. (A) Representative images of H&E-stained sections of lung tissue at 10× (scale bar 100µm) magnification from healthy animals, infected vehicle control animals, and infected HC3-treated animals (d15 post infection) from left to right. Lungs from influenza-infected control animals display mild/moderate multifocal perivascular mixed infiltrate (yellow arrow) and alveolar/interstitial mixed infiltrate of lymphocytes and neutrophils (green arrow). Influenza-infected animals treated with HC3 show moderate perivascular (yellow arrow) as well as alveolar/interstitial mixed infiltrate of lymphocytes and neutrophils (green arrow). (B–D) Infected HC3-treated lung tissue exhibit multifocal type 2 pneumocyte proliferation (yellow arrow), mild multifocal squamous cell metaplasia (green arrow), and mild fibroplasia (blue arrow). |
Discussion
The present study adds to a growing body of research illuminating the crucial role of non-neuronal ACh in regulating inflammation and immunity.8,14,15,68 Our results demonstrate that ACh plays an important role in recovery from pulmonary viral infection. Inflammatory control and pulmonary tissue repair are critically important during respiratory infection, especially in the alveolar space where the majority of gas exchange occurs. Disruption of the delicate architecture of the alveolar space by direct viral damage and inflammatory cell influx during infection results in significant reduced tidal volume and a decreased capacity for gas exchange. These studies used influenza A; however, the results are likely to be applicable to many acute respiratory infections including the pandemic SARS-CoV2 coronavirus COVID-19.36 As widely observed during the yearly influenza season as well as the current COVID-19 pandemic, many patients in critical condition exhibit significantly reduced tidal volume and capacity for gas exchange, resulting in the critical need for ventilators worldwide. Our findings that ACh regulates pulmonary inflammation and plays a role in tissue repair point to a previously unexploited therapeutic target for treating respiratory infection.
Based on previously published studies demonstrating ACh regulating inflammatory cytokine expression, macrophage activation, and neutrophil trafficking,13,17,19,20,24,69–71 we initially hypothesized that ACh would modulate the innate immune burst at the earliest the early stages of respiratory viral infection. However, we were unable to detect evidence of increased cholinergic activity during the first week of influenza infection. Although demonstrated by others,16,72 we did not detect ChAT expression in NK cells, myeloid cells, or alveolar macrophages at any state of infection. Instead, we determined that the peak time of ACh hydrolysis and greatest choline concentration in the lumen of the BALs mirrored the kinetics of the BAL CD4 T cell population, between 8 and 10 days after infection. These findings suggested a role in regulating the cellular immune response and/or the transition from active immunity to tissue repair rather than modulating the innate immune burst. Further supporting a role in recovery and repair, cholinergic lymphocyte numbers did not increase during the innate response, but they were retained in the BAL and lungs throughout the late stages of infection and long after clinical recovery. Data shown here indicate that cholinergic CD4 T cells are present for at least 2 months after recovery, well past the time point associated with establishment of the CD4 T cell resident memory population.54,56 The long-term retention of cholinergic CD4 T cells in the circulation-sequestered niche of the lung, along with their surface phenotype of CD44hiCD62Llo, leads to speculation that they play an important role in the memory T cell response, a possibility beyond the scope of the current study. Since expression of the ChAT-eGFP gene is transient, the ChAT mice used herein cannot be used to determine the full percentage of cells with a cholinergic history. The use of lineage tracer animals will be necessary to fully address these questions.
Although flow cytometry indicated that CD4 T cells were the dominant cholinergic population in absolute numbers and per-cell ChAT expression, the fluorescent images do not confirm the identity of the cholinergic cell population(s) seen in contact with pulmonary macrophages. CD4, CD8, and B lymphocytes are all able to synthesize and secrete ACh16 and as yet it is impossible to delineate specific roles for each during respiratory viral infection. In addition, although our studies did not determine the primary inducers of ACh secretion by the cholinergic lymphocytes, previous studies have shown that cholinergic lymphocytes produce ACh in response to specific antigen, TLR agonists, neurotransmitters, and possibly cytokines.17–19,73 As yet we do not know if local neurotransmitter secretion plays any role in lymphocyte ACh production during influenza. For this reason, we have not used the term cholinergic anti-inflammatory pathway11 since we do not yet what role the brain-immune circuit plays in this process.
AChE is one of the most efficient enzymes yet known, hydrolyzing ACh at a rate near the theoretical limits of diffusion.50–52 To overcome this rapid degradation, cholinergic signaling between cells must take place over a short distance. We found evidence of direct physical contact between Iba1+ macrophages and cholinergic lymphocytes in all regions of the influenza-infected lung. This contact illustrates a biologic method to ensure proper targeting of the secreted ACh while overcoming the extremely rapid ACh hydrolysis in the pulmonary environment.24 Direct physical interaction also offers a biological explanation for the presence of cholinergic lymphocytes in a tissue that already possesses two endogenous sources of ACh.16,32 Although the current studies do not distinguish the specific roles of the vagal nerve, bronchial epithelium, or lymphocytes in ACh secretion during recovery, the physical contact between cholinergic lymphocytes and activated macrophages throughout the lungs provides evidence for a specialized role of cholinergic lymphocytes as mediators of localized cholinergic signaling and offers a mechanism to avoid deleterious consequences of off-target ACh in the lungs. A primary example of this would be asthmatic bronchoconstriction, which is widely treated with non-specific muscarinic receptor antagonists such as ipratropium bromide to inhibit bronchoconstriction and mucus secretion.74 Our data could be considered to be in conflict with the clinical use of ipratropium bromide to treat acute respiratory distress syndrome in ventilated patients (even though the clinical effectiveness has yet to be confirmed in high-quality clinical trials75). However, our studies did not examine acute respiratory distress. Also, it is interesting to note that one of the listed potential side effects of ipratropium bromide use is increased pulmonary inflammation.76
The importance of ACh in recovery from viral infection was indicated by the increased inflammation and aberrant tissue repair noted when ACh synthesis was inhibited. These studies do not attempt to dissect the roles of nicotinic vs muscarinic AChR, although both receptor families are likely to play important roles in the observed response. For example, the α7nAChR plays a well-recognized role in regulating inflammatory cytokine expression while muscarinic receptor ligation is associated with the regulation of neutrophil influx.13,17,19,20,24,69–71 Ligation of both nicotinic and muscarinic receptors leads to increased proliferation of bronchial epithelium, whereas inhibiting both receptors slows proliferation.77 The absolute contribution of ACh from the vagal nerve, the bronchial epithelium, and cholinergic lymphocytes also remains to be determined. Despite these limitations, the reported findings and observations support a necessary, protective role for ACh mediating anti-inflammatory and tissue repair–oriented mechanisms in the late stages of infection.
Our contention that ACh is a critical mediator of pulmonary repair following viral illness is consistent with other reports in the literature. We did not detect any significant difference in the pulmonary viral titers of HC3-treated animals and controls (not shown), leading us to discount increased viral burden as a factor in the increased pathology. The current findings are supported by studies using different models of acute lung injury (ie, acid, LPS, E. coli), where injury is increased when cholinergic signaling is inhibited and decreased when it is augmented.21,23,24 Animals with an endogenous defect in ACh generation exhibit abnormal lung remodeling even in the absence of overt injury.78
As discussed above, ACh mediates changes in macrophage gene expression. The anti-inflammatory activity of ACh binding to the α7nAChR on macrophages, resulting in diminished NF-κB nuclear translocation and decreased inflammatory cytokine production is well described11,69 and has been documented in the lungs.23,24,33 Loss of α7nAChR signal transduction was recently shown to decrease expression of the canonical M2 marker Arginase-1.79 In addition, the use of an α7nAChR agonist decreased the LPS-induced inflammatory response and reversed the inflammatory profile, particularly regarding M1 and M2 polarization, while also improving lung function and remodeling in a model of acute lung injury.21 Based on these findings and those in the current study, we hypothesize that ACh produced by cholinergic lymphocytes acts on macrophages to decrease pro-inflammatory cytokine release and initiate tissue repair during the recovery phase of respiratory viral infection.
In these studies, we used a novel analysis tool to quantify Iba1 expression, relating to pulmonary inflammation. An automated MATLAB was implemented to accurately isolate the red stain in the Iba1 fluorescent images. The algorithm automatically reads images from a folder sequentially, segments the red stains and computes the amount of red stain present in each of the images. To perform the image segmentation to isolate the red stain, Otsu’s method of thresholding was implemented in order to remove background noise with minimal human bias. The algorithm was automated for computational efficiency and avoids the laborious process of manual segmentation and analysis. Using the algorithm, we investigated Iba1 expression during pulmonary inflammation in different regions of the lungs. The automated algorithm proved to be a valuable tool to quantitate Iba1 expression of pulmonary inflammation, allowing for a quick and accurate analysis of each image with minimal of human bias. The results indicated that Iba1 is involved in the pathogenesis of respiratory viral infection. To the best of our knowledge, this is the first time that Iba1 has been linked to pathology during viral infection. The increased Iba1 expression displayed by infected animals treated with HC3 is also consistent with decreased ACh-induced inflammatory regulation. The immunofluorescence analysis indicated increased inflammation when ACh synthesis is decreased. As an activation marker, Iba1 can be detected on alveolar macrophages as well as myeloid-derived pulmonary macrophages.25,60 Iba1 expression has also been reported by lymphocytes and pulmonary endothelium,80,81 and we cannot unequivocally confirm that every Iba1+ cell in the lung was myeloid in origin. Overall, more cells expressed Iba1 in the infected, HC3-treated animals, resulting in larger areas of immunofluorescence. The Iba1 intensity in HC3-treated animals showed a > 9% mean increase compared to infected controls; however, this did not reach statistical significance. This may be due to the decreased area of fluorescent stain in infected controls. The significantly smaller area covered by fluorescent stain in infected controls can skew the results because stain is localized into smaller regions in comparison to HC3.
Secreted Iba1 protein also acts as an independent inflammatory and fibrotic stimulus in the lungs, where it has been shown to induce IL-6, TNFα, and CXCL1 (KC) production by pulmonary macrophages and fibroblasts.7,57,82,83 The increased neutrophils in the HC3-treated animals would also be consistent with increased pulmonary CXCL1.84
In the context of our study, we hypothesize that elevated Iba1 expression following ACh disruption is both indicative of and enhances the ongoing inflammation observed in the lungs. Although the specific role of Iba1 in influenza pathogenesis remains to be elucidated, the increased inflammation and delayed recovery in ACh-depleted animals shown here is reminiscent of the response seen in aged animals to respiratory infection.85 Aging is well established as the primary risk factor of mortality in human influenza as well as the ongoing COVID-19 pandemic. Aging also impacts multiple aspects of cholinergic systems. Expression and cellular distribution of the α7nAChR changes with age and activity as well as with continued exposure to Ach.86,87 Aging alters the T lymphocyte response to cholinergic stimulation as well as immune system ACh generation.88,89 Increased cholinesterase activity is associated with multiple age-related inflammatory conditions.90 If altered cholinergic capacity plays a role in the diminished immune response or delayed recovery to respiratory infection shown by the elderly, then improving cholinergic function could result in enhanced immune function during aging. Since the elderly are at the greatest risk of death not just from influenza infection but also from the ongoing COVID-19 pandemic, these are questions of the utmost importance. One key feature of age-related immunodeficiency is in the increased basal inflammatory status known as inflammaging.91,92 Supporting the concept of improving immunity in through cholinergic manipulation, it was first shown over 15 years ago that treatment with the AChE antagonist donepezil decreased inflammatory cytokine message in circulating blood leukocytes of Alzheimer’s Disease patients.93,94 This study was only recently followed up with the demonstration that inflammatory cytokines TNF, IFNγ, IL1β, and IL6 were significantly decreased following 6 months of donepezil therapy.95 Furthermore, donepezil treatment is associated with decreased overall mortality, including pneumonia-associated mortality.96,97 As yet, these data are not available for COVID-19 patients. Given the critical unmet need of the elderly for better therapeutic options, extended studies into improved immune function through cholinergic manipulations are of the utmost importance from both a scientific and a world health perspective.
Conclusion
While further studies are needed to elucidate the full mechanistic understanding, ACh has shown to be a critical factor in post-influenza infection recovery. Cholinergic lymphocytes appear in the lungs and BAL lumen during the recovery phase of influenza and are found in direct physical contact with activated macrophages. Decreasing the ACh concentration results in extended morbidity, disordered tissue repair, and increased pulmonary inflammation. Together, these results indicate a previously unsuspected role for ACh in mediating pulmonary inflammation and efficient tissue repair during recovery from respiratory viral infection.
Acknowledgments
The influenza-specific tetramer and control peptides were a generous gift from our colleague and beloved friend, the late Dr Sam Sanderson.
Disclosure
This study was supported by NIH AI119929 (JP), San Diego State University Bridge Funding (JP), and San Diego State University Initiative for Maximizing Student Development Award GM058906 (CA). The funders had no role in study design, data collection and analysis, decision to publish, or preparation of the manuscript.
The authors report no conflicts of interest in this work.
References
1. Kawashima K, Oohata H, Fujimoto K, Suzuki T. Plasma concentration of acetylcholine in young women. Neurosci Lett. 1987;80(3):339–342. doi:10.1016/0304-3940(87)90478-2
2. Kawashima K, Oohata H, Fujimoto K, Suzuki T. Extraneuronal localization of acetylcholine and its release upon nicotinic stimulation in rabbits. Neurosci Lett. 1989;104(3):336–339. doi:10.1016/0304-3940(89)90599-5
3. Fujii T, Yamada S, Yamaguchi N, Fujimoto K, Suzuki T, Kawashima K. Species differences in the concentration of acetylcholine, a neurotransmitter, in whole blood and plasma. Neurosci Lett. 1995;201(3):207–210. doi:10.1016/0304-3940(95)12180-3
4. Fujii T, Tsuchiya T, Yamada S, et al. Localization and synthesis of acetylcholine in human leukemic T cell lines. J Neurosci Res. 1996;44(1):66–72.
5. Kawashima K, Fujii T, Moriwaki Y, Misawa H, Horiguchi K. Non-neuronal cholinergic system in regulation of immune function with a focus on alpha7 nAChRs. Int Immunopharmacol. 2015;29(1):127–134.
6. Nosaka N, Yashiro M, Yamada M, et al. Anti-high mobility group box-1 monoclonal antibody treatment provides protection against influenza A virus (H1N1)-induced pneumonia in mice. Crit Care. 2015;19:249.
7. Nagahara H, Yamamoto A, Seno T, et al. Allograft inflammatory factor-1 in the pathogenesis of bleomycin-induced acute lung injury. Biosci Trends. 2016;10(1):47–53.
8. Fujii T, Mashimo M, Moriwaki Y, et al. Expression and function of the cholinergic system in immune cells. Front Immunol. 2017;8:1085.
9. Kawashima K, Fujii T. Extraneuronal cholinergic system in lymphocytes. Pharmacol Ther. 2000;86(1):29–48.
10. Kawashima K. Expression of non-neuronal acetylcholine in lymphocytes and its contribution to the regulation of immune function. Front Biosci. 2004;9(1–3):2063–2085. doi:10.2741/1390
11. Tracey KJ. Physiology and immunology of the cholinergic antiinflammatory pathway. J Clin Invest. 2007;117(2):289–296. doi:10.1172/JCI30555
12. Fujii T, Takada-Takatori Y, Kawashima K. Basic and clinical aspects of non-neuronal acetylcholine: expression of an independent, non-neuronal cholinergic system in lymphocytes and its clinical significance in immunotherapy. J Pharmacol Sci. 2008;106(2):186–192. doi:10.1254/jphs.FM0070109
13. Yang X, Zhao C, Gao Z, Su X. A novel regulator of lung inflammation and immunity: pulmonary parasympathetic inflammatory reflex. QJM. 2014;107(10):789–792. doi:10.1093/qjmed/hcu005
14. Reardon C, Murray K, Lomax AE. Neuroimmune Communication in Health and Disease. Physiol Rev. 2018;98(4):2287–2316. doi:10.1152/physrev.00035.2017
15. Cox MA, Bassi C, Saunders ME, et al. Beyond neurotransmission: acetylcholine in immunity and inflammation. J Intern Med. 2020;287(2):120–133. doi:10.1111/joim.13006
16. Gwilt CR, Donnelly LE, Rogers DF. The non-neuronal cholinergic system in the airways: an unappreciated regulatory role in pulmonary inflammation? Pharmacol Ther. 2007;115(2):208–222. doi:10.1016/j.pharmthera.2007.05.007
17. Rosas-Ballina M, Olofsson PS, Ochani M, et al. Acetylcholine-synthesizing T cells relay neural signals in a vagus nerve circuit. Science. 2011;334(6052):98–101. doi:10.1126/science.1209985
18. Cox MA, Duncan GS, Lin GHY, et al. Choline acetyltransferase–expressing T cells are required to control chronic viral infection. Science. 2019;363(6427):639–644. doi:10.1126/science.aau9072
19. Reardon C, Duncan GS, Brustle A, et al. Lymphocyte-derived ACh regulates local innate but not adaptive immunity. Proc Natl Acad Sci U S A. 2013;110(4):1410–1415. doi:10.1073/pnas.1221655110
20. Wang H, Yu M, Ochani M, et al. Nicotinic acetylcholine receptor α7 subunit is an essential regulator of inflammation. Nature. 2003;421(6921):384–388. doi:10.1038/nature01339
21. Pinheiro NM, Santana FPR, Almeida RR, et al. Acute lung injury is reduced by the α7nAChR agonist PNU-282987 through changes in the macrophage profile. FASEB J. 2017;31(1):320–332. doi:10.1096/fj.201600431r
22. Giebelen IA, van Westerloo DJ, LaRosa GJ, de Vos AF. van der Poll T. Local stimulation of alpha7 cholinergic receptors inhibits LPS-induced TNF-alpha release in the mouse lung. Shock. 2007;28(6):700–703.
23. Su X, Lee JW, Matthay ZA, et al. Activation of the α7 nAChR reduces acid-induced acute lung injury in mice and rats. Am J Respir Cell Mol Biol. 2007;37(2):186–192. doi:10.1165/rcmb.2006-0240OC
24. Su X, Matthay MA, Malik AB. Requisite role of the cholinergic α7 nicotinic acetylcholine receptor pathway in suppressing gram-negative sepsis-induced acute lung inflammatory injury. J Immunol. 2010;184(1):401–410. doi:10.4049/jimmunol.0901808
25. Gahring LC, Myers EJ, Dunn DM, Weiss RB, Rogers SW, Koval M. Nicotinic alpha 7 receptor expression and modulation of the lung epithelial response to lipopolysaccharide. PLoS One. 2017;12(4):e0175367–e0175367. doi:10.1371/journal.pone.0175367
26. Aghasafari P, George U, Pidaparti R. A review of inflammatory mechanism in airway diseases. Inflammation Res. 2019;68(1):59–74.
27. D’Elia RV, Harrison K, Oyston PC, Lukaszewski RA, Clark GC. Targeting the “cytokine storm” for therapeutic benefit. Clin Vaccine Immunol. 2013;20(3):319–327. doi:10.1128/CVI.00636-12
28. Zhang X, Tan Y, Ling Y, et al. Viral and host factors related to the clinical outcome of COVID-19. Nature. 2020.
29. Eickhoff TC. Observations on excess mortality associated with epidemic influenza. JAMA. 1961;176(9):776–782. doi:10.1001/jama.1961.03040220024005
30. McElhaney JE, Verschoor CP, Andrew MK, Haynes L, Kuchel GA, Pawelec G. The immune response to influenza in older humans: beyond immune senescence. Immun Ageing. 2020;17(1):10. doi:10.1186/s12979-020-00181-1
31. Kummer W, Krasteva-Christ G. Non-neuronal cholinergic airway epithelium biology. Curr Opin Pharmacol. 2014;16:43–49. doi:10.1016/j.coph.2014.03.001
32. Kummer W, Lips KS, Pfeil U. The epithelial cholinergic system of the airways. Histochem Cell Biol. 2008;130(2):219–234. doi:10.1007/s00418-008-0455-2
33. Wessler IK, Kirkpatrick CJ. The Non-neuronal cholinergic system: an emerging drug target in the airways. Pulm Pharmacol Ther. 2001;14(6):423–434. doi:10.1006/pupt.2001.0313
34. Grando SA, Kawashima K, Kirkpatrick CJ, Meurs H, Wessler I. The non-neuronal cholinergic system: basic science, therapeutic implications and new perspectives. Life Sci. 2012;91(21–22):969–972.
35. Pavlov VA, Tracey KJ. Neural circuitry and immunity. Immunol Res. 2004;9(1–3):38–57. doi:10.1007/s12026-015-8718-1
36. Fudim M, Qadri YJ, Ghadimi K, et al. Implications for neuromodulation therapy to control inflammation and related organ dysfunction in COVID-19. J Cardiovasc Transl Res. 2020;1–6.
37. Tallini YN, Shui B, Greene KS, et al. BAC transgenic mice express enhanced green fluorescent protein in central and peripheral cholinergic neurons. Physiol Genomics. 2006;27(3):391–397.
38. Sanderson SD, Thoman ML, Kis K, et al. Innate immune induction and influenza protection elicited by a response-selective agonist of human C5a. PLoS One. 2012;7(7):e40303.
39. Scriba TJ, Purbhoo M, Day CL, et al. Ultrasensitive detection and phenotyping of CD4+ T cells with optimized HLA class II tetramer staining. J Immunol. 2005;175(10):6334–6343.
40. Schebb NH, Fischer D, Hein EM, et al. Fast sample preparation and liquid chromatography-tandem mass spectrometry method for assaying cell lysate acetylcholine. J Chromatogr A. 2008;1183(1–2):100–107.
41. Tufi S, Lamoree M, de Boer J, Leonards P. Simultaneous analysis of multiple neurotransmitters by hydrophilic interaction liquid chromatography coupled to tandem mass spectrometry. J Chromatogr A. 2015;1395:79–87.
42. Feuer R, Ruller CM, An N, et al. Viral persistence and chronic immunopathology in the adult central nervous system following Coxsackievirus infection during the neonatal period. J Virol. 2009;83(18):9356–9369.
43. Otsu N, Threshold Selection A. Method from gray-level histograms. IEEE Trans Syst Man Cybern. 1979;9(1):62–66.
44. Sahoo PK, Soltani S, Wong AKC. A survey of thresholding techniques. Computer Vision Graphics Image Proc. 1988;41(2):233–260.
45. Vala H, Baxi A. A review on Otsu image segmentation algorithm. Int J Adv Res Computer Eng Tech. 2013;2(2):387–389.
46. Mohammadi-Sardo S, Labibi F, Shafiei SA. A new approach for detecting abnormalities in mammograms using a computer-aided windowing system based on Otsu’s method. Radiol Phys Technol. 2019;12(2):178–184.
47. Xiao L, Ouyang H, Fan C, Umer T, Poonia RC, Wan S. Gesture image segmentation with Otsu’s method based on noise adaptive angle threshold. Multimed Tools Appl. 2020;214.
48. Goodman SN, Of P. Values and Bayes: a modest proposal. Epidemiology. 2001;12:3.
49. Halsey LG. The reign of the p-value is over: what alternative analyses could we employ to fill the power vacuum? Biol Lett. 2019;15(5):20190174.
50. Rosenberry TL. Catalysis by acetylcholinesterase: evidence that the rate-limiting step for acylation with certain substrates precedes general acid-base catalysis. Proc Natl Acad Sci U S A. 1975;72(10):3834–3838.
51. Sastry BV, Sadavongvivad C. Cholinergic systems in non-nervous tissues. Pharmacol Rev. 1978;30(1):65–132.
52. Quinn DM. Acetylcholinesterase: enzyme structure, reaction dynamics, and virtual transition states. Chem Rev. 1987;87(5):955–979.
53. Schlereth T, Birklein F. an Haack K, et al. In vivo release of non-neuronal acetylcholine from the human skin as measured by dermal microdialysis: effect of botulinum toxin. Br J Pharmacol. 2006;147(2):183–187.
54. Turner DL, Bickham KL, Thome JJ, et al. Lung niches for the generation and maintenance of tissue-resident memory T cells. Mucosal Immunol. 2014;7(3):501–510.
55. Yasuda T, Wirtz T, Zhang B, et al. Studying Epstein-Barr virus pathologies and immune surveillance by reconstructing EBV infection in mice. Cold Spring Harb Symp Quant Biol. 2013;78:259–263.
56. Teijaro JR, Turner D, Pham Q, Wherry EJ, Lefrancois L, Farber DL. Cutting edge: tissue-retentive lung memory CD4 T cells mediate optimal protection to respiratory virus infection. J Immunol. 2011;187(11):5510–5514.
57. Watano K, Iwabuchi K, Fujii S, et al. Allograft inflammatory factor-1 augments production of interleukin-6, −10 and −12 by a mouse macrophage line. Immunology. 2001;104(3):307–316.
58. Park JM, Greten FR, Wong A, et al. Signaling pathways and genes that inhibit pathogen-induced macrophage apoptosis–CREB and NF-kappaB as key regulators. Immunity. 2005;23(3):319–329.
59. Tang X, Marciano DL, Leeman SE, Amar S. LPS induces the interaction of a transcription factor, LPS-induced TNF-alpha factor, and STAT6(B) with effects on multiple cytokines. Proc Natl Acad Sci U S A. 2005;102(14):5132–5137.
60. Donovan KM, Leidinger MR, McQuillen LP, et al. Allograft inflammatory factor 1 as an immunohistochemical marker for macrophages in multiple tissues and laboratory animal species. Comp Med. 2018;68(5):341–348.
61. Freeman JJ, Macri JR, Choi RL, Jenden DJ. Studies on the behavioral and biochemical effects of hemicholinium in vivo. J Pharmacol Exp Ther. 1979;210(1):91–97.
62. Saltarelli MD, Lowenstein PR, Coyle JT. Rapid in vitro modulation of [3H]hemicholinium-3 binding sites in rat striatal slices. Eur J Pharmacol. 1987;135(1):35–40.
63. Fisher AB, Chander A, Dodia C, Reicherter J, Kleinzeller A. Choline transport by lung epithelium. Am J Respir Cell Mol Biol. 1989;1(6):455–462.
64. Fujii T, Okuda T, Haga T, Kawashima K. Detection of the high-affinity choline transporter in the MOLT-3 human leukemic T-cell line. Life Sci. 2003;72(18–19):2131–2134.
65. Ennis EA, Blakely RD. Choline on the Move: perspectives on the molecular physiology and pharmacology of the presynaptic choline transporter. Adv Pharmacol. 2016;76:175–213.
66. Koshy Cherian A, Parikh V, Wu Q, et al. Hemicholinium-3 sensitive choline transport in human T lymphocytes: evidence for use as a proxy for brain choline transporter (CHT) capacity. Neurochem Int. 2017;108:410–416.
67. Parikh V, Sarter M. Cortical choline transporter function measured in vivo using choline-sensitive microelectrodes: clearance of endogenous and exogenous choline and effects of removal of cholinergic terminals. J Neurochem. 2006;97(2):488–503.
68. Hoover DB. Cholinergic modulation of the immune system presents new approaches for treating inflammation. Pharmacol Ther. 2017;179:1–16.
69. Borovikova LV, Ivanova S, Zhang M, et al. Vagus nerve stimulation attenuates the systemic inflammatory response to endotoxin. Nature. 2000;405(6785):458–462.
70. Wang H, Liao H, Ochani M, et al. Cholinergic agonists inhibit HMGB1 release and improve survival in experimental sepsis. Nat Med. 2004;10(11):1216–1221.
71. van der Zanden EP, Snoek SA, Heinsbroek SE, et al. Vagus nerve activity augments intestinal macrophage phagocytosis via nicotinic acetylcholine receptor alpha4beta2. Gastroenterology. 2009;137(3):1029–1039.
72. Jiang W, Li D, Han R, et al. Acetylcholine-producing NK cells attenuate CNS inflammation via modulation of infiltrating monocytes/macrophages. Proc Natl Acad Sci U S A. 2017;114(30):E6202–e6211.
73. Rosas-Ballina M, Ochani M, Parrish WR, et al. Splenic nerve is required for cholinergic antiinflammatory pathway control of TNF in endotoxemia. Proc Natl Acad Sci U S A. 2008;105(31):11008–11013.
74. Kistemaker LE, Gosens R. Acetylcholine beyond bronchoconstriction: roles in inflammation and remodeling. Trends Pharmacol Sci. 2015;36(3):164–171.
75. Artigas A, Camprubí-Rimblas M, Tantinyà N, Bringué J, Guillamat-Prats R, Matthay MA. Inhalation therapies in acute respiratory distress syndrome. Ann Translational Med. 2017;5(14):12.
76. Boehringer Ingelheim Pharmaceuticals In. Combivent (Ipratropium Bromide and Albuterol Sulfate) Inhalation Aerosol Prescribing Information. Ridgefield, CT; 2001.
77. Klapproth H, Reinheimer T, Metzen J, et al. Non-neuronal acetylcholine, a signalling molecule synthesized by surface cells of rat and man. Naunyn Schmiedebergs Arch Pharmacol. 1997;355(4):515–523.
78. Pinheiro NM, Miranda CJ, Perini A, et al. Pulmonary inflammation is regulated by the levels of the vesicular acetylcholine transporter. PLoS One. 2015;10(3):e0120441.
79. Sun P, Li L, Zhao C, Pan M, Qian Z, Su X. Deficiency of α7 nicotinic acetylcholine receptor attenuates bleomycin-induced lung fibrosis in mice. Mol Med. 2017;23:34–49.
80. Kelemen SE, Autieri MV. Expression of allograft inflammatory factor-1 in T lymphocytes: a role in T-lymphocyte activation and proliferative arteriopathies. Am J Pathol. 2005;167(2):619–626.
81. Del Galdo F, Maul GG, Jiménez SA, Artlett CM. Expression of allograft inflammatory factor 1 in tissues from patients with systemic sclerosis and in vitro differential expression of its isoforms in response to transforming growth factor beta. Arthritis Rheum. 2006;54(8):2616–2625.
82. Zhao -Y-Y, Yan D-J, Chen Z-W. Role of AIF-1 in the regulation of inflammatory activation and diverse disease processes. Cell Immunol. 2013;284(1):75–83.
83. Nagahara H, Seno T, Yamamoto A, et al. Role of allograft inflammatory factor-1 in bleomycin-induced lung fibrosis. Biochem Biophys Res Commun. 2018;495(2):1901–1907.
84. Frevert CW, Huang S, Danaee H, Paulauskis JD, Kobzik L. Functional characterization of the rat chemokine KC and its importance in neutrophil recruitment in a rat model of pulmonary inflammation. J Immunol. 1995;154(1):335–344.
85. Toapanta FR, Ross TM. Impaired immune responses in the lungs of aged mice following influenza infection. Respir Res. 2009;10:112.
86. Wonnacott S. The paradox of nicotinic acetylcholine receptor upregulation by nicotine. Trends Pharmacol Sci. 1990;11(6):216–219.
87. WE SJ M-G, Ehringer MA. Nicotinic acetylcholine receptors: upregulation, age-related effects, and associations with drug use. Genes Brain Behav. 2015;1:12.
88. Cardinali DP, Brusco LI, Selgas L, Esquifino AI. Diurnal rhythms in ornithine decarboxylase activity and norepinephrine and acetylcholine synthesis in submaxillary lymph nodes and spleen of young and aged rats during Freund’s adjuvant-induced arthritis. Brain Res. 1998;789(2):283–292.
89. Cardinali DP, Brusco LI, García Bonacho M, Esquifìno AI. Effect of melatonin on 24-hour rhythms of ornithine decarboxylase activity and norepinephrine and acetylcholine synthesis in submaxillary lymph nodes and spleen of young and aged rats. Neuroendocrinology. 1998;67(5):349–362.
90. Das UN. Acetylcholinesterase and butyrylcholinesterase as possible markers of low-grade systemic inflammation. Med Sci Monit. 2007;13(12):Ra214–221.
91. Franceschi C. Inflammaging as a major characteristic of old people: can it be prevented or cured? Nutr Rev. 2007;65(12 Pt 2):S173–176.
92. van Beek AA, Van den Bossche J, Mastroberardino PG, de Winther MPJ, Leenen PJM. Metabolic alterations in aging macrophages: ingredients for inflammaging? Trends Immunol. 2019;40(2):113–127.
93. Reale M, Iarlori C, Gambi F, et al. Treatment with an acetylcholinesterase inhibitor in Alzheimer patients modulates the expression and production of the pro-inflammatory and anti-inflammatory cytokines. J Neuroimmunol. 2004;148(1):162–171.
94. Reale M, Iarlori C, Gambi F, Lucci I, Salvatore M, Gambi D. Acetylcholinesterase inhibitors effects on oncostatin-M, interleukin-1β and interleukin-6 release from lymphocytes of Alzheimer’s disease patients. Exp Gerontol. 2005;40(3):165–171.
95. Kokras N, Stamouli E, Sotiropoulos I, et al. Acetyl cholinesterase inhibitors and cell-derived peripheral inflammatory cytokines in early stages of Alzheimer’s disease. J Clin Psychopharmacol. 2018;38(2):138–143.
96. Bhattacharjee S, Patanwala AE, W-H L-C, et al. Alzheimer’s disease medication and risk of all-cause mortality and all-cause hospitalization: a retrospective cohort study. Alzheimers Dement. 2019;5:294–302.
97. Abe Y, Shimokado K, Fushimi K. Donepezil is associated with decreased in-hospital mortality as a result of pneumonia among older patients with dementia: a retrospective cohort study. Geriatr Gerontol Int. 2018;18(2):269–275.
 © 2020 The Author(s). This work is published and licensed by Dove Medical Press Limited. The
full terms of this license are available at https://www.dovepress.com/terms
and incorporate the Creative Commons Attribution
- Non Commercial (unported, 3.0) License.
By accessing the work you hereby accept the Terms. Non-commercial uses of the work are permitted
without any further permission from Dove Medical Press Limited, provided the work is properly
attributed. For permission for commercial use of this work, please see paragraphs 4.2 and 5 of our Terms.
© 2020 The Author(s). This work is published and licensed by Dove Medical Press Limited. The
full terms of this license are available at https://www.dovepress.com/terms
and incorporate the Creative Commons Attribution
- Non Commercial (unported, 3.0) License.
By accessing the work you hereby accept the Terms. Non-commercial uses of the work are permitted
without any further permission from Dove Medical Press Limited, provided the work is properly
attributed. For permission for commercial use of this work, please see paragraphs 4.2 and 5 of our Terms.