Back to Journals » Diabetes, Metabolic Syndrome and Obesity » Volume 18
A Prospective Study of the Correlation Between Time in Range and Incidence of Diabetic Cardiovascular Autonomic Neuropathy in Patients with Type 2 Diabetes Mellitus
Authors Shan X ![]() , Yao S, Hu B
, Yao S, Hu B ![]() , Xu C, Cao Y
, Xu C, Cao Y ![]() , Dai W
, Dai W ![]()
Received 26 March 2025
Accepted for publication 9 July 2025
Published 29 July 2025 Volume 2025:18 Pages 2585—2596
DOI https://doi.org/10.2147/DMSO.S526784
Checked for plagiarism Yes
Review by Single anonymous peer review
Peer reviewer comments 4
Editor who approved publication: Dr Rebecca Baqiyyah Conway
Xiangxiang Shan,1,2 Shenhang Yao,1,2 Ben Hu,2,3 Chi Xu,1,2 Yonghong Cao,1,2 Wu Dai1,2
1Department of Endocrinology, The Second People’s Hospital of Hefei, Hefei Hospital Affiliated to Anhui Medical University, Hefei, Anhui, 230011, People’s Republic of China; 2The Fifth Clinical School of Medicine, Anhui Medical University, Hefei, Anhui, 230032, People’s Republic of China; 3Department of Cardiology, The Second People’s Hospital of Hefei, Hefei Hospital Affiliated to Anhui Medical University, Hefei, Anhui, 230011, People’s Republic of China
Correspondence: Yonghong Cao, Department of Endocrinology, The Second People’s Hospital of Hefei, Hefei Hospital Affiliated to Anhui Medical University, Hefei, Anhui, 230011, People’s Republic of China, Email [email protected] Wu Dai, Department of Endocrinology, The Second People’s Hospital of Hefei, Hefei Hospital Affiliated to Anhui Medical University, Hefei, Anhui, 230011, People’s Republic of China, Email [email protected]
Purpose: To investigate the correlation between time in range (TIR) and the risk of cardiovascular autonomic neuropathy (CAN) development in patients with Type 2 diabetes mellitus (T2DM).
Patients and Methods: This prospective cohort study enrolled patients with type 2 diabetes mellitus (T2DM) hospitalized and followed at the Department of Endocrinology, Hefei Hospital of Anhui Medical University, between September 2020 and July 2024. All participants underwent standardized cardiovascular autonomic neuropathy (CAN) assessment via the Ewing test, and time in range (TIR) was derived from baseline continuous glucose monitoring (CGM) data. Cox proportional hazards regression models were used to estimate hazard ratios (HRs) and 95% confidence intervals (CIs) for CAN incidence, adjusted for relevant covariates.
Results: Over a median follow-up of 25.0 months, 123 of 196 participants (62.8%) were diagnosed with CAN. The CAN group exhibited longer diabetes duration, lower time in range (TIR) and body mass index (BMI), higher time above range (TAR), mean glucose (MG), urinary albumin-to-creatinine ratio (UACR), and higher insulin use rates. Participants with low TIR were older, had longer diabetes duration, and displayed: 1. Higher fasting plasma glucose (FPG), HbA1c, and LDL-C levels; 2. Elevated glycemic variability (MAGE, CV, LAGE, SD, MG, TAR) via continuous glucose monitoring (CGM); 3. Greater likelihood of insulin therapy. All differences were statistically significant (P < 0.05). Multivariable Cox regression analyses, adjusted for key covariates (eg, age, HbA1c, insulin use), demonstrated an inverse association between TIR and CAN incidence.
Conclusion: Lower TIR is an independent risk factor for CAN in T2DM patients, with higher TIR levels associated with reduced CAN risk (P < 0.05).
Keywords: time in range, cardiovascular autonomic neuropathy, type 2 diabetes, cohort study
Introduction
Diabetes mellitus (DM) has become a critical global public health issue, with an estimated 535 million people affected worldwide. This number is projected to rise to 783 million1 by 2045, of whom more than 90% suffer from T2DM.2
As the prevalence of diabetes mellitus rises, microvascular and macrovascular complications in this population are increasing. Among these, cardiac autonomic neuropathy (CAN) is often overlooked due to its insidious and asymptomatic early stages.3–5 Studies suggest that progressive CAN involves damage to cardiovascular autonomic nerve fibers, impairing vascular dynamics and heart rate variability. This elevates the risk of asymptomatic myocardial ischemia, infarction,6 and sudden cardiovascular death. Cardiovascular mortality is significantly higher in T2DM patients with CAN than in those without CAN.3,7–11
Although glycated hemoglobin (HbA1c) remains a cornerstone of glycemic management and is considered the gold standard for glycemic control, it reflects only the average blood glucose level over 2–3 months. It does not capture intra-day glucose fluctuations or extreme glycemic events (eg, hypoglycemia/hyperglycemia), which may exacerbate autonomic nerve damage via oxidative stress and endothelial dysfunction.12 Continuous glucose monitoring (CGM) captures 24-hour glucose data, offering comprehensive, real-time insights into glycemic variability. CGM is a critical adjunct to glucose management.13–16 The 2020 American Diabetes Association Standards of Care17 formally endorsed CGM-derived time in range (TIR) as a key metric, given its widespread adoption in clinical research and diabetes evaluation. TIR has become a pivotal factor in guiding glycemic management decisions.
Although TIR’s association with diabetic retinopathy and nephropathy has been explored,8,18 no prospective studies have examined its longitudinal relationship with cardiovascular autonomic neuropathy (CAN). This study aims to address this gap by leveraging data from a prospective T2DM cohort to evaluate CGM metrics as predictors of diabetic autonomic complications.
Subjects and Methods
Study population This prospective dynamic cohort study included patients with T2DM admitted to the Department of Endocrinology, Hefei Hospital of Anhui Medical University, between September 2020 and July 2024. Inclusion criteria: (1) Diagnosis of T2DM per the 1999 World Health Organization (WHO) criteria; (2) Completion of both continuous glucose monitoring (CGM) and Ewing tests during hospitalization. Exclusion criteria: (1) Pregnant or breastfeeding women; (2) Serious diseases of vital organs (heart, liver, brain, kidneys); (3) Mental or physical disabilities preventing cooperation with examinations; (4) Suspected or confirmed alcohol/drug abuse; (5) Recent acute diabetes complications (eg, diabetic ketoacidosis, hyperosmolar hyperglycemic state, lactic acidosis, or severe hypoglycemic events with altered consciousness); (6) Use of heart rate-affecting medications (eg, beta-blockers, beta-agonists, adrenergic agents) 48 hours prior to testing; (7) Severe hypertension or proliferative retinopathy contraindicating Ewing tests; (8) Incomplete clinical or CGM data. Participants were advised to attend regular follow-up visits for diabetic complication screening; however, hospitalization frequency was not standardized. During each hospitalization, specialists re-administered the Ewing test to evaluate cardiovascular autonomic neuropathy (CAN). By July 2024, 342 patients diagnosed with type 2 diabetes mellitus (T2DM) were enrolled. Of these, 115 had CAN at baseline. Among 227 patients without CAN, 31 were excluded due to ineligibility, loss to follow-up, or withdrawal, resulting in 196 participants (120 men, 76 women) who completed the study. Figure 1 shows the study flowchart.
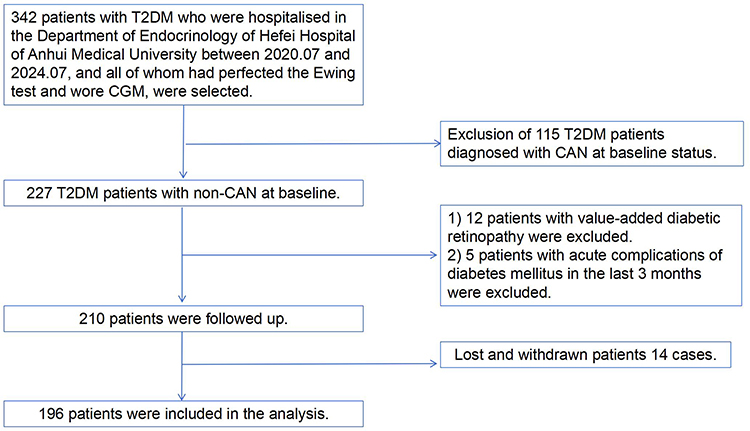 |
Figure 1 Flow chart. As illustrated in the figure, the study workflow outlines the screening, follow-up, outcome assessment, and analysis procedures for all participants from baseline to study conclusion. |
Ethical Approval and Registration
This observational cohort study adhered to the Declaration of Helsinki and received ethical approval from the Second People’s Hospital of Hefei (HFEY-2022-070; 26 May 2022). All participants provided written informed consent. While not registered with ClinicalTrials.gov due to its observational design, the methodology and analysis followed standardized protocols to ensure transparency.
General Information
Data collected included gender, age, diabetes duration, diabetes-related complications, comorbidities, and current medications. Blood pressure, height, and weight were measured for all participants. Body mass index (BMI) was calculated as weight (kg) divided by height squared (m²).
Blood pressure measurement: The Omron HEM-7221 automated monitor measured blood pressure in both arms. For the arm with the higher reading, a repeat measurement was performed after a 2-minute interval. The average of the two readings was calculated to minimize measurement error.
Laboratory Data
Participants fasted for 10 hours before venous blood collection. Biochemical analyses included fasting blood glucose (FBG), fasting C-peptide (FCP), hemoglobin A1c (HbA1c), total cholesterol (TC), triglycerides (TG), low-density lipoprotein cholesterol (LDL-C), high-density lipoprotein cholesterol (HDL-C), serum creatinine (Scr), serum uric acid (SUA), and urinary albumin-to-creatinine ratio (UACR). These laboratory parameters were measured using a Beckman Coulter AU5800 automated biochemical analyzer (Beckman Coulter, Brea, California, USA).
CGM Parameters
A continuous glucose monitoring system (CGMS; RGES II, HuBei, China) was used to monitor blood glucose in all patients for 72 hours. Fingertip blood glucose measurements (≥4 times daily) served as calibration. The CGMS provided the following metrics: intraday mean amplitude of glycemic excursions (MAGE), largest amplitude of glycemic excursion (LAGE), coefficient of variation (CV), 24-hour mean blood glucose (24hMBG), standard deviation of blood glucose (SDBG), time in range (TIR; 3.9–10.0 mmol/L), time below range (TBR; <3.9 mmol/L), and time above range (TAR; >10.0 mmol/L). Hypoglycemic episodes (glucose <3.9 mmol/L) were classified as symptomatic if accompanied by sympathetic activation (eg, palpitations, dizziness, hunger, sweating, or tremors) or asymptomatic if no symptoms were reported. The proportions of total hypoglycemia and asymptomatic hypoglycemia were calculated.
CAN Diagnostic Criteria
(1). Resting heart rate: >100 beats/min (abnormal; cardiac arrhythmias and heart failure excluded). (2). Handgrip test: After 3 minutes of sustained maximal handgrip, systolic blood pressure rise ≥16 mm Hg (1 mm Hg = 0.133 kPa) is normal; ≤10 mm Hg is abnormal. (3). Postural blood pressure difference: Measure blood pressure in the supine position at rest, then immediately after standing. A drop in systolic blood pressure >20 mm Hg or diastolic blood pressure >10 mm Hg within 1 minute is abnormal. (4). Heart rate response to standing: Normal: >10 beats/min increase; abnormal: ≤10 beats/min.
Participants rested for ≥2 minutes between tests. Abnormalities in criteria 1, 2, or 4 scored 1 point each; criterion 3 abnormalities scored 2 points. Participants with ≥2 abnormalities and total score ≥2 were diagnosed with CAN and assigned to the CAN group. Those with a score <2 or only one abnormality comprised the no-CAN group.
Our diagnostic tests for CAN are derived from the Cardiovascular Reflex Tests (CARTs) proposed by Ewing et al in 1985. The CARTs19 consist of five simple, non-invasive tests of cardiovascular function used to assess autonomic function. The CAN sub-committee of the Toronto Consensus of 201120 recommended that the heart rate response to deep breathing, standing, and the Valsalva manoeuvre (CART), and the blood pressure response to standing be the four gold standard tests for CAN, and that abnormalities in ≥2 results be used as criteria for the diagnosis of CAN. And blood pressure response during standing as the four gold standard tests for CAN and abnormalities in ≥2 results as the criteria for diagnosing CAN, which demonstrated the best sensitivity (82%) and specificity (94%) for early CAN detection in the diabetic population. We acknowledge the operational complexities of the all-EUV test (eg, longer connection to the bedside ECG to measure the R-R interval, which may result in skin and mucosal damage to the subject and reduced compliance) and have supplemented our protocol with a prone-standing heart rate difference in lieu of the R-R interval in the assessment of sympathetic injury in the onset of CAN, to improve reproducibility.
Outcome Definition
A positive outcome was defined as a participant without cardiovascular autonomic neuropathy (CAN) at baseline who developed CAN during follow-up. Follow-up spanned from baseline enrollment until CAN diagnosis, the end of the study period, withdrawal, or death.
Follow-up Event Definition
Valid follow-up: Participants without CAN at baseline who either developed CAN during the study or completed follow-up without CAN diagnosis.
Ineffective follow-up: Participants who withdrew voluntarily, were lost to follow-up (>6 months), or unable to continue due to unforeseen circumstances (eg, relocation, illness).
Statistical Methods
Continuous variables were assessed for normality via the Shapiro–Wilk test and reported as median (IQR). Categorical variables were expressed as frequencies (%) and stratified by baseline time in range (TIR) quartiles. Group differences were evaluated using chi-square tests (categorical variables), one-way ANOVA (normally distributed continuous data), or the Kruskal–Wallis H-test (non-normally distributed data). TIR quartiles were analyzed as ordinal variables, with the lowest quartile (Q1) defined as the reference group. Multivariable Cox regression models estimated hazard ratios (HRs) and 95% confidence intervals (CIs) for CAN incidence across TIR quartiles. Variables with variance inflation factors (VIF) >5 were excluded to mitigate multicollinearity. Kaplan-Meier curves compared CAN incidence between quartiles. Subgroup analyses (age, sex, HbA1c, BMI) tested interactions using log-likelihood ratio tests. Restricted cubic spline analyses explored dose-response relationships, with node locations determined by the Akaike information criterion (AIC). Nonlinearity was assessed by comparing segmented and linear regression models using log-likelihood ratio tests. Models adjusted for confounders estimated HRs for TIR and CAN. Analyses used R v4.3.0 (R Foundation for Statistical Computing, Vienna, Austria). TIR quartiles (Q1: <51.5%; Q2: 51.5–70%; Q3: 70–84.5%; Q4: ≥84.5%) were derived from population percentiles. The above cut points of TIR were adopted because they were close to the 25th, 50th, and 75th percentiles of TIR in the study population. A two-sided P <0.05 was defined as statistically significant.
Results
Baseline Data Characteristics of Participants
A total of 196 participants (120 men, 76 women) were included. The median age at baseline was 59.52 (48.67, 70.13) years, median diabetes duration was 10 (6, 16) years, and median HbA1c was 8.32% (6.37%, 10.27%). Clinical characteristics stratified by TIR quartiles are shown in Table 1. Participants in the lowest TIR quartile were older, had longer diabetes duration, higher FBG, HbA1c, LDL-C, and greater glycemic variability (MAGE, CV, LAGE, SD, MG, TAR) measured by CGM, along with higher insulin use rates (p<0.05 for all). During a median follow-up of 25.0 months, CAN developed in 123 participants (62.8%). Baseline characteristics stratified by CAN status are shown in Table 2. The CAN group had longer diabetes duration, lower TIR and BMI, higher TAR, MG, UACR, and higher insulin use compared with the no-CAN group (p<0.05 for all).
 |
Table 1 Analysis of Baseline Information by TIR Quartile |
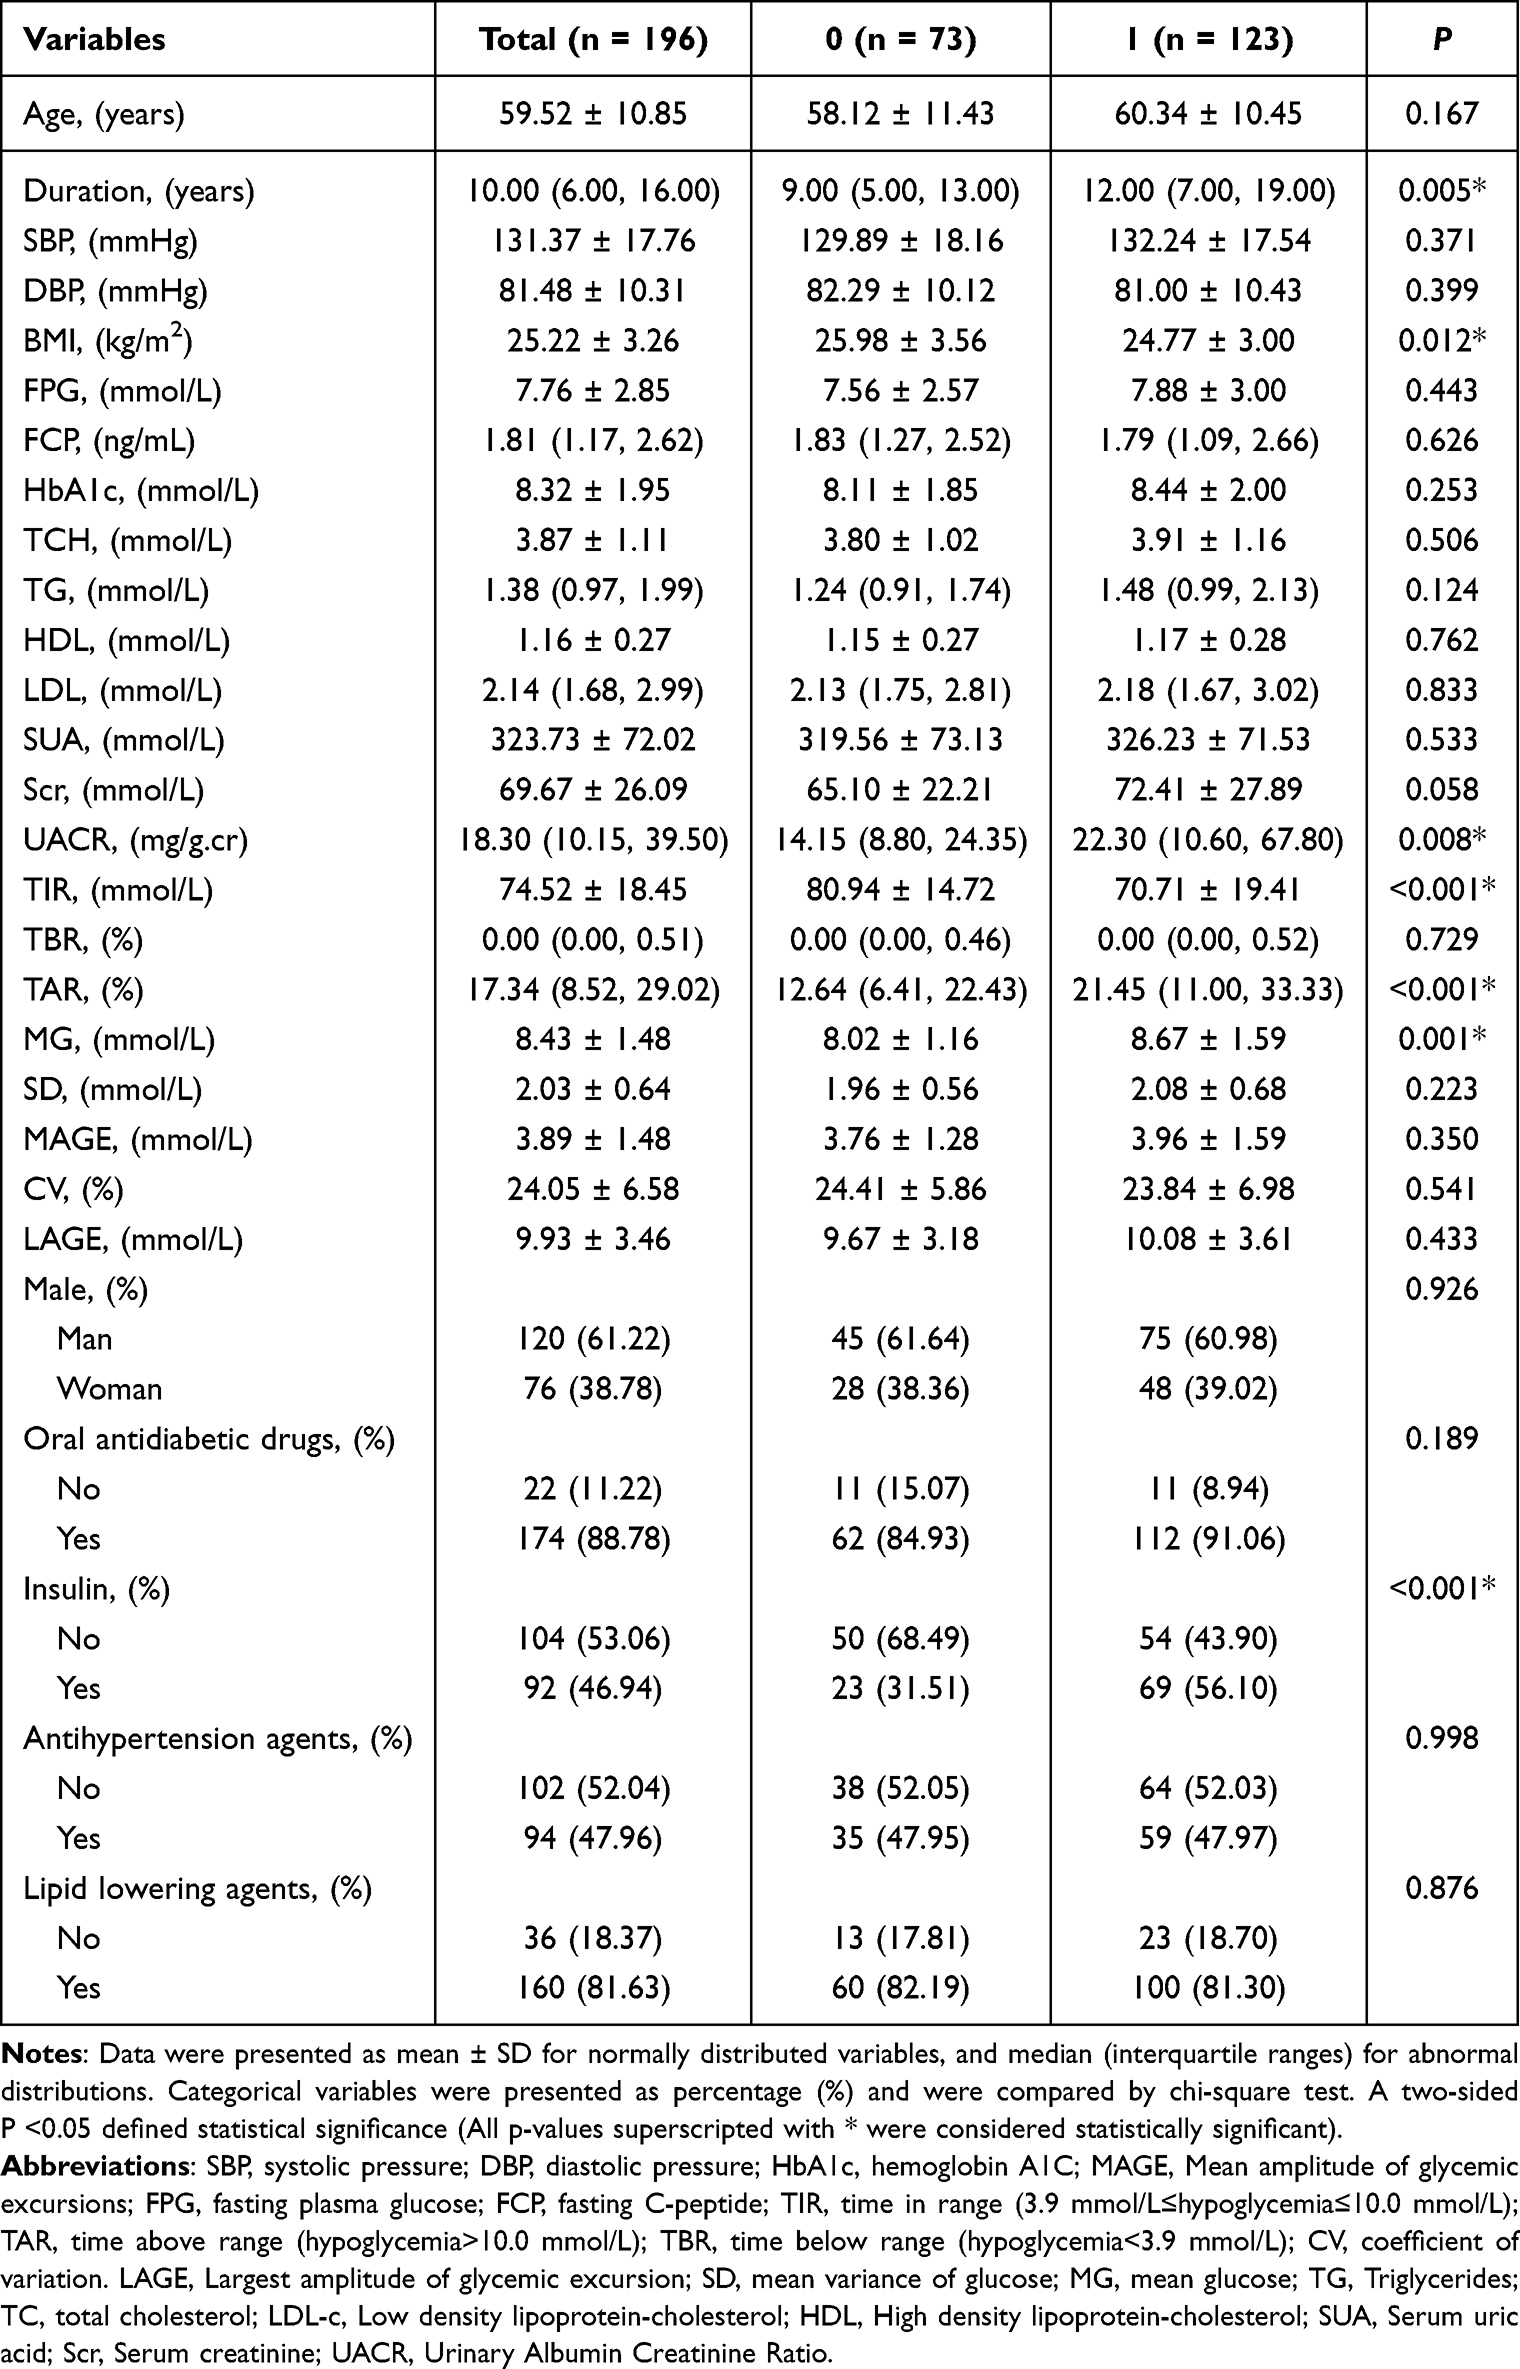 |
Table 2 Analysis of Baseline Information Grouped by CAN |
Association Between TIR and CAN
Participants were stratified into four TIR quartiles: Q1 (TIR <51.5%, n=49), Q2 (51.5%≤TIR<70%, n=49), Q3 (70%≤TIR<84.5%, n=49), and Q4 (TIR ≥84.5%, n=49), with Q1 as the reference group (Table 3). In Model 1 (unadjusted), the hazard ratios (HRs) and 95% confidence intervals (CIs) across quartiles were 1.00 (reference), 0.78 (0.49–1.24), 0.62 (0.38–1.02), and 0.54 (0.32–0.92), respectively (P for trend =0.022). After adjusting for sex, age, and BMI (Model 2), HRs were 1.00 (reference), 0.78 (0.49–1.24), 0.56 (0.33–0.95), and 0.57 (0.33–0.99) (P for trend=0.044). In Model 3 (adjusted for Male, Age, Duration, Oral antidiabetic drugs, Insulin, Systolic pressure, diastolic pressure, BMI, FPG, HbA1c, TG, TCH, Scr, UACR), HRs were 1.00 (reference), 0.72 (0.43–1.20), 0.45 (0.25–0.81; P=0.008), and 0.48 (0.24–0.95; P=0.036). Higher TIR quartiles remained inversely associated with CAN risk after multivariable adjustment (P for trend <0.05).
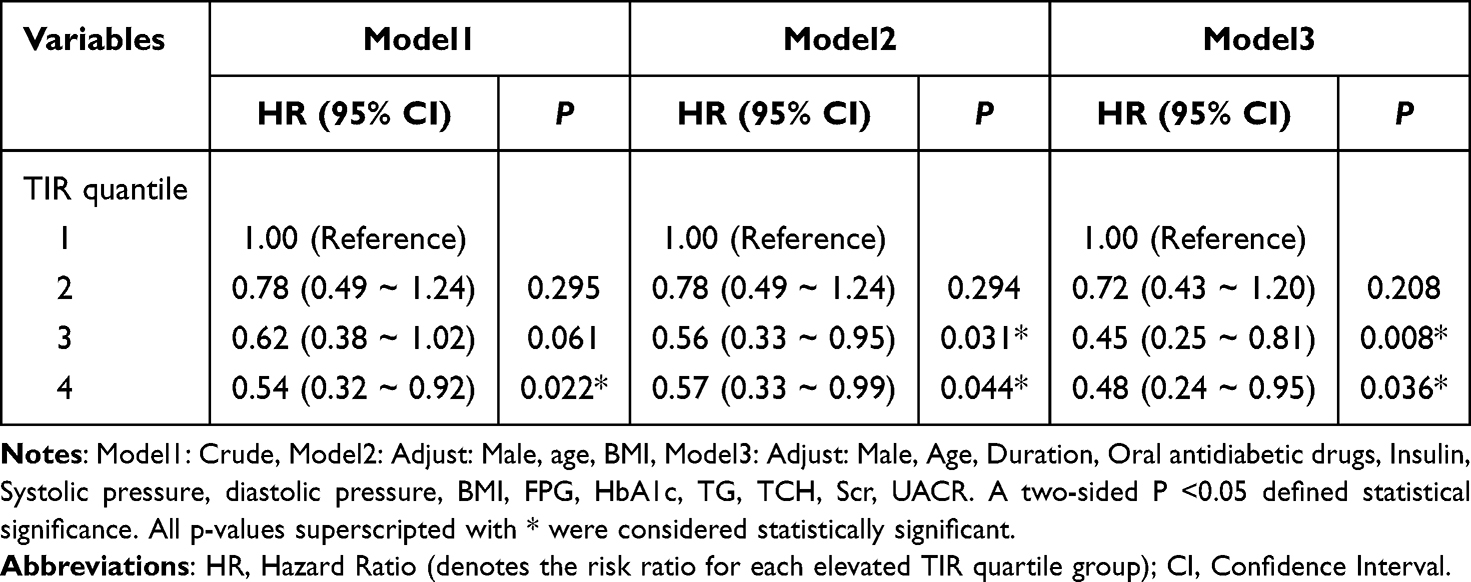 |
Table 3 Multifactor Cox Regression for TIR and CAN |
Kaplan-Meier curves (Figure 2) showed lower cumulative CAN incidence in higher TIR quartiles over time. The high-TIR group (Q4) had significantly reduced CAN risk after >30 months of follow-up (Log-rank P=0.048).
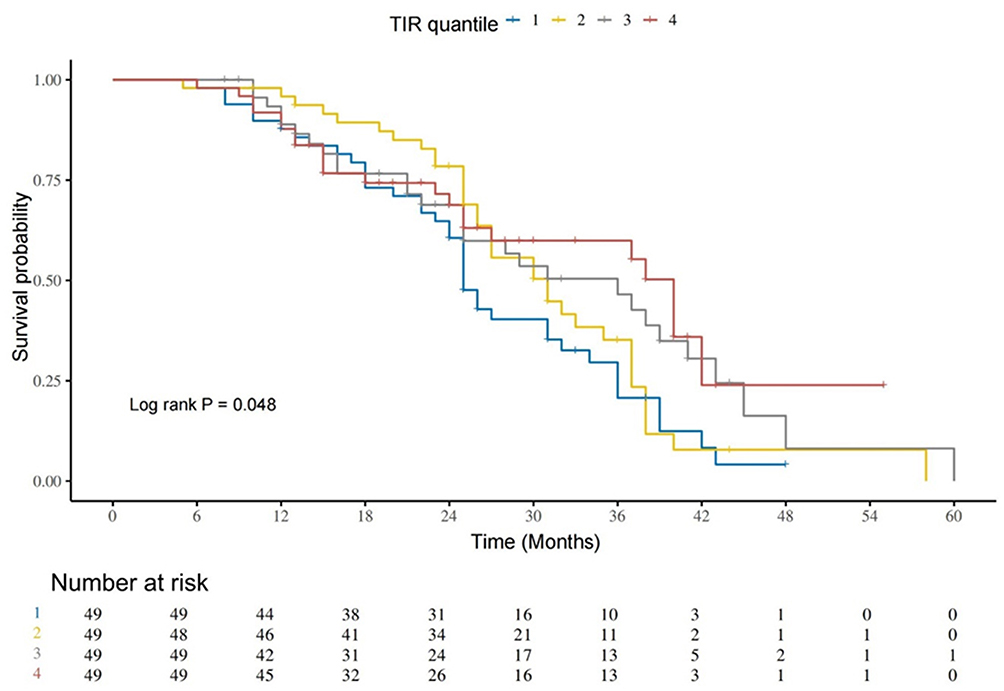 |
Figure 2 Temporal trends in non-CAN survival in groups with different TIR levels. Patients were categorized into groups based on TIR quartiles. The proportion of non-CAN patients progressively decreased across all groups over time, with a significant difference observed between the higher and lower TIR groups (p = 0.048). The significant difference among the groups was determined using the χ²-test. |
Restricted cubic spline analysis (Figure 3) revealed a nonlinear, inverse dose-response relationship between TIR and CAN risk (P for linearity <0.05).
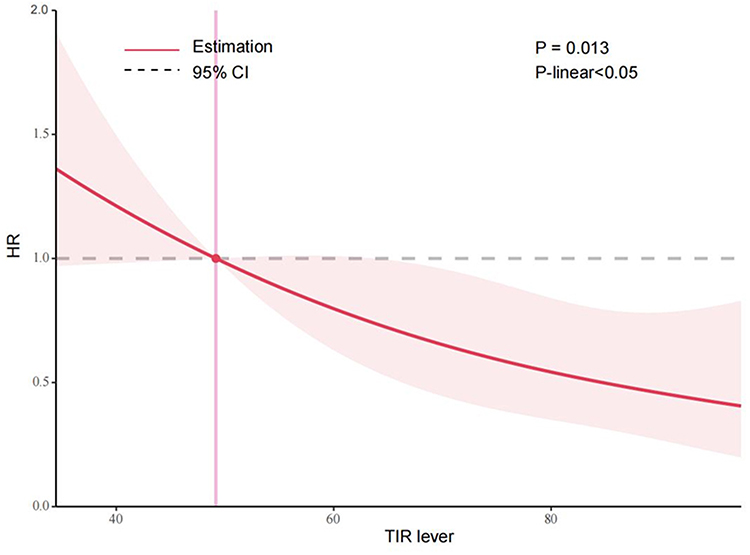 |
Figure 3 There is a non-linear relationship between TIR levels and the risk of developing CAN. The shaded area in Figure 3 represents the 95% confidence interval (CI). As shown, TIR exhibited a nonlinear negative correlation with the hazard ratio (HR) of CAN occurrence (p < 0.05 for nonlinearity). Abbreviations: HR, Hazard Ratio; TIR, Time in range. |
Subgroup Analyses of TIR versus Risk of Developing CAN
Subgroup analyses stratified by baseline age, sex, HbA1c, and body mass index (BMI) were conducted, excluding non-relevant variables. Adjustments matched Model 3 covariates. TIR remained inversely associated with CAN risk in most subgroups, including males, females, participants aged >65 years, and those with HbA1c >7.0 mmol/L (all P<0.05). No significant interaction effects were observed (P for interaction >0.05) except for BMI (Figure 4).
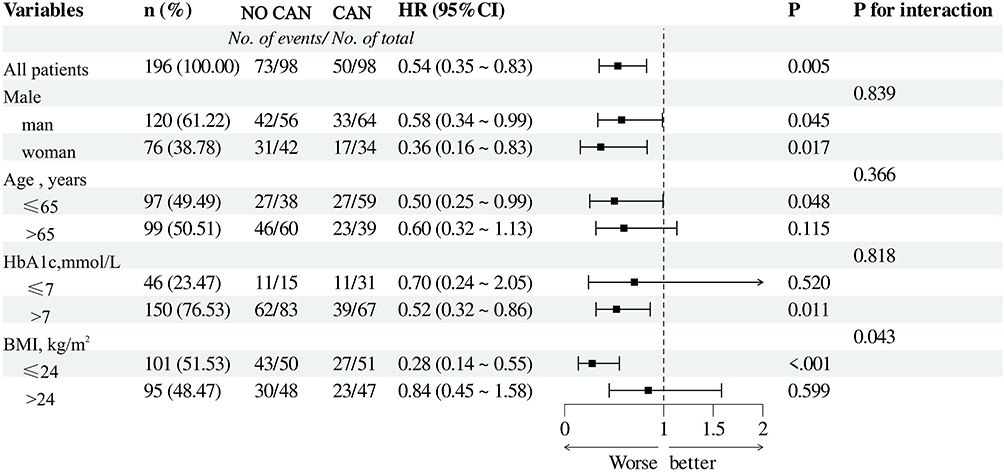 |
Figure 4 Forest plot of subgroup analyses of TIR and risk of CAN occurrence. HRs of CAN with each 1 group increase in TIR among subgroups. Adjusted for age, sex, duration of diabetes mellitus, body mass index, systolic blood pressure, FBG, Hb1Ac, total cholesterol, HDL cholesterol, LDL cholesterol, Scr, UACR, oral antihypertensive agents, oral hypoglycemic agents, lipid-lowering agents, insulin, and analogues. |
Discussion
TIR has emerged as a key metric for assessing glycemic control in recent years. Prior studies have established associations between TIR and diabetic microvascular complications (eg, retinopathy, nephropathy), carotid intima-media thickness, all-cause mortality, cardiovascular mortality, and atherosclerotic cardiovascular disease (ASCVD).7,8,15–17,21 For instance, Lu et al18 reported an inverse relationship between TIR and long-term all-cause and cardiovascular disease (CVD) mortality in patients with type 2 diabetes mellitus (T2DM) during a 10-year follow-up.
In this prospective study, higher time in range (TIR) was inversely associated with cardiovascular autonomic neuropathy (CAN) risk in T2DM patients. Participants in the highest TIR quartile had significantly lower CAN risk compared to the lowest quartile, even after adjusting for multiple confounders (P<0.05). These findings support TIR as a critical metric for clinical glucose management. TIR is increasingly recognized as a key glycemic control metric.
Chaerul et al22 retrospectively analyzed HbA1c, fasting, and postprandial glucose, reporting an inverse association between glycemic control and CAN incidence in T2DM patients. Similarly, Guo et al23 demonstrated that TIR independently predicted CAN risk, irrespective of HbA1c, with lower TIR and greater glycemic variability (eg, MAGE, CV) observed in patients with severe CAN. These findings align with our results.
Kim et al24 reported a correlation between TIR and cardiovascular autonomic function (r = 0.32, p < 0.05); however, their study did not adjust for the confounding effects of baseline HbA1c. In the present study, multivariate Cox regression revealed that even after adjusting for HbA1c, the risk of CAN showed a progressive decrease across ascending TIR quartiles (p < 0.05), indicating that the predictive value of TIR for CAN is independent of traditional glycemic indices. This finding supports the inclusion of TIR in risk stratification frameworks for diabetes-related complications.
The prevailing hypothesis for the pathogenesis of cardiovascular autonomic neuropathy (CAN) centers on chronic hyperglycemia.25 Elevated blood glucose levels drive excessive nicotinamide adenine dinucleotide phosphate (NADPH) production, which subsequently induces a pathologic surge in reactive oxygen species (ROS),26,27 triggering oxidative stress. ROS mediates cellular damage by oxidizing proteins, lipids, and nucleic acids, while simultaneously exacerbating mitochondrial dysfunction. Hyperglycemia also accelerates the non-enzymatic glycation of proteins and lipids, forming advanced glycation end products (AGEs),28 whose synthesis rate correlates directly with blood glucose concentration. AGEs bind to their receptor (RAGE), activating PI3K and MAPK signaling pathways. This cascade culminates in nuclear factor-κB (NF-κB) activation, which upregulates RAGE expression and stimulates pro-inflammatory cytokine production, thereby amplifying inflammation and insulin resistance.29–31
Furthermore, AGE accumulation disrupts microvascular endothelial integrity, causing autonomic nervous system microvascular damage and elevating the risk of vascular complications and CAN.32
Compared to the non-CAN group, subjects with CAN exhibited higher TAR levels, glycemic variability indices (SD, CV, and MG), and a greater proportion of insulin use. TAR reflects the percentage of time glucose levels exceeded 10 mmol/L, with higher values indicating elevated overall blood glucose levels. Mechanisms linking hyperglycemia and CAN have been detailed previously and are not reiterated here. Patients with T2DM exhibit greater glycemic fluctuations than those with T1DM, influenced by dietary habits, medication adherence, and other factors. Insulin resistance in T2DM elevates free fatty acids, and lipotoxicity accumulation may directly damage autonomic axons. Acute or chronic glucose fluctuations and insulin resistance correlate with endothelial dysfunction and oxidative stress.33,34 These three factors—glucose fluctuation, insulin resistance, and oxidative stress—are central to CAN pathogenesis. Our findings corroborate these mechanisms and underscore the importance of stable glycemic control in mitigating CAN risk.
Unlike Guo et al,23 we observed no significant effect modification by BMI on the TIR-CAN association (p=0.12). This discrepancy may stem from population differences: Theme’s cohort had a higher proportion of obese participants (mean BMI 32 kg/m² vs 26 kg/m² in our study). Future studies with larger, diverse samples are warranted to clarify BMI’s role as an effect modifier.
In this study, the risk of CAN was significantly reduced with TIR ≥ 70% compared to the lowest quartile (Q1; TIR < 51.5%). Our TIR target aligns with the 2019 International Consensus on Time in Range (TIR),35 which recommends that adults with type 2 diabetes mellitus (T2DM) maintain a TIR of ≥ 70% (equivalent to an HbA1c of ~7.0%), with an ~0.5% HbA1c reduction per 10% TIR increase. Notably, a plateau effect was observed in the highest quartile: the Q3 (70% ≤ TIR < 84.5%) and Q4 (TIR ≥ 84.5%) groups showed 55% and 52% CAN risk reductions, respectively, compared to Q1. The most significant CAN risk reduction occurred at a TIR of 70–84.5%. This nonlinear association raises the hypothesis that exceeding this TIR threshold may yield diminished efficacy in CAN prevention.
Unresolved Questions and Future Directions: While our findings support the consensus-recommended TIR threshold, the optimal upper limit remains undefined. The attenuated risk reduction in Q4 suggests potential ceiling effects or confounding variables (eg, hypoglycemia risk at very high TIR). Further large-scale prospective studies are needed to: Define the “ideal” TIR range for minimizing CAN risk. Investigate whether extremely high TIR (>85%) confers additional benefits or unintended risks. Explore interactions between TIR, glycemic variability, and comorbidities.
Despite the geographically restricted cohort, the pathophysiological mechanisms linking hyperglycemia, insulin resistance, and glycemic variability to vascular endothelial damage, oxidative stress, and CAN are universal. Future studies should validate TIR’s predictive efficacy for CAN in multicenter, multiethnic cohorts and explore TIR’s combined use with other autonomic function assessments (eg, heart rate variability).
Strengths and Limitations
Strengths: The prospective cohort design and use of continuous glucose monitoring (CGM) to derive time in range (TIR) enhance methodological rigor.
Limitations
1. Short follow-up duration, which may insufficiently capture long-term outcomes;
2. Single-center design with a limited sample size, reducing statistical power;
3. Inclusion of only mainland Chinese T2DM patients, limiting generalizability to broader populations.
Conclusion
The findings that TIR is independently and negatively associated with the risk of developing CAN suggest that we should pay more attention to the level of TIR in patients with T2DM in the future and should emphasize the risk of developing CAN in T2DM patients with poorly controlled TIR.
Data Sharing Statement
All data in this study are derived from clinical case data provided by XiangXiang Shan. The availability of data generated or analysed during this study is restricted in order to protect patient confidentiality or because they are used under licence. However, information may be obtained from the authors upon reasonable request.
Ethical Approval and Consent to Participate
The study and analysis protocol were approved by the Research Ethics Committee of Hefei Hospital of Anhui Medical University. Informed consent was obtained from all participants.
Acknowledgments
We appreciate all the doctors and nurses who participated in the study at Hefei Hospital of Anhui Medical University, and all the patients who participated in this study.
Author Contributions
All authors made a significant contribution to the work reported, whether that is in the conception, study design, execution, acquisition of data, analysis and interpretation, or in all these areas; took part in drafting, revising or critically reviewing the article; gave final approval of the version to be published; have agreed on the journal to which the article has been submitted; and agree to be accountable for all aspects of the work.
Funding
Applied medical research project of Hefei Municipal Health commission (Hwk2022zc048, Hwk2023zd003), Scientific research project of Bengbu Medical College (2020byzd305, 2022byzd193), Anhui Province Health and Wellness Research Project (No. AHWJ2024Aa20141).
Disclosure
The authors declare no competing interests in this work.
References
1. Sun H, Saeedi P, Karuranga S, et al. IDF diabetes atlas: global, regional and country-level diabetes prevalence estimates for 2021 and projections for 2045. Diabetes Res Clin Pract. 2022;183:109119. doi:10.1016/j.diabres.2021.109119
2. Chatterjee S, Khunti K, Davies MJ. Type 2 diabetes. Lancet. 2017;389(10085):2239–2251. doi:10.1016/S0140-6736(17)30058-2
3. Braffett BH, Gubitosi-Klug RA, Albers JW, et al. Risk factors for diabetic peripheral neuropathy and cardiovascular autonomic neuropathy in the diabetes control and complications trial/epidemiology of diabetes interventions and complications (DCCT/EDIC) study. Diabetes. 2020;69(5):1000–1010. doi:10.2337/db19-1046
4. Sinnreich M, Taylor BV, Dyck PJB. Diabetic neuropathies: classification, clinical features, and pathophysiological basis. Neurologist. 2005;11(2):63–79. doi:10.1097/01.nrl.0000156314.24508.ed
5. Vinik AI, Ziegler D. Diabetic cardiovascular autonomic neuropathy. Circulation. 2007;115(3):387–397. doi:10.1161/CIRCULATIONAHA.106.634949
6. Airaksinen KEJ. Silent coronary artery disease in diabetes–a feature of autonomic neuropathy or accelerated atherosclerosis? Diabetologia. 2001;44:259–266. doi:10.1007/s001250051609
7. Pop-Busui R, Evans GW, Gerstein HC, et al. Effects of cardiac autonomic dysfunction on mortality risk in the action to control cardiovascular risk in diabetes (ACCORD) trial. Diabetes Care. 2010;33(7):1578–1584. doi:10.2337/dc10-0125
8. Maser RE, Mitchell BD, Vinik AI, et al. The association between cardiovascular autonomic neuropathy and mortality in individuals with diabetes: a meta-analysis. Diabetes Care. 2003;26(6):1895–1901. doi:10.2337/diacare.26.6.1895
9. Lee KA, Kim YJ, Park TS, et al. The association between cardiac autonomic neuropathy and heart function in type 2 diabetic patients. Somatosens Mot Res. 2020;37(3):149–156. doi:10.1080/08990220.2020.1756245
10. Kaze AD, Yuyun MF, Erqou S, et al. Cardiac autonomic neuropathy and risk of incident heart failure among adults with type 2 diabetes. Eur J Heart Failure. 2022;24(4):634–641. doi:10.1002/ejhf.2432
11. Chowdhury M, Nevitt S, Eleftheriadou A, et al. Cardiac autonomic neuropathy and risk of cardiovascular disease and mortality in type 1 and type 2 diabetes: a meta-analysis. BMJ Open Diabetes Res Care. 2021;9(2):e002480. doi:10.1136/bmjdrc-2021-002480
12. Chehregosha H, Khamseh ME, Malek M, et al. A view beyond HbA1c: role of continuous glucose monitoring. Diab ther. 2019;10(3):853–863. doi:10.1007/s13300-019-0619-1
13. Runge AS, Kennedy L, Brown AS, et al. Does time-in-range matter? Perspectives from people with diabetes on the success of current therapies and the drivers of improved outcomes. Clin Diabetes. 2018;36(2):112–119. doi:10.2337/cd17-0094
14. Beck RW, Bergenstal RM, Riddlesworth TD, et al. Validation of time in range as an outcome measure for diabetes clinical trials. Diabetes Care. 2019;42(3):400–405. doi:10.2337/dc18-1444
15. Lu J, Ma X, Zhou J, et al. Association of time in range, as assessed by continuous glucose monitoring, with diabetic retinopathy in type 2 diabetes. Diabetes Care. 2018;41(11):2370–2376. doi:10.2337/dc18-1131
16. Mayeda L, Katz R, Ahmad I, et al. Glucose time in range and peripheral neuropathy in type 2 diabetes mellitus and chronic kidney disease. BMJ Open Diabetes Res Care. 2020;8(1):e000991. doi:10.1136/bmjdrc-2019-000991
17. Lu J, Ma X, Shen Y, et al. Time in range is associated with carotid intima-media thickness in type 2 diabetes. Diabetes Technol Ther. 2020;22(2):72–78. doi:10.1089/dia.2019.0251
18. Lu J, Wang C, Shen Y, et al. Time in range in relation to all-cause and cardiovascular mortality in patients with type 2 diabetes: a prospective cohort study. Diabetes Care. 2021;44(2):549–555. doi:10.2337/dc20-1862
19. Ewing DJ, Martyn CN, Young RJ, et al. The value of cardiovascular autonomic function tests: 10 years experience in diabetes. Diabetes Care. 1985;8(5):491–498. doi:10.2337/diacare.8.5.491
20. Spallone V, Ziegler D, Freeman R, et al. Cardiovascular autonomic neuropathy in diabetes: clinical impact, assessment, diagnosis, and management. Diabetes/Metab Res Rev. 2011;27(7):639–653. doi:10.1002/dmrr.1239
21. Raj R, Mishra R, Jha N, et al. Time in range, as measured by continuous glucose monitor, as a predictor of microvascular complications in type 2 diabetes: a systematic review. BMJ Open Diabetes Res Care. 2022;10(1):e002573. doi:10.1136/bmjdrc-2021-002573
22. Achmad C, Lim NS, Pramudyo M, et al. Relation between glycemic control and cardiac autonomic neuropathy in patients with diabetes mellitus type 2. Curr Prob Cardiol. 2023;48(7):101135. doi:10.1016/j.cpcardiol.2022.101135
23. Guo Q, Zang P, Xu S, et al. Time in range, as a novel metric of glycemic control, is reversely associated with presence of diabetic cardiovascular autonomic neuropathy independent of HbA1c in Chinese type 2 diabetes. J Diab Res. 2020;2020(1):5817074. doi:10.1155/2020/5817074
24. Kim MY, Kim G, Park JY, et al. The association between continuous glucose monitoring-derived metrics and cardiovascular autonomic neuropathy in outpatients with type 2 diabetes. Diabetes Technol Ther. 2021;23(6):434–442. doi:10.1089/dia.2020.0599
25. Fisher VL, Tahrani AA. Cardiac autonomic neuropathy in patients with diabetes mellitus: current perspectives. Diab Metab Syndrome Obes. 2017;10:419–434. doi:10.2147/DMSO.S129797
26. Pang L, Lian X, Liu H, et al. Understanding diabetic neuropathy: focus on oxidative stress. Oxid Med Cell Longev. 2020;2020(1):9524635. doi:10.1155/2020/9524635
27. Yan LJ. Pathogenesis of chronic hyperglycemia: from reductive stress to oxidative stress. J Diab Res. 2014;2014(1):137919. doi:10.1155/2014/137919
28. Kalopita S, Liatis S, Thomakos P, et al. Relationship between autonomic nervous system function and continuous interstitial glucose measurement in patients with type 2 diabetes. J Diab Res. 2014;2014(1):835392. doi:10.1155/2014/835392
29. Luevano-Contreras C, Chapman-Novakofski K. Dietary advanced glycation end products and aging. Nutrients. 2010;2(12):1247–1265. doi:10.3390/nu2121247
30. Egaña-Gorroño L, López-Díez R, Yepuri G, et al. Receptor for advanced glycation end products (RAGE) and mechanisms and therapeutic opportunities in diabetes and cardiovascular disease: insights from human subjects and animal models. Front Cardiovasc Med. 2020;7:37. doi:10.3389/fcvm.2020.00037
31. Kong DH, Kim YK, Kim MR, et al. Emerging roles of vascular cell adhesion molecule-1 (VCAM-1) in immunological disorders and cancer. Int J Mol Sci. 2018;19(4):1057. doi:10.3390/ijms19041057
32. Østergaard L, Finnerup NB, Terkelsen AJ, et al. The effects of capillary dysfunction on oxygen and glucose extraction in diabetic neuropathy. Diabetologia. 2015;58:666–677. doi:10.1007/s00125-014-3461-z
33. Torimoto K, Okada Y, Mori H, et al. Relationship between fluctuations in glucose levels measured by continuous glucose monitoring and vascular endothelial dysfunction in type 2 diabetes mellitus. Cardiovasc diabetol. 2013;12(1):1–7. doi:10.1186/1475-2840-12-1
34. Chang CM, Hsieh CJ, Huang JC, et al. Acute and chronic fluctuations in blood glucose levels can increase oxidative stress in type 2 diabetes mellitus. Acta diabetologica. 2012;49:171–177. doi:10.1007/s00592-012-0398-x
35. Battelino T, Danne T, Bergenstal RM, et al. Clinical targets for continuous glucose monitoring data interpretation: recommendations from the international consensus on time in range. Diabetes Care. 2019;42(8):1593–1603. doi:10.2337/dci19-0028
 © 2025 The Author(s). This work is published and licensed by Dove Medical Press Limited. The
full terms of this license are available at https://www.dovepress.com/terms
and incorporate the Creative Commons Attribution
- Non Commercial (unported, 4.0) License.
By accessing the work you hereby accept the Terms. Non-commercial uses of the work are permitted
without any further permission from Dove Medical Press Limited, provided the work is properly
attributed. For permission for commercial use of this work, please see paragraphs 4.2 and 5 of our Terms.
© 2025 The Author(s). This work is published and licensed by Dove Medical Press Limited. The
full terms of this license are available at https://www.dovepress.com/terms
and incorporate the Creative Commons Attribution
- Non Commercial (unported, 4.0) License.
By accessing the work you hereby accept the Terms. Non-commercial uses of the work are permitted
without any further permission from Dove Medical Press Limited, provided the work is properly
attributed. For permission for commercial use of this work, please see paragraphs 4.2 and 5 of our Terms.
Recommended articles
Relationship Between Time in Range and Dusk Phenomenon in Outpatients with Type 2 Diabetes Mellitus
Gao X, Li H, Yu Y, Huai X, Feng B, Song J
Diabetes, Metabolic Syndrome and Obesity 2023, 16:1637-1646
Published Date: 6 June 2023
Effect of Ramadan Fasting on Blood Glucose Level in Pregnant Women with Gestational and Type 2 Diabetes
Alsulami SS, Ghamri KA
Diabetes, Metabolic Syndrome and Obesity 2023, 16:3105-3113
Published Date: 6 October 2023
The Inflammation Effect in the Association Between Bilirubin and Chronic Kidney Disease in Patients with Type 2 Diabetes: A Retrospective Cohort Study
Chen Y, Wang S, Chen X, Sun B, Cheng Y, Li X, Chen L
Journal of Inflammation Research 2026, 19:578233
Published Date: 19 January 2026