Back to Journals » Diabetes, Metabolic Syndrome and Obesity » Volume 16
Relationship Between Time in Range and Dusk Phenomenon in Outpatients with Type 2 Diabetes Mellitus
Authors Gao X, Li H, Yu Y, Huai X, Feng B, Song J
Received 2 March 2023
Accepted for publication 25 May 2023
Published 6 June 2023 Volume 2023:16 Pages 1637—1646
DOI https://doi.org/10.2147/DMSO.S410761
Checked for plagiarism Yes
Review by Single anonymous peer review
Peer reviewer comments 2
Editor who approved publication: Prof. Dr. Juei-Tang Cheng
Xiangyu Gao,* Hongmei Li,* Yuan Yu, Xiaoyuan Huai, Bo Feng, Jun Song
Department of Endocrinology, East Hospital, Tongji University School of Medicine, Shanghai, 200120, People’s Republic of China
*These authors contributed equally to this work
Correspondence: Jun Song; Bo Feng, Department of Endocrinology, East Hospital, Tongji University School of Medicine, 150 Jimo Road, Shanghai, 200120, People’s Republic of China, Tel/Fax +86 021-38804518, Email [email protected]; [email protected]
Purpose: The dusk phenomenon refers to a spontaneous and transient pre-dinner hyperglycemia that affects glucose fluctuation and glycemic control, and the increasing use of continuous glucose monitoring (CGM) has facilitated its diagnosis. We investigated the frequency of the dusk phenomenon and its relationship with the time in range (TIR) in patients with type 2 diabetes mellitus (T2DM).
Patients and Methods: This study involved 102 patients with T2DM who underwent CGM for 14 days. CGM-derived metrics and clinical characteristics were evaluated. A consecutive dusk blood glucose difference (pre-dinner glucose minus 2-hour post-lunch glucose) of ≥ 0 or once-only dusk blood glucose difference of < 0 was diagnosed as the clinical dusk phenomenon (CLDP).
Results: We found that the percentage of CLDP was 11.76% (10.34% in men, 13.64% in women). Compared with the non-CLDP group, the CLDP group tended to be younger and have a lower percentage of TIR (%TIR3.9-10) and higher percentage of time above range (%TAR> 10 and %TAR> 13.9) (P ≤ 0.05). Adjusted for confounding factors, the binary logistic regression analysis showed a negative association of CLDP with %TIR (odds ratio < 1, P < 0.05). We repeated the correlation analysis based on 70%TIR and found significant differences in hemoglobin A1c, fasting blood glucose, mean blood glucose, standard deviation of the sensor glucose values, glucose coefficient of variation, largest amplitude of glycemic excursions, mean amplitude of glycemic excursions, glucose management indicator, and percentage of CLDP between the two subgroups of TIR ≤ 70% and TIR > 70% (P < 0.05). The negative association between TIR and CLDP still remained after adjustment by the binary logistic regression analysis.
Conclusion: The CLDP was frequently present in patients with T2DM. The TIR was significantly correlated with the CLDP and could serve as an independent negative predictor.
Keywords: time in range, dusk phenomenon, type 2 diabetes, continuous glucose monitoring
Introduction
Recently, accumulated studies have shown that abnormal glucose fluctuation in patients with diabetes mellitus plays a vital role in poor glycemic control and chronic complications.1–4 Abnormal glucose excursion involves spontaneous and transient dysglycemia that occurs over a specific period of time. For instance, the terms “dawn phenomenon” and “Somogyi effect” were introduced to describe hyperglycemia during the early morning in patients with diabetes mellitus.5–7 The dusk phenomenon is also common, but it is often ignored. As a spontaneous and transient pre-dinner hyperglycemic condition, the dusk phenomenon has been reported in very few studies and has mainly been described only on a conceptual level.8,9 A consecutive dusk blood glucose difference (δDG) (pre-dinner glucose minus 2-hour post-lunch glucose) of ≥0 or a once-only δDG of <0 can be diagnosed as the “clinical dusk phenomenon” (CLDP).9 Moreover, the blood glucose level remains high from the pre-dinner to pre-bed period in people with the dusk phenomenon.8 Continuous glucose monitoring (CGM) continuously captures the glucose profile over a specific period of time and provides new metrics of glycemic control; thus, CGM might facilitate identification of an individual’s current glycemic status.10 Increasing numbers of studies are showing that the application of CGM improves glycemic control and reflects glucose variability in a timely manner, thus decreasing the risk of diabetic complications.11–14 Additionally, the above-mentioned dawn phenomenon can be identified by the difference between the nocturnal nadir and pre-breakfast glucose levels using CGM.15,16 One study of the dusk phenomenon using CGM showed that the incidence of the dusk phenomenon was about 27.3% in patients with type 2 diabetes mellitus (T2DM), although this phenomenon is often neglected.17
Therefore, the present study was performed to investigate the prevalence of the dusk phenomenon in patients with T2DM and its relationship with the time in range (TIR) according to CGM with the overall goal of further understanding blood glucose fluctuations in these patients.
Materials and Methods
Study Population
In total, 102 consecutive outpatients from Shanghai East Hospital, Tongji university, China were recruited from September 2020 to January 2021 in this cross-sectional study. All participates were >18 years old and had been clinically diagnosed with T2DM based on the criteria of WHO (1999). Patients who were pregnant, had acute infection, had allergic disease, had thyroid dysfunction, were undergoing therapy for cancer, had severe hepatic dysfunction, or had chronic renal failure were excluded. All patients were treated with oral hypoglycemic agents or subcutaneous insulin infusions with no use of an insulin pump. The present study was approved by the ethics committees of Shanghai East Hospital and written informed consent was also obtained from each participate. The study was registered in the Chinese clinical trial registry (ChiCTR-2100047148).
Continuous Glucose Monitoring Parameters and Magnitude of the Dusk Phenomenon
All patients were monitored every 15 minutes for 14 days during their daily life using a commercial CGM system (Abbott Laboratories, Abbott Park, IL, USA) and had no changes in therapy during the study period after the initiation of CGM. The CGM-derived metrics were defined as follows. The TIR was defined as the time within the target glucose range of 3.9 to 10.0 mmol/L during a 24-hour period. The time below range was divided into Level 1 (3.0–3.9 mmol/L) with minor importance in clinical studies and Level 2 (<3.0 mmol/L) with major clinical significance that must be reported. The time above range (TAR) was also divided into two levels: level 1 (10.0–13.9 mmol/L) and level 2 (>13.9 mmol/L). The mean blood glucose (MBG) was defined as the mean blood glucose level during the whole CGM period. Intraday glycemic variability parameters included the standard deviation (SD) of the sensor glucose values, the glucose coefficient of variation (CV), the largest amplitude of glycemic excursions (LAGE), and the mean amplitude of glycemic excursions (MAGE). All participants adhered to their original treatment during the whole study period, and they were also instructed to maintain a standard diet from 7:00 to 7:30, from 11:00 to 11:30, and from 17:00 to 17:30. The δDG indicated the magnitude of the dusk phenomenon and was quantified by the difference between the pre-dinner glucose and 2-hour post-lunch glucose. A persistent δDG of ≥0 or a once-only δDG of <0 was diagnosed as the CLDP according to a previous study.9
Basic Characteristics and Biochemical Measurements
Basic epidemiological data such as age, sex, and clinical complications were collected during an outpatient visit. Fasting blood samples were collected from each patient and used to perform a series of biochemical measurements including hemoglobin A1c (HbA1C), serum creatinine, blood urea nitrogen, serum uric acid, albumin, aspartate transaminase, alanine aminotransferase, alkaline phosphatase, total cholesterol, triglycerides, and fasting blood glucose (FBG).
Statistical Analysis
Quantitative data are presented as mean ± standard deviation or median (25th percentile, 75th percentile), and categorical data are summarized using frequencies and proportions or percentages of patients. Student’s t-test was used for parametric data and the Mann–Whitney U-test or chi-square test was used for non-parametric data to compare the differences in variables between the two subgroups. Spearman correlation analysis was used to assess the relationship between patients with and without the CLDP. Furthermore, binary logistic regression analysis was used to analyze independent predictors after adjusting for possible confounding variables. All P values of ≤ 0.05 were considered statistically significant. All analyses were performed using SPSS Version 26.0 (IBM Corp., Armonk, NY, USA).
Results
Frequency of CLDP
This cross-sectional study involved a total of 102 outpatients with T2DM (58 men, 44 women). According to the previously reported standard for clinical diagnosis of the dusk phenomenon,9 we assigned 12 patients to the CLDP group and the remaining 90 patients to the non-CLDP group. The percentage of patients with CLDP was 11.76% (10.34% in men and 13.64% in women) (Table 1). Besides, the whole glucose profiles of the two groups concentrated within 24 hours were shown in Figure 1, and scope of the dusk phenomenon have also been indicated.
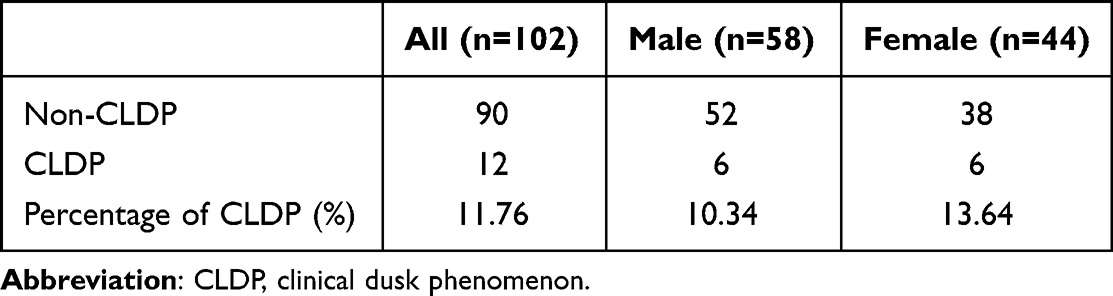 |
Table 1 The Frequency of Clinical Dusk Phenomenon |
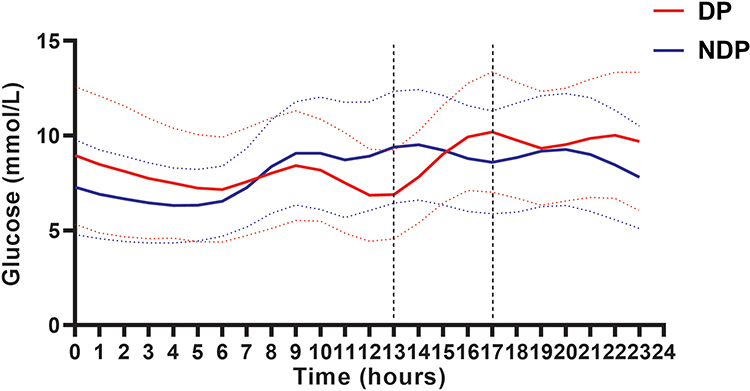 |
Figure 1 Continuous glucose profiles of patients with or without dusk phenomenon. Red solid line refers to people with dusk phenomenon (DP); red dotted line is standard deviation of mean glucose for people with dusk phenomenon (DP); blue solid line refers to people without dusk phenomenon (NDP) and blue dotted line is standard deviation of mean glucose for people without dusk phenomenon (NDP). |
Clinical Characteristics and CGM-Derived Parameters of Patients in CLDP and Non-CLDP Groups
The clinical characteristics of the CLDP and non-CLDP groups are presented in Table 2. The patients in the CLDP group tended to be younger than those in the non-CLDP group (P < 0.05). However, the occurrence of clinical complications such as atherosclerosis, coronary atherosclerotic heart disease, or cerebrovascular disease tended to be lower in the CLDP group than in the non-CLDP group (P = 0.067), although the difference was not statistically significant. With regard to CGM-derived metrics, as shown in Table 3, we found that the percentage of TIR (%TIR3.9-10) was significantly lower in the CLDP than non-CLDP group, whereas % TAR>10 and %TAR>13.9 were higher in the CLDP than non-CLDP group (P ≤ 0.05). The significant differences between the two groups are illustrated more intuitively in Figure 2.
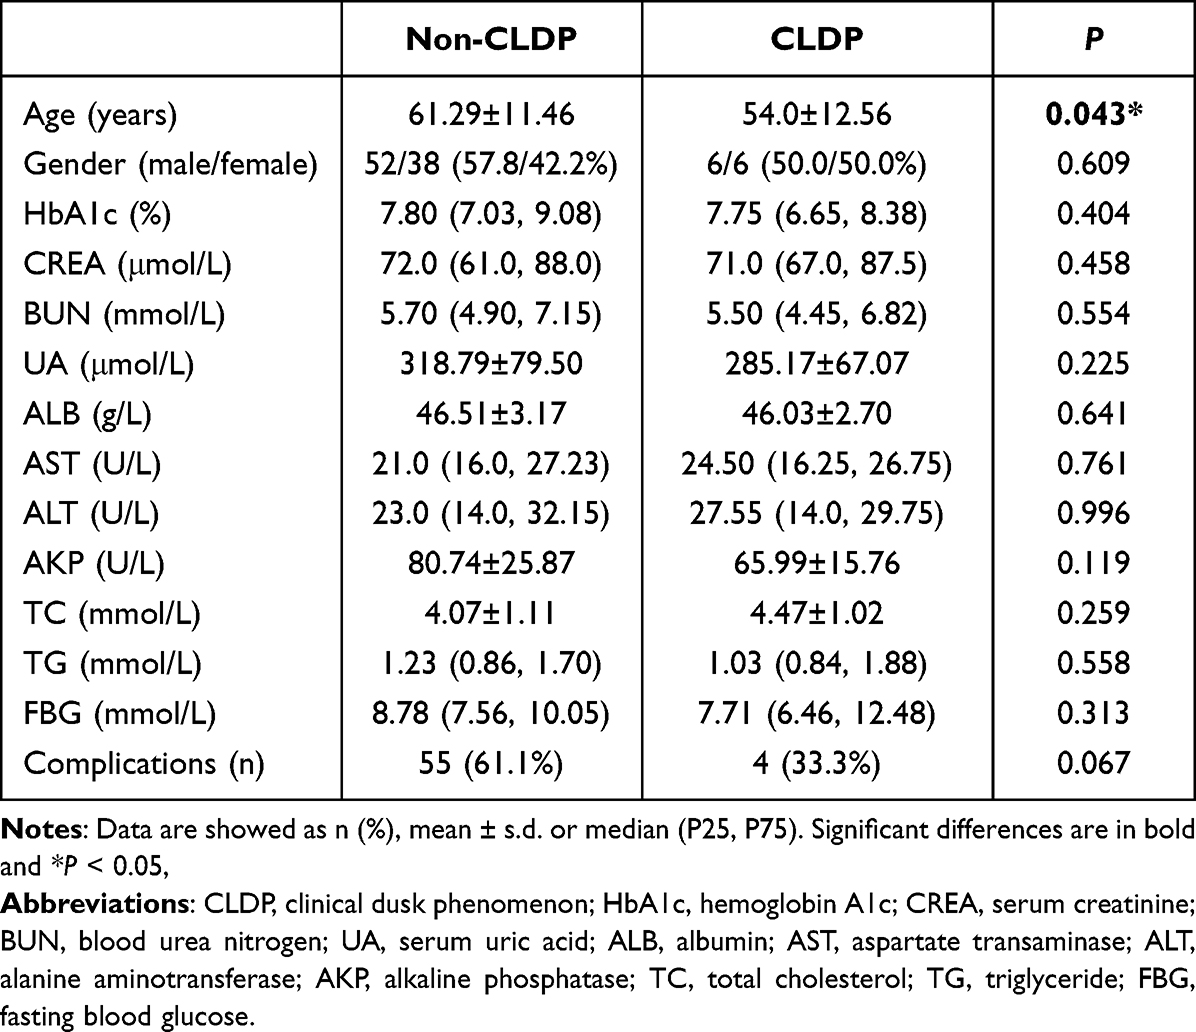 |
Table 2 Clinical and Biochemical Characteristics of Study Participants |
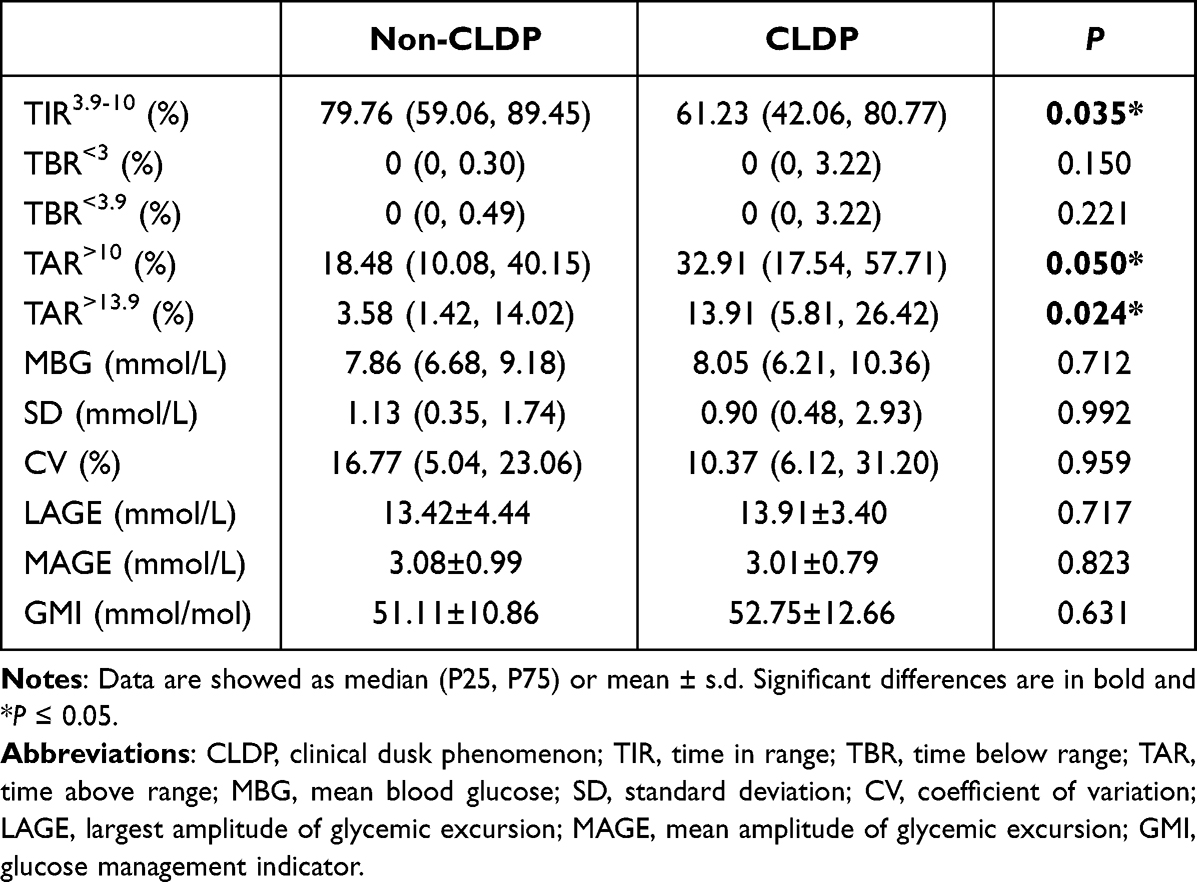 |
Table 3 Comparison of CGM Metrics Between the Two Groups of Patients |
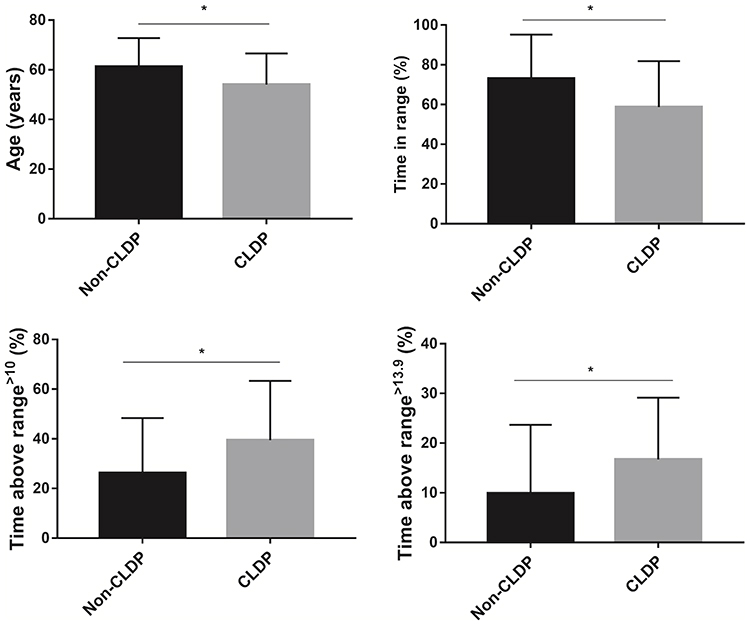 |
Figure 2 Significant differences between subgroups of non-CLDP and CLDP. *P < 0.05. Abbreviation: CLDP, clinical dusk phenomenon. |
Correlation of CLDP with CGM Parameters
Spearman correlation analysis was then applied to explore factors that might be related to the CLDP. As indicated in Table 4, age, %TIR, and %TAR were significantly correlated with the CLDP (P ≤ 0.05). Next, we conducted a binary logistic regression analysis to further address the relationships between TIR and CLDP by using different models. As presented in Table 5, CLDP group showed an OR of 0.089 (P < 0.05) relative to non-CLDP counterparts with no adjustment (model 1), moreover, it consistently and significantly showed an OR < 1 with adjustment of age and sex (model 2), of age, sex, presence of complications and %TAR (model 3), of age, sex, presence of complications, %TAR and vital glucose metrics such as HbA1c, FBG, MBG, SD, CV, LAGE, MAGE and glucose management indicator (GMI) (model 4).
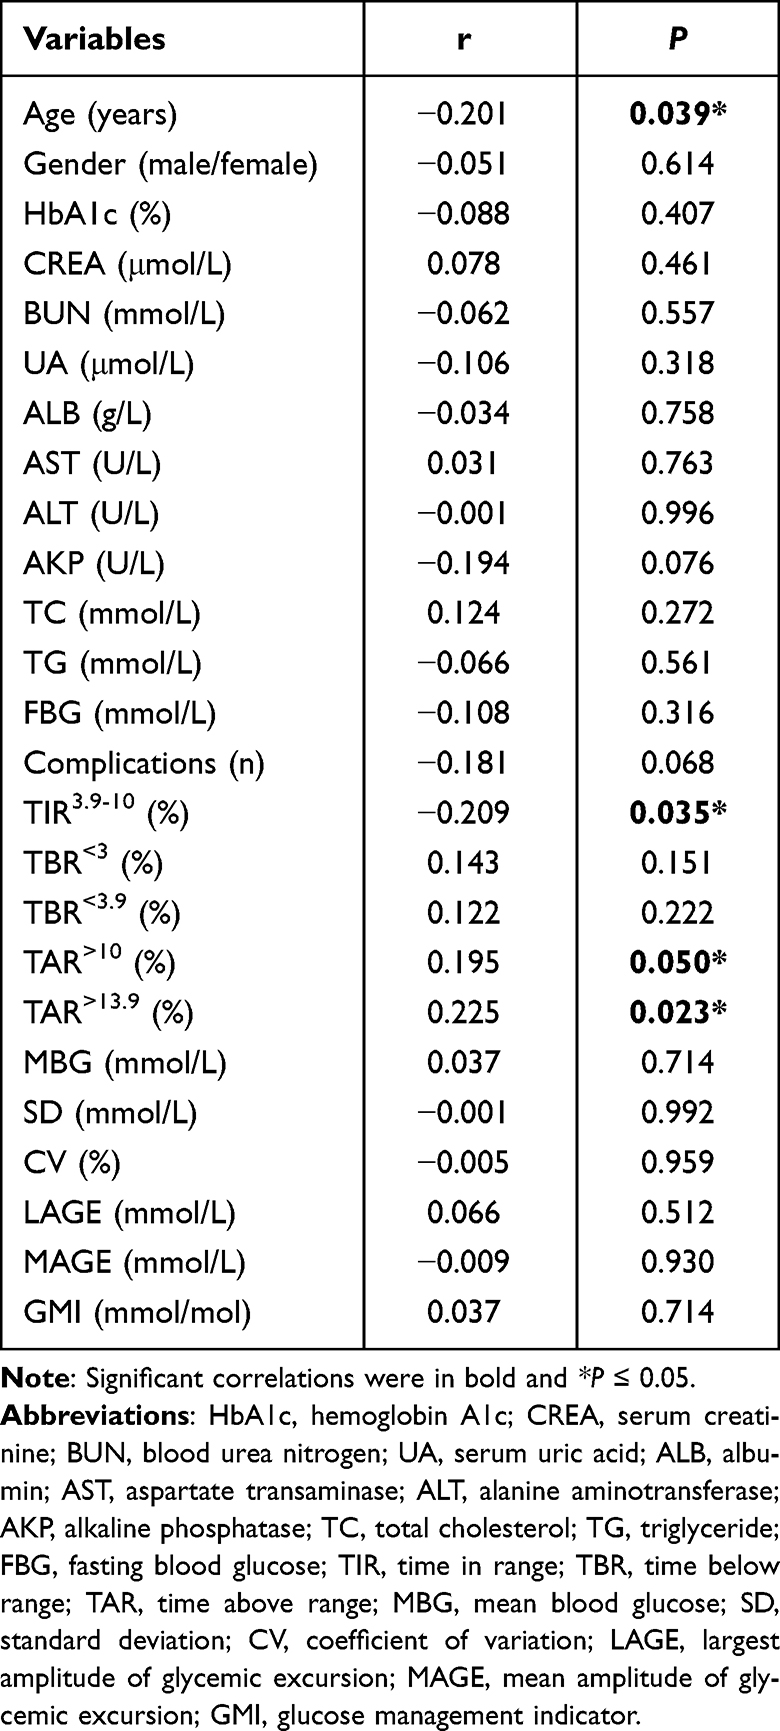 |
Table 4 Correlation of CLDP with Clinical and CGM Parameters |
 |
Table 5 Independent Factors Related to CLDP by Binary Logistic Regression Analysis |
Characteristics of CLDP and Non-CLDP Groups Based on 70%TIR
We repeated the analysis of the two groups of patients based on whether the %TIR was >70% (Table 6). There were statistically significant differences in HbA1c, FBG, MBG, SD, CV, LAGE, MAGE, GMI, and occurrence of CLDP between the two subgroups of patients with a TIR of ≤70% and TIR of >70%. Specifically, compared with patients with a TIR of >70%, those with a TIR of ≤70% tended to have significantly higher levels of HbA1c, FBG, MBG, SD, CV, LAGE, MAGE, GMI, and percentage of CLDP (P < 0.05).
 |
Table 6 Characteristics of CLDP and Non-CLDP Groups Based on 70%TIR |
Association Between TIR and CLDP
As shown in Table 7, binary logistic regression was used to examine the independent indicators associated with 70%TIR. We found that MAGE (OR, 4.379; 95% CI, 1.451–13.215; P = 0.009), GMI (OR, 1.161; 95% CI, 1.042–1.293; P = 0.007), and incidence of CLDP (OR, 7.538; 95% CI, 1.062–53.517; P = 0.043) were independently associated with substandard %TIR after adjustment for age, sex, HbA1c, FBG, MBG, SD, CV, and LAGE.
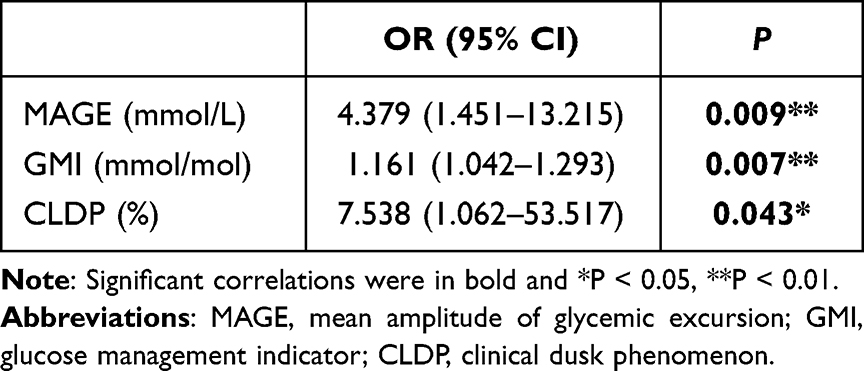 |
Table 7 Association Between TIR and CLDP |
Discussion
With the increasing use of CGM, the features and mechanism of the dawn phenomenon have been gradually explored in increasingly more detail.15,16,18 Different from the Somogyi effect, the dawn phenomenon is not preceded by nocturnal hypoglycemia, and it is currently thought to be due to a physiological increase in insulin-antagonistic hormones together with pancreatic β-cell dysfunction.6,19 By contrast, the dusk phenomenon tends to be neglected and is rarely reported in China or abroad. No study to date has illustrated the potential mechanism of the dusk phenomenon. However, the dusk phenomenon is encountered in daily clinical practice, although it has long lacked a formal definition. About 20 years ago, a study involving 322 patients with type 1 diabetes mellitus using insulin pump therapy showed that most patients presented two peaks of insulin requirement: an early-morning peak and a night-time peak,20 possibly suggesting the existence of the dusk phenomenon. In 2016, researchers in China first proposed that the dusk phenomenon referred to spontaneous and transient pre-dinner hyperglycemia that can affect blood glucose control from the post-dinner to pre-bed periods.8 Clinical diagnosis of the dusk phenomenon was then presented two years later.9
In this cross-sectional study, by following the definition of the CLDP and using the δDG as described above, 12 (11.76%) patients were assigned to the CLDP group and 90 patients to the non-CLDP group. The occurrence proportion was lower than 27.3% which reported by one 72 hours-CGM research,17 possibly because fewer participates were enrolled in our study, in addition, we were monitored for 14 days compared to 3 days in that study. All patients were treated with oral hypoglycemic agents or subcutaneous insulin infusions with no use of an insulin pump. Because continuous administration of insulin to simulate physiological insulin secretion via an insulin pump can partly eliminate glycemic variability, we were able to observe the dusk phenomenon more accurately under ideal conditions.
One previous study mentioned above assessed the influence of the dusk phenomenon on the total glucose profile of patients with T2DM, revealing that the dusk phenomenon affects both HbA1c and MBG.17 In the present study, we found no correlation between the dusk phenomenon and HbA1c or MBG, and our data showed that patients in the CLDP group tended to be significantly younger than those in the non-CLDP group. Additionally, age was negatively correlated with the occurrence of the CLDP (r < 0, P < 0.05), suggesting that younger patients seem more likely to have CLDP. Moreover, patients with the CLDP showed a lower %TIR and higher %TAR than those without the CLDP. The correlation and regression analyses both showed a negative association between the TIR and CLDP.
The TIR is an intuitive metric defined as the time during which the glucose level is within a desired target range (3.9–10.0 mmol/L),21 and a %TIR of >70% would appear to be an ideal target for most patients with diabetes.22 Among CGM-related metrics, the TIR has surfaced as an indicator that is preferred by clinicians and patients to assess glycemic control.23 Moreover, the TAR, which represents hyperglycemia, is divided into two levels: level 1 (glucose level of 10.0–13.9 mmol/L) and level 2 (glucose level of >13.9 mmol/L). Similarly, the TBR, the time below range (hypoglycemia) is also divided into level 1 (glucose level of 3.0–3.9 mmol/L) and level 2 (glucose level of <3.0 mmol/L).21,24 Our study showed that the %TIR was negatively correlated with the CLDP (r = −0.209, P = 0.035), while the %TAR>10 and %TAR>13.9 showed a positive relationship with the CLDP (r = 0.195, P = 0.05 and r = 0.225, P = 0.023, respectively). In the binary logistic regression analysis, %TIR was presented as an independent negative predictor of the CLDP after stepwise adjustment for potential confounders. Thus, it is reasonable to speculate that %TIR plays a vital role in the incidence of CLDP. Several studies have explored the relationship between the TIR and biochemical parameters of blood glucose such as HbA1c, glycated albumin, and 1,5-anhydro-d-glucitol25–29 as well as metrics derived from CGM such as the GMI, ambulatory glucose profile indexes, and the CV.26,30–32 Concurrently, a steadily increasing amount of evidence emerged indicating that the TIR can predict the risk of chronic complications of diabetes such as diabetic retinopathy,33 diabetic polyneuropathy,34,35 diabetic foot amputation,36,37 macrovascular disease,38 and even cancer mortality.39 We further divided our patients into those with a TIR of ≤70% (non-target group) and those with a TIR of >70% (target group) according to the 70%TIR boundary mentioned above. We found statistically significant differences in the incidence of the CLDP and glycemic control indicators such as HbA1c, FBG, MBG, SD, CV, LAGE, MAGE, and GMI between the two subgroups. Compared with patients who had a TIR of >70%, those with a TIR of ≤70% appeared to be more likely to experience the CLDP and have higher levels of HbA1c, FBG, MBG, SD, CV, LAGE, MAGE, and GMI. Next, the binary logistic regression showed that MAGE, GMI, and the incidence of CLDP were independently correlated with the TIR. Therefore, we concluded that a lower %TIR is associated with a higher probability of the CLDP.
To the best of our knowledge, this is the first study to demonstrate the association between the TIR and the CLDP. However, our study still had some limitations, for example, the number of subjects enrolled in this study is not too large, and the results will be more accurate if it is a multi-center study. Besides, we did not analyze the composition of the meals that the patients ingested. Moreover, further research is needed to clarify the mechanism of the dusk phenomenon and thus better decrease the occurrence of the dusk phenomenon and improve blood glucose control.
Conclusions
In conclusion, we have provided evidence that the dusk phenomenon is common in patients with T2DM. This study suggests that the TIR is significantly correlated with the occurrence of the CLDP and can serve as an independent negative predictor of the CLDP.
Abbreviations
CLDP, clinical dusk phenomenon; HbA1c, hemoglobin A1c; CREA, serum creatinine; BUN, blood urea nitrogen; UA, serum uric acid; ALB, albumin; AST, aspartate transaminase; ALT, alanine aminotransferase; AKP, alkaline phosphatase; TC, total cholesterol; TG, triglyceride; FBG, fasting blood glucose; TIR, time in range; TBR, time below range; TAR, time above range; MBG, mean blood glucose; SD, standard deviation; CV, coefficient of variation; LAGE, largest amplitude of glycemic excursion; MAGE, mean amplitude of glycemic excursion; GMI, glucose management indicator.
Data Sharing Statement
The primary raw data from this study could be obtained from the corresponding author with appropriate justification.
Ethical Approval
This study was approved by the ethics committees of Shanghai East Hospital and written informed consent was also obtained from each participate. It was registered in the Chinese clinical trial registry (ChiCTR-2100047148). This study complied with the Declaration of Helsinki.
Acknowledgments
The authors thank all the patients who participated in this study. They also thank PhD Heming Wang from Zhongshan Hospital, Fudan university for his technical support.
Author Contributions
All authors made a significant contribution to the work reported, whether that is in the conception, study design, execution, acquisition of data, analysis and interpretation, or in all these areas; took part in drafting, revising or critically reviewing the article; gave final approval of the version to be published; have agreed on the journal to which the article has been submitted; and agree to be accountable for all aspects of the work.
Funding
This work was supported by Clinical Research Fund of Shanghai Municipal Commission of Health (202040136); National Natural Science Foundation of China (82070842); China Postdoctoral Science Foundation (2015M580334); China Diabetes Young Scientific Talent Research Project (2018-N-01) and Jiangxi Health Commission Science and Technology Plan Project (202212838).
Disclosure
The authors declare that there is no conflict of interest regarding the publication of this paper.
References
1. Yapanis M, James S, Craig ME, O’Neal D, Ekinci EI. Complications of diabetes and metrics of glycemic management derived from continuous glucose monitoring. J Clin Endocrinol Metab. 2022;107(6):e2221–e2236. doi:10.1210/clinem/dgac034
2. Klimontov VV, Semenova JF. Glucose variability in subjects with normal glucose tolerance: relations with body composition, insulin secretion and sensitivity. Diabetes Metab Syndr. 2022;16(1):102387. doi:10.1016/j.dsx.2022.102387
3. Zhang J, Yang J, Liu L, et al. Significant abnormal glycemic variability increased the risk for arrhythmias in elderly type 2 diabetic patients. BMC Endocr Disord. 2021;21(1):83. doi:10.1186/s12902-021-00753-2
4. Rodbard D. Glucose variability: a review of clinical applications and research developments. Diabetes Technol Ther. 2018;20(S2):S25–S215. doi:10.1089/dia.2018.0092
5. Schmidt MI, Hadji-Georgopoulos A, Rendell M, Margolis S, Kowarski A. The Dawn phenomenon, an early morning glucose rise: implications for diabetic intraday blood glucose variation. Diabetes Care. 1981;4(6):579–585. doi:10.2337/diacare.4.6.579
6. Rybicka M, Krysiak R, Okopień B. The Dawn phenomenon and the Somogyi effect - two phenomena of morning hyperglycaemia. Endokrynol Pol. 2011;62(3):276–284.
7. Bolli GB, Gerich JE. The “Dawn phenomenon”--a common occurrence in both non-insulin-dependent and insulin-dependent diabetes mellitus. N Engl J Med. 1984;310(12):746–750. doi:10.1056/nejm198403223101203
8. Li W, Du SN, Shi MJ, Sun ZZ. Spontaneous and transient predinner hyperglycemia in some patients with diabetes: dusk phenomenon. Medicine. 2016;95(47):e5440. doi:10.1097/md.0000000000005440
9. Du S, Shi MJ, Sun ZZ, Li W. Clinical diagnosis for dusk phenomenon of diabetes. Medicine. 2018;97(34):e11873. doi:10.1097/md.0000000000011873
10. Mian Z, Hermayer KL, Jenkins A. Continuous glucose monitoring: review of an innovation in diabetes management. Am J Med Sci. 2019;358(5):332–339. doi:10.1016/j.amjms.2019.07.003
11. Bolinder J, Antuna R, Geelhoed-Duijvestijn P, Kröger J, Weitgasser R. Novel glucose-sensing technology and hypoglycaemia in type 1 diabetes: a multicentre, non-masked, randomised controlled trial. Lancet. 2016;388(10057):2254–2263. doi:10.1016/s0140-6736(16)31535-5
12. Tamborlane WV, Beck RW, Bode BW, et al. Continuous glucose monitoring and intensive treatment of type 1 diabetes. N Engl J Med. 2008;359(14):1464–1476. doi:10.1056/NEJMoa0805017
13. Bao S, Bailey R, Calhoun P, Beck RW. Effectiveness of continuous glucose monitoring in older adults with type 2 diabetes treated with basal insulin. Diabetes Technol Ther. 2021;24(5):299–306. doi:10.1089/dia.2021.0494
14. Aleppo G, Beck RW, Bailey R, et al. The effect of discontinuing continuous glucose monitoring in adults with type 2 diabetes treated with basal insulin. Diabetes Care. 2021;44(12):2729–2737. doi:10.2337/dc21-1304
15. Monnier L, Colette C, Sardinoux M, Baptista G, Regnier-Zerbib A, Owens D. Frequency and severity of the Dawn phenomenon in type 2 diabetes: relationship to age. Diabetes Care. 2012;35(12):2597–2599. doi:10.2337/dc12-0385
16. Monnier L, Colette C, Dejager S, Owens D. Magnitude of the Dawn phenomenon and its impact on the overall glucose exposure in type 2 diabetes: is this of concern? Diabetes Care. 2013;36(12):4057–4062. doi:10.2337/dc12-2127
17. Huang Y, Xu Y, Qiu J, et al. The impact of dusk phenomenon on total glucose exposure in Chinese people with type 2 diabetes. Medicine. 2021;100(13):e25298. doi:10.1097/md.0000000000025298
18. Wang JS, Lee IT, Lee WJ, et al. The Dawn phenomenon in type 2 diabetes: its association with glucose excursions and changes after oral glucose-lowering drugs. Ther Adv Chronic Dis. 2021;12:20406223211033674. doi:10.1177/20406223211033674
19. O’Neal TB, Luther EE. Dawn Phenomenon. In: StatPearls. StatPearls PublishingCopyright © 2022, StatPearls Publishing LLC; 2022.
20. Scheiner G, Boyer BA. Characteristics of basal insulin requirements by age and gender in Type-1 diabetes patients using insulin pump therapy. Diabetes Res Clin Pract. 2005;69(1):14–21. doi:10.1016/j.diabres.2004.11.005
21. Battelino T, Danne T, Bergenstal RM, et al. Clinical targets for continuous glucose monitoring data interpretation: recommendations from the international consensus on time in range. Diabetes Care. 2019;42(8):1593–1603. doi:10.2337/dci19-0028
22. Advani A. Positioning time in range in diabetes management. Diabetologia. 2020;63(2):242–252. doi:10.1007/s00125-019-05027-0
23. Runge AS, Kennedy L, Brown AS, et al. Does time-in-range matter? Perspectives from people with diabetes on the success of current therapies and the drivers of improved outcomes. Clin Diabetes. 2018;36(2):112–119. doi:10.2337/cd17-0094
24. Agiostratidou G, Anhalt H, Ball D, et al. Standardizing clinically meaningful outcome measures beyond HbA(1c) for Type 1 diabetes: a consensus report of the american association of clinical endocrinologists, the American Association of Diabetes Educators, the American Diabetes Association, the Endocrine Society, JDRF International, The Leona M. and Harry B. Helmsley Charitable Trust, the Pediatric Endocrine Society, and the T1D Exchange. Diabetes Care. 2017;40(12):1622–1630. doi:10.2337/dc17-1624
25. Valenzano M, Cibrario Bertolotti I, Valenzano A, Grassi G. Time in range-A1c hemoglobin relationship in continuous glucose monitoring of type 1 diabetes: a real-world study. BMJ Open Diabetes Res Care. 2021;9(1):e001045. doi:10.1136/bmjdrc-2019-001045
26. Shah VN, Snell-Bergeon JK, Demmitt JK, et al. Relationship between time-in-range, HbA1c, and the glucose management indicator in pregnancies complicated by type 1 diabetes. Diabetes Technol Ther. 2021;23(12):783–790. doi:10.1089/dia.2021.0093
27. Sakai T, Aoyama K, Inazumi K, et al. Time in range correlates glycated albumin measured immediately after 2 weeks of continuous glucose monitoring. J Diabetes Complications. 2021;35(8):107962. doi:10.1016/j.jdiacomp.2021.107962
28. Ohigashi M, Osugi K, Kusunoki Y, et al. Association of time in range with hemoglobin A1c, glycated albumin and 1,5-anhydro-d-glucitol. J Diabetes Investig. 2021;12(6):940–949. doi:10.1111/jdi.13437
29. Vigersky RA, McMahon C. The relationship of hemoglobin A1C to time-in-range in patients with diabetes. Diabetes Technol Ther. 2019;21(2):81–85. doi:10.1089/dia.2018.0310
30. Peng HM, Deng HR, Zhou YW, et al. 血糖变异性对1型糖尿病患者葡萄糖目标范围内时间与血糖管理指标关系的影响 [Impacts of glycemic variability on the relationship between time in range and estimated glycated hemoglobin in patients with type 1 diabetes mellitus]. Zhonghua Yi Xue Za Zhi. 2022;102(16):1190–1195. Chinese. doi:10.3760/cma.j.cn112137-20211009-02236
31. Tokutsu A, Okada Y, Torimoto K, Tanaka Y. Relationship between interstitial glucose variability in ambulatory glucose profile and standardized continuous glucose monitoring metrics; a pilot study. Diabetol Metab Syndr. 2020;12:70. doi:10.1186/s13098-020-00577-5
32. Piona C, Marigliano M, Mozzillo E, et al. High glycemic variability is associated with worse continuous glucose monitoring metrics in children and adolescents with type 1 diabetes. Horm Res Paediatr. 2021;94(9–10):369–373. doi:10.1159/000521430
33. Lu J, Ma X, Zhou J, et al. Association of time in range, as assessed by continuous glucose monitoring, with diabetic retinopathy in type 2 diabetes. Diabetes Care. 2018;41(11):2370–2376. doi:10.2337/dc18-1131
34. Yang J, Yang X, Zhao D, Wang X, Wei W, Yuan H. Association of time in range, as assessed by continuous glucose monitoring, with painful diabetic polyneuropathy. J Diabetes Investig. 2021;12(5):828–836. doi:10.1111/jdi.13394
35. Li F, Zhang Y, Li H, et al. TIR generated by continuous glucose monitoring is associated with peripheral nerve function in type 2 diabetes. Diabetes Res Clin Pract. 2020;166:108289. doi:10.1016/j.diabres.2020.108289
36. Yin X, Zhu W, Liu C, et al. Association of continuous glucose monitoring-derived time in range with major amputation risk in diabetic foot osteomyelitis patients undergoing amputation. Ther Adv Endocrinol Metab. 2022;13:20420188221099337. doi:10.1177/20420188221099337
37. Xie P, Deng B, Zhang X, et al. Time in range in relation to amputation and all-cause mortality in hospitalised patients with diabetic foot ulcers. Diabetes Metab Res Rev. 2022;38(2):e3498. doi:10.1002/dmrr.3498
38. Lu J, Ma X, Shen Y, et al. Time in range is associated with carotid intima-media thickness in type 2 diabetes. Diabetes Technol Ther. 2020;22(2):72–78. doi:10.1089/dia.2019.0251
39. Shen Y, Wang C, Wang Y, et al. Association between time in range and cancer mortality among patients with type 2 diabetes: a prospective cohort study. Chin Med J. 2021;135(3):288–294. doi:10.1097/cm9.0000000000001740
 © 2023 The Author(s). This work is published and licensed by Dove Medical Press Limited. The
full terms of this license are available at https://www.dovepress.com/terms
and incorporate the Creative Commons Attribution
- Non Commercial (unported, 3.0) License.
By accessing the work you hereby accept the Terms. Non-commercial uses of the work are permitted
without any further permission from Dove Medical Press Limited, provided the work is properly
attributed. For permission for commercial use of this work, please see paragraphs 4.2 and 5 of our Terms.
© 2023 The Author(s). This work is published and licensed by Dove Medical Press Limited. The
full terms of this license are available at https://www.dovepress.com/terms
and incorporate the Creative Commons Attribution
- Non Commercial (unported, 3.0) License.
By accessing the work you hereby accept the Terms. Non-commercial uses of the work are permitted
without any further permission from Dove Medical Press Limited, provided the work is properly
attributed. For permission for commercial use of this work, please see paragraphs 4.2 and 5 of our Terms.
Recommended articles
Use of Continuous Glucose Monitors to Manage Type 1 Diabetes Mellitus: Progress, Challenges, and Recommendations
Friedman JG, Cardona Matos Z, Szmuilowicz ED, Aleppo G
Pharmacogenomics and Personalized Medicine 2023, 16:263-276
Published Date: 31 March 2023
Knowledge, Attitudes, and Practices of Chronic Type 2 Diabetes Patients in China Toward Continuous Glucose Monitoring: An Online Questionnaire Survey
Liu B, Wu X, Zou X, Sun F, Yu J
Diabetes, Metabolic Syndrome and Obesity 2025, 18:11-22
Published Date: 6 January 2025
Effect of Imeglimin, a Novel Anti-Diabetic Agent, on Insulin Secretion and Glycemic Variability in Type 2 Diabetes Treated with DPP-4 Inhibitor: A 16-Week, Open Label, Pilot Study
Itsukaichi A, Yoshikawa F, Fuchigami A, Iwata Y, Sato G, Miyagi M, Hirose T, Uchino H
Diabetes, Metabolic Syndrome and Obesity 2025, 18:101-111
Published Date: 9 January 2025
A Prospective Study of the Correlation Between Time in Range and Incidence of Diabetic Cardiovascular Autonomic Neuropathy in Patients with Type 2 Diabetes Mellitus
Shan X, Yao S, Hu B, Xu C, Cao Y, Dai W
Diabetes, Metabolic Syndrome and Obesity 2025, 18:2585-2596
Published Date: 29 July 2025