Back to Journals » Journal of Inflammation Research » Volume 15
A Predictive Model Based on Inflammatory and Coagulation Indicators for Sepsis-Induced Acute Kidney Injury
Authors Xin Q, Xie T, Chen R ![]() , Zhang X, Tong Y
, Zhang X, Tong Y ![]() , Wang H
, Wang H ![]() , Wang S, Liu C
, Wang S, Liu C ![]() , Zhang J
, Zhang J ![]()
Received 25 April 2022
Accepted for publication 30 July 2022
Published 11 August 2022 Volume 2022:15 Pages 4561—4571
DOI https://doi.org/10.2147/JIR.S372246
Checked for plagiarism Yes
Review by Single anonymous peer review
Peer reviewer comments 2
Editor who approved publication: Professor Ning Quan
Qi Xin,1 Tonghui Xie,1 Rui Chen,1 Xing Zhang,1 Yingmu Tong,1 Hai Wang,1 Shufeng Wang,2 Chang Liu,1,3 Jingyao Zhang1,3
1Department of Hepatobiliary Surgery, The First Affiliated Hospital of Xi’an Jiaotong University, Xi’an, 710061, People’s Republic of China; 2Department of General Surgery, The First Affiliated Hospital of Xi’an Jiaotong University, Xi’an, 710061, People’s Republic of China; 3Department of SICU, The First Affiliated Hospital of Xi’an Jiaotong University, Xi’an, 710061, People’s Republic of China
Correspondence: Chang Liu; Jingyao Zhang, Department of Hepatobiliary Surgery, The First Affiliated Hospital of Xi’an Jiaotong University, Xi’an, 710061, People’s Republic of China, Tel +86-29-85323900, Fax +86-29-85324642, Email [email protected]; [email protected]
Background: Sepsis-induced acute kidney injury (S-AKI) is associated with systemic inflammatory responses and coagulation system dysfunction, and it is associated with an increased risk of mortality. However, there was no study to explore the predictive value of inflammatory and coagulation indicators for S-AKI.
Methods: In this retrospective study, 1051 sepsis patients were identified and divided into a training cohort (75%, n = 787) and a validation cohort (25%, n = 264) in chronological order according to the date they were admitted. Univariate analyses and multivariate logistic regression analyses were performed to identify the independent predictors of S-AKI. The logistic regression analyses (enter methods) were used to conducted the prediction models. The ROC curves were used to determine the predictive value of the constructed models on S-AKI. To test whether the increase in the AUC is significant, we used a two-sided test for ROC curves available online (http://vassarstats.net/roc_comp.html). The secondary outcome was different AKI stages and major adverse kidney events within 30 days (MAKE30). Stage 3B of S-AKI was defined as both meeting the stage 3 criteria [increase of Cr level by > 300% (≥ 4.0 mg/dL with an acute increase of ≥ 0.5 mg/dL) and/or UO < 0.3 mL/kg/h for > 24 h or anuria for > 12 h and/or acute kidney replacement therapy] and having cystatin C positive. MAKE30 were a composite of death, new renal replacement therapy (RRT), or persistent renal dysfunction (PRD).
Results: We discovered that cardiovascular disease, white blood cell (WBC), mean arterial pressure (MAP), platelet (PLT), serum procalcitonin (PCT), prothrombin time activity (PTA), and thrombin time (TT) were independent predictors for S-AKI. The predictive value (AUC = 0.855) of the simplest model 3 (constructed with PLT, PCT, and PTA), with a sensitivity of 77.6% and a specificity of 82.4%, had a similar predictive value comparing with the model 1 (AUC = 0.872) and the model 2 (AUC = 0.864) in the training cohort (P > 0.05). Compared with the model 1 (AUC = 0.888) and the model 2 (AUC = 0.887), the model 3 (AUC = 0.887) had a similar predictive value in the validation cohort. Moreover, model 3 had the best predictive power for predicting S-AKI in the stage 3 (AUC = 0.777), especially in stage 3B (AUC = 0.771). Finally, the model 3 (AUC = 0.843) had perfect predictive power for predicting MAKE30 in sepsis patients.
Conclusion: Within 24 hours after admission, the simplest model 3 (constructed with PLT, PCT, and PTA) might be a robust predictor of the S-AKI in sepsis patients, providing information for timely and efficient intervention.
Keywords: inflammation, coagulation, prediction model, sepsis, acute kidney injury
Introduction
Sepsis is a lethal organ dysfunction caused by a dysregulated host response to infection, and one of the leading risk factors of mortality in patients with severe trauma, burns, shock or major surgery.1 Additionally, sepsis is associated with a mortality rate of 25–30%, while septic shock is associated with a mortality rate of 45–63%.2,3 The kidney is a particularly vulnerable organ to sepsis, and S-AKI is associated with a high mortality rate in sepsis patients.4,5 Notably, high levels of circulating inflammatory cytokines and coagulation dysfunction damage the renal microvascular system in sepsis patients, which is often concomitant with decreased renal blood flow, secondary tubular epithelial cell death, or acute tubular necrosis. Thus, easily accessible and accurate early biomarkers can be used to forecast S-AKI in sepsis patients, which is critical for developing targeted therapies to prevent or treat S-AKI in a timely manner.
At present, AKI is diagnosed based on a dynamic increase in serum creatinine and decreased urine output. However, serum creatinine does not increase until 50% of renal function is lost, indicating a lack of sensitivity and reliability. Numerous biomarkers for the diagnosis of AKI have been proposed, such as the delta neutrophil index (DNI), proenkephalin (PENK), urinary interleukin-18, urinary KIM-1, and neutrophil gelatinase associated lipocalin (NGAL), the majority of which are difficult to apply into clinical practice due to their high cost and complex technical requirements.6–8 Additionally, it has been found that PLT, WBC, and PCT levels were risk factors for S-AKI,3,9 but there was no research reported that other coagulation indicators were associated with the prediction of S-AKI in sepsis patients.10 Moreover, these conventional biochemical indicators above are intrinsically unstable when used as a single index due to the effects of confounding factors. Thus, it is of great clinical value to predict S-AKI by combining them into a predictive model. The use of predictive models will allow for timely, high-quality, person-centered supportive care and a care bundle for AKI. In addition, several studies have used MAKE30 as a test endpoint for conducting clinical trials, such as the SALT, SMART, and pediatric sepsis trials.11 The predictive models could be used to stratify patients and determine the feasibility of MAKE30 as an endpoint in future clinical trials. Nevertheless, there are no studies about combining early inflammation and coagulation indicators to predict S-AKI in sepsis patients. Therefore, this study aimed to assess the predictive value of inflammation and coagulation indicators for S-AKI and to place a greater emphasis on the constructed models.
Materials and Methods
Study Design
This retrospective single-center study consisted of 1051 participants between January 2015 and December 2021 and anonymized clinical data are collected from the Biobank of First Affiliated Hospital of Xi’an Jiaotong University (Xi’an, China).
Patients
All sepsis patients (> 18 years old) were evaluated separately for study enrollment by two physicians with intermediate professional titles. During hospitalization, physicians evaluated the diagnosis of S-AKI after 24 hours of admission. The diagnosis of sepsis was based on the sepsis 3.0 criteria, which defined sepsis as Sequential Organ Failure Assessment (SOFA) score ≥ 2 and documented or suspected infection.1 Exclusion criteria were as follows: (1) ≤18 years old; (2) The length of stay in the hospital was less than 24 hours; (3) Diagnosed with end-stage renal disease or current hemodialysis, or acute kidney injury induced by other causes except sepsis; (4) Receipt of antiplatelet agents or anticoagulants; (5) Existence of immunosuppressive or autoimmune disease, or long-term use of immunosuppressive agents; (6) Decompensated cirrhosis or acute-on-chronic liver failure; (7) Malignancies with recurrence or metastasis; (8) Hematological disorders. All eligible patients were divided into the training (75% of the sample size, between January 2015 and June 2020) and validation (25% of the sample size, between June 2020 and December 2021) cohorts. Eventually, participants were divided into two groups based on the status of AKI, as defined by the criteria of the Kidney Disease Improving Global Outcomes (KDIGO) classification.12 That is, the serum creatinine level increases by ≥0.3 mg/dl (≥26.5 μmol/l) within 48 h, or the serum creatinine level increases ≥1.5 times over the baseline level within 7 days or cumulative 6 h urine output ≤0.5 mL/kg/h.
Definitions of AKI Stages and MAKE30
Traditionally, Cr and urine output are used to define stages of AKI. However, several novel biomarkers have been shown to detect AKI earlier and are more sensitive than Cr.13 In the 23rd Acute Disease Quality Initiative (ADQI) consensus statement, to assess the severity of AKI as precise as possible, AKI stages were divided into 1S, 1A, 1B, 2A, 2B, 3A, and 3B (see definitions of AKI stages in Table S1) by combining 2 functional biomarkers (Cr and urine output) and appropriately selected biomarkers (cystatin C, Dickkopf-3, Hepcidin, Interleukin-18, Interleukin-18, and so on).13 In this study, we selected cystatin C as the appropriate biomarker. That is, stage 3 of AKI was divided into 3A and 3B. Moreover, stage 3A of S-AKI was defined as both meeting the stage 3 criteria [increase of Cr level by > 300% (≥ 4.0 mg/dL with an acute increase of ≥ 0.5 mg/dL) and/or UO < 0.3 mL/kg/h for > 24 h or anuria for > 12 h and/or acute kidney replacement therapy] and having cystatin C negative. While, stage 3B of S-AKI was defined as both meeting the stage 3 criteria and having cystatin C positive. MAKE30 is a composition of death, new receipt of RRT, or PRD (defined as a final inpatient serum creatinine value greater than or equal to 200% of baseline) censored at hospital discharge or 30 days after inclusion, whichever occurred first. Baseline serum creatinine was defined as: (1) if available, the lowest value measured between 12 months and 24 hours before hospitalization, (2) in the absence of measured values, an estimation is based on a previously described formula [creatinine = 0.74–0.2 (if female) + 0.003 × age (in years)].11 MAKE30 composite endpoints were defined as patients who met any of the three components of MAKE30.
Data Collection
The data of patients were from electronic medical records of the Biobank. (1) Demographic data only included age and gender; (2) The vital signs at admission included body temperature (T), heart rate (HR), respiratory rate (RR), and MAP; (3) Admission status data included comorbidities (hypertension, diabetes and cardiovascular disease), the infection sources and SOFA of sepsis; (4) Laboratory data were immediately available within 24 hours after admission include WBC, neutrophil percentage (NEUT%), lymphocyte, monocyte, PLT, PCT, PTA, TT, international normalized ratio (INR), fibrinogen degradation products (FDP), D-Dimer (D-D), fibrinogen (FIB), activated partial thromboplastin time (APTT), prothrombin time (PT), cystatin C, and creatinine (Cr). A routine blood test was performed using a Sysmex XN9000 blood analyzer (Sysmex Corp). Moreover, blood coagulation tests were carried out by a Sysmex CS5100 automatic blood coagulation analyzer (Sysmex). PCT concentrations were tested by automatic fluorescence immunoassay analyzer (VIDAS).
Statistical Analysis
The continuous variables were expressed as mean ± standard deviation for normally distributed variables or as median (interquartile range) for non-normally distributed variables, and categorical variables are shown as percentage. Normality of the variables was checked by Kolmogorov–Smirnov test. In univariate analyses, continuous variables were compared using Students t-tests or the Mann–Whitney U-tests as appropriate, and Pearson’s chi-squared or Fisher’s exact tests were used to compare categorical variables. Furthermore, a multivariate logistic regression analyses (forward logistic regression method) adjusted for age and gender was performed to identify the independent predict factors of S-AKI. Seventy-five percent of the sample size was used to construct the prediction model, and the remaining 25% was used to verify the prediction model. Based on independent predict factors, three logistic regression models (enter methods) were conducted. ROC curves were used to analyze and evaluate the value of the predictive models on S-AKI in the training cohort and the validation cohort. Cutoff values (critical values in ROC analysis) were determined using the Youden index. To test whether the increase in the AUC of model is significant, we used a two-sided test for ROC curves available online (http://vassarstats.net/roc_comp.html).14 We had better choose the simplest model for clinical application if there is no significance of AUC between models.
Statistical analyses were performed using SPSS 26.0, and P < 0.05 was considered statistically significant.
Results
Baseline Characteristics of Patients in the Training Cohort
As present in Figure 1, 787 sepsis patients were included in the final analyses of the training cohort, of whom 391 (49.7%) had AKI. Then, all AKI stage patients were divided into 1S (27 patients), 1A (20 patients), 1B (72 patients), 2A (26 patients), 2B (81 patients), 3A (35 patients), and 3B (130 patients). The median age of patients was 58 years (range, 45 to 69), and female patients comprised 39.14% of the cases. The demographic and clinical data differences between the non-AKI and S-AKI are described in Table 1. Patients with AKI were significantly older than those without AKI. Furthermore, Table 1 also displayed that HR, RR, MAP (93, 80–95 vs 78, 70–94; P < 0.001), hypertension, diabetes, cardiovascular disease (18.69 vs 43.22%; P < 0.001), infection sources, pulmonary infection, intra-abdominal infection, urinary infection, and SOFA (5, 3–5 vs 7, 5–8; P < 0.001) were significantly different between patients in the non-AKI and S-AKI groups. However, gender, temperature, central nervous system infection, skin and soft tissue infections, and cardiovascular system infections displayed no differences.
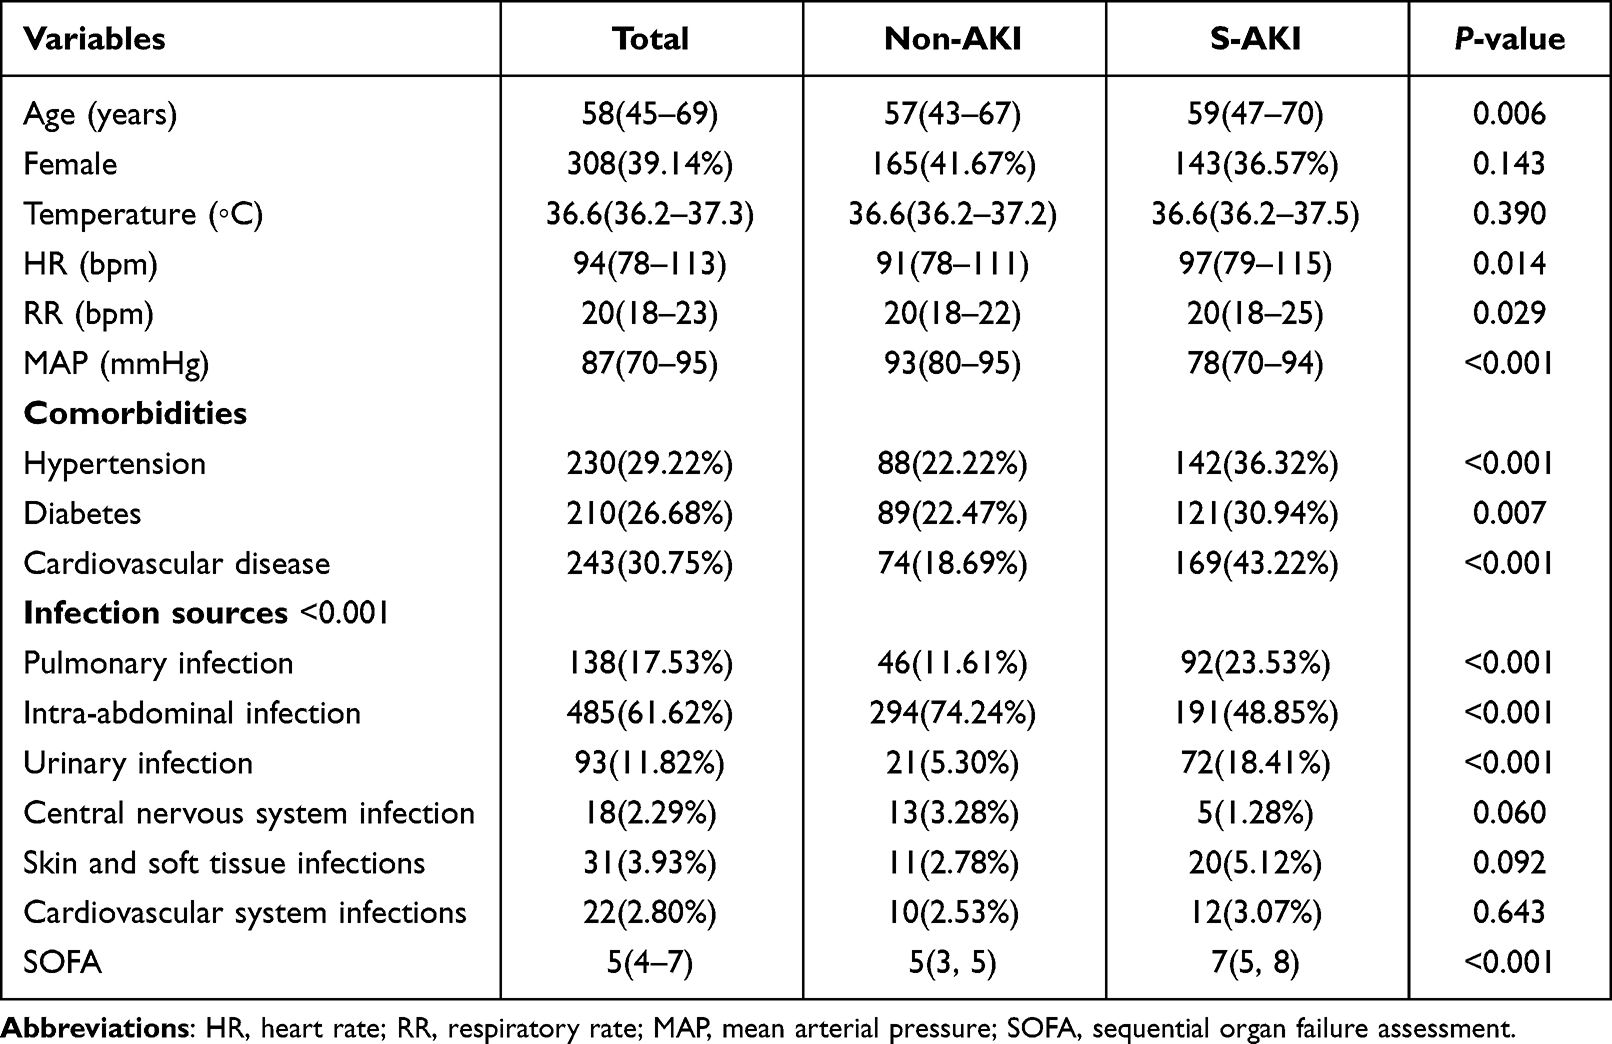 |
Table 1 The Demographic and Clinical Data of Patients Between the Non-AKI and S-AKI Groups in the Training Cohort |
 |
Figure 1 The flowchart of patient selection. |
Univariate Analyses of Selected Inflammation and Coagulation Indicators in Sepsis Patients of the Training Cohort
All the inflammation and coagulation indicators were available within 24 hours of admission.
Univariate analyses in Table 2 revealed that WBC, NEUT, PCT (14.74, 3.62–45.75 vs 0.94, 0.31–3.29; P < 0.001), TT, INR, FDP, D-D, APTT, PT, cystatin C, and Cr significantly increased in the S-AKI group than in the non-AKI group. In contrast, compared with the non-AKI group, lymphocyte, monocyte, PLT (97, 57–157 vs 180, 125–256; P < 0.001), and PTA (58.00, 48.00–73.90 vs 80.00, 68.00–87.00; P < 0.001) were significantly lower in the S-AKI group.
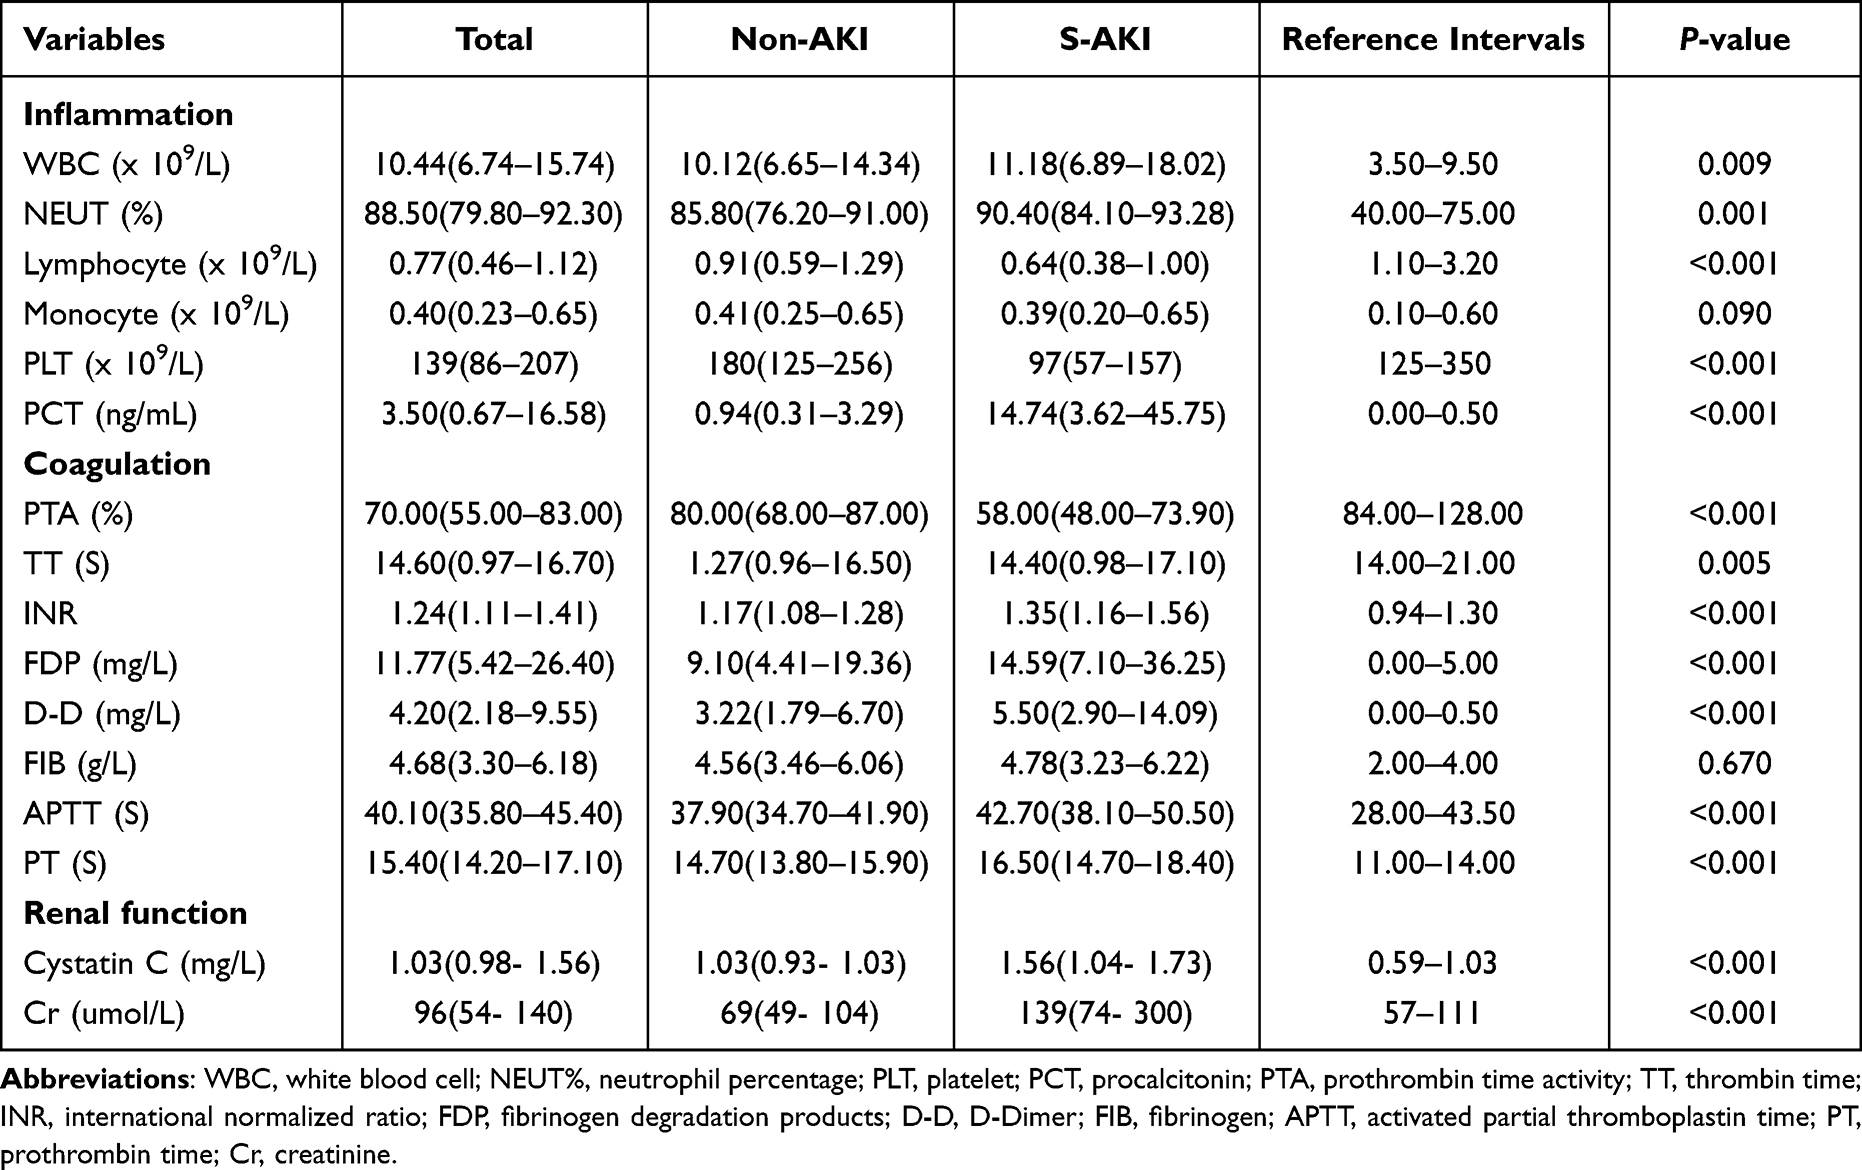 |
Table 2 Univariate Analyses of Selected Inflammation and Coagulation Indicators Between Non-AKI and S-AKI Groups in the Training Cohort |
Multivariate Logistic Regression Analyses of Independent Predictors of S-AKI in Sepsis Patients of the Training Cohort
We performed multivariate logistic regression analyses without including APTT because it suffered interferences from lupus inhibitors, high factor VIII levels, and heparin contamination.15,16 Then, multivariate logistic regression analyses (forward logistic regression method) adjusted for age and gender, was performed for the significant variables from the univariate analyses, including age, gender, hypertension, diabetes, cardiovascular disease, HR, RR, MAP, WBC, NEUT, lymphocyte, monocyte, PLT, PCT, PTA, TT, INR, FDP, D-D, PT. As present in Table 3, the multivariate logistic regression analyses revealed that cardiovascular disease, WBC, MAP, PLT (OR = 0.998; 95% CI: 0.996–1.000), PCT (OR = 1.016; 95% CI: 1.008–1.024), PTA (OR = 0.985; 95% CI: 0.974–0.996) and TT were significantly associated with the prediction of S-AKI in sepsis patients.
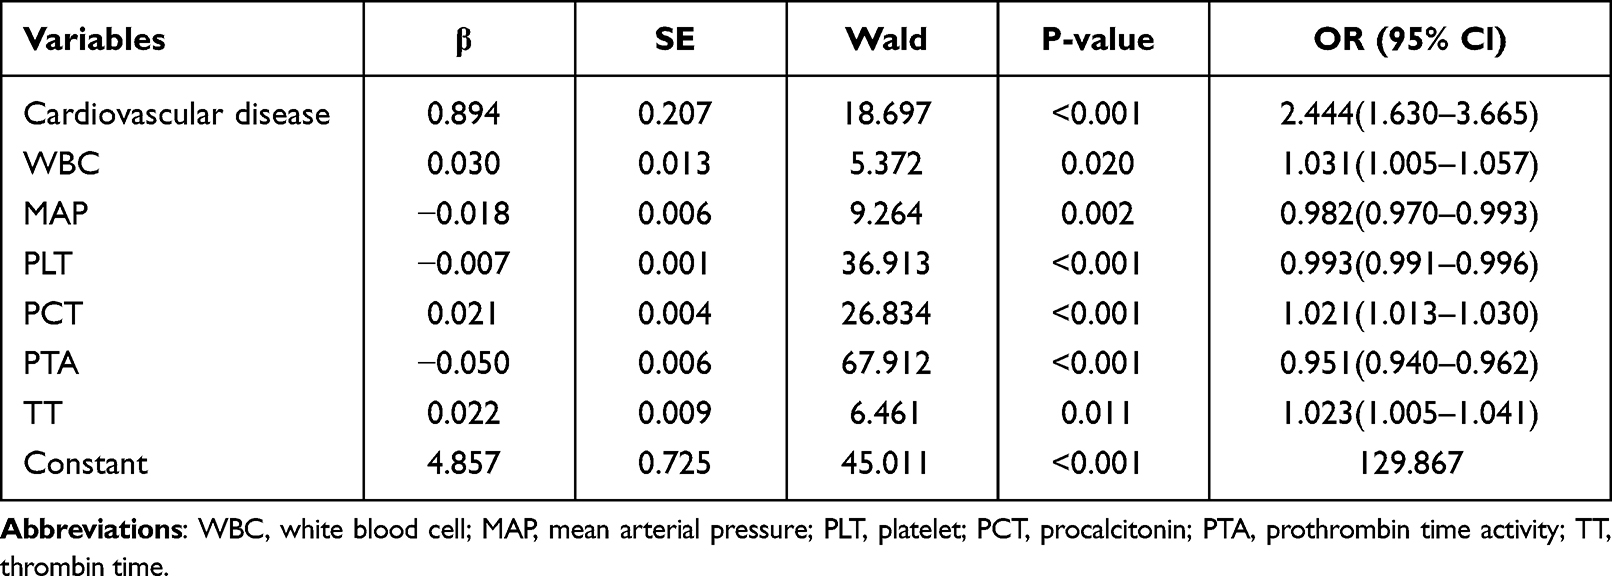 |
Table 3 Multivariate Logistic Regression Analyses of Independent Predictors for S-AKI in the Training Cohort |
The Construction and Validation of Prediction Model for S-AKI
As shown in Table 4 and Figure 2A, based on those independent predictors, we constructed three logistic regression models (enter methods) to predict the occurrence of S-AKI in the training cohort: (1) Firstly, independent predictors (cardiovascular disease, WBC, MAP, PLT, PCT, PTA, and TT) were included for constructing the prediction model 1; (2) Secondly, according to the results of multivariate logistic regression analysis, significant variables (P < 0.001) were included for constructing the prediction model 2 (cardiovascular disease, PLT, PCT, and PTA); (3) Finally, PLT, PCT, and PTA were included for constructing the prediction model 3. We discovered that the model 3 (AUC = 0.855), with a sensitivity of 77.6% and a specificity of 82.4%, had a similar predictive value (P > 0.05) comparing with the model 1 (AUC = 0.872) and the model 2 (AUC = 0.864) by using a two-sided test for ROC curves available online in the training cohort. The model 3 had a higher sensitivity value (79.7%). As shown in Table 4 and Figure 2B, we constructed three logistic regression models (enter methods) to predict the occurrence of S-AKI in the validation cohort by enrolling different variables (in line with the model of the training cohort). Compared with the model 1 (AUC = 0.888) and the model 2 (AUC = 0.887), the model 3 (AUC = 0.887) had a similar predictive value. Considering that we should choose the simplest model for clinical application, model 3 (constructed with PLT, PCT, and PTA) might be a robust predictive model if AUCs are not significant between models. As shown in Table S2, ROC curve analyses of cystatin C and Cr were performed in the training cohort. Moreover, the model 3 (AUC = 0.855) had a better predictive value (P < 0.05) than cystatin C (AUC = 0.807) and Cr (AUC = 0.765) (Table S2) by using a two-sided test for ROC curves available online in the training cohort. As a result, we chose the model 3 as our target prediction model.
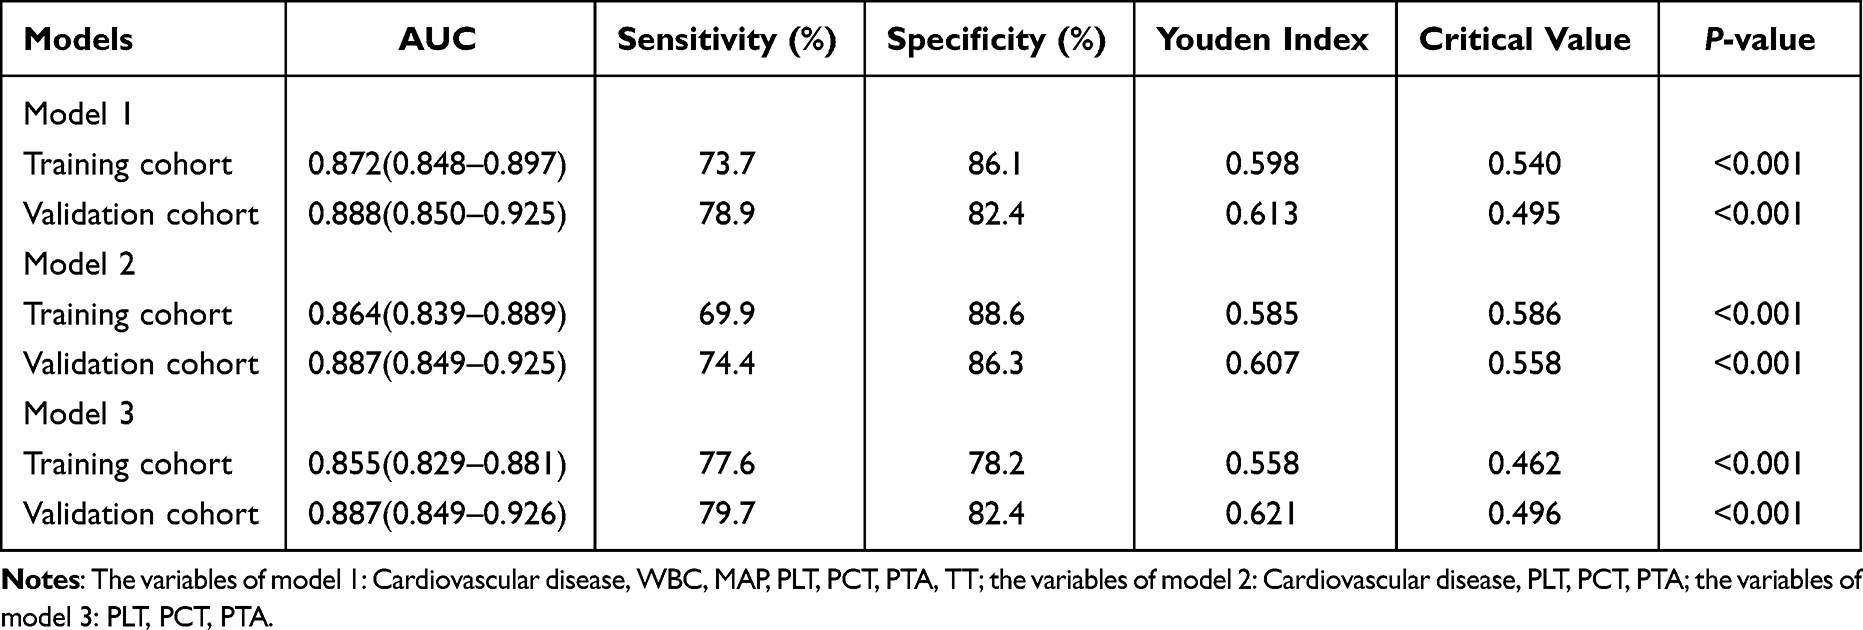 |
Table 4 The Construction and Validation of Prediction Model for S-AKI |
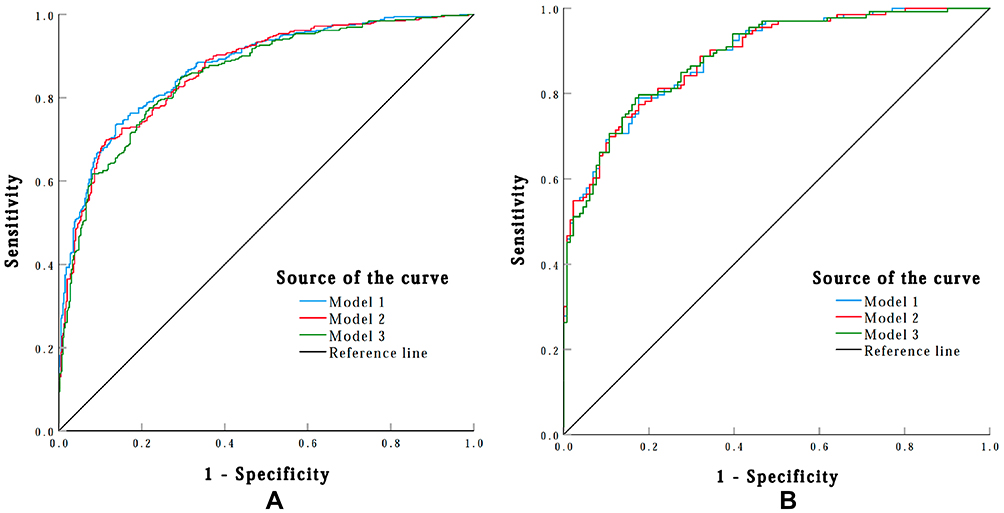 |
Figure 2 The ROC curve of the predictive model in the training cohort and the validation cohort. (A) The ROC curve in the training cohort (B) The ROC curve in the validation cohort. The variables of model 1: Cardiovascular disease, WBC, MAP, PLT, PCT, PTA, TT; the variables of model 2: Cardiovascular disease, PLT, PCT, PTA; the variables of model 3: PLT, PCT, PTA. |
The Secondary Outcome Analysis of S-AKI Using Model 3 in the Training Cohort
As shown in Table 5 and Figure 3A, model 3 had the best predictive power for predicting S-AKI in the stage 3 (AUC = 0.777) than in the stage 1 (AUC = 0.659) and the stage 2 (AUC = 0.681) sets. Furthermore, among all the subgroups of AKI, model 3 had the best predictive power for predicting S-AKI in stage 3B (AUC = 0.771). Moreover, the MAKE30 composite endpoints were reached in 258 (32.78%) patients. As shown in Table 5 and Figure 3B, model 3 (AUC = 0.843) had perfect predictive power for predicting MAKE30 in sepsis patients, with a sensitivity of 72.9% and a specificity of 83.9%.
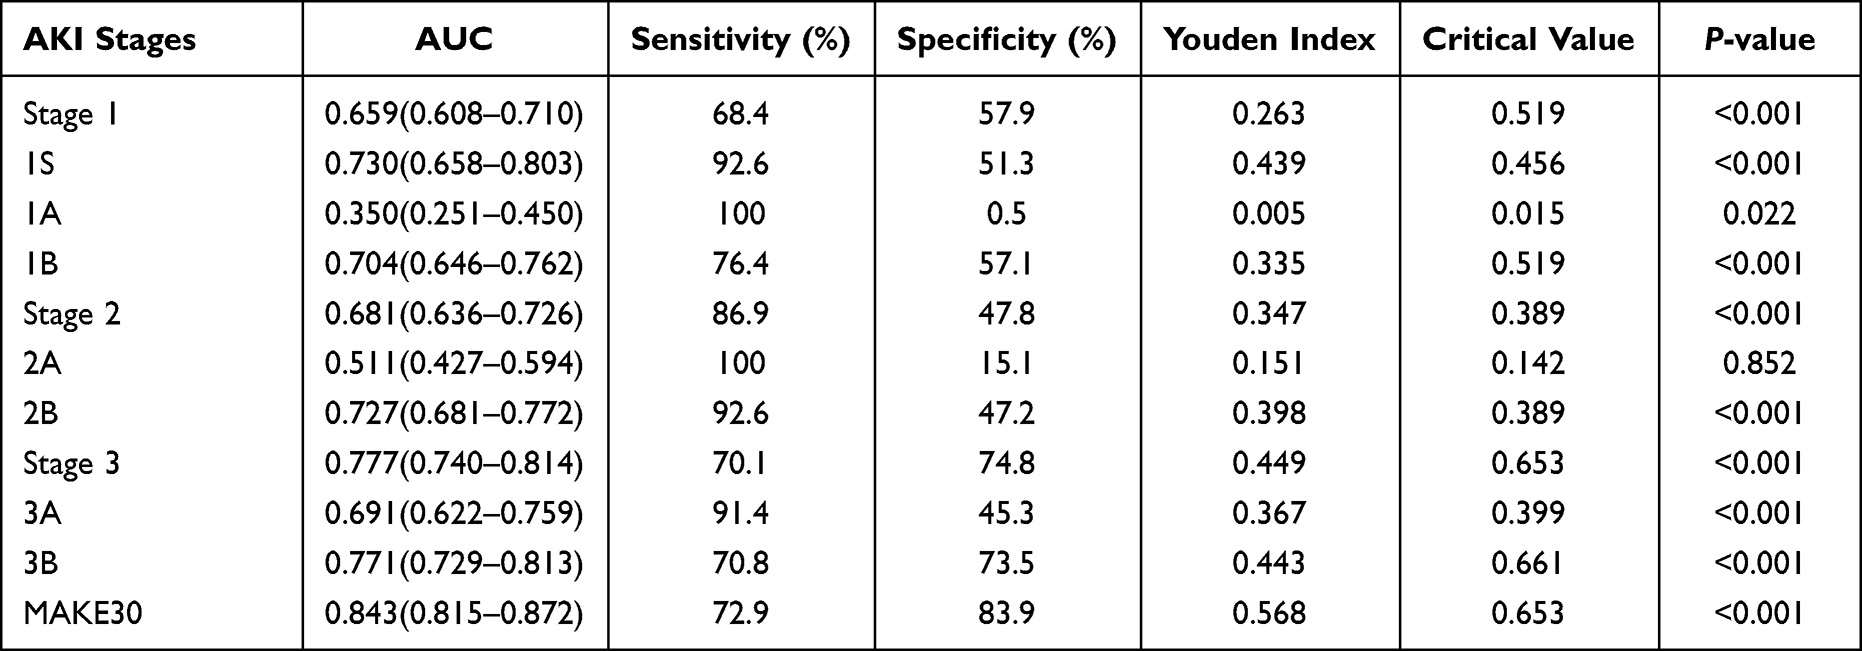 |
Table 5 ROC Curve Analyses of Prediction Model 3 for Different S-AKI Stages and MAKE 30 in the Training Cohort |
 |
Figure 3 The ROC curve of the predictive model 3 for different S-AKI stages and MAKE 30 in the training cohort. (A) The ROC curve for S-AKI stages (B) The ROC curve for MAKE30. Abbreviation: MAKE30, Major adverse kidney events within 30 days. |
Discussion
In the present study, the incidence of S-AKI in sepsis patients of training cohort reached as high as 49.7%, similar to previously published studies (30–70%).5,9,17,18 Moreover, 258 (32.78%) patients experienced the MAKE30 composite outcome, making the incidence of MAKE30 higher than that in adult patients with acute pancreatitis (16%).11 S-AKI is an independent risk factor of mortality from sepsis, with up to 50–60% case fatality.19,20 Thus, we constructed a prediction model with high predictive value through PCT, PTA, and PTA, and most important was that the model had high specificity and was simple and easy to be used for diagnosing S-AKI.
The classical theories suggest that renal hypotension and associated ischemia, as well as the insufficient oxygen supply, are the main pathological mechanisms of developed AKI.5 Additionally, our study showed that low MAP and cardiovascular disease were independent predictors for S-AKI, indicating renal tissue ischemia and hypoxia. However, some studies found that animals with S-AKI actually had higher renal blood flow (RBF) than controls, and hemodynamic instability has not been demonstrated to represent an essential pathogenetic factor for S-AKI, highlighting the limitations of our understanding of the relation between RBF and renal function.5,21 Instead, an increasing number of findings have demonstrated that S-AKI resulted from a cross-talk between inflammatory cascade activation and deranged coagulation pathways, leading to endothelial cell dysfunction, microvascular damage, and extensive microthrombi.21 Further analysis discovered that WBC, PLT, PCT, PTA, and TT were all independent predictors for S-AKI in sepsis patients, and that the model constructed with PCT, PLT, and PTA exhibited a more robust predictive value.
Identifying potential biomarkers of the clinical routine reaction of inflammation dysregulation to predict S-AKI has major clinical significance. PCT is a precursor of calcitonin with 116 amino acids and a molecular weight of 13 kD. It has been widely used as a biomarker for diagnosing bacterial infection and as a promising guideline for antibiotics therapy in sepsis patients.22,23 Although PCT has been demonstrated to be an excellent predictor of AKI development and recovery in a variety of clinical settings, its validity as a predictor of developed S-AKI is still debated.23,24 In this study, we observed that PCT was identified as an independent predictive factor for S-AKI. More potential explanations of elevated PCT levels in S-AKI have been revealed: (1) S-AKI was caused by elevated blood levels of proinflammatory cytokines and chemokines during the infection and inflammation states;5 (2) PCT can mediate direct cytotoxicity on mesangial cells by increasing the synthesis of proinflammatory cytokines and causes mesangial cell apoptosis.25 (3) Increased PCT concentrations were associated with a decrease in glomerular filtration rate, even in the early stages of AKI prior to a significant increase in serum creatinine.24 (4) PCT was a monocyte chemoattractant at the inflammation site, which contributed to the inflammation-mediated cell injury.26 Thus, it was expected that a high level of PCT would reflect the development of S-AKI in sepsis patients, and it was also negatively correlated with the prognosis of S-AKI.9
During sepsis, inflammatory processes can damage the vascular endothelium, activating platelets and resulting in coagulation dysfunction.21 Then, activated platelet aggregation results in the release of cytokines and chemokines from platelet granules, aggravating inflammatory responses and hyperactivating the coagulation system, both of which played a significant role in the subsequent formation of micro-thrombi contributing to kidney injury.27 Ischemic renal injury was aggravated further by the subsequent formation of fibrin and its deposit in the glomerular capillaries. Thus, excessive platelet and coagulation factor consumption exacerbated hyperfibrinolysis, resulting in prolonged APTT, PT, and TT. In this study, compared with the non-AKI group, TT, APTT, PT, and INR were significantly increased in the S-AKI group, while PLT and PTA were significantly decreased.
In addition, we demonstrated that PLT was an independent predictor of S-AKI in sepsis patients. Platelets, which not only played a significant role in the regulation of hemostasis but also interacted with other immune cells to modulate the immune and inflammatory response, plays a crucial part in the progression of S-AKI.28–30 During AKI, platelets could disturb renal haemodynamic processes, resulting in sustained hypoxaemic renal tissue injury.30 Moreover, the degree of the platelet count reduction was found to be substantially associated to the severity of kidney injury and 28-day all-cause mortality.31 Previous studies have demonstrated that platelets were activated in the septic mouse, which ultimately revealed that they played a critical role in S-AKI by inducing renal cell apoptosis.32,33
However, no study has focused on the role of other coagulative biomarkers in predicting S-AKI development in patients with sepsis. In hospitalized patients, prolonged APTT may be confused by many factors, such as vitamin K deficiency and transient lupus inhibitors.16 In this study, we observed that PTA, and TT were identified as independent predictors for S-AKI. However, TT suffers interference from heparin contamination. Moreover, there are no studies reported on the predictive value of TT for S-AKI in sepsis patients, which needs further research. Variability in thromboplastin reagents may lead to large interlaboratory differences in PT results. Therefore, PTA or INR may provide a common international scale of PT reporting as a supplement and may better predict the risks of S-AKI.34,35 In addition, the platelet count, PT ratio and total SOFA had a high predictive value for 28-day mortality in patients with sepsis and coagulopathy complications.36 Our studies indicated that PTA had a better predictive value. Furthermore, thrombocytopenia and decreased PTA were associated with organ dysfunction and were related to worse outcomes in septic patients.36,37
In the S-AKI state, the interactions between inflammatory response and coagulation dysfunction were intimate and complicated. For instance, inflammation could cause coagulation dysfunction, and coagulation dysfunction, in turn, could be deleterious for the management of inflammation. Moreover, current researches suggested critical role of platelets in both inflammation and coagulation.28,29 In this situation, a single predictor (inflammation or coagulation) is unlikely to provide a robust risk prediction for S-AKI in sepsis patients. Chen et al reported that both PCT and PCT/Alb were independent predictors of poor prognosis in patients with S-AKI, with PCT/Alb demonstrating a more robust risk assessment value.9 Besides, neutrophil-to-lymphocyte (NLR) and platelet-to-lymphocyte (PLR) represent a widely useful and cheap tool for diagnosing sepsis and predicting the 90-day mortality of sepsis patients.38 Therefore, a prediction model constructed with inflammation and coagulation indicators may have a perfect predictive value in diagnosing S-AKI in sepsis patient.
As a functional marker of AKI, Cr is a small molecule generated in muscle. Thus, it is adversely impacted by a number of factors, such as age, gender, race, muscle mass, nutritional status, total parenteral nutrition, infection, protein intake, catabolic states, and volume status.39 As part of the cystatin family of protease inhibitors, serum cystatin C can pass freely through the glomerular filtration and then be completely reabsorbed and degraded by the renal tubules.40 Moreover, increasing studies have indicated that cystatin C was a potential predictor for the early diagnosis of S-AKI or was an alternate to the gold standard “creatinine” due to its considerable stability.41,42 However, no research has been conducted to determine whether the combination of inflammation and coagulation indicators can be used to predict patients with S-AKI. In our present study, we discovered that model 3 (constructed with PCT, PLT, and PTA) (AUC = 0.855) exhibited more predictive value than either Cr (AUC = 0.807) or cystatin C (AUC = 0.765) in sepsis patients of the training cohort. Moreover, the easily available model 3 had the best predictive power for predicting S-AKI in stage 3, especially in stage 3B. Finally, we also discovered that model 3 (AUC = 0.843) had perfect predictive power for predicting MAKE30 in sepsis patients.
Limitations
Furthermore, we noted that this study had some limitations. (1) This was a seven-year retrospective study. During this period, the sepsis management decision-making process evolved dramatically, which is a confusing factor affecting S-AKI development. In early empiric antimicrobial therapy during sepsis, a great deal of progress has been made in the fields of pharmacokinetics and pharmacodynamics, drug dosing, therapeutic drug monitoring, and antimicrobial resistance.43 (2) The study cohort was made up of a variety of sepsis patients from a tertiary comprehensive hospital, therefore there was a possibility that selection bias influenced the results. (3) Our study lacked verification of external validity, the adaptive scope of the model in this study needed to be further verified. Thus, further multi-center prospective studies would be needed to verify the results. Meantime, dynamic indicators change and follow-up data had better be analyzed in future studies.
Conclusions
In conclusion, our study indicated that cardiovascular disease, WBC, MAP, PLT, PCT, PTA, and TT acquired within 24 hours after admission were significant predictors of S-AKI in sepsis patients. Moreover, the model 3 (constructed with PLT, PCT, and PTA) might have a robust predictive value, which is of great importance for clinicians to make personalized management for S-AKI in sepsis patients.
Data Sharing Statement
The datasets generated and analyzed in this study will be available by the corresponding author upon reasonable request.
Ethics Statement
This study was conducted following the Declaration of Helsinki and was approved by the Ethical Committee of the First Affiliated Hospital of Xi’an Jiaotong University. All patient data were analyzed in anonymity. Patient consent was waived by the ethics committee, as no individual data were published, nor was any intervention performed on patients.
Acknowledgments
We appreciate the nurses and physicians who assisted with the study. We thank the Biobank of First Affiliated Hospital of Xi’an Jiaotong University for providing clinical data.
Author Contributions
All authors significantly contributed to the reported work related to the conception, study design, execution, acquisition of data, analysis and interpretation; took part in drafting, revising, or critically reviewing the article; gave final approval of the manuscript; have agreed on the journal to which the article has been submitted; and agree to be accountable for all aspects of the work.
Funding
This study was supported by the National Nature Science Foundation of China (No. 82072145);the Natural Science Foundation of Shaanxi Province (2020JM-373); the First Affiliated Hospital of Xi’an Jiaotong University (Establishment of a Model for Early Prediction, Diagnosis and Monitoring of Sepsis: A Cross Regional Multicenter Cohort Study; No. XJTU1AF-CRF-2020-003).
Disclosure
The authors declare no conflicts of interest in this work.
References
1. Singer M, Deutschman CS, Seymour CW, et al. The third international consensus definitions for sepsis and septic shock (sepsis-3). JAMA. 2016;315(8):801–810. doi:10.1001/jama.2016.0287
2. Minasyan H. Sepsis: mechanisms of bacterial injury to the patient. Scand J Trauma Resusc Emerg Med. 2019;27(1):19. doi:10.1186/s13049-019-0596-4
3. Yue S, Li S, Huang X, et al. Construction and validation of a risk prediction model for acute kidney injury in patients suffering from septic shock. Dis Markers. 2022;2022:9367873. doi:10.1155/2022/9367873
4. He S, Gao Q, Wu X, et al. NAD + ameliorates endotoxin-induced acute kidney injury in a sirtuin1–dependent manner via GSK-3β/Nrf2 signalling pathway. J Cell Mol Med. 2022;26(7):1979–1993. doi:10.1111/jcmm.17222
5. Poston JT, Koyner JL. Sepsis associated acute kidney injury. BMJ. 2019;364:k4891. doi:10.1136/bmj.k4891
6. Suzuki C, Tanida I, Oliva Trejo JA, et al. Autophagy deficiency in renal proximal tubular cells leads to an increase in cellular injury and apoptosis under normal fed conditions. Int J Mol Sci. 2019;21(1):155. doi:10.3390/ijms21010155
7. Wang JJ, Chi NH, Huang TM, et al. Urinary biomarkers predict advanced acute kidney injury after cardiovascular surgery. Crit Care. 2018;22(1):108. doi:10.1186/s13054-018-2035-8
8. Xie Y, Huang P, Zhang J, et al. Biomarkers for the diagnosis of sepsis-associated acute kidney injury: systematic review and meta-analysis. Ann Palliat Med. 2021;10(4):4159–4173. doi:10.21037/apm-20-1855
9. Chen L, Wu X, Qin H, et al. The PCT to albumin ratio predicts mortality in patients with acute kidney injury caused by abdominal infection-evoked sepsis. Front Nutr. 2021;8:584461. doi:10.3389/fnut.2021.584461
10. Pan L, Mo M, Huang A, et al. Coagulation parameters may predict clinical outcomes in patients with septic acute kidney injury. Clin Nephrol. 2021;96(5):253–262. doi:10.5414/CN110459
11. Zhang X, Ye B, Mao W, et al. Major adverse kidney events within 30 days in patients with acute pancreatitis: a tertiary-center cohort study. HPB. 2022;24(2):169–175. doi:10.1016/j.hpb.2021.05.012
12. Stevens PE, Levin A. Evaluation and management of chronic kidney disease: synopsis of the kidney disease: improving global outcomes 2012 clinical practice guideline. Ann Intern Med. 2013;158(11):825–830. doi:10.7326/0003-4819-158-11-201306040-00007
13. Ostermann M, Zarbock A, Goldstein S, et al. Recommendations on acute kidney injury biomarkers from the acute disease quality initiative consensus conference: a consensus statement. JAMA Netw Open. 2020;3(10):e2019209. doi:10.1001/jamanetworkopen.2020.19209
14. Hanley JA, McNeil BJ. The meaning and use of the area under a receiver operating characteristic (ROC) curve. Radiology. 1982;143(1):29–36. doi:10.1148/radiology.143.1.7063747
15. Amukele TK, Baird GS, Chandler WL. Reducing the use of coagulation test panels. Blood Coagul Fibrinolysis. 2011;22(8):688–695. doi:10.1097/MBC.0b013e32834b8246
16. Yuan S, Ferrell C, Chandler WL. Comparing the prothrombin time INR versus the APTT to evaluate the coagulopathy of acute trauma. Thromb Res. 2007;120(1):29–37. doi:10.1016/j.thromres.2006.07.002
17. Prowle JR, Bellomo R. Sepsis-associated acute kidney injury: macrohemodynamic and microhemodynamic alterations in the renal circulation. Semin Nephrol. 2015;35(1):64–74. doi:10.1016/j.semnephrol.2015.01.007
18. Zhi DY, Lin J, Zhuang HZ, et al. Acute kidney injury in critically ill patients with sepsis: clinical characteristics and outcomes. J Invest Surg. 2019;32(8):689–696. doi:10.1080/08941939.2018.1453891
19. Barbar SD, Clere-Jehl R, Bourredjem A, et al. Timing of renal-replacement therapy in patients with acute kidney injury and sepsis. N Engl J Med. 2018;379(15):1431–1442. doi:10.1056/NEJMoa1803213
20. Wang K, Xie S, Xiao K, et al. Biomarkers of sepsis-induced acute kidney injury. Biomed Res Int. 2018;2018:6937947. doi:10.1155/2018/6937947
21. Fani F, Regolisti G, Delsante M, et al. Recent advances in the pathogenetic mechanisms of sepsis-associated acute kidney injury. J Nephrol. 2018;31(3):351–359. doi:10.1007/s40620-017-0452-4
22. Wirz Y, Meier MA, Bouadma L, et al. Effect of procalcitonin-guided antibiotic treatment on clinical outcomes in intensive care unit patients with infection and sepsis patients: a patient-level meta-analysis of randomized trials. Crit Care. 2018;22(1):191. doi:10.1186/s13054-018-2125-7
23. Fu G, Zhan HC, Li HL, et al. Association between procalcitonin and acute kidney injury in patients with bacterial septic shock. Blood Purif. 2021;50(6):790–799. doi:10.1159/000512351
24. Kan WC, Huang YT, Wu VC, et al. Predictive ability of procalcitonin for acute kidney injury: a narrative review focusing on the interference of infection. Int J Mol Sci. 2021;22(13):6903. doi:10.3390/ijms22136903
25. Jeeha R, Skinner DL, De Vasconcellos K, et al. Serum procalcitonin levels predict acute kidney injury in critically ill patients. Nephrology. 2018;23(12):1090–1095. doi:10.1111/nep.13174
26. Wiedermann FJ, Kaneider N, Egger P, et al. Migration of human monocytes in response to procalcitonin. Crit Care Med. 2002;30(5):1112–1117. doi:10.1097/00003246-200205000-00025
27. Engelmann B, Massberg S. Thrombosis as an intravascular effector of innate immunity. Nat Rev Immunol. 2013;13(1):34–45. doi:10.1038/nri3345
28. Nicolai L, Massberg S. Platelets as key players in inflammation and infection. Curr Opin Hematol. 2020;27(1):34–40. doi:10.1097/MOH.0000000000000551
29. Joffre J, Hellman J, Ince C, et al. Endothelial responses in sepsis. Am J Respir Crit Care Med. 2020;202(3):361–370. doi:10.1164/rccm.201910-1911TR
30. Jansen MPB, Florquin S, Roelofs J. The role of platelets in acute kidney injury. Nat Rev Nephrol. 2018;14(7):457–471. doi:10.1038/s41581-018-0015-5
31. Wu M, Luan -Y-Y, Lu J-F, et al. Platelet count as a new biomarker for acute kidney injury induced by hemorrhagic shock. Platelets. 2019;31(1):94–102. doi:10.1080/09537104.2019.1581921
32. Li X, Li Y, Shen K, et al. The protective effect of ticagrelor on renal function in a mouse model of sepsis-induced acute kidney injury. Platelets. 2019;30(2):199–205. doi:10.1080/09537104.2017.1392499
33. Lv D, Zhang Y, Wang C, et al. Platelets derived transthyretin participate in the development of sepsis associated acute kidney injury by inducing oxidative stress and apoptosis of renal tubular epithelial cells. Shock. 2022;57(5):722–731. doi:10.1097/SHK.0000000000001908
34. Li S, Liu Z, Wu H. The product value of serum albumin and prothrombin time activity could be a useful biomarker for severity prediction in AP: an ordinal retrospective study. Pancreatology. 2019;19(2):230–236. doi:10.1016/j.pan.2019.02.001
35. Luo HC, You CY, Lu SW, et al. Characteristics of coagulation alteration in patients with COVID-19. Ann Hematol. 2021;100(1):45–52. doi:10.1007/s00277-020-04305-x
36. Iba T, Nisio MD, Levy JH, et al. New criteria for sepsis-induced coagulopathy (SIC) following the revised sepsis definition: a retrospective analysis of a nationwide survey. BMJ Open. 2017;7(9):e017046. doi:10.1136/bmjopen-2017-017046
37. Thiery-Antier N, Binquet C, Vinault S, et al. Is thrombocytopenia an early prognostic marker in septic shock? Crit Care Med. 2016;44(4):764–772. doi:10.1097/CCM.0000000000001520
38. Spoto S, Lupoi DM, Valeriani E, et al. Diagnostic accuracy and prognostic value of neutrophil-to-lymphocyte and platelet-to-lymphocyte ratios in septic patients outside the intensive care unit. Medicina. 2021;57(8). doi:10.3390/medicina57080811
39. Griffin BR, Faubel S, Edelstein CL. Biomarkers of drug-induced kidney toxicity. Ther Drug Monit. 2019;41(2):213–226. doi:10.1097/FTD.0000000000000589
40. Bellos I, Fitrou G, Daskalakis G, et al. Serum cystatin-c as predictive factor of preeclampsia: a meta-analysis of 27 observational studies. Pregnancy Hypertens. 2019;16:97–104. doi:10.1016/j.preghy.2019.03.006
41. Bian Z, Zhu R, Chen S. The predict value of serum/urocystatin C on acute kidney injury in elderly patients with sepsis. Exp Gerontol. 2021;155:111576. doi:10.1016/j.exger.2021.111576
42. Al-Amodi HS, Abdelsattar S, Kasemy ZA, et al. Potential Value of TNF-alpha (−376 G/A) Polymorphism and Cystatin C (CysC) in the Diagnosis of Sepsis Associated Acute Kidney Injury (S-AK I) and Prediction of Mortality in Critically Ill patients. Front Mol Biosci. 2021;8:751299. doi:10.3389/fmolb.2021.751299
43. Póvoa P, Moniz P, Pereira JG, et al. Optimizing antimicrobial drug dosing in critically ill patients. Microorganisms. 2021;9(7):1401. doi:10.3390/microorganisms9071401
 © 2022 The Author(s). This work is published and licensed by Dove Medical Press Limited. The
full terms of this license are available at https://www.dovepress.com/terms
and incorporate the Creative Commons Attribution
- Non Commercial (unported, 3.0) License.
By accessing the work you hereby accept the Terms. Non-commercial uses of the work are permitted
without any further permission from Dove Medical Press Limited, provided the work is properly
attributed. For permission for commercial use of this work, please see paragraphs 4.2 and 5 of our Terms.
© 2022 The Author(s). This work is published and licensed by Dove Medical Press Limited. The
full terms of this license are available at https://www.dovepress.com/terms
and incorporate the Creative Commons Attribution
- Non Commercial (unported, 3.0) License.
By accessing the work you hereby accept the Terms. Non-commercial uses of the work are permitted
without any further permission from Dove Medical Press Limited, provided the work is properly
attributed. For permission for commercial use of this work, please see paragraphs 4.2 and 5 of our Terms.
Recommended articles
Electroacupuncture at ST36 (Zusanli) Prevents T-Cell Lymphopenia and Improves Survival in Septic Mice
Lv ZY, Shi YL, Bassi GS, Chen YJ, Yin LM, Wang Y, Ulloa L, Yang YQ, Xu YD
Journal of Inflammation Research 2022, 15:2819-2833
Published Date: 3 May 2022
The Sphingosine Kinase 2 Inhibitor Opaganib Protects Against Acute Kidney Injury in Mice
Maines LW, Green CL, Keller SN, Fitzpatrick LR, Smith CD
International Journal of Nephrology and Renovascular Disease 2022, 15:323-334
Published Date: 17 November 2022
Albumin Level is Associated with Short-Term and Long-Term Outcomes in Sepsis Patients Admitted in the ICU: A Large Public Database Retrospective Research
Cao Y, Su Y, Guo C, He L, Ding N
Clinical Epidemiology 2023, 15:263-273
Published Date: 3 March 2023
Pretreatment with Eupatilin Attenuates Inflammation and Coagulation in Sepsis by Suppressing JAK2/STAT3 Signaling Pathway
Lu Y, Li D, Huang Y, Sun Y, Zhou H, Ye F, Yang H, Xu T, Quan S, Pan J
Journal of Inflammation Research 2023, 16:1027-1042
Published Date: 10 March 2023
Long-Term Effects of Severe Burns on the Kidneys: Research Advances and Potential Therapeutic Approaches
Yang G, Tan L, Yao H, Xiong Z, Wu J, Huang X
Journal of Inflammation Research 2023, 16:1905-1921
Published Date: 1 May 2023