Back to Journals » Clinical Interventions in Aging » Volume 21
A Novel Nomogram for Predicting Osteoporotic Vertebral Compression Fractures with Hounsfield Unit and Vertebral Bone Quality: A Retrospective Cohort Study
Authors Zhuang C, Yang X ![]() , Wang H, Wang Z, Bao F, Yan Z, Lin H
, Wang H, Wang Z, Bao F, Yan Z, Lin H
Received 4 February 2026
Accepted for publication 1 May 2026
Published 18 June 2026 Volume 2026:21 600367
DOI https://doi.org/10.2147/CIA.S600367
Checked for plagiarism Yes
Review by Single anonymous peer review
Peer reviewer comments 3
Editor who approved publication: Dr Zhi-Ying Wu
Chenyang Zhuang,1– 3,* Xiaolong Yang,2,3,* Houlei Wang,1,3,* Zixiang Wang,2 Fangqi Bao,2 Zuoqin Yan,1 Hong Lin1
1Department of Orthopaedics, Shanghai Geriatrics Medical Centre, Shanghai, People’s Republic of China; 2Department of Orthopaedics, Zhongshan Hospital, Fudan University, Shanghai, People’s Republic of China; 3Institute of Osteoarticular Diseases, Fudan University, Shanghai, People’s Republic of China
*These authors contributed equally to this work
Correspondence: Hong Lin, Department of Orthopaedics, Shanghai Geriatrics Medical Centre, No. 2560 Chunshen Road, Shanghai, 201104, People’s Republic of China, Email [email protected] Zuoqin Yan, Department of Orthopaedics, Shanghai Geriatrics Medical Centre, No. 2560 Chunshen Road, Shanghai, 201104, People’s Republic of China, Email [email protected]
Purpose: Osteoporotic vertebral compression fractures (OVCFs) cause significant morbidity in aging populations. Hounsfield unit (HU) from CT and the vertebral bone quality (VBQ) from MRI show promise in assessing bone quality and fracture risk. This study aims to directly compare the predictive efficacy of HU and VBQ for OVCFs and develop a nomogram model integrating HU and VBQ.
Patients and Methods: A retrospective study was conducted involving 385 patients (127 with OVCFs, 258 controls) who were hospitalized at our hospitals between September, 2020 and September, 2024. HU and VBQ were derived from picture archiving and communication system (PACS). Other variables included demographic, clinical, and radiological data. Statistical analyses included t-tests, chi-square tests, multivariable logistic regression, the least absolute shrinkage and selection operator method (LASSO) regression, and receiver operating characteristic (ROC) curve analysis. Then, a nomogram model was established. The calibration, discrimination and clinical practicability of the nomogram model were also evaluated.
Results: The OVCF group had significantly higher VBQ and lower HU compared to controls. ROC analysis showed higher diagnostic accuracy for HU than VBQ.A nomogram model for predicting the risk of OVCF occurrence in patients has been developed based on three independent predictors, namely BMI, HU and VBQ. The AUC was 0.84 in the training set and 0.87 in the test set. The model has good practicability for clinics according to the decision curve analysis (DCA) and clinical impact curve (CIC).
Conclusion: Both HU and VBQ are effective predictors of OVCFs. The nomogram model showed good internal discrimination and calibration in our study. These findings suggest potential utility for opportunistic screening of OVCF risk in patients undergoing routine spinal CT and MRI. However, external validation in prospective and multi-center cohorts is needed before clinical implementation.
Keywords: osteoporotic vertebral compression fractures, Hounsfield unit, CT, vertebral bone quality, MRI, nomogram
Introduction
Osteoporotic vertebral compression fractures (OVCFs) represent a major public health concern, particularly among aging populations, leading to significant morbidity, disability, and healthcare costs.1 Early identification of individuals at low bone mass state or high risk for OVCF is critical for initiating timely preventive interventions. While dual-energy X-ray absorptiometry (DXA) remains the gold standard for diagnosing osteoporosis through bone mineral density (BMD) measurements, its limitations in diagnosing patients with degenerative vertebral diseases—such as vertebral hyperplasia, small joint sclerosis, scoliosis, osteophytes, and pannus formation—have driven the exploration of alternative imaging-based measurements.2 Among these, the Hounsfield unit (HU), derived from routine computed tomography (CT) scans, has emerged as a promising tool for assessing vertebral bone density. As confirmed by many studies including ours,3 HU has advantages of avoiding regions with obvious degeneration and choosing the trabecular bone which is more correlated with BMD and fracture risk.4,5 However, its reliance on CT, which involves ionizing radiation and is not always routinely performed in at-risk populations, limits its broader applicability.
In recent years, the vertebral bone quality (VBQ), a novel magnetic resonance imaging (MRI)-based metric, has gained attention for its potential to evaluate bone quality without radiation exposure.6 The VBQ utilizes the signal intensity of lumbar vertebrae on non-contrast T1-weighted MRI sequences, reflecting marrow composition and trabecular integrity. Early studies suggest that VBQ may indicate fatty marrow infiltration and decreased bone mass with elevated scores.6–8 Unlike HU, VBQ capitalizes on the widespread use of MRI in diagnosing spinal diseases, offering a radiation-free alternative for fracture risk stratification.
Despite growing interest in both HU and VBQ, direct comparisons of their diagnostic performance in assessing bone mass and predicting OVCFs remain scarce. For example, one study by Guangyue Yang found that HU had a stronger correlation with DXA‑derived BMD,9 whereas another study by Xianming Huang suggested that VBQ was more sensitive to early marrow changes in patients with mild osteoporosis.10 However, these studies were limited by small sample sizes, heterogeneous populations, or lack of fracture outcomes. Furthermore, no prior study has directly compared the predictive performance of HU and VBQ specifically for OVCFs in a cohort of patients with degenerative spinal diseases. Furthermore, the pathophysiological insights offered by these scores—whether reflecting bone density (HU) or marrow composition (VBQ)—may differentially influence fracture risk prediction.11 Therefore, this study aims to retrospectively compare the predictive efficacy of two proposed methods, VBQ and HU, for OVCFs by evaluating their correlation with fracture incidence, diagnostic accuracy, and interdependence with traditional risk factors. Besides, we aim to develop a fragility fracture prediction model that integrates HU and VBQ with excellent predictive performance. Sex-related differences play a substantial role in the epidemiology and pathophysiology of OVCFs. Osteoporosis is more prevalent in women, particularly after menopause, due to estrogen withdrawal that accelerates bone resorption and trabecular bone loss. Consequently, women have a significantly higher lifetime risk of vertebral fractures compared with men. These sex disparities also influence the performance of imaging-based bone quality metrics, as marrow composition and trabecular architecture may differ between sexes. Therefore, it is important to consider sex as a potential confounder and effect modifier when evaluating predictors such as HU and VBQ. In the present study, we included sex as a candidate variable in the LASSO and multivariate regression analyses to account for its potential influence.
Methods
Study Design and Patient Population
A retrospective study was performed from medical records of patients with OVCFs or degenerative spinal diseases who visited our hospitals between September, 2020 and September, 2024. Patients were included if they had available DXA data, lumbar CT and MRI images. The interval between these image materials was within two weeks. The exclusion criteria were as follows: (1) Having a history of spinal surgery; (2) Spinal tumors; (3) Spinal infection; (4) A history of spinal fractures or the presence of multi-stage fractures; (5) Lack of available imaging data or insufficient image quality or inability to measure HU and VBQ.
Clinical Variables
Demographic data included age, gender, body mass index (BMI), and medical comorbidities including hypertension, diabetes and coronary heart disease. Radiological data included L1-L4 bone mineral density, HU based on three-dimensional lumbar CT images and VBQ based on T1-weighted MRI images. The outcome for the enrolled patients was whether OVCF occurred. Two experienced radiologists independently reviewed the CT and MRI images of each patient to identify the presence of OVCFs. All OVCF patients included in this study were those with T10-L4 vertebral fractures. Patients were classified into the OVCF group or the control group based on the presence of a compression fracture on their imaging. A comprehensive flowchart that outlines the selection process, including data analysis, model construction, and the integration of evaluation methods are shown in Figure 1. The study methods were conducted in accordance with the Declaration of Helsinki and were approved by the institutional review board and independent ethics committee of Shanghai Geriatrics Medical Centre (approval No. Y202-088). Informed consent was obtained from all patients prior to study commencement.
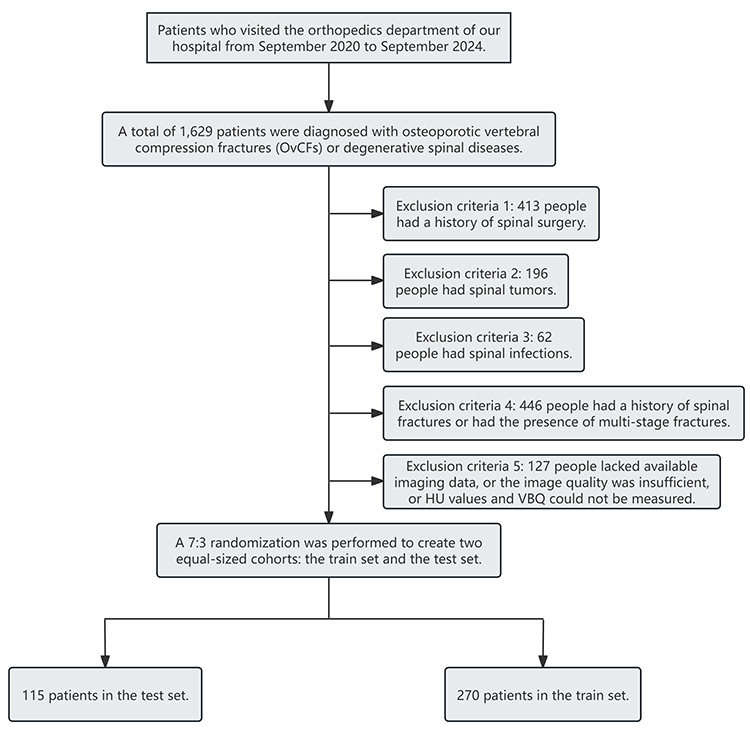 |
Figure 1 Algorithm for cohort selection. |
Bone Mineral Density Assessment
T-scores were directly obtained through a DXA scanner. HU was obtained according to our previous report.3 Briefly, the images of the lumbar spine were reviewed using the picture archiving and communication system (PACS). The upper, middle, and lower axial planes of each vertebral body were selected and placed in an oval region of interest (ROI) including the trabecular bone and excluding the cortical bone, the posterior venous plexus, or bone islands (Figure 2). If a patient had a fracture in L1-L4, the fractured level will be excluded (Figure 3). As previously described,12 VBQ was obtained using an MRI scanner (Magnetic Resonance Imaging System, Aera, 1.5T, Siemens, Germany). In the mid-line sagittal plane of the lumbar vertebrae, the region of interest (ROI) is located in the medullary part of the L1-L4 vertebral bodies and the cerebrospinal fluid (CSF) at the L3 level (Figure 4). The average signal intensity of the L1-L4 vertebrae was calculated and divided by the signal intensity of the CSF of the L3 level to obtain the VBQ of the patient. If the signal intensity of the vertebral body cannot be measured in the median sagittal plane due to abnormalities such as compression fractures, the remaining vertebral bodies were used to calculate the VBQ (Figure 4). Similarly, if the signal intensity of CSF cannot be measured at the L3 level due to reasons such as intervertebral disc protrusion, the VBQ should be calculated using the signal intensity of CSF at the L4 level. These measurements were conducted independently by two clinicians – Chenyang Zhuang and Xiaolong Yang individually.13 The average value was recorded as the final result. Inter‑observer reliability was assessed using the intraclass correlation coefficient (ICC) with a two‑way random effects model for absolute agreement. The ICC for HU was 0.94 (95% CI: 0.89–0.97) and for VBQ was 0.91 (95% CI: 0.85–0.95), indicating excellent reliability (Supplementary Materials).
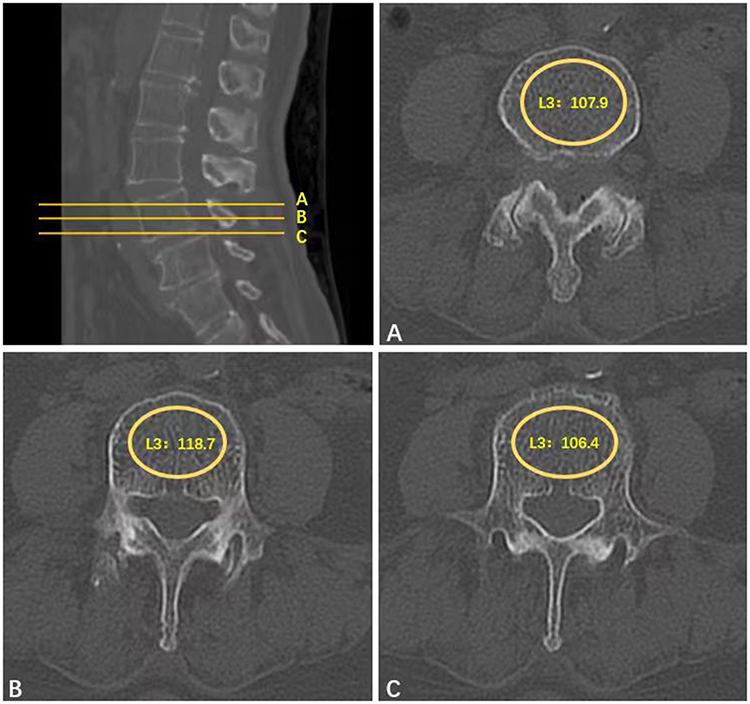 |
Figure 2 Example of HU measurement in the control group: (A) HU in the axial plane of the vertebral body; (B) HU in the axial plane of the vertebral body; (C) HU in the axial plane below the vertebral body. |
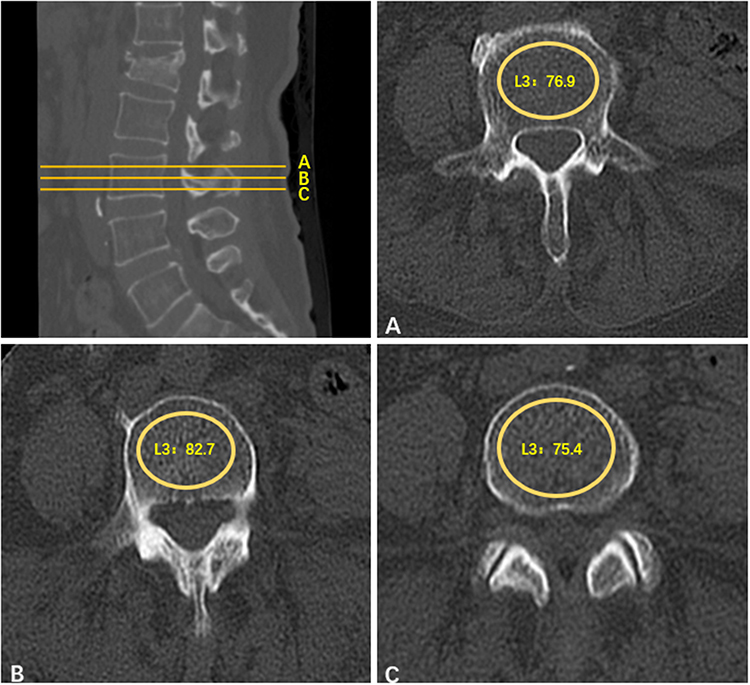 |
Figure 3 Example of HU measurement in the OVCF group: (A) HU in the axial plane of the vertebral body; (B) HU in the axial plane of the vertebral body; (C) HU in the axial plane below the vertebral body. |
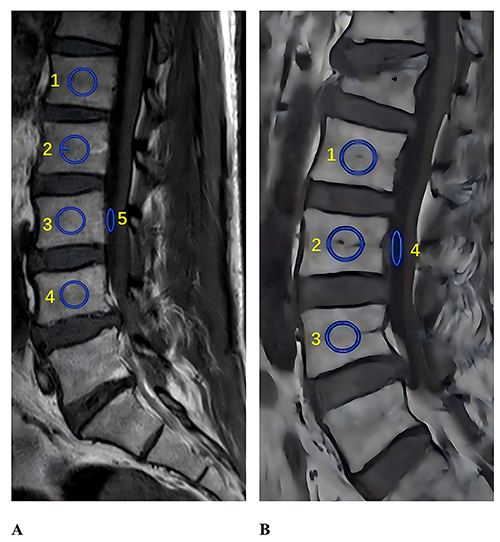 |
Figure 4 Example of VBQ measurement: (A) VBQ measurement in the control group; (B) VBQ measurement in the OVCF group. |
Statistical Analysis
The statistical analysis was conducted using SPSS (version 27.0) and R (version 4.2.2) software. The measurement data were subjected to Shapiro–Wilk test for normality. Data that followed a normal distribution were expressed as mean ± standard deviation, and comparisons between groups were conducted using t-test. Data that followed a skewed distribution were expressed as median (interquartile range), and comparisons between groups were performed using Mann–Whitney U-test. For continuous variables that are compared using t-tests, Levene’s test is used for homogeneity of variance. For variables with non-homogeneous variance, Welch’s t-test is used. Count data were presented as frequency (%), and comparisons between groups were conducted using χ2-test.
Least absolute shrinkage and selection operator method (LASSO) regression was applied in the training set to screen the influencing factors of OVCFs. The variables with statistical significance were included in the multivariate Logistic regression, and the independent influencing factors of OVCFs were further selected.14
The nomogram function in R (version 4.2.2) was used to create a column chart prediction model.15 Internal validation was conducted using the Bootstrap method.16 The receiver operating characteristic (ROC) curve was plotted using the roc function, and the AUC was calculated using the auc function to evaluate the discrimination of the prediction model. The calibration curve was drawn using the calibrate function to assess the calibration degree of the prediction model, and the R packages (Hoslem.test function) was used to perform the Hosmer–Lemeshow goodness-of-fit test.17 The clinical decision curve was plotted using the R packages (decision_curve function) to evaluate the clinical practicability of the prediction model.
Results
Based on the inclusion and exclusion criteria, a total of 385 patients were included in the study for further analysis. Patients were then divided into two groups according to whether they suffered from osteoporotic fractures. The comparison of demographic characteristics between the OVCF group and the control group is shown in Table 1. The average age and the proportion of females in the OVCF group were significantly higher than those in the control group (71.67±5.7 years vs. 61.62±6.8 years, p=0.006; 34/93 (36.55%) vs. 120/138 (86.96%), p=0.007) (Supplementary Table 1). The average BMI and L1-L4 T values of patients also showed significant differences between two groups (23.1±4.1 vs. 24.8±3.1, p=0.005; −2.1±1.0 vs. −0.9±1.1, p=0.008). Of note, the OVCF group exhibited a significantly higher VBQ compared with the control group (3.5±0.8 vs. 2.5±0.6, p<0.001). However, the HU was significantly lower than that of the control group (75.9±22.1 vs. 131.5±26.1, p<0.001). Additionally, no significant differences were observed between the two groups of patients in terms of comorbidities such as hypertension, diabetes and coronary heart disease.
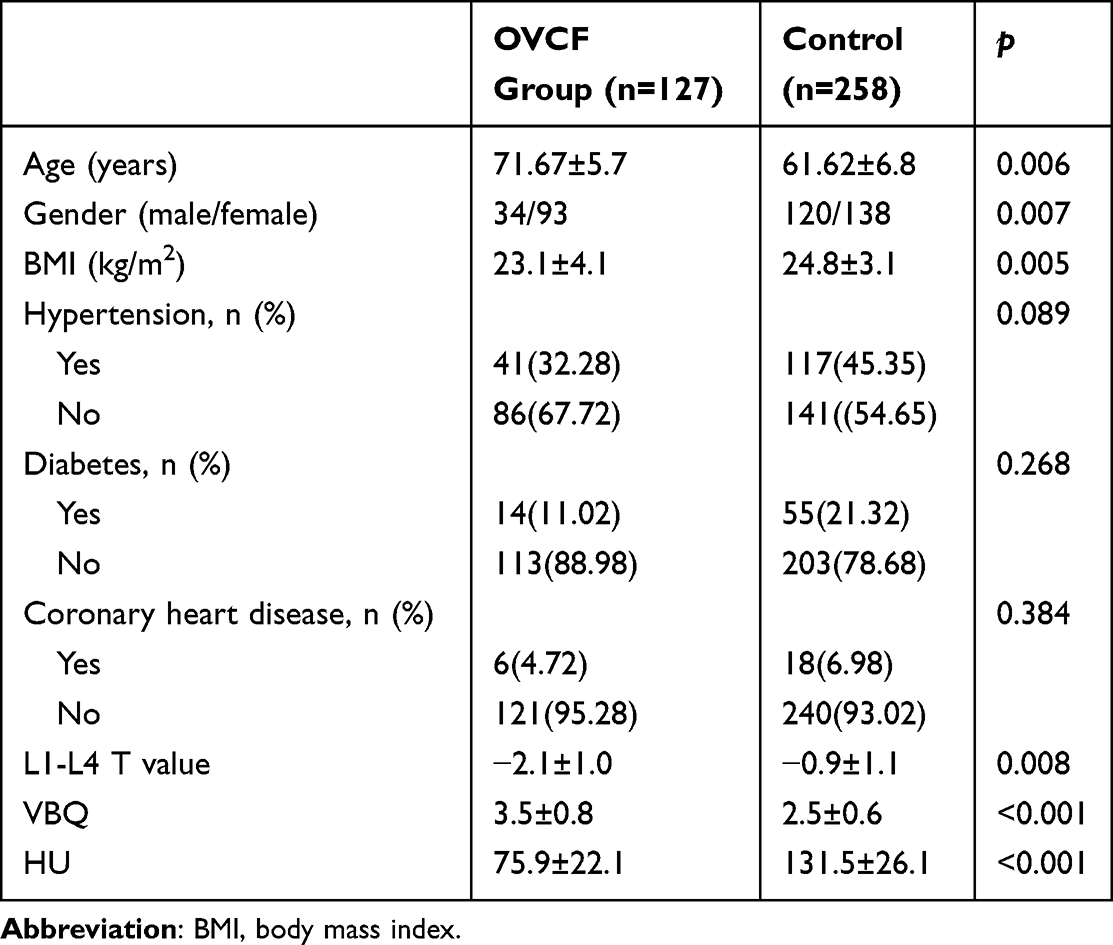 |
Table 1 Patient Characteristics of the OVCFs Group and Control |
As shown in Table 2, multivariable logistic regression was further applied to the study to explore the risk factors. In the adjusted model, VBQ and HU are significantly correlated with the incidence of OVCF, while other covariates showed no significant correlation with OVCF.
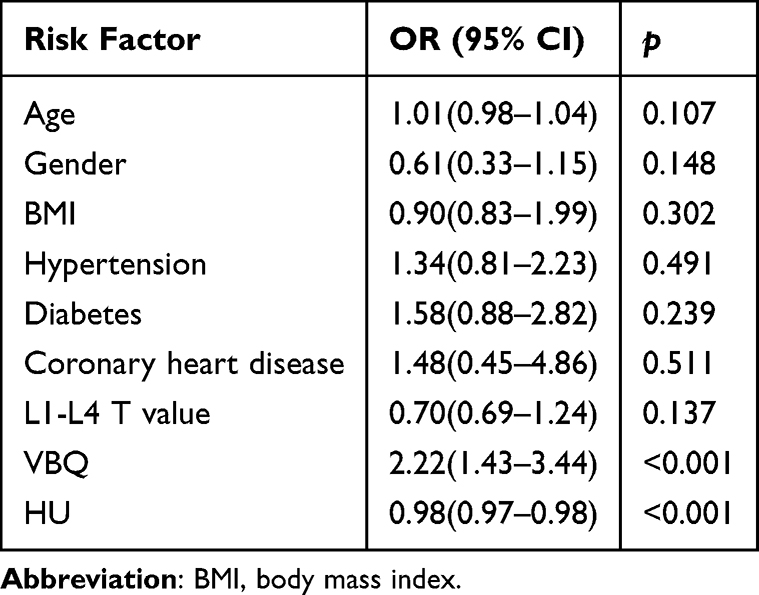 |
Table 2 Analysis of Risk Factors for OVCF |
After confirming the significance of VBQ and HU, we further analyzed the correlation of the two factors. Pearson’s test showed a significant negative correlation between VBQ and HU in both groups (r2=0.1034, p<0.001; r2=0.8035, p<0.001) (Figure 5). To evaluate the diagnostic efficiency, the ROC curve was plotted. The AUC of the HU and VBQ was 0.805 and 0.761, respectively. The cutoff point of HU was 91.4, with a sensitivity of 68.94% and specificity of 78.20%. And VBQ also obtained a relatively high sensitivity (62.88%) and specificity (73.68%) at the cutoff point of 3.06 (Figure 6).
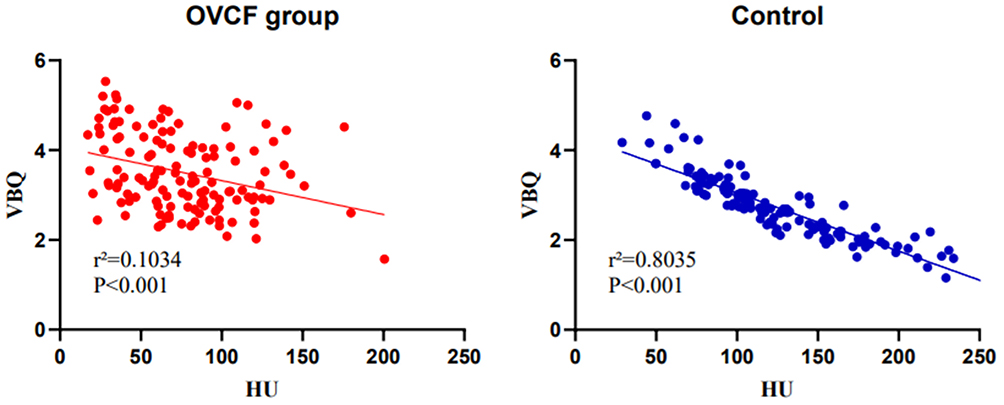 |
Figure 5 Pearson’s test showed a significant negative correlation between VBQ and HU in both groups. |
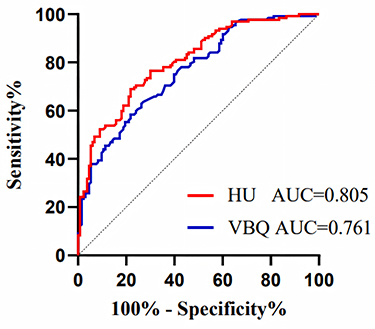 |
Figure 6 The AUC of the HU and VBQ. |
Furthermore, to construct a predictive nomogram model, the data were randomly divided into a training set and a validation set in a 7:3 ratio. The training set consisted of 270 patients, and the validation set consisted of 115 patients. There were no statistically significant differences in gender composition, age composition, BMI, HU, VBQ, and complication status between the two groups (p>0.05) (Table 3). In the training set, patients were divided into the OVCFs group and the control group based on whether they had OVCFs. There were significant differences in age, gender, BMI, HU and VBQ between the two groups, and these differences were consistent with the distribution trend in the overall sample (Table 4).
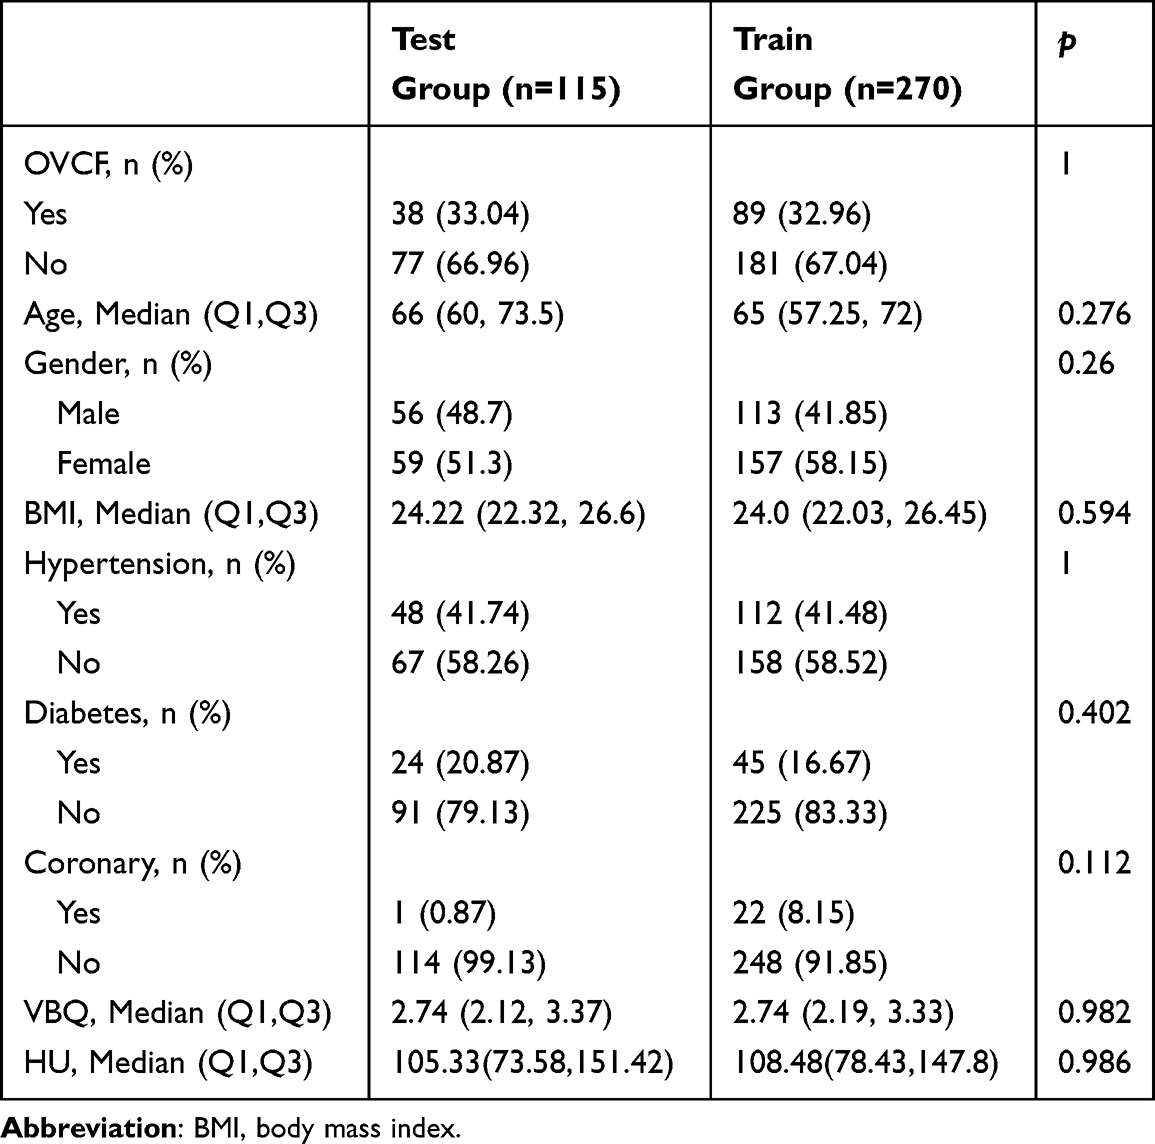 |
Table 3 Patient Characteristics of the Test Group and Train Group |
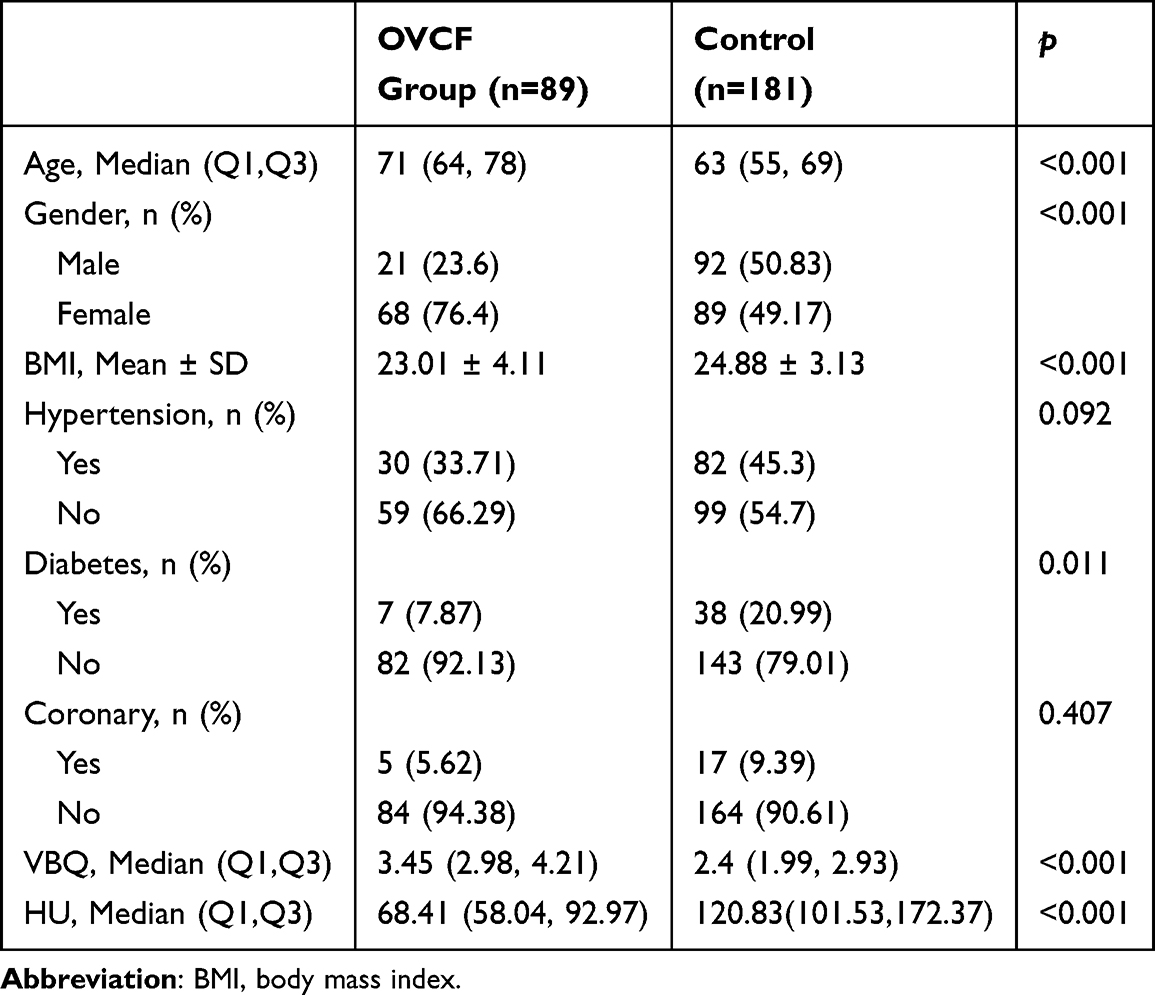 |
Table 4 Patient Characteristics of the OVCFs Group and Control in the Train Group |
LASSO regression was used to reduce the number of independent variables, and tenfold cross validation was used to reduce the feature dimension based on the punishment coefficient λ (0.065). From the 9 included variables, 3 variables with nonzero coefficients were ultimately identified (Figure 7). The following 3 variables were observed to be statistically significant in the analysis: BMI, HU, VBQ, and a nomogram prediction model for OVCFs was established (Figure 8).
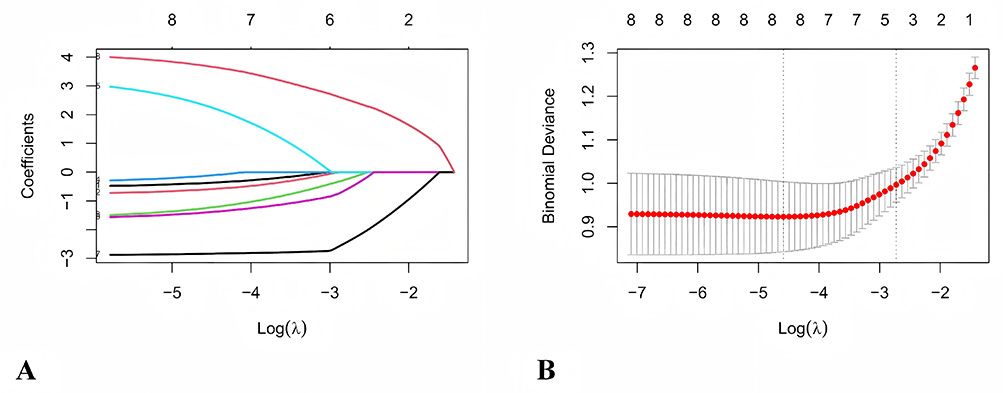 |
Figure 7 LASSO regression. (A) LASSO coefficient profiles of 9 features; (B) Dotted vertical lines were generated in the LASSO model at the ideal values using cross-validation using minimal criteria. |
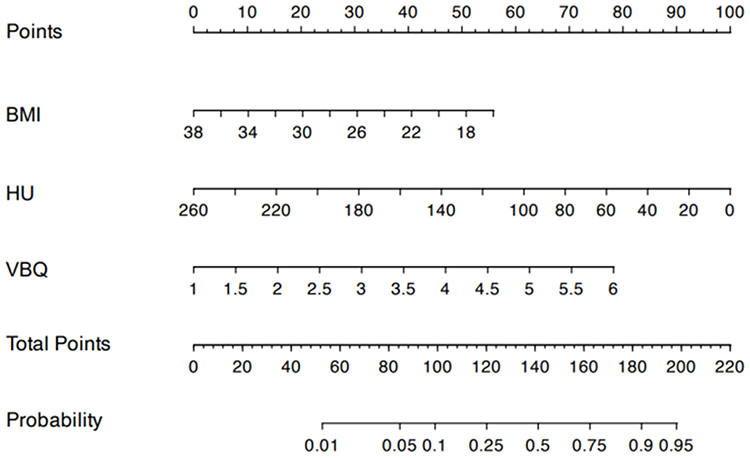 |
Figure 8 OVCFs risk nomogram. |
The model demonstrated excellent discrimination on the training set, with an area under the receiver operating characteristic curve (AUC) of 0.840 (95% CI: 0.793–0.886) (Figure 9A). After internal validation using the Bootstrap method (1000 repetitions), the corrected C-index was 0.827 (95% CI: 0.761–0.893). On the independent validation set, the AUC of the model reached 0.872 (95% CI: 0.809–0.935) (Figure 9B), indicating that the model has robust and excellent discriminative ability without significant overfitting. Based on the ROC curve of the training set, the optimal prediction probability cutoff value determined by the maximum Youden index was 0.283. At this threshold, the sensitivity of the model in the training set was 0.843 (95% CI: 0.753–0.914), the specificity was 0.707 (95% CI: 0.639–0.776), and the accuracy was 0.752 (95% CI: 0.693–0.796). In the validation set, the corresponding sensitivity was 0.842 (95% CI: 0.698–0.946), the specificity was 0.740 (95% CI: 0.634–0.831), and the accuracy was 0.774 (95% CI: 0.678–0.843). These results indicate that the model maintains a high sensitivity while also having an acceptable specificity.
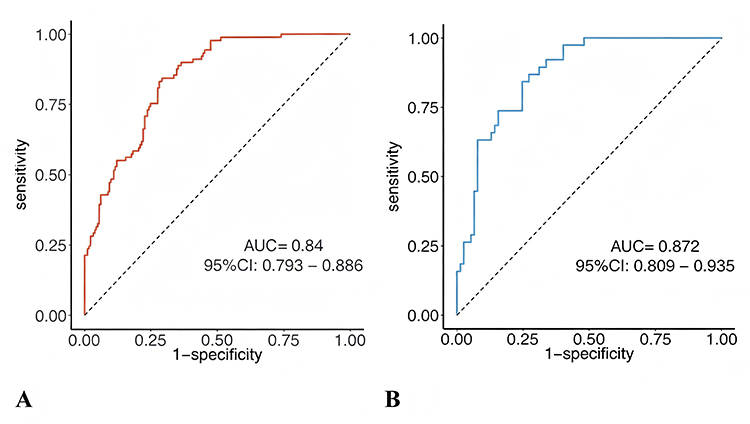 |
Figure 9 The AUC of the training set and the test set: (A) The AUC of the training set (B) The AUC of the test set. |
The Hosmer–Lemeshow goodness-of-fit test result shows that the chi-square value is 10.623 (with a degree of freedom of 8), and the P value is 0.224. This indicates that there is no significant deviation between the predicted probabilities of the model and the actual observed probabilities. The calibration curves (training set and validation set) drawn through the Bootstrap method (B = 1000) both show that the predicted curves are relatively close to the ideal reference line, further confirming that the model has a good calibration ability (Figure 10A and B).
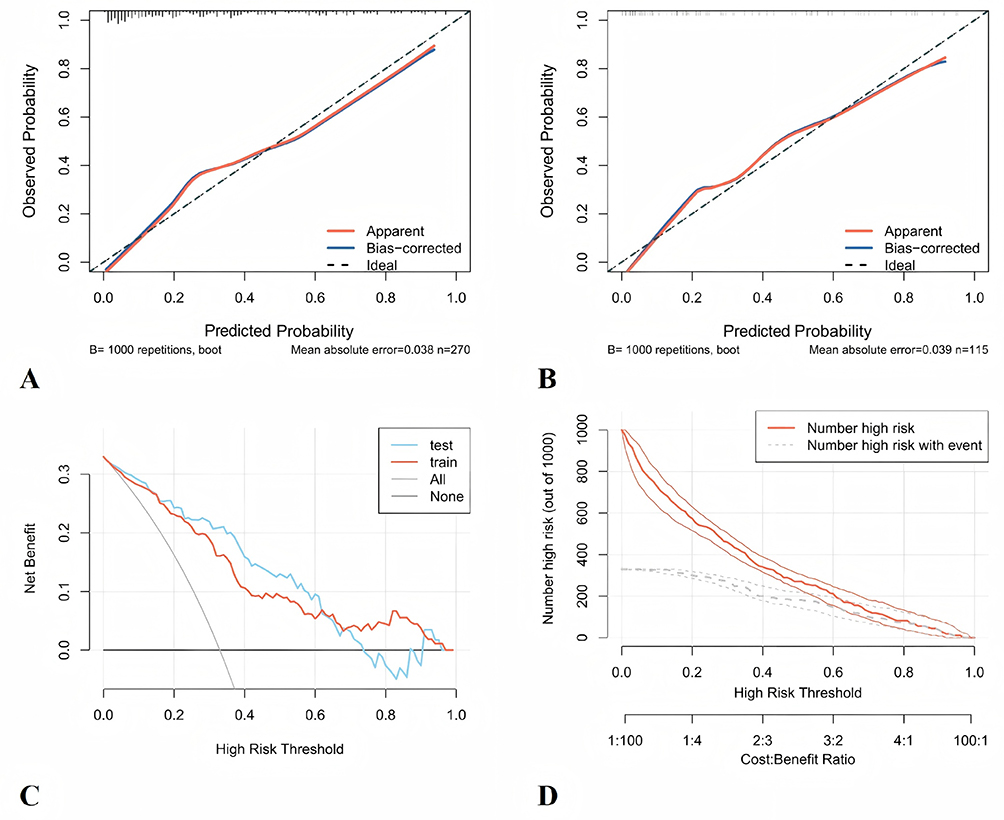 |
Figure 10 The reasonable analysis of the established clinical prediction mode: (A) CIC curve of training set; (B) CIC curve of validation set; (C) DCA curves of validation set and validation set; (D) Clinical impact curves of validation set and validation set. |
The decision curve analysis evaluated the clinical net benefit of the model at different threshold probabilities (Figure 10C and D). The analysis results showed that within a wide range of threshold probabilities approximately from 0.1 to 0.7, applying this predictive model to guide clinical decisions (ie, intervening for patients predicted to be at high risk) resulted in higher net benefit compared to the strategies of “intervening for all patients” or “not intervening for any patients”. The clinical impact curve further indicated that among the population classified as high-risk by the model, there was a higher proportion of actual event occurrences, suggesting that the model can effectively identify the target population that may benefit from intervention and has good clinical application potential.
Discussion
The present study provides the first direct comparative analysis of CT-derived HU and MRI-derived VBQ for predicting OVCFs. Our findings confirm that both imaging methods are significantly associated with fracture risk. Crucially, while both tools demonstrated strong independent predictive value after adjusting for traditional risk factors, CT-based HU measurement exhibited superior diagnostic performance compared with VBQ. Additionally, suffering an incident fragility fracture were not associated with BMI, or common comorbidity like diabetes, hypertension or coronary heart disease. On the other hand, the predictive model established based on BMI, HU and VBQ in this study has excellent discrimination, accuracy and clinical practicability. Our model offers a non-invasive and easily accessible alternative solution, ensuring that the key risks of OVCFs are not overlooked. For clinical settings, there are individuals who may be at high risk. These individuals can be promptly identified and appropriate intervention measures can be taken.
Osteoporosis causes approximately 8.9 million OVCF globally each year, with an average of one fracture occurring every three seconds. The vertebrae are the most common site for OVCF, accounting for over 50% of cases.1,18 A nationwide study in China indicates that approximately 1.27 million new cases of OVCFs occurred in 2015. Projections suggest this number will reach 3 million by 2050.19,20 OVCFs lead to decreased height, spinal kyphosis, scoliosis, and deformities, which may result in back pain, significant decline in cardiac and pulmonary functions, and gastrointestinal dysfunction.21 Prolonged bed rest following fractures accelerates bone loss and leads to higher disability and mortality rates. However, half of OVCF patients show no significant back pain symptoms, resulting in low consultation rates.22 Consequently, implementing screening protocols for individuals at high risk of OVCF is of great significance for reducing fracture-related morbidity and social economic burden.
Osteoporosis diagnosis and fracture risk stratification previously relied on DXA, which is considered to be closely associated with overall fracture risk.23 However, recent evidence has brought doubts about the degree to which DXA is an effective marker of bone quality, particularly in the spine.24 It can be significantly confounded by degenerative changes such as vertebral osteophytes, facet joint sclerosis, scoliosis, and aortic calcification, leading to underestimation of fracture risk in affected individuals. One population-based study found that more than half of women who suffered from OVCF had T-scores in the non-osteoporotic range (T>-2.5).19 Therefore, there is an urgent need for alternative methods using widely available radiological techniques like CT and MRI to improve fracture prediction, especially in populations where DXA may be unreliable.25
Through large-scale data collection and analysis, Pickhardt et al demonstrated that the HU scoring system from CT imaging shows strong correlation with BMD, with high sensitivity and specificity.26 The HU method specifically targets trabecular bone regions with significant osteoporosis, addressing DXA’s limitations when assessing BMD in lumbar degenerative diseases. Crucially, HU can be directly derived from routine pre- or postoperative CT scans through the PACS system, which avoid the extra costs. Numerous studies have confirmed HU in predicting osteoporosis-related complications such as screw subsidence, loosening, and fusion failure in lumbar degenerative disease patients, demonstrating the practical significance of HU in evaluating vertebral bone density.27,28 In recent years, MRI has shown great performance in degenerative orthopaedic diseases, such as osteoarthritis, osteonecrosis, and lumbar stenosis. Notable progress was also made in evaluating osteoporosis.29,30 Ehresman et al first introduced MRI-derived VBQ as a superior predictor of BMD.7 They found a strong relationship between decreased bone strength and fatty infiltration, which was reflected as high T1 signal in MRI.6 VBQ was also confirmed as a superior predictor of fracture risk than the DXA.31
The superior predictive level of HU in our study likely stems from its direct quantification of trabecular bone mineral density within carefully selected regions of interest that avoid degenerative changes. This provides a more anatomically specific assessment of the mechanical strength for resisting compressive forces. In contrast, VBQ reflects marrow composition (fatty infiltration) on T1-weighted MRI, an indirect indicator for bone quality.32,33 While marrow adiposity correlates with osteoporosis, it represents a downstream consequence of bone loss rather than a direct measure of structural integrity. This fundamental difference in biological target—direct bone density versus indirect marrow change—may explain the enhanced level in predicting fragility fracture by HU. However, both CT and MRI offer significant clinical advantages as screening tools, such as avoiding the extra need for dedicated DXA scans, overcoming barriers like access limitations and patient compliance. Importantly, VBQ provides a radiation-free alternative for younger at-risk populations or patients requiring repeated imaging. However, the higher predictive accuracy of HU supports prioritizing its use when available CT studies exist, especially in elderly patients undergoing evaluation for degenerative spinal diseases, where fracture risk assessment is paramount.34
Despite the promising findings of this study, several evidence gaps remain. First, the retrospective design and internal validation only (split‑sample and bootstrap) preclude definitive conclusions about generalizability. Prospective, multi‑center external validation cohorts are urgently needed, particularly those that include diverse ethnic and socioeconomic populations. Second, the marked sex imbalance in our cohort and the lack of formal interaction testing mean that sex‑specific cutoffs or model recalibration may be required. Future studies should enroll balanced sex cohorts or be adequately powered for stratified analyses. Third, while we compared HU and VBQ head‑to‑head, their combined use with clinical risk factors (eg, FRAX without BMD, bone turnover markers) has not been explored. Fourth, the generalizability of our findings to younger patients, those without routine spinal imaging, or those with severe degenerative changes that preclude accurate VBQ measurement remains unknown. Fifth, cost‑effectiveness analyses comparing HU‑ or VBQ‑guided screening versus usual care are lacking. Addressing these gaps will help determine whether this nomogram can be translated into routine clinical practice.
Conclusion
In summary, this is the first study to directly compare the diagnostic performance of MRI-based VBQ and CT-based HU in assessing bone mass and predicting OVCFs. Our results show significant correlations with OVCF for both VBQ and HU. The prediction model we established based on BMI, HU and VBQ demonstrated good discrimination and calibration. These findings support the potential role of opportunistic screening using routine spinal imaging, but external validation is required to confirm generalizability.
Funding
This study was supported by Institutional Fund of Shanghai Geriatrics Medical Centre, YM2024-005 and Institutional Fund of Shanghai Geriatrics Medical Centre, YQ2025-002.
Disclosure
The authors report no conflicts of interest in this work.
References
1. LeBoff MS, Greenspan SL, Insogna KL, et al. The clinician’s guide to prevention and treatment of osteoporosis. Osteoporosis Int. 2022;33(10):2049–14. doi:10.1007/s00198-021-05900-y
2. Kulkarni AG, Thonangi Y, Pathan S, et al. Should Q-CT be the gold standard for detecting spinal osteoporosis? Spine. 2022;47(6):E258–e264. doi:10.1097/brs.0000000000004224
3. Zhuang C, Wang Z, Chen W, Tian B, Li J, Lin H. Osteoporosis and endplate damage correlation using a combined approach of hounsfield unit values and total endplate scores: a retrospective cross-sectional study. Clin Interv Aging. 2021;16:1275–1283. doi:10.2147/cia.S315213
4. Zou D, Li W, Deng C, Du G, Xu N. The use of CT Hounsfield unit values to identify the undiagnosed spinal osteoporosis in patients with lumbar degenerative diseases. Eur Spine J. 2019;28(8):1758–1766. doi:10.1007/s00586-018-5776-9
5. Chen J, Li Y, Zheng H, Li H, Wang H, Ma L. Hounsfield unit for assessing bone mineral density distribution within lumbar vertebrae and its clinical values. Front Endocrinol. 2024;15:1398367. doi:10.3389/fendo.2024.1398367
6. Li W, Zhu H, Hua Z, et al. Vertebral bone quality score as a predictor of pedicle screw loosening following surgery for degenerative lumbar disease. Spine. 2023;48(23):1635–1641. doi:10.1097/brs.0000000000004577
7. Ehresman J, Schilling A, Yang X, et al. Vertebral bone quality score predicts fragility fractures independently of bone mineral density. Spine J. 2021;21(1):20–27. doi:10.1016/j.spinee.2020.05.540
8. Hu F, Li X, Zhao D, Chen C, Liu G, Yang Q. The diagnostic value of MRI-based vertebral bone quality score for osteoporosis or osteopenia in patients undergoing lumbar surgery: a meta-analysis. Osteoporos Int. 2024;35(11):1881–1895. doi:10.1007/s00198-024-07190-6
9. Yang G, Wang H, Wu Z, Shi Y, Zhao Y. Prediction of osteoporosis and osteopenia by routine computed tomography of the lumbar spine in different regions of interest. J Orthop Surg Res. 2022;17(1):454. doi:10.1186/s13018-022-03348-2
10. Huang X, Cai C, Huang S, et al. T2-weighted mri-based vertebral bone quality score is an independent risk factor of osteoporotic vertebral compression fracture: an age- and sex-matched study. Global Spine J. 2026;16(1):162–170. doi:10.1177/21925682251339995
11. Yu C, Zhang Y. Establishment of prognostic nomogram for elderly colorectal cancer patients: a SEER database analysis. BMC Gastroenterol. 2020;20(1):347. doi:10.1186/s12876-020-01464-z
12. Yin H, Lin W, Xie F, et al. MRI-based vertebral bone quality score for osteoporosis screening based on different osteoporotic diagnostic criteria using DXA and QCT. Calcif Tissue Int. 2023;113(4):383–392. doi:10.1007/s00223-023-01115-x
13. Alsoof D, Anderson G, McDonald CL, Basques B, Kuris E, Daniels AH. Diagnosis and management of vertebral compression fracture. Am J Med. 2022;135(7):815–821. doi:10.1016/j.amjmed.2022.02.035
14. Sauerbrei W, Royston P, Binder H. Selection of important variables and determination of functional form for continuous predictors in multivariable model building. Stat Med. 2007;26(30):5512–5528. doi:10.1002/sim.3148
15. Ding L, et al. Answer to the Letter to the Editor of S.T. concerning “Development and internal validation of a clinical-radiological nomogram for osteoporosis screening: a cohort retrospective study. Eur Spine J Dec. 2025;34(12):5848–5849. doi:10.1007/s00586-025-09430-7.
16. Curran-Everett D. Explorations in statistics: the bootstrap. Adv Physiol Educ. 2009;33(4):286–292. doi:10.1152/advan.00062.2009
17. Gortmaker SL, Hosmer DW, Lemeshow S. APPLIED LOGISTIC-REGRESSION - HOSMER,DW, LEMESHOW,S. Book Review. Contemp Sociol-J Rev. 1994;23(1):159. doi:10.2307/2074954
18. Coughlan T, Dockery F. Osteoporosis and fracture risk in older people. editorial material. Clin Med. 2014;14(2):187–191. doi:10.7861/clinmedicine.14-2-187
19. Kadri A, Binkley N, Daffner SD, Anderson PA. Fracture in patients with normal bone mineral density: an evaluation of the American orthopaedic association’s own the bone registry. J Bone Joint Surg Am. 2023;105(2):128–136. doi:10.2106/jbjs.22.00012
20. Si L, Winzenberg TM, Jiang Q, Chen M, Palmer AJ. Projection of osteoporosis-related fractures and costs in China: 2010-2050. Osteoporos Int. 2015;26(7):1929–1937. doi:10.1007/s00198-015-3093-2
21. McCarthy J, Davis A. Diagnosis and management of vertebral compression fractures. Am Family Phys. 2016;94(1):44–50.
22. Link TM. Radiology of osteoporosis. canadian association of radiologists journal-journal de l association canadienne des radiologistes. Can. Assoc. Radiol. J. 2016;67(1):28–40. doi:10.1016/j.carj.2015.02.002
23. Schneider J, Iori G, Ramiandrisoa D, et al. Ex vivo cortical porosity and thickness predictions at the tibia using full-spectrum ultrasonic guided-wave analysis. Arch Osteoporos. 2019;14(1):21. doi:10.1007/s11657-019-0578-1
24. Kim K, Song SH, Kim IJ, Jeon YK. Is dual-energy absorptiometry accurate in the assessment of bone status of patients with chronic kidney disease? Osteoporos Int. 2021;32(9):1859–1868. doi:10.1007/s00198-020-05670-z
25. Ji R, Tu Y, Wang S, Tang R, Hua T, Zhu J. Comparison of the value of VBQ scores for assessing abnormal bone mass based on DXA and QCT.; Early Access. Eur Spine J. 2025. doi:10.1007/s00586-025-09564-8
26. Pickhardt PJ, Nguyen T, Perez AA, et al. Improved CT-based osteoporosis assessment with a fully automated deep learning tool. Radiol Artif Intell. 2022;4(5):e220042. doi:10.1148/ryai.220042
27. Li J, Zhang Z, Xie T, Song Z, Song Y, Zeng J. The preoperative Hounsfield unit value at the position of the future screw insertion is a better predictor of screw loosening than other methods. Eur Radiol. 2023;33(3):1526–1536. doi:10.1007/s00330-022-09157-9
28. Li Q, Li J, Yang H, Yang X, Wang L, Song Y. S1 vertebral bone quality score independently predicts pedicle screw loosening following surgery in patients with adult degenerative scoliosis. Spine J. 2024;24(8):1443–1450. doi:10.1016/j.spinee.2024.04.020
29. Liang X, Liu Q, Xu J, Ding W, Wang H. Hounsfield unit for assessing bone mineral density distribution within cervical vertebrae and its correlation with the intervertebral disc degeneration. Front Endocrinol. 2022;13:920167. doi:10.3389/fendo.2022.920167
30. Soliman MAR, Aguirre AO, Kuo CC, et al. Vertebral bone quality score independently predicts cage subsidence following transforaminal lumbar interbody fusion. Spine J. 2022;22(12):2017–2023. doi:10.1016/j.spinee.2022.08.002
31. Wang S, Yang H, Liao H, et al. MRI-based cervical vbq scores as predictors of cage subsidence in cervical spine surgery: a meta-analysis. Global Spine J. 2025;15(7):3350–3363. doi:10.1177/21925682251327381
32. Li W, Wang F, Chen J, Zhu H, Tian H, Wang L. MRI‑based vertebral bone quality score is a comprehensive index reflecting the quality of bone and paravertebral muscle. Spine J. 2024;24(3):472–478. doi:10.1016/j.spinee.2023.11.007
33. Shen W, Scherzer R, Gantz M, et al. Relationship between MRI-Measured Bone Marrow Adipose Tissue and Hip and Spine Bone Mineral Density in African-American and Caucasian Participants: the CARDIA Study. J Clin Endocrinol Metab. 2012;97(4):1337–1346. doi:10.1210/jc.2011-2605
34. Wu J, Niu L, Yang K, et al. The role and mechanism of RNA-binding proteins in bone metabolism and osteoporosis. Ageing Res Rev. 2024:96102234. doi:10.1016/j.arr.2024.102234.
 © 2026 The Author(s). This work is published and licensed by Dove Medical Press Limited. The
full terms of this license are available at https://www.dovepress.com/terms
and incorporate the Creative Commons Attribution
- Non Commercial (unported, 4.0) License.
By accessing the work you hereby accept the Terms. Non-commercial uses of the work are permitted
without any further permission from Dove Medical Press Limited, provided the work is properly
attributed. For permission for commercial use of this work, please see paragraphs 4.2 and 5 of our Terms.
© 2026 The Author(s). This work is published and licensed by Dove Medical Press Limited. The
full terms of this license are available at https://www.dovepress.com/terms
and incorporate the Creative Commons Attribution
- Non Commercial (unported, 4.0) License.
By accessing the work you hereby accept the Terms. Non-commercial uses of the work are permitted
without any further permission from Dove Medical Press Limited, provided the work is properly
attributed. For permission for commercial use of this work, please see paragraphs 4.2 and 5 of our Terms.
Recommended articles
Early Magnetic Resonance Imaging Measurements and Prediction of Second Trimester Pregnancy Loss: a Nomogram Model Analysis
Liu J, Xu M, Zhou L, Yang L, Li H, Li X
International Journal of Women's Health 2024, 16:819-827
Published Date: 14 May 2024
Advances in Multimodal Imaging Techniques for Evaluating and Predicting the Efficacy of Immunotherapy for NSCLC
Liu J, Xie M, Shen J, Yao J, Lin X, Bao X, Zhang X, Liang Y, Yang Y, Jiang G, Diao X, Han W, Du H, Xue X, Wu J
Cancer Management and Research 2025, 17:1073-1086
Published Date: 7 June 2025
HIV Complicated with Talaromyces Marneffei Multisystem Infection: A Case Report and Literature Review
Zhang G, Wu G, Xu Y, Yang L, Yang W
Infection and Drug Resistance 2025, 18:3561-3568
Published Date: 21 July 2025
Development and Validation of a Radiomics-Based Nomogram for Predicting HER-2 Status in Breast Cancer: A Retrospective Study with Small Validation Cohort
Qiu Q, Chen C, Chen J, Liao C, Tang L
Breast Cancer: Targets and Therapy 2025, 17:1119-1132
Published Date: 2 December 2025
Imaging Evaluation of Bone Tumors in the Cervical Spine: A Comprehensive Review
Sun M, Meng X, Wu M, Wang Z
International Journal of General Medicine 2025, 18:7785-7798
Published Date: 25 December 2025